


1.5 Australia's potential for critical commodities
1.5.1 Assessment of Australia's potential
This section assesses Australia's resource potential for selected critical commodities.
In Table 1.5.1 the key results of this review are summarised in two groups of commodities: those with category one resource potential and those with category two resource potential. These are extracted from Table 1.5.2 which presents a more comprehensive assessment, including those rated with category three resource potential (see below). These tables are the result of a synthesis and analysis of Parts 1 and 2 of this report.
Within each of the category one and category two resource potential categories the commodities are listed in order of criticality.
The assessments of resource potential in Table 1.5.1 are subjective judgements based on:
- Level of criticality;
- Australia's resources and potential for new discoveries;
- Market size; and
- Growth outlook.
It is notable that most of the commodities that have a category one resource potential are also regarded as critical by some countries that have undertaken studies of material criticality. There are several commodities that Australia has category one potential for resources, however they are considered to have category three criticality. One example of such commodities is copper, which has category one resource potential despite its category three criticality score as: (a) the growth outlook for copper is strong; (b) Australia's geology and resource potential are considered very favourable for discoveries of new copper resources; (c) and the market size is very large.
Seven of the commodities rated as having category two resource potential also are considered critical by the world's major economies (antimony, indium, lithium, molybdenum, niobium, tantalum, tungsten). Also in the category two group are six other commodities with a category two criticality ranking (beryllium, bismuth, graphite, manganese, tin, titanium). Only one other commodity, thorium, was assigned category two potential despite its category three criticality rating. This assessment reflects the possible growth in markets if emerging and new technologies using thorium (nuclear power generation) have greater rather than lesser uptakes in the medium to long term. The assessment also takes into account Australia's considerable resources of thorium. Helium was also assigned category two resource potential although it was not considered in criticality rankings.
Among the 12 commodities rated as having category three resource potential (Table 1.5.2), two are considered to be of category one criticality by countries (gallium and vanadium) and three of medium criticality (germanium, selenium and strontium). Many of these commodities are of small market size and/or have limited growth outlooks, and/or have low known and potential endowment in Australia. These judgements are a snapshot of the present situation which will change over time.
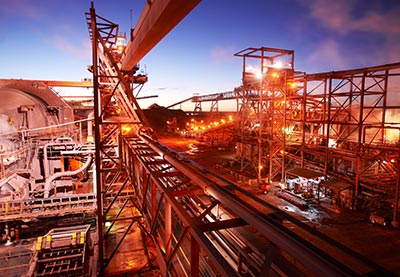
Olympic Dam is a multi-mineral ore body that is mined for uranium,
copper, gold and silver, but also contains significant amounts of
rare-earth elements and other critical commodities.
Image: BHP Billiton.
1.5.2 A mineral systems perspective on Australia's resource potential
An important conclusion of this report is that most of the commodities assessed as having category one and category two resource potential are geologically associated with three mineral system groups. In addition, a fourth opportunity exists for critical commodities that can be produced as by-products from existing operations.
Mafic-ultramafic igneous-related mineral systems (Ni, PGE, Cr, Cu, Co, Ti)
The nickel and platinum-group element industries globally are very large yet known resources and production are concentrated in relatively few countries, for example platinum-group element industries in South Africa and Russia. Economic platinum-group element deposits are extremely rare and highly valuable. Australia's resource potential is high for discovery of major mafic-ultramafic intrusion-hosted nickel, platinum-group element and chromium deposits. Areas of known and inferred resource potential for these commodities are shown in Figure 1.5.1. A key issue is that many of the prospective terranes for sulfide nickel and platinum-group element deposits are concealed by layers of cover rocks that may be metres to hundreds of metres thick.
Australia also has major known resources of lateritic nickel, some of which are currently being exploited. There are potential opportunities to develop technologies for more efficient extraction of nickel and other associated elements such as scandium from these lateritic deposits.
Intermediate to felsic igneous-related mineral systems (Cu, REE, Be, Li, Mo, Nb, Ta, Sn, W, Bi, Sb)
Commodities associated with intermediate to felsic igneous-related mineral systems are varied. In detail the composition of magmas with which these systems are associated are also varied and include intermediate, evolved felsic and alkaline magmas. Unlike the mafic-ultramafic igneous-related systems, resources and production of commodities associated with intermediate to felsic magmatism are much more widespread, with Australia possessing significant resources of many of the associated critical commodities. At present, Australia is a major producer of copper and lithium, and in the past it has been a major producer of antimony, tantalum, tin and tungsten. Regions of current and historic production (some of which have significant identified resources) must be considered regions with significant potential for additional discovery (Figure 1.5.2).
In addition to commodities with historic or current production, Australia is emerging as a potential producer for commodities such as rare-earth elements and molybdenum.
Surface-related mineral systems, particularly heavy mineral sand deposits (Zr, Ti, REE, Th)
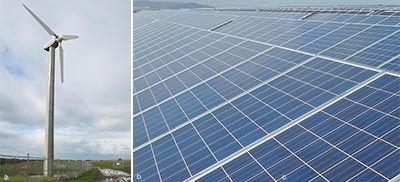
Use of critical commodities:
(a) Magnets in wind generators. (b) Photovoltaics.
Images: (a) Wongm, Wikimedia Commons. (b) Christoffer Riemer, Wikimedia Commons.
The third mineral system offering category one resource potential for Australia is heavy mineral sands. Government supported work in South Australia was crucial in the identification and discovery of a major new mineral sands province, resulting in several currently operating mines. These mineral systems not only host major industrial commodities such as titanium and zirconium but also contain significant resources of rare-earth elements and thorium. Figure 1.5.3 shows the distribution of major historic and existing mineral sand operations in Australia.
Light rare-earth elements in mineral sand deposits represent very large resources that may be exploited in the future. The rare-earth elements and thorium in these deposits are mainly locked up in monazite and are not currently extracted. Monazite is returned to the pit in a dispersed form, as required by mining regulations. Extraction of rare-earth elements may be more viable where low-thorium monazite is present in mineral sand deposits.
Recovery of by-products from existing ores and concentrates
Several commodities are produced as co-products or by-products of major metal mining; platinum-group element recovery from some nickel ores is an example of co-production. Among those commodities assessed as having medium resource potential, antimony, bismuth and indium are by-products of base metal and/or gold mining, and lower resource potential by-products include cadmium, gallium, germanium, mercury, rhenium, selenium, tellurium and vanadium. The Olympic Dam deposit is one of the largest rare-earth element resources in the world, but at present rare-earth elements are not recovered. Where recovery is currently uneconomic, there may be improvements in mineral processing for ores containing significant concentrations of co-product and by-product elements.
For many Australian mines the minor-element compositions of ores and concentrates are not well known or not published. However, preliminary calculations in this study for several of Australia's base and precious metal ore bodies indicate the potential for substantial resources of elements such as antimony, indium cadmium, gallium, germanium, mercury, rhenium, selenium, and tellurium (see Part 2). In addition, it is known that gallium, germanium and rare-earth elements are enriched in some coal deposits (Dai et al., 2006; Qi et al., 2007; Seredin, 2005). Finally, phosphate deposits are a potentially important source of rare-earth elements as well as other metals such as uranium; Australia is relatively well endowed with phosphate deposits such as those in the Georgina Basin (Northern Territory and Queensland), but the minor-metal compositions of these deposits are not well understood.
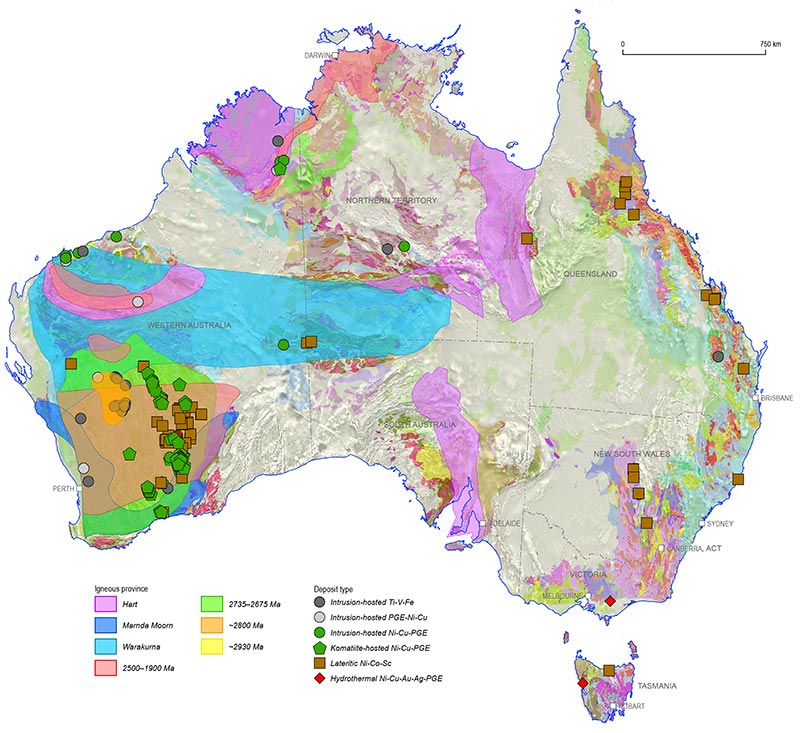
Figure 1.5.1: Distribution of mineral deposits associated with mafic-ultramafic magmatism (locations from OZMIN) and the exents of mineralised igneous provinces (from Hoatson et al., 2008, 2009; Claoue-Long et al., 2009). The background is transparent surface geology draped over reduced-to-pole aeromagnetic data. The legend for the surface geology is presented in Figure 1.5.5.
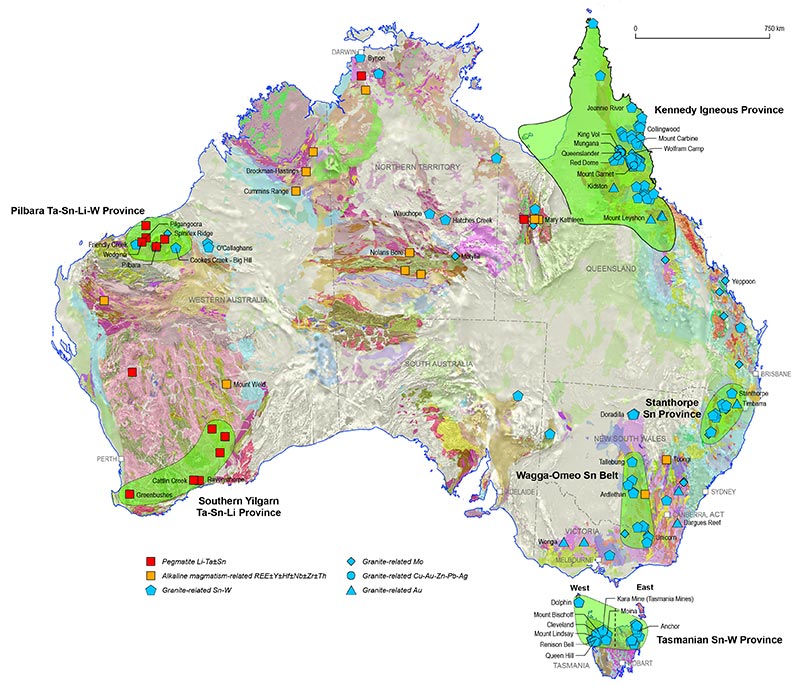
Figure 1.5.2: Distribution of mineral deposits associated with granitic and alkaline magmatism (locations from OZMIN). The location of the Kennedy Igneous Province is from Champion and Bultitude (2013) and D Champion (pers. comm., 2013). The background is transparent surface geology draped over reduced-to-pole aeromagnetic data. The legend for the surface geology is presented in Figure 1.5.5.
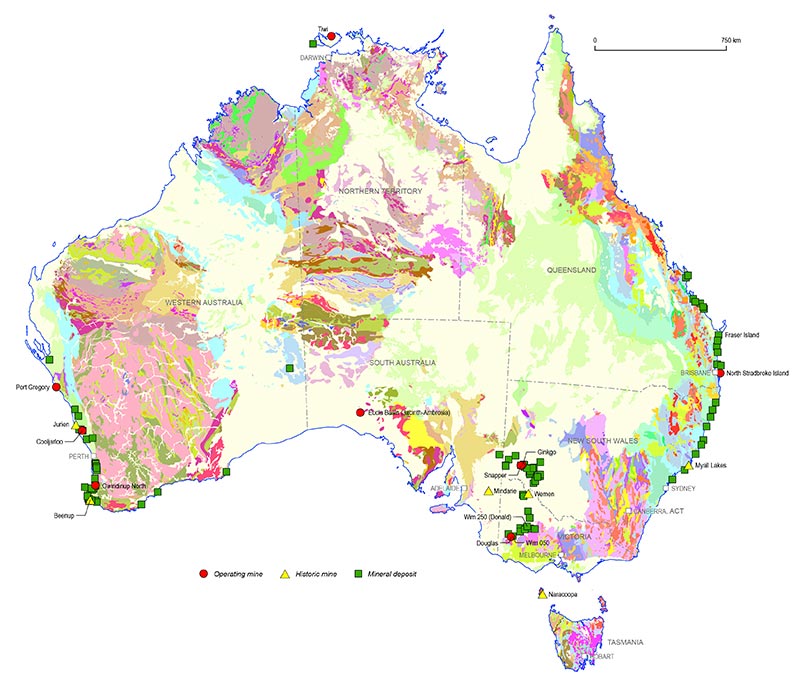
Figure 1.5.3: Distribution of mineral deposits associated with heavy mineral sand placer deposits (from OZMIN). The background is surface geology. The legend for the surface geology is presented in Figure 1.5.5.
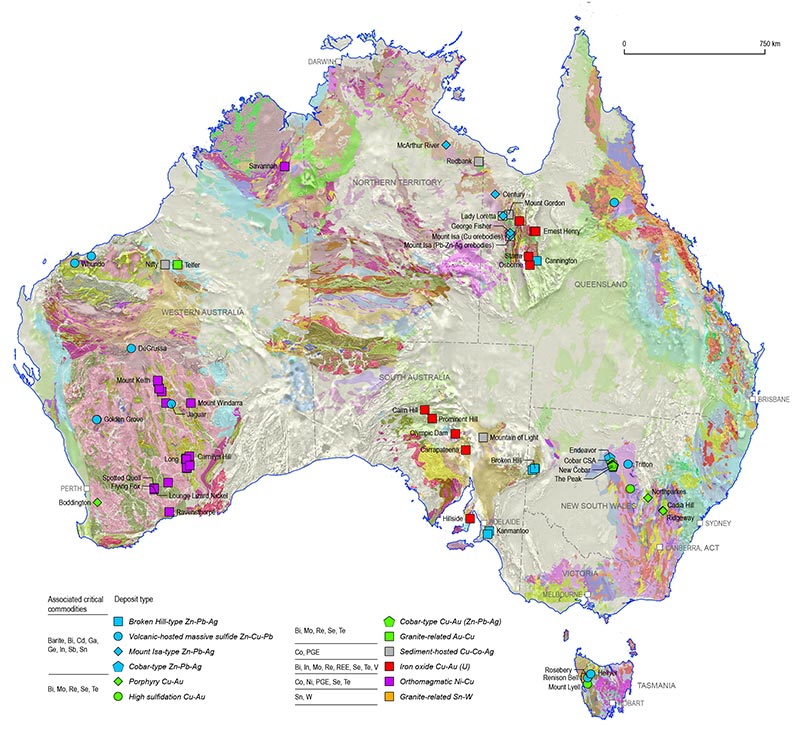
Figure 1.5.4: Distribution of operating of recently closed mines illustrating the existing and potential recovery of critical commodities as by-products. The background is transparent surface geology draped over reduced-to-pole aeromagnetic data. The legend for the surface geology is presented in Figure 1.5.5.
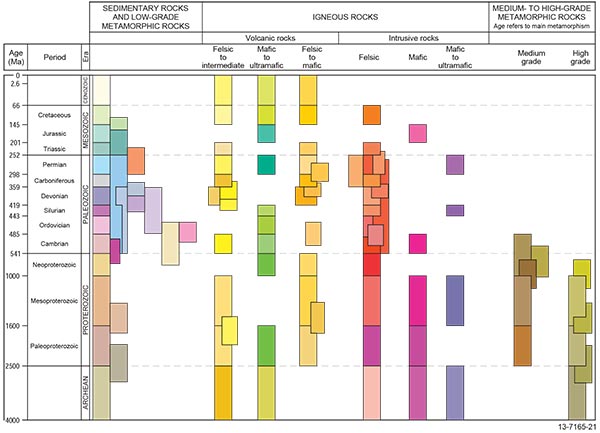
Figure 1.5.5: Legend for surface geology drape in Figures 1.5.1 to 1.5.4 and Figure 2.2.1.
| Category one resource potential | Criticality |
|---|---|
| Rare-earth elements (including scandium and yttrium) | 29 |
| Platinum-group elements | 22 |
| Cobalt | 21 |
| Nickel | 13 |
| Chromium | 12 |
| Zirconium | 6 |
| Copper | 2 |
| Category two resource potential | Criticality |
| Indium | 26 |
| Tungsten | 23 |
| Niobium | 20 |
| Molybdenum | 15 |
| Antimony | 14 |
| Lithium | 14 |
| Tantalum | 13 |
| Manganese | 12 |
| Titanium | 10 |
| Graphite | 8 |
| Tin | 8 |
| Beryllium | 7 |
| Bismuth | 6 |
| Thorium | 3 |
| Helium | N/A |
| Commodity (Ordered by potential) | 1Criticality ranking (score) | 2Australian production (2011) as % of global | 3Economic resources World; Australia | 4Scale of market; import value for largest importer ($US) | Context |
|---|---|---|---|---|---|
| |||||
| Rare-earth elements, including scandium and yttrium | Category one (29) | 0% | 114 000 kt5 REO & Y2O3; 2070 kt REO & Y2O3 | REE: Although Japan is the largest importer, value of imports is not available; the value of imports into the US was $615 million in 2012. Sc: very small Y: very small | China dominates production and resources of REE; current and medium term demand for light REE probably will be met with new global production but a shortfall in heavy REE production is projected; Australia has major REE resources in mineral sand, iron-oxide copper-gold and igneous-related mineral systems, and has emerging new heavy REE provinces. Australia has Sc resources in lateritic Ni deposits but the Sc market is very small currently. |
| Platinum-group elements (including Pt and Pd) | Category one (22) | 0.1% | 66 000 t6; 4.7 t | $5960m, large | Supply of PGE is dominated by South Africa and Russia; Australia has category one potential for discoveries of new resources due to favourable geology; widespread demand expected to grow due to uses in vehicles, clean energy technologies and desalination. |
| Cobalt | Category one (21) | 4% | 7334 kt; 1204 kt | $850m, large | Democratic Republic of Congo dominates Co production and resources but China is leading importer; Co is a key element in emerging technologies on a foundation of industrial uses, hence good growth outlook; Australia has substantial resources and category one potential for basin-related Co (with Cu). |
| Nickel | Category one (13) | 12% | 76 000 kt; 20 400 kt | $4905m, large | Nickel is a major industrial commodity with China dominating demand; Australia has the world's largest resources (mostly in lateritic Ni deposits), but the metallurgy of these deposits has limited the development; Australia has category one potential for discovery of major new Ni sulfide deposits. |
| Chromium | Category one (12) | 0.3% | >480 000 kt; n.a. | $2663m, very large | Chromium is a key industrial commodity with production and resources dominated by South Africa and Kazakhstan but demand from mainly China; Australia has significant potential for large Cr resources although known deposits and production are small. |
| Zirconium | Category two (6) | 53% | 62 320 kt ZrO2; 31 320 kt ZrO2 | $1174m, large | Australia holds 50% of world resources of Zr (as zircon, ZrSiO4) within heavy mineral sand deposits); major new provinces have been discovered in Australia; its industrial use in ceramics and demand from China should ensure a strong medium-long term position for Australian supply. |
| Copper | Category three (2) | 6% | 690 000 kt; 86 700 kt | $15 339m, very large | Copper is a foundation industrial commodity, but has category three criticality; due to size of industry and expected growth in demand it is crucial for Australia's mining and exploration industries and with significant potential for new discoveries (basin-related; IOCG; etc). |
| Indium | Category one (26) | n.a. | n.a. | $420m for Ga, Hf, In, Nb, Re; small for In | Indium is a by-product of Zn production; Australia has world's largest Zn resources (mainly basin-related mineral systems) hence potential to recover In; however, the market is currently small with global production of just 0.64 kt. |
| Tungsten | Category one (23) | 0.02% | 3300 kt; 376 kt | $159m, medium | Resources and production of W are dominated by China; Australia's resources and potential are considerable, in mainly granite-related mineral systems; demand mainly from China, the US and the EU. Australia has several deposits at feasibility study stage. |
| Niobium | Category one (20) | n.a. | 3000 kt; 205 kt | $420m for Ga, Hf, In, Nb, Re; small or medium for Nb | Brazil dominates production and resources of Nb; Australia holds significant resources in pegmatites and also in some REE deposits. |
| Molybdenum | Category one (15) | 0% | 10 100 kt; 167 kt | $815m, medium | Molybdenum is a major industrial commodity; production and resources dominated by China, the US and Chile where most Mo occurs in porphyry Cu and Mo deposits; molybdenite is the main host for the commodity Re; Australia is less endowed with Mo-rich porphyry deposits but has high grade Mo-Re resources in Queensland. |
| Antimony | Category one (14) | 1% | 1800 kt; 106 kt | $206m, medium | China dominates production, resources and demand; Hillgrove Sb-Au (NSW) has largest identified Sb resource outside China; significant Sb resources are also contained in known Zn-Pb-Ag deposits in Australia but recovery may not be economic at present. Several Australian deposits are expected to come online. |
| Lithium | Category one (14) | 34% | 13 000 kt; 1006 kt | $108m, medium | Australia is currently the second largest Li producer after Chile but delineation of major resources globally may meet Li demand in short-medium term; development of emerging energy technologies may change the demand outlook; extraction of Australia's hard-rock Li resources is relatively high-cost; Australia's salt lakes and saline groundwaters have unknown potential. |
| Tantalum | Category one (13) | 10% | 131 kt; 62 kt | Not available | Australia holds second largest resources (in pegmatites) but produces only 10% of world's Ta; Ta is an important element in high-tech industries although market is small. |
| Manganese | Category one (12) | 17% | 1646 Mt7 Mn ore; 197 Mt Mn ore | $199m; medium | Major industrial commodity; Australia is a major producer (mainly from one deposit) with substantial resources; potential for undiscovered deposits unclear. |
| Titanium | Category two (10) | 15% ilmenite 62% rutile | Ilmenite: 1235 Mt; 189 Mt Rutile: 51.3 Mt; 27.2 Mt | $549m, medium | Ilmenite and rutile are major industrial minerals; Australia has strong resource position with discoveries being made of new mineral sand provinces. |
| Graphite | Category two (8) | 0% | 77 000 kt5; n.a. | $134m, medium | Development of large scale fuel-cell applications could drive strong future demand for graphite; China and India dominate production and resources; only small deposits are known in Australia although potential in high-grade metamorphic terranes could be significant. |
| Tin | Category two (8) | 2% | 4863 kt; 243 kt | $434m, medium | The uses of Sn in high-tech industries may sustain demand; Australia has considerable Sn resources and good potential for discovery of additional granite-related deposits. |
| Beryllium | Category two (7) | 0% | n.a. | $4259m, large | Beryllium minerals are relatively rare so recycling is significant (19%); the US dominates production and is the leading importer; Be is a strategic element, used in military and electronic applications; pegmatites are the main source of Be; Australia has some world-class pegmatite (Li, Nb, Ta) deposits but resources of Be are unknown. |
| Bismuth | Category two (6) | 0% | 320 kt; n.a. | $41m, small | China dominates production and resources; no Australian EDR but past production was significant from Tennant Creek; there is potential for new Bi resources with granite-related W and Sn deposits and in some volcanic-related Cu-Pb-Zn deposits. |
| Thorium | Category three (3) | 0% | 1400 kt ThO2; n.a. | $21m, small | Australia has 29% of global resources, second to the US, in mainly heavy mineral sand deposits; currently there is no market for Th. Development of new-generation nuclear reactors could provide major potential for Australian suppliers. |
| Helium | Not assessed | very small | n.a. | $86m, small | Based on limited data US dominates production and resources, and EU and Japan are the largest importers; as an emerging major global player in conventional and unconventional gas resources, Australia may have very considerable He resources but they are currently undefined. |
| Gallium | Category one (29) | 0% | n.a. | $420m for Ga, Hf, In, Nb, Re; small for Ga | Gallium is a by-product of treating bauxite (Al ore) and Zn; although reserve and resource data are unavailable; Australia's high global rankings in resources of bauxite and Zn mean there is category one potential for significant Ga resources; however, current market is very small (216 kg global primary production), limiting the potential. |
| Tellurium | Category one (13) | 0% | n.a. | $109m (with boron), medium | Some Australian volcanic-hosted massive sulphide deposits have significant Te but Australian resources and potential are unclear; there may be potential to recover Te from copper concentrates. |
| Vanadium | Category one (13) | 0% | 15 000 kt; 1519 kt | $16m, small | The European Union, Japan, Russia and China are main importers of V, which is used primarily in steel making; Australia resources are considerable but market and growth are limited. |
| Selenium | Category two (11) | 0% | 93 kt | $186m, medium | China is the main importer of Se; growth in solar cell use may result in increased demand for Se, which is a by-product of mainly Cu and Ni refining; Australia has no resources in EDR category but recovery from Cu and other ores may represent a potential source. |
| Germanium | Category two (8) | 0% | n.a. | $0.1, small | Very small market and recycling mean Ge offers limited potential; nevertheless, as Ge is a by-product of Zn smelting, Australia could be well-placed as a potential supplier. |
| Strontium | Category two (8) | 0% | 6800 kt; n.a. | $24m, small | Strontium is an industrial element of small market size; limited potential exists in Australia. |
| Fluorite | Category two (6) | 0% | 240 000 kt fluorite; n.a. | $78m, small | Fluorite is an industrial commodity; Australia's resources and potential are limited. |
| Arsenic | Category three (3) | 0% | n.a. but very large | $5518m, large | Due to toxicity of As, substitution in wood treatment may reduce demand although semiconductor uses may grow; China is main producer; Australian resources are unknown but potential exists to recover as by-product from pyrite-rich deposits (common). |
| Barium | Category three (3) | 0% | 7800 kt barite (BaSO4); n.a. | $148m, medium | China dominates production and resources; minor historic Australian production and no EDR; barite is associated with some volcanic-hosted massive sulphide deposits but limited potential for new deposits; hence little potential for Australia to have impact on global supply. |
| Mercury | Category three (3) | 0% | 93 kt; n.a. | $28m, small | Asian economies dominate demand whereas Mexico and China hold largest resources; substitution and recycling may impact demand outlook; some Australian Zn-Pb-Ag deposits may contain significant Hg (1 kt) but its potential for recovery as a by-product is unknown. |
| Cadmium | Category three (2) | 2% | 640 kt; 61 kt | $27m, small | Recycling and substitution of NiCd batteries may impact growth outlook; as Cd is a by-product of Zn production, Australia is well placed to increase its production, due to its world-leading Zn resource position; however market is currently very small. |
| Rhenium | Category three (1) | 0% | 2.5 kt; n.a. | $420m for Ga, Hf, In, Nb, Re; small or medium for Re | Rhenium production is mostly as a by-product of Mo refining from porphyry Mo and Cu deposits, hence Chile and US are major producers and resource holders; Australia has a high grade resource in Qlueensland. |
| Category one | Category two | Category three | Small <$100m Medium $100–1000m Large >$1000m Very large >$10 000m (m denotes million) | ||