Iron Ore
Last updated:19 December 2023
Please note that this page is currently under review.
Resource figures are current as at 31 December 2018.
Iron (Fe) is a metallic element that constitutes 5.6% by weight of the Earth's crust and is the fourth most abundant element in the crust. Iron ores are rocks from which metallic iron can be economically extracted. The principal iron ores contain hematite (Fe2O3) and magnetite (Fe3O4).
Hematite is an iron oxide mineral. It is non-magnetic and has colour variations ranging from steel silver to reddish brown. Pure hematite contains 69.9% Fe by molecular weight. It has been the dominant iron ore mined in Australia since the early 1960s. Approximately 96% of Australia's iron ore exports are high-grade hematite, the bulk of which has been mined from deposits in the Hamersley province of Western Australia. The Brockman Iron Formation in this province is the most significant host for high-grade hematite iron ore deposits.
Magnetite is an iron oxide mineral that is generally black and highly magnetic. The latter property aids in the beneficiation of magnetite ores. Magnetite contains 72.4% Fe by molecular weight, which is higher than hematite, but magnetite ores having lower ore grade (generally 20-30% Fe) owing to the presence of impurities. This results in higher costs for the production of concentrate for steel smelters.
Large magnetite deposits occur across Australia and, in 2018, Australia had three producing magnetite projects:
- the Sino Iron Project in the Pilbara region of Western Australia,
- Karara in Western Australia's mid-west, and
- Savage River in Tasmania.
In 2018, Sino Iron produced and shipped more than 19 million wet metric tonnes of magnetite concentrate to the company's steel plants and Asian steel mill customers. Project owner Citic Ltd has stated that improvements in its processing lines, have resulted in lower production costs1.
The Karara project has reported production of 7.8 million dry metric tonnes (dmt) of magnetite concentrate for the 2017-18 financial year, at an average product quality of approximately 65.6% Fe, a decrease of 2.5% from 8 million dmt the previous year2.
Also, despite disruptive rainfall during 2018, the Savage River operation successfully delivered 2.37 million tonnes (Mt) of magnetite pellets, a 25% increase from the previous year3.
Mining and processing hematite and magnetite ores
High-grade hematite ore is referred to as direct shipping ore (DSO) as, once mined, the ore goes through a simple crushing and screening process before being exported for steel-making. Australia's hematite DSO from the Hamersley province averages from 56% to 62% Fe.
Like hematite ores, magnetite ores require initial crushing and screening but also undergo a second stage of processing using the magnetic properties of the ore to produce a concentrate. Further processing of magnetite involves agglomeration4 and thermal treatment of the concentrate to produce pellets. These can be used directly in blast furnaces or in direct reduction steel-making plants. The pellets contain 65% to 70% Fe, a higher grade compared to the hematite DSO currently being exported from the Hamersley province. Additionally, when compared to hematite DSO, the magnetite pellets contain lower levels of impurities, such as phosphorous, sulphur and aluminium. Thus, magnetite pellets are a premium product and attract higher prices from steel makers. This offsets the lower ore grades and higher costs of production.
JORC Ore Reserves
Ore Reserves represent a higher level of economic, technical and legal certainty than Mineral Resources under the Joint Ore Reserves Committee (JORC) Code. Deposits with Ore Reserves have, at a minimum, a prefeasibility study indicating a reasonable expectation of being mined within a development timeframe. Mineral Resources have reasonable prospects for eventual economic extraction over a longer timeframe.
Australia's iron ore reserves and resources comprise both hematite and magnetite. Owing to the high average grades (% Fe) of hematite ores when compared to average beneficiated grades of magnetite ores, it is necessary to report national inventory in terms of contained iron as well as bulk iron ore. The national estimates for iron ore since 2010 are reported in two categories, namely:
- Million tonnes of iron ore, and
- Million tonnes of contained iron.
Total Australian Ore Reserves of iron ore reported in compliance with the JORC Code were estimated to be 23 106 Mt in 2018 (Table 1), representing 47% of Economic Demonstrated Resources (EDR; Table 3).
Ore Reserves of contained iron reported in compliance with the JORC Code totalled 10 540 Mt in 2018 (Table 1), or 44% of the EDR of contained iron (Table 4). However, not all mining companies are publicly listed; as such, unreported reserves and resources are not included in these figures.
Based on publicly available data, JORC Reserves at operating mines are sufficient for approximately 13 years at the 2018 rate of mine production (Table 2). This increases to 26 years if all deposits with reserves are considered (Table 1). The addition of unreported quantities would, again, increase these estimates. Interestingly, the potential reserve life of contained iron is only 19 years (Table 1), due to preferential depletion of deposits with higher iron content.
Most operating mines reported a decrease in Ore Reserves in 2018, largely due to mining depletion and changes to the mining area. Operations that reported an increase in their Ore Reserves include: Fortescue Metal Group (FMG)'s Kings and Queens, which reported a 3% increase5; Hamersley Iron Pty Ltd's Marandoo operation, with a 17% increase6; and BHP Ltd's 'Marra Mamba' Ore Reserves increase due to the inclusion of the South Flank Project7.
Table 1. Australia's Ore Reserves of iron ore and contained iron, production and potential reserve life, 2002-2018.
| Year | IRON ORE | CONTAINED IRON | ||||
|---|---|---|---|---|---|---|
| Ore Reserve1 (Mt) | Production2 (Mt) | Reserve Life3 (years) | Ore Reserve1 (Mt) | Production2 (Mt) | Reserve Life3 (years) | |
| 2018 | 23 106 | 899 | 26 | 10 540 | 557 | 19 |
| 2017 | 24 145 | 883 | 27 | 10 801 | 547 | 20 |
| 2016 | 23 532 | 858 | 27 | 10 470 | 531 | 20 |
| 2015 | 21 920 | 811 | 27 | 10 244 | 502 | 20 |
| 2014 | 20 487 | 735 | 28 | 9665 | 424 | 23 |
| 2013 | 18 362 | 609 | 30 | 9320 | ||
| 2012 | 15 305 | 520 | 29 | 7931 | ||
| 2011 | 15 032 | 488 | 31 | 7804 | ||
| 2010 | 13 600 | 430 | 32 | 7100 | ||
| 2009 | 12 300 | 394 | 31 | |||
| 2008 | 10 800 | 341 | 32 | |||
| 2007 | 8100 | 299 | 27 | |||
| 2006 | 7800 | 275 | 28 | |||
| 2005 | 6900 | 262 | 26 | |||
| 2004 | 4600 | 234 | 20 | |||
| 2003 | 4300 | 213 | 20 | |||
| 2002 | 4100 | 187 | 22 | |||
Mt = million tonnes.
- The majority of Australian Ore Reserves and Mineral Resources are reported in compliance with the JORC Code, however there are a number of companies that report to foreign stock exchanges using other reporting codes, which are largely equivalent. In addition, Geoscience Australia may hold confidential information for some commodities.
- Source: Office of the Chief Economist, Department of Industry, Innovation and Science, Resources and Energy Quarterly (June 2019). Production data often have a higher level of certainty than resource estimates and so may be presented with more significant figures.
- Reserve life is calculated by dividing the Ore Reserve by production. The resulting ratio is a snapshot in time that can only be used for general impressions because it is an average and it assumes (1) that production rates in the future will remain the same as those used in the calculation, (2) deposits deemed economic/uneconomic remain so in the future and (3) that depleted reserves are never replaced.
Table 2. Ore Reserves and Mineral Resources of iron ore at operating mines in 2018.
| No. of Operating Mines1 (Mt) | Ore Reserves2 (Mt) | Measured and Indicated Resources3 (Mt) | Inferred Resources4 (Mt) | Mine Production5 (Mt) | Reserve Life6 (years) | Resource Life 17 (years) | Resource Life 28 (years) |
|---|---|---|---|---|---|---|---|
| 34 | 11 610 | 25 538 | 40 111 | 899 | 13 | 28 | 73 |
Mt = million tonnes.
- The number of operating mines counts individual mines that operated during 2018 and thus contributed to production. Some of these mines may belong to larger, multi-mine operations and some may have closed during or since 2018.
- The majority of Australian Ore Reserves and Mineral Resources are reported in compliance with the JORC Code, however there are a number of companies that report to foreign stock exchanges using other reporting codes, which are largely equivalent. In addition, Geoscience Australia may hold confidential information for some commodities. NB: Not all operating mines report Ore Reserves. Ore Reserves are as at 31 December 2018.
- Measured and Indicated Mineral Resources are inclusive of the Ore Reserves. NB: Not all operating mines report Mineral Resources. Mineral Resources are as at 31 December 2018.
- Inferred Mineral Resources are as at 31 December 2018. NB: Not all operating mines report Mineral Resources.
- Source: Office of the Chief Economist, Department of Industry, Innovation and Science, Resources and Energy Quarterly (September 2018). Production data often have a higher level of certainty than resource estimates and so may be presented with more significant figures.
- Reserve Life = Ore Reserves ÷ Production.
- Resource Life 1 = Measured and Indicated Resources ÷ Production.
- Resource Life 2 = Measured, Indicated and Inferred Resources ÷ Production.
Identified Resources
In 2018, Australia's EDR of iron ore increased by 3% from 2017 to 49 604 Mt (Table 3). Similarly, there was a 4% EDR increase of contained iron to 24 122 Mt (Table 4). EDR attributable to magnetite deposits have decreased by 1%, likely due to re-assessment of projects and inactivity in the magnetite industry. The vast majority (92%) of Australia's EDR of iron ore occurs in Western Australia with relatively minor occurrences in South Australia, New South Wales and Tasmania.
The market price for seaborne iron ore has risen consecutively over recent years from a low of US$47/t in 2015-16 to US$72/t in 2018‑19. This is partly due to market concerns of a supply shortfall from Vale S.A.'s operations due to infrastructure failures in Brazil. In Australia, iron ore shipments were disrupted by unfavourable weather conditions in the Pilbara region of Western Australia. Another factor is short-term demand from Chinese steel mill producers, with increased production prior to a government-imposed winter production slowdown.
In response to this economic environment, some companies are re-visiting suspended resource projects that have defined resources and economic potential. New projects are required for established producers to maintain current production output and meet target capacity rates as existing projects are depleted. For instance, the US$2.9 billion South Flank Project was announced by BHP in June 2018 to replace the 80 Mt per annum (Mtpa) production at the depleting Yandi mine8.
The US$1.275 billion Eliwana Project announced by FMG will ensure it maintains its minimum production rate of 170 Mtpa9. New mine developments include Rio Tinto Ltd's Koodaideri Project. The projected capacity rate of Koodaideri is around 43 Mtpa, with expected production in the latter part of 202110. The previously halted Koolan Island mine (Mount Gibson Iron Ltd) has also re-started, with the first ore sale reported in early 2018. Koolan Island's main pit is expected to be mined over the next five years with an estimated JORC Ore Reserve of 21 Mt at an average grade of 65.5% Fe11.
Paramarginal resources of iron ore in 2018 were estimated at 10 382 Mt with 3137 Mt of contained iron. Inferred Resources in 2018 were estimated at 94 100 Mt of iron ore with 43 021 Mt of contained iron (Table 3 and Table 4). Trends in Ore Reserves, EDR and total resources for iron ore are illustrated in Figure 1.
Table 3. Australia's identified iron ore resources and world figures for selected years from 1975-2018.
| Year | Demonstrated Resources | Inferred Resources3 | Accessible EDR4 | Australian Mine Production5 | World Economic Resources6 | World Mine Production6 | ||
|---|---|---|---|---|---|---|---|---|
| Economic (EDR)1 | Subeconomic2 | |||||||
| Paramarginal | Submarginal | |||||||
| 2018 | 49 604 | 10 382 | 1319 | 94 100 | 49 604 | 899 | 173 104 | 2500 |
| 2017 | 47 987 | 11 450 | 1383 | 92 570 | 47 987 | 883 | 168 400 | 2400 |
| 2016 | 49 588 | 10 939 | 1433 | 90 123 | 49 588 | 858 | 173 769 | 2230 |
| 2015 | 51 906 | 7639 | 1510 | 86 430 | 51 906 | 811 | 180 000 | 3300 |
| 2014 | 54 412 | 1569 | 1727 | 82 167 | 54 412 | 735 | 190 000 | 3220 |
| 2013 | 52 578 | 474 | 1635 | 78 577 | 52 578 | 609 | 186 878 | 3024 |
| 2012 | 44 650 | 566 | 1365 | 73 570 | 44 650 | 520 | 175 650 | 2959 |
| 2011 | 37 762 | 1414 | 1507 | 61 489 | 37 762 | 488 | 168 762 | 2814 |
| 2010 | 34 500 | 700 | 1500 | 47 800 | 34 500 | 430 | 191 000 | 2400 |
| 2009 | 28 000 | 300 | 1900 | 33 500 | 37 900 | 394 | 168 000 | 2300 |
| 2008 | 24 000 | 300 | 1600 | 28 900 | 23 900 | 341 | 158 000 | 2200 |
| 2007 | 20 300 | 300 | 1700 | 24 400 | 20 200 | 299 | 154 000 | 1900 |
| 2006 | 18 600 | 200 | 1800 | 17 900 | 18 500 | 275 | 163 000 | 1700 |
| 2005 | 16 400 | 200 | 1800 | 18 800 | 16 400 | 262 | 160 000 | 1500 |
| 2004 | 14 600 | 200 | 1900 | 16 900 | 14 600 | 234 | 160 000 | 1250 |
| 2003 | 12 400 | 1200 | 1900 | 16 700 | 12 400 | 213 | 143 000 | 1140 |
| 2002 | 13 000 | 1100 | 1800 | 15 500 | 13 000 | 187 | 145 000 | 1090 |
| 2001 | 12 400 | 200 | 1600 | 12 300 | 182 | 133 600 | 1020 | |
| 2000 | 13 600 | 2100 | 1400 | 14 200 | 168 | 135 600 | 1010 | |
| 1995 | 17 800 | 13 800 | 400 | 17 200 | 143 | 150 000 | 1000 | |
| 1990 | 14 700 | 13 100 | 200 | 20 100 | 109 | 151 000 | 929 | |
| 1985 | 16 220 | 11 830 | 14 280 | 93 | 210 000 | 896 | ||
| 1980 | 14 870 | 17 230 | 6730 | 96 | 266 000 | 882 | ||
| 1975 | 17 800 | 98 | 253 000 | 875 | ||||
Mt = million tonnes.
- Economic Demonstrated Resources (EDR) predominantly comprise Ore Reserves and most Measured and Indicated Mineral Resources that have been reported in compliance with the Joint Ore Reserves Committee (JORC) Code to the Australian Securities Exchange (ASX). In addition, some reserves and resources may have been reported to foreign stock exchanges using other reporting codes, which are largely equivalent to the JORC Code. Geoscience Australia may also hold some confidential data.
- Subeconomic Demonstrated Resources are geologically demonstrated but do not meet the criteria for economic at the time of determination. Subeconomic resources classed as Paramarginal require a modest improvement in the commodity price/cost ratio to render them economic. Subeconomic resources classed as Submarginal require a substantially improved commodity price/cost ratio to render them economic.
- Total Inferred Resources in economic, subeconomic and undifferentiated categories.
- Accessible Economic Demonstrated Resources (AEDR) is the portion of total EDR that is accessible for mining. AEDR does not include resources that are inaccessible for mining because of environmental restrictions, government policies or military lands.
- Source: Office of the Chief Economist, Department of Industry, Innovation and Science. Resources and Energy Quarterly, June 2019. Production data often have a higher level of certainty than resource estimates and so may be presented with more significant figures.
- Source: United States Geological Survey. Mineral Commodity Summaries 2019.
Table 4. Australia's identified contained iron resources and world figures from 2010-2018.
| Year | Demonstrated Resources | Inferred Resources3 | Accessible EDR4 | Australian Mine Production5 | World Economic Resources6 | World Mine Production6 | ||
|---|---|---|---|---|---|---|---|---|
| Economic (EDR)1 | Subeconomic2 | |||||||
| Paramarginal | Submarginal | |||||||
| 2018 | 24 122 | 3137 | 443 | 43 021 | 24 122 | 557 | 83 852 | 1546 |
| 2017 | 23 251 | 3656 | 476 | 42 006 | 23 251 | 547 | 81 900 | 1470 |
| 2016 | 23 771 | 3672 | 480 | 40 342 | 23 771 | 531 | 82 986 | 1360 |
| 2015 | 23 985 | 2796 | 515 | 38 562 | 23 985 | 502 | 85 000 | |
| 2014 | 24 639 | 799 | 570 | 36 173 | 24 639 | 424 | 87 000 | |
| 2013 | 23 035 | 344 | 574 | 34 297 | 23 035 | 86 785 | ||
| 2012 | 20 638 | 224 | 473 | 33 827 | 20 638 | 83 688 | ||
| 2011 | 18 152 | 501 | 736 | 29 204 | 18 152 | 81 101 | ||
| 2010 | 17 000 | 400 | 600 | 23 300 | 17 000 | 89 000 | ||
Mt = million tonnes.
- E Economic Demonstrated Resources (EDR) predominantly comprise Ore Reserves and most Measured and Indicated Mineral Resources that have been reported in compliance with the Joint Ore Reserves Committee (JORC) Code to the Australian Securities Exchange (ASX). In addition, some reserves and resources may have been reported to foreign stock exchanges using other reporting codes, which are largely equivalent to the JORC Code. Geoscience Australia may also hold some confidential data.
- Subeconomic Demonstrated Resources are geologically demonstrated but do not meet the criteria for economic at the time of determination. Subeconomic resources classed as Paramarginal require a modest improvement in the commodity price/cost ratio to render them economic. Subeconomic resources classed as Submarginal require a substantially improved commodity price/cost ratio to render them economic.
- Total Inferred Resources in economic, subeconomic and undifferentiated categories.
- Accessible Economic Demonstrated Resources (AEDR) is the portion of total EDR that is accessible for mining. AEDR does not include resources that are inaccessible for mining because of environmental restrictions, government policies or military lands.
- Source: Office of the Chief Economist, Department of Industry, Innovation and Science. Resources and Energy Quarterly, June 2019. Production data often have a higher level of certainty than resource estimates and so may be presented with more significant figures.
- Source: United States Geological Survey. Mineral Commodity Summaries 2019.
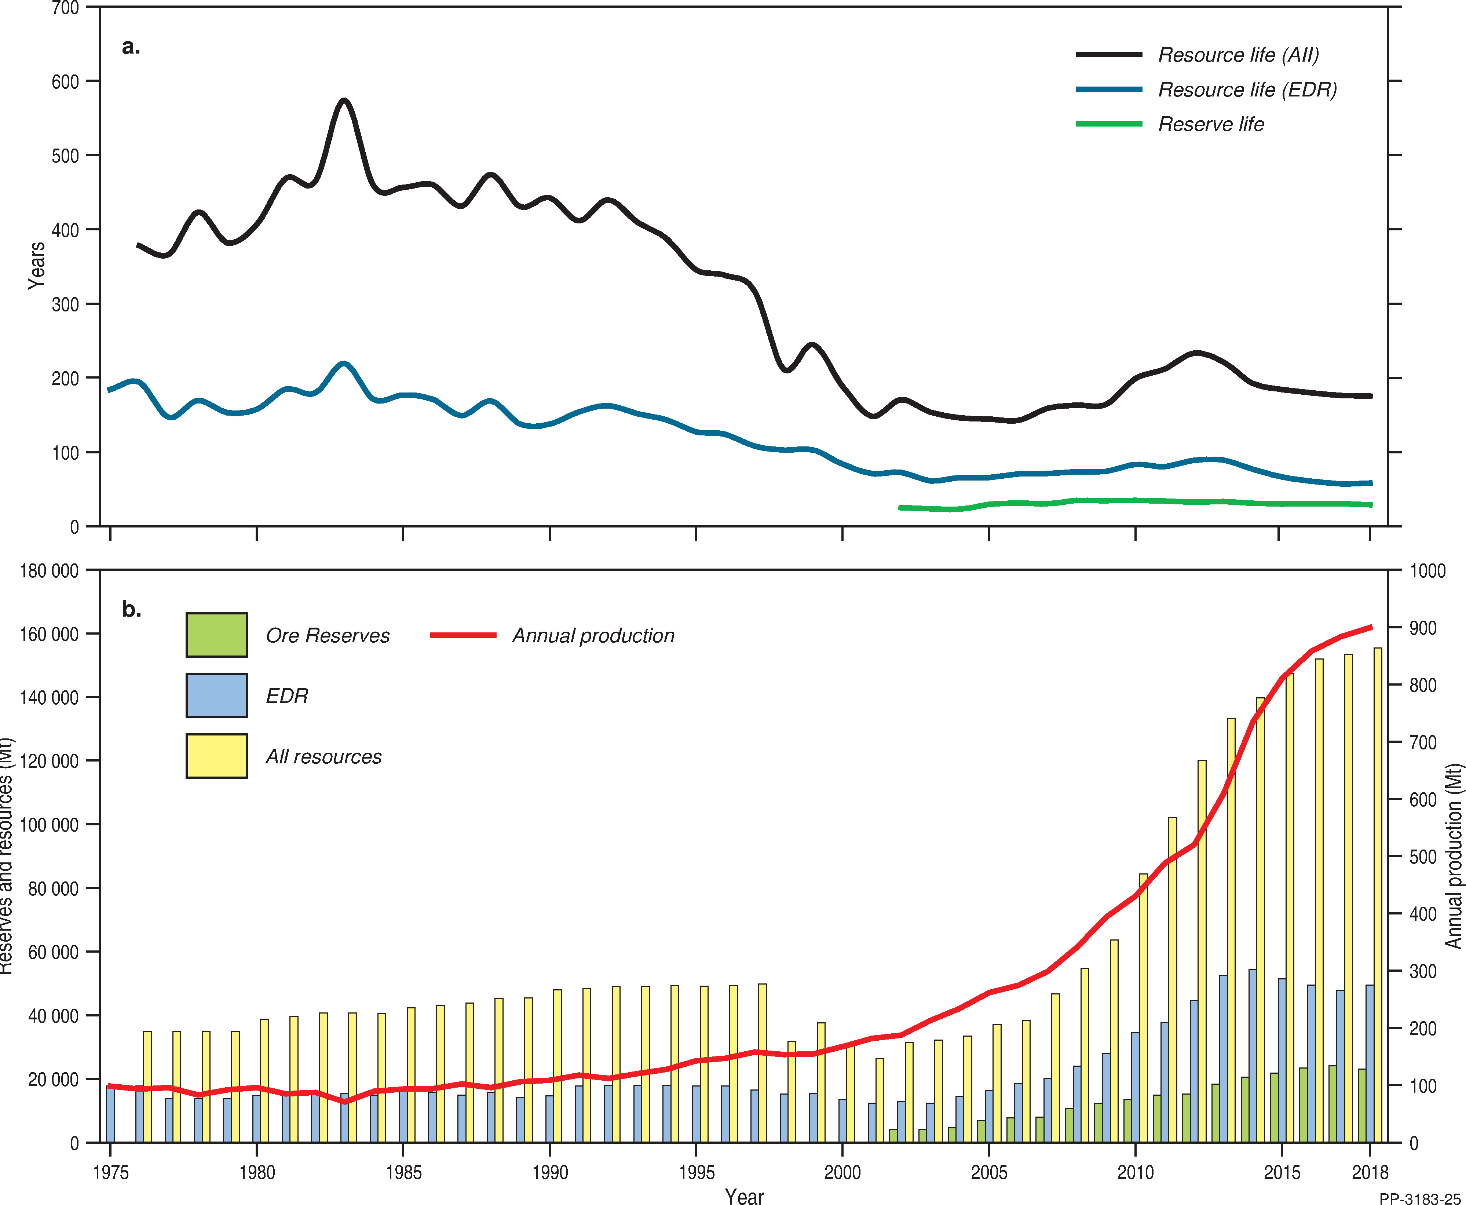
Figure 1. (a) Trends in iron ore reserve and resource life. These ratios are derived from (b) iron Ore Reserves, Economic Demonstrated Resources (EDR), all resources (EDR + Subeconomic Demonstrated Resources + Inferred) and annual production, 1975-2018. Mt = million tonnes. Prior to 2002, Ore Reserves were not recorded.
Accessible EDR
Some mineral resources are inaccessible for mining because of environmental restrictions, government policies or because they occur within military lands or national parks. Australia's accessible EDR (AEDR) of iron ore also totals 49 604 Mt (Table 3) as all of Australia's EDR iron ore deposits are regarded as accessible. Therefore, both AEDR and EDR have increased by 3% during the 2018 assessment period.
Production and Resource Life
Australia's total production of iron ore for 2018 was 899 Mt (Table 3), with Western Australia producing 891 Mt or 99% of overall production. South Australia and Tasmania produced the remaining 1% of iron ore in 2018 with 6 Mt and 3 Mt, respectively.
Rio Tinto Ltd reported 2% production growth at its Pilbara mines with output of 337.8 Mt in 201812. This increase was attributed to productivity improvements and expanded mine output. BHP reported total production of 275 Mt from its Western Australian operations for the 2018 financial year13, an increase of 3% from the previous year.
The Office of the Chief Economist reported Australia's iron ore 2018 exports at 835 Mt, a 1% increase on 2017 figures of 827 Mt 14. China, Japan and Korea remain major importers of Australia's iron ore products.
The Office of the Chief Economist projects that iron ore exports will continue to increase, reaching 996 Mt in 2024-25 15. This increase will be supported by new and expansion projects, including the Koodaideri, South Flank and Eliwana projects.
Australia is the world's largest iron ore producer but its iron ore resources are also the largest in the world; thus the potential resource life of Australia's iron ore deposits is considerable (Table 5). It is important to stress that the reserve and resource lives discussed here apply to Australia as a whole. The length of production at individual mines is dependent upon the amount of remaining resources and the discovery of additional near-mine resources. Moreover, mine life can be extended or renewed through the development of new technologies, including mine waste retreatment.
Overall reserve and resource lives for Australia may also increase as new mines are developed and become producers, either replacing existing production as old mines close or introducing new production. This is illustrated by Table 5, which compares reserve and resource lives for only operating mines with those for all deposits. As an example, when all deposits of iron ore are considered, the life of all resources, at 175 years, is far longer than the all resources life of 73 years calculated for operating iron ore mines. Similarly, the reserve life of all deposits is twice that of operating mines alone.
Table 5. Average reserve life and resource life (years) for iron ore as at December 2018.
| Operating Mines1 | All Deposits | ||||
|---|---|---|---|---|---|
| Ore Reserves2 | Demonstrated Resources3 | All Resources4 | Ore Reserves | AEDR5 | All Resources6 |
| 13 | 28 | 73 | 26 | 55 | 175 |
Mt = million tonnes.
Reserve and resource life for each mineral commodity is calculated by dividing the inventory by production. The resulting ratio is a snapshot in time that can only be used for general impressions because it is an average and it assumes (1) that production rates in the future will remain the same as those used in the calculation, (2) deposits deemed economic/uneconomic remain so in the future and (3) that depleted resources are never replaced.
- Operating mines includes all mines that operated during 2018 and thus contributed to production.
- Ore Reserves as reported in compliance with the JORC Code, plus non-JORC Code equivalents.
- Demonstrated Resources = Measured and Indicated Mineral Resources, inclusive of Ore Reserves, as reported in compliance with the JORC Code, plus non-JORC Code equivalents.
- All Resources for Operating Mines includes Measured, Indicated and Inferred Mineral Resources, inclusive of Ore Reserves, as reported in compliance with the JORC Code, plus non-JORC Code equivalents.
- AEDR = Accessible Economic Demonstrated Resources. All iron ore EDR is AEDR. Figures rounded to nearest five years.
- All Resources for All Deposits includes EDR, Subeconomic Demonstrated Resources and Inferred Resources. Figures rounded to nearest five years.
World Ranking
Based on data published by the United States Geological Survey16, supplemented by Geoscience Australia data, Australia ranks highly both in terms of production and economic resources of iron ore. Australia has the world's largest economic resources of iron ore with 29% of the global total. This is followed by Brazil at 18% and Russia at 14% (Table 6). In terms of contained iron, Australia also has 29% of world economic resources, while Brazil has 20%.
Table 6. World economic resources of iron ore 2018.
| Rank | Country | Economic Resources1 (Mt) | Percentage of world total2 |
|---|---|---|---|
| 1 | Australia | 49 604 | 29% |
| 2 | Brazil | 32 000 | 18% |
| 3 | Russia | 25 000 | 14% |
| 4 | China | 20 000 | 12% |
| 5 | Ukraine | 6500 | 4% |
| 6 | Canada | 6000 | 3% |
| 7 | India | 5400 | 3% |
| 8 | USA | 2900 | 2% |
| 9 | Iran | 2700 | 2% |
| 10 | Kazakhstan | 2500 | 1% |
| Others | 20 500 | 12% | |
| Total | 173 104 |
Mt = million tonnes.
- Source: USGS 17 and Geoscience Australia. National figures other than Australia are rounded.
- Percentages are rounded and might not add up to 100% exactly.
World Production Trends
Hematite ore is sourced mainly from Australia and Brazil and dominates world production. Australia produced 36% (899 Mt) of world iron ore production, followed by Brazil with 20% (490 Mt) and China with 14% (340 Mt; Table 7). Magnetite ore has established a presence in world production and contributes to Australia's EDR of iron ore, largely from established operations such as Savage River in Tasmania, Sino Iron in the Pilbara and from other magnetite resource deposits in Western Australia and South Australia. These represent 37% of Australia's total EDR of iron ore.
Table 7. World production of iron ore 2018.
| Rank | Country | Production1 (Mt) | Percentage of world total2 |
|---|---|---|---|
| 1 | Australia | 899 | 36% |
| 2 | Brazil | 490 | 20% |
| 3 | China | 340 | 14% |
| 4 | India | 200 | 8% |
| 5 | Russia | 95 | 4% |
| 6 | South Africa | 81 | 3% |
| 7 | Ukraine | 60 | 2% |
| 8 | USA | 49 | 2% |
| 9 | Canada | 49 | 2% |
| 10 | Iran | 40 | 2% |
| Others | 187 | 8% | |
| Total | 2491 |
Mt = million tonnes.
Industry Developments
Despite Western Australia dominating the iron ore industry in Australia, deposits occur in each Australian state as well as the Northern Territory (Figure 3). This section highlights recent company exploration and development-related activities.
The seaborne iron ore price has improved over recent years and, while still volatile, is enough to bring some positive momentum to the industry. Except for large and established operations, industry activity during the 2018 assessment period was largely upgrades to resource estimations to comply with JORC (2012) requirements. All reported reserves and resources are compliant with the JORC Code unless otherwise stated.

Figure 2. Australian iron ore deposits and operating mines 2018. Deposit size is based on total resources (EDR + Subeconomic Demonstrated Resources + Inferred). For clarity, only major or significant deposits are labelled.
Exploration Expenditure
Australian Bureau of Statistics data indicate that Australian mineral exploration drilling expenditure for 2018 totalled $2183.6 million, a 25% increase on the $1753.8 million spent in 201720. Of this, $289.5 million was spent on iron ore exploration in Western Australia, representing 22% of Western Australia's total drilling expenditure in 2018. Iron ore exploration drilling expenditure in South Australia was $3.3 million.
Hawsons Iron Project: In 2017, Hawsons realised a maiden JORC Reserve and Resource and achieved "major project status" in New South Wales. The reported Mineral Resource now stands at 2 500 Mt at an average grade of 17% Fe and is inclusive of a JORC Probable Ore Reserve of 755 Mt at an average grade of 17.5% Fe21. The project owner, Carpentaria Resources Ltd, also reported ongoing work on an ecology survey as well as an environmental study which includes cultural heritage22. Hawsons is located 60 km southwest of Broken Hill.
Central Eyre Iron Project (CEIP): Iron Road Ltd's CEIP achieved another milestone in the first quarter of 2018 with the project gaining approval under the Environment Protection and Biodiversity Conservation Act, 1999. The project has JORC Ore Reserves of 3681 Mt at an average grade of 15% Fe23. The Ore Reserve is part of a total JORC Mineral Resource of 4510 Mt, at an average grade of 16% Fe, unchanged since the previous 2017 review24. The project is located on the Eyre Peninsula.
Razorback Iron: Magnetite Mines Ltd reported an updated mineral resource estimate for the Razorback Iron deposits in accordance with the JORC (2012) Code in late 201825. The company affirmed that the JORC (2012) upgrade of the Mineral Resource estimate did not change the previous Razorback estimate, totalling 2732 Mt at an average grade of 18.2% Fe. Magnetite Mines's 2018 annual report described the ongoing optimisation of the Razorback project's completed prefeasibility study in 2013, with particular emphasis on infrastructure, mining and processing26.
Along the same geological formation, approximately 12 km south of Razorback, the company's Iron Hill project also reported upgraded JORC (2012) Mineral Resources, with no changes to the previous estimate of approximately 1200 Mt at an average grade of 23.2% Fe.
Maldorky and Grants: A drilling program designed to evaluate the commercial potential of Havilah Resources Ltd's Maldorky and Grants iron ore projects was completed in late 2018. At Grants, drilling conducted at the western end of the Grants Basin iron ore prospect showed some significant intersections of iron mineralisation, including 296 m at 24.3% Fe27. Geochemical test analyses from diamond drilling at the Grants Basin prospect also indicate extensive mineralisation, including 488 m at 24.6% Fe28.
The total JORC resource estimates for Maldorky and Grants iron ore projects remained unchanged since 2014 at 452 Mt29. These projects are approximately 300 km east of Port Pirie.
Savage River: The operation at the Savage River mine, located 75 km southwest of Burnie, processes and beneficiates magnetite ore to produce magnetite pellets at its plant at Port Latta (on the north coast of Tasmania) for export throughout the Asia Pacific region. Savage River comprises several magnetite deposits, namely North Pit, Central Pit and South Pit.
In late 2018, the operation commissioned the South Deposit Tailings Storage Facility for storing tailings for the next phase of the mine life. In addition, a prefeasibility study on the development of the North Pit underground mine is progressing and numerous deep resource drill holes have been completed, resulting in an increase in overall resource estimates in 2018. This significant increase of over 170 Mt brings the resource to 545 Mt as at 31 December 201830. The JORC Proved and Probable Ore Reserves, part of the overall Mineral Resource, is approximately 94 Mt at 49.8% Fe (Davis Tube Recovery31).
Nowa Nowa: Project activity at Easter Iron Ltd's Nowa Nowa Iron Project has remained on hold since Geoscience Australia's resource assessment in 2016. The company states that project progress will be subject to favourable market conditions for iron ore32. The JORC Resources at the project's Five Mile deposit are unchanged from 2014 at approximately 9 Mt at an average grade of 50.8% Fe33. The project is located approximately 270 km east of Melbourne.
Koolan Island: Mount Gibson Iron re-commenced production at its Koolan Island mine, in the Kimberley region of Western Australia, with the first ore sale reported in April 201934. As at 30 June 2018, Koolan Island had total JORC Resources of 52 Mt, at an average grade of 63.9% Fe35.
Karara Iron: Gindalbie Metals Ltd reported a 2.5% decrease in Karara magnetite concentrate production to 7.8 million dmt from the previous financial year of 8 million dmt36. Karara magnetite products average 65.6% Fe37. Karara is located 200 km east of Geraldton in the mid-west of Western Australia.
Mount Bevan: There has been no exploration activity at the Mount Bevan project since the 2016 industry review and hence no changes to the reported JORC magnetite resource estimate of approximately 1170 Mt at 34.9% Fe (comprising Indicated of 322 Mt at 34.7% Fe and Inferred of 847 Mt at 35% Fe)38. The Mount Bevan project is located approximately 95 km northwest of Menzies in the Yilgarn region.
Mount Webber: Atlas Iron Ltd's 2018 annual report details exploration and resource development at the Mount Webber deposits, which includes the completion of 109 RC drill holes for a total of 4644 m at Fender and 347 RC drill holes completing 20 332 m at Daltons deposit. Atlas Iron published a JORC Mineral Resource for Mount Webber in 2018 of approximately 38 Mt at an average grade of 57.7% Fe39. The Mount Webber mine is located approximately 230 km (via road) south-southeast of Port Hedland in the Pilbara region.
Blacksmith and Anvil: Flinders Mines Ltd reported an increased resource estimate for the Blacksmith and Anvil deposits, which are part of its Pilbara Iron Ore Project in 201840. The new estimate was a result of a drilling programme and subsequent metallurgical analysis. The combined JORC Mineral Resource for Blacksmith and Anvil now stands at 1484 Mt, with an average grade of 52.2% Fe. The Pilbara Iron Ore Project is located in the Pilbara region, approximately 60 km northwest of the town of Tom Price.
Red Hill: Exploration activities at the Red Hill Iron Ore Joint Venture Project between Red Hill Iron Ltd and API Management Pty Ltd have been put on hold until the current improvement in iron ore prices becomes stable41. There are no changes to the previously reported total JORC Mineral Resource of 816 Mt at 56.45% Fe42. The Red Hill project is located in the west of the Pilbara region.
Kumina: Preceding the divestment of the Kumina Iron Ore Project to Mineral Resources Ltd, BCI Minerals Ltd, reported Kumina's maiden JORC Inferred Resource of 115 Mt at 58% Fe43. The BCI report outlined numerous iron deposits (Kumina A, B, C, D, E, F G, H, I, J and K) within the Kumina tenements and the maiden resource was defined from the Kumina A, E and J deposits. Kumina is approximately 100 km south of Karratha in Pilbara region.
Eliwana: The mine development approval for the Eliwana deposit was announced by FMG during the first half of 2018 at an estimated project capital cost of US$1.275 billion44. Eliwana is expected to start production in late 2020 at a projected capacity rate of approximately 30 Mtpa. Eliwana is part of FMG's proposed Western Hub operation with total JORC Mineral Resources of 1010 Mt at an average grade of 58.8% Fe. Western Hub spans an area approximately 100-140 km west and northwest of Tom Price in the Pilbara region.
Marillana: In May 2018, Brockman Mining Ltd upgraded the Marillana Iron Ore Project's JORC (2004) Mineral Resource estimate, published in 2010, to comply with JORC (2012). Brockman stated that the upgraded, but reduced, estimate was due to resource category reclassification and included Measured, Indicated and Inferred Resources45. The total detrital iron ore resource at Marillana now stands at 1400 Mt, with an average grade of 42.2% Fe, at cut-off grade of 38% Fe46. The Marillana project is approximately 100 km northwest of the town of Newman.
Koodaideri: The development of the Koodaideri mine has been initiated and progressed, according to Rio Tinto47. The Koodaideri project will employ new technologies, including autonomous trucks, drill and rail, at its operation. Koodaideri's Phase 1 development aims to produce 43 Mtpa of iron ore and is expected to start production in late 2021, contributing to the company's high-grade "Pilbara Blend" products48. The company reported the Koodaideri total 'Brockman' Ore Reserve as approximately 549 Mt at 61.8% Fe as at December 201849. The project is located approximately 35 km northwest of Rio's Yandicoogina mine site and approximately 100 km from the town of Newman in the Pilbara region.
South Flank: Project approval for BHP's new South Flank mine was announced during 201850. BHP said that the project is expected to replenish the anticipated end of production at its Yandi mine of 80 Mtpa in 2020. South Flank is expected to commence production in 2021 and has a foreseeable mine life of 25 years. The new project is south of the company's established Mining Area C, expanding the operation at this hub.
BHP achieved its production capacity guidance of 270 Mt for the 2018–19 financial year as operations returned to full capacity following the cyclone that occurred in March 201951. The company aims to produce between 273 Mt and 286 Mt of iron ore during the 2019–20 financial year52.
Wiluna West: There were no changes to the Wiluna West Iron Ore Project's total JORC (2004) Resources of 130.3 Mt at 60% Fe, as re-stated in the 2018 GWR Group Ltd Annual Report53. The company has no immediate development plans for the Wiluna West iron ore deposit but reported in August 2019 that it had executed a "Term Sheet for a Mining Rights Agreement" with Gold Valley Iron Ore Pty Ltd to mine up to 3 Mt of iron ore from the project's John William Doutch deposit54.
Iron Ridge: FENIX Resources Ltd reported the completion of the Iron Ridge Project's feasibility study in November 2019 that confirmed the technical and financial viability of the project 55. The feasibility study included a maiden JORC Probable Ore Reserve of 7.76 Mt at an average grade of 63.9% Fe56.Iron Ridge is located approximately 600 km north-northeast of Perth and approximately 67 km northeast of Cue in the Murchison region.
Citation
Bibliographical reference: Summerfield, D., 2020. Australian Resource Reviews: Iron Ore 2019. Geoscience Australia, Canberra.
References
2 Gindalbie Metals Ltd ASX Announcement 19 October 2018, Annual Report.
3 Grange Resources Ltd. ASX Announcement 9 April 2019.
4 Agglomeration is the process in which magnetite grains are aggregated into pellets using a chemical binding reagent. Pellets are produced in a pelletising plant.
5 Fortescue Metals Group. ASX Announcement 20 August 2018. Annual Report.
6 Hamersley Iron Pty Ltd. ASX Announcement 2 March 2019. Annual Report.
7 BHP Ltd. Annual Report 2018. ASX Announcement 18 September 2018.
8 BHP Ltd. ASX Announcement 14 June 2018.
9 Fortescue Metals Group Ltd. 20 August 2018.
10 Rio Tinto Ltd. ASX Announcement 29 November 2018.
11 Mount Gibson Iron Ltd. ASX Announcement 12 October 2018.
12 Rio Tinto Ltd. ASX Announcement 28 February 2019.
13 BHP Ltd. ASX Announcement 18 September 2018.
14 Office of the Chief Economist, Department of Industry, Innovation and Science, Australian Government. Resources and Energy Quarterly, March 2020.
15 ibid.
16 United States Geological Survey, 2019. Mineral commodity summaries 2019.
18 ibid.
19 Office of the Chief Economist, Department of Industry, Innovation and Science, Australian Government. Resources and Energy Quarterly, June 2019.
20 Australian Bureau of Statistics, Mineral and Petroleum Exploration Australia, Mineral Exploration. 8412.0, March 2019 Tables 2, 4 and 6.
21 Carpentaria Resources Ltd. ASX Announcement 31 July 2017.
22 Carpentaria Resources Ltd. ASX Announcement 30 September 2018.
23 Iron Road Ltd. ASX Announcement 15 March 2016.
24 Summerfield, D., 2017. Australian Resource Reviews: Iron Ore 2017. Geoscience Australia, Canberra.
25 Magnetite Mines Ltd. ASX Announcement 12 November 2018.
26 Magnetite Mines Ltd. Annual Report 2018.
27 Havilah Resources Ltd. ASX Announcement 21 January 2019.
28 Havilah Resources Ltd. ASX Announcement 25 June 2019.
29 Havilah Resources NL. Annual Report 2014.
30 Company Name. ASX Announcement 8 April 2019.
31 Davis Tube Recovery testing is a laboratory technique that firstly pulverises the magnetite sample and then uses a Davis Tube wash to recover the magnetic particles. It measures the proportion of the sample that is magnetic and therefore the likely grade of magnetite concentrate at a given grind size. The recovered magnetic and non-magnetic portions can be further analysed for chemical composition.
32 Easter Iron Ltd. ASX Announcement 25 September 2018.
33 Easter Iron Ltd. ASX Announcement 21 May 2014.
34 Mount Gibson Iron Ltd. ASX Announcement 24 April 2019.
35 Mount Gibson Iron Ltd. ASX Announcement 11 October 2018.
36 Gindalbie Metals Ltd. 2018 Annual Report.
37 ibid.
38 Legacy Iron Ore Ltd. ASX Announcement 16 December 2013.
39 Atlas Iron Ltd. Annual Report 2018.
40 Flinders Mines Ltd. ASX Announcement 1 March 2018.
41 Red Hill Iron Limited. ASX Announcement 25 February 2019.
42 Red Hill Iron Ltd. ASX Announcement 24 November 2016.
43 BCI Minerals Ltd. ASX Announcement 28 June 2018.
44 Fortescue Metals Group Ltd. ASX Announcement 5 July 2019.
45 Brockman Mining Ltd. ASX Announcement 28 May 2018.
46 ibid.
47 Rio Tinto Ltd. ASX Announcement. Quarterly Activities Report to the ASX, 16 July 2019.
48 Rio Tinto Ltd. ASX Announcement 29 November 2018.
49 Rio Tinto Ltd. 2018 Annual Report.
50 BHP Ltd. ASX Announcement 14 June 2018.
51 BHP Ltd. ASX Announcement 17 July 2019 BHP Operational Review.
52 ibid.
53 GWR Group Ltd. Annual Report 2018.
54 GWR Group Ltd. ASX Announcement 5 August 2019.
55 FENIX Resources Ltd. ASX Announcement 4 November 2019.
56 ibid.