Minerals Sands
Last updated:19 December 2023
Please note that this page is currently under review.
Resource figures are current as at 31 December 2016.
Mineral sands (sometimes known as heavy mineral sands) contain concentrations of minerals that are useful for a variety of (usually) industrial purposes. These minerals are originally derived from igneous (e.g. granite, basalt) or metamorphic (e.g. schist) rocks that have been broken down by natural weathering processes, transported in fluvial systems and eventually deposited in placer deposits in beach, lake or river environments. Within beach environments in particular, processes such as wave action and longshore drift taking place over thousands or millions of years concentrate the heavy minerals into quantities that may be cost-effective to exploit. Because sea levels have changed significantly over geological time, ancient mineral sand deposits may be well removed from modern coastlines.
The principal components of heavy mineral sands are rutile (TiO2), ilmenite (FeTiO3) and zircon (ZrSiO4). Minor amounts of other minerals such as monazite ([Ce,La,Th]PO4) and xenotime (YPO4) may also sometimes be present. The titanium-bearing minerals rutile, ilmenite and leucoxene (an alteration product of ilmenite) are used predominantly in the production of titanium dioxide pigment. Rutile and leucoxene are sometimes blended to produce HiTi, a high-grade titanium with a TiO2 content of 70% to 95%, used as a feedstock to produce titanium dioxide, make titanium metals for the aerospace industry and in the manufacture of welding rods. Less than 4% of total titanium mineral production, typically rutile, is used in making titanium sponge metal. Zircon is used as an opacifier for glazes on ceramic tiles, in refractories and for the foundry industry.
Mineral sand deposits may also host rare earth elements such as lanthanum (La), cerium (Ce) and neodymium (Nd), as part of the chemical structure of monazite, and erbium (Er) and cerium, as part of the chemical structure of xenotime. However, rare earth elements are seldom present in commercially viable quantities in mineral sand deposits.
Thorium, present in monazite, is sometimes considered a possible resource to generate electricity in thorium nuclear reactors. However, commercial technologies for thorium nuclear reactors are still some decades away. Because there are no current commercial applications for thorium, world production and consumption rates are negligible.
JORC Reserves
Australia has large Ore Reserves of mineral sands amounting to 56.5 Mt, 6.7 Mt and 20.0 Mt of ilmenite, rutile and zircon, respectively (Table 1). In 2016, there were seven operations producing ilmenite, rutile and zircon and an eighth producing just zircon (Table 2). These mines account for 26%, 31% and 24% of Australia's ilmenite, rutile and zircon Ore Reserves, respectively. In 2016, these mines produced 1.4 Mt of ilmenite, 0.3 Mt of rutile and 0.6 Mt of zircon, a 55% increase for ilmenite from 2015 but largely unchanged for rutile and zircon. In addition, Australia has large Inferred Resources of ilmenite (235.1 Mt), rutile (34.1 Mt) and zircon (61.3 Mt) plus smaller amounts that are regarded as subeconomic (Table 3, Table 4 and Table 5).
Table 1. Ore Reserves of heavy mineral sands reported in compliance with the JORC Code, production and potential reserve life*, 2002-2016.
| Year | ILMENITE | RUTILE | ZIRCON | ||||||
|---|---|---|---|---|---|---|---|---|---|
| Proved and Probable Ore Reserve (Mt) | Production (Mt) | Reserve Life (years) | Proved and Probable Ore Reserve (Mt) | Production (Mt) | Reserve Life (years) | Proved and Probable Ore Reserve (Mt) | Production (Mt) | Reserve Life (years) | |
| 2016 | 56.5 | 1.4 | 40 | 6.7 | 0.3 | 22 | 20.0 | 0.6 | 33 |
| 2015 | 41.61 | 0.906 | 54 | 7.51 | 0.32 | 34 | 15.01 | 0.601 | 34 |
| 2014 | 41.3 | 1.0 | 41 | 8 | 0.212 | 38 | 15.3 | 0.798 | 19 |
| 2013 | 50.3 | 1.152 | 44 | 10.1 | 0.2 | 41 | 20.6 | n.a. | n.a. |
| 2012 | 43.2 | 1.344 | 32 | 7.1 | 0.439 | 16 | 14.9 | 0.605 | 25 |
| 2011 | 41.7 | 1.277 | 33 | 6.4 | 0.474 | 14 | 13.8 | 0.762 | 18 |
| 2010 | 28.8 | 1.313 | 22 | 4.9 | 0.43 | 11 | 8.9 | 0.54 | 16 |
| 2009 | 27.7 | 1.534 | 18 | 5 | 0.28 | 18 | 8.9 | 0.476 | 19 |
| 2008 | 42.7 | 2.042 | 21 | 5.1 | 0.325 | 16 | 9.7 | 0.55 | 18 |
| 2007 | 45.7 | 2.326 | 20 | 5.2 | 0.312 | 17 | 8.9 | 0.601 | 15 |
| 2006 | 41.3 | 2.4 | 17 | 4.19 | 0.232 | 18 | 5.3 | 0.49 | 11 |
| 2005 | 36.2 | 2 | 18 | 3.41 | 0.177 | 19 | 4.8 | 0.43 | 11 |
| 2004 | 42.4 | 1.93 | 22 | 3.85 | 0.162 | 24 | 5.7 | 0.441 | 13 |
| 2003 | 40.1 | 2.01 | 20 | 3.2 | 0.173 | 18 | 5.1 | 0.462 | 11 |
| 2002 | 25.1 | 1.9 | 13 | 3.4 | 0.22 | 15 | 5.3 | 0.4 | 13 |
*Reserve life is the ratio of Ore Reserves to production and represents a snapshot in time. It assumes that future production continues at the same rate and does not take into account future resource upgrades and successful exploration for new deposits.
- These figures have been revised from those previously reported.
At 2016 levels of production, the average reserve life at operating mines is potentially 11 years for ilmenite, 7 years for rutile and 8 years for zircon (Table 2). Resource life for ilmenite, rutile and zircon at operating mines is almost triple the reserve life at 33 years, 18 years and 21 years, respectively (Table 2). If Ore Reserves at mines on care and maintenance, developing mines and undeveloped deposits are also considered, the reserve life for ilmenite, rutile and zircon is potentially 40 years, 22 years and 33 years, respectively, and if Accessible Economic Demonstrated Resource (AEDR) is used as an indication of long-term potential supply then, at 2016 rates of production, Australia's minerals sands resources could last more than a century.
Table 2. Ore Reserves and Mineral Resources of ilmenite, rutile and zircon (million tonnes) reported in compliance with the JORC Code at operating mines in 2016.
| Commodity | No.of Operating Mines1 | Ore Reserves2 at Operating Mines | Measured and Indicated Resources3 at Operating Mines | Mine Production 20164 | Average Reserve Life (years) | Average Resource Life (years) |
|---|---|---|---|---|---|---|
| Ilmenite | 7 | 14.70 | 45.03 | 1.4 | 11 | 32 |
| Rutile | 7 | 2.10 | 5.03 | 0.3 | 7 | 18 |
| Zircon | 8 | 4.78 | 11.8 | 0.6 | 8 | 21 |
- The number of operating mines counts individual mines that operated during 2016 and thus contributed to production. Some of these mines may belong to larger, multi-mine operations and some may have closed during or since 2016.
- The majority of Australian Ore Reserves and Mineral Resources are reported in compliance with the JORC Code, however there are a number of companies that report to foreign stock exchanges using other reporting codes, which are largely equivalent. In addition, Geoscience Australia may hold confidential information for some commodities. Ore Reserves are as at 31 December 2016.
- Mineral Resources are inclusive of the Ore Reserves. Mineral Resources are as at 31 December 2016.
- Source: Aggregated state and NT production statistics.
Figure 1, Figure 2 and Figure 3 show that annual production for ilmenite (1.4 Mt), rutile (0.3 Mt) and zircon (0.6 Mt) are equal to only 2%, 4% and 3% of their respective Ore Reserves in 2016. However, cumulative production of ilmenite over the last 15 years is 24.9 Mt which is almost equal to the Ore Reserve of 25.1 Mt from 2002 (Figure 1). Cumulative production for rutile (4.3 Mt; Figure 2) and zircon (8.4 Mt; Figure 3) over the same period actually exceed the rutile and zircon Ore Reserves from 2002 (3.4 Mt and 5.3 Mt, respectively).
Figure 1 shows that annual ilmenite production has fallen 26% over the last 15 years from its 2002 level of 1.9 Mt and, despite a 55% increase on 2015 production, production in 2016 was down 42% from its 2006 peak of 2.4 Mt. Some heavy mineral sands producers closed operations at low-grade ilmenite deposits to concentrate on deposits with higher zircon content or those more readily amenable to beneficiation. Ilmenite reserves have, however, increased 125% over the last 15 years from 25.1 Mt in 2002 to 56.5 Mt in 2016, after recovering from a post global financial crisis low of 27.7 Mt in 2009.
Figure 2 shows a similar story of rising Ore Reserves for rutile. Rutile Reserves have doubled over the last 15 years from 3.4 Mt in 2002 to 6.7 Mt in 2016 having reached a peak of 10.1 Mt in 2013. Unlike ilmenite, production of rutile over this period has increased 36% from 0.22 Mt in 2002 to 0.3 Mt in 2016. Peak production (0.47 Mt), however, was actually achieved in 2011, bouncing back after sharply lower levels of mineral sands production in 2009, due to flow-on effects of the global financial crisis in late 2008. Since the high of 2011, rutile production has fallen 36% over the last five years as prices for rutile and ilmenite have remained soft.
Figure 3 shows that Ore Reserves of zircon, like those of ilmenite and rutile, have also risen significantly (nearly 300%) over the last 15 years from 5.3 Mt in 2002 to 20.0 Mt in 2016. Zircon production has also declined 25% from its 2015 peak of 0.8 Mt but is still on a rising trend in which production has increased 50% from 0.4 Mt in 2002 to 0.6 Mt in 2016.
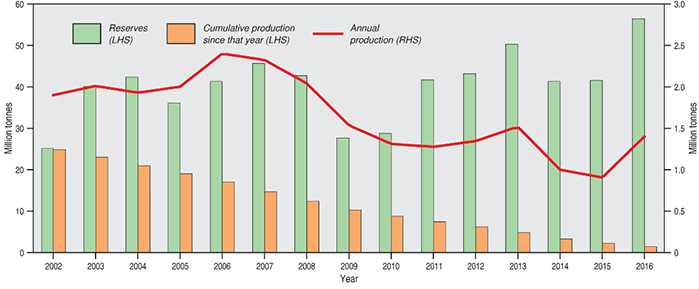
Figure 1. Ilmenite Ore Reserves and annual production 2002-2016, as well as cumulative production since each year.
LHS/RHS = refer to axis on left-hand side/right-hand side.
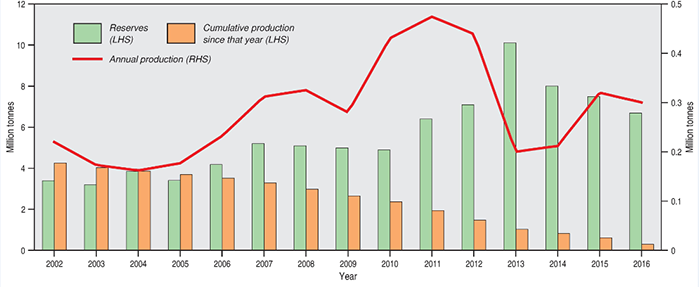
Figure 2. Rutile Ore Reserves and annual production 2002-2016, as well as cumulative production since each year.
LHS/RHS = refer to axis on left-hand side/right-hand side.
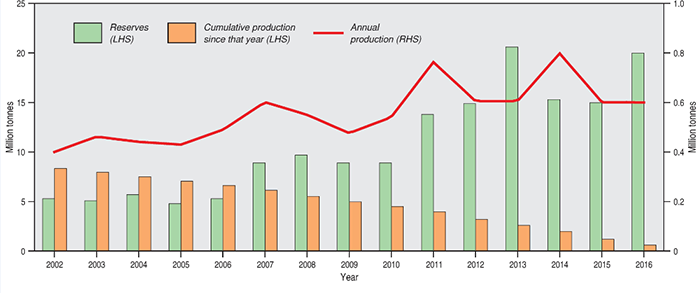
Figure 3. Zircon Ore Reserves and annual production 2002-2016, as well as cumulative production since each year.
LHS/RHS = refer to axis on left-hand side/right-hand side.
Identified Resources
Mineral sand deposits are found in every Australian state and the Northern Territory, predominantly associated with modern and ancient beaches and dunes. Deposits exist from Cape York in Queensland to central New South Wales along the coast of eastern Australia. Large relic or old beach deposits are found as far inland as Ouyen in Victoria (Wemen, Bondi, Kulwin deposits) and south-western New South Wales (Ginkgo, Snapper deposits). Deposits also exist in the Eucla Basin around the Great Australian Bight in South Australia and Western Australia. In Western Australia, deposits are distributed from the southern tip of the state to Derby and are located at the present coastline or as relic deposits up to 35 km inland.
Table 3, Table 4 and Table 5 show Australian and world resources for ilmenite, rutile and zircon, respectively, as at December 2016. Australian figures are based on Geoscience Australia data while world figures are based on United States Geological Survey data. Figure 4 shows the share of ilmenite, rutile and zircon resources in each Australian jurisdiction.
Table 3. Australia's identified ilmenite resources and world figures (million tonnes) for selected years from 1975-2016.
| Year | Demonstrated Resources | Inferred Resources2 | Accessible EDR3 | Australian Mine Production4 | World Economic Resources5 | World Mine Production5 | ||
|---|---|---|---|---|---|---|---|---|
| Economic1 | Paramarginal | Submarginal | ||||||
| 2016 | 276.9 | 26.2 | 0.03 | 235.1 | 247.0 | 1.4 | 1523.2 | 11.6 |
| 2015 | 249.56 | 26.2 | 0.03 | 276.46 | 218.26 | 0.906 | 1472.8 | 10.69 |
| 2014 | 256.9 | 26.2 | 0.03 | 255.1 | 139.3 | 1.0 | 1279.85 | 12.7 |
| 2013 | 200.2 | 30.2 | 0.03 | 259.9 | 169.6 | 1.152 | 1244.3 | 12.27 |
| 2012 | 187.0 | 30.2 | 0.03 | 219.9 | 156.4 | 1.344 | 1233.57 | 11.3 |
| 2011 | 188.9 | 30.3 | 0.03 | 182.1 | 156.0 | 1.277 | 1235.48 | 10.98 |
| 2010 | 199.5 | 38.8 | 0.03 | 128.3 | 166.6 | 1.313 | 1246 | 10.2 |
| 2009 | 200.4 | 30.2 | 0.03 | 127.1 | 167.3 | 1.534 | 1252 | 9.1 |
| 2008 | 212.3 | 23.8 | 0.1 | 123.2 | 175.9 | 2.042 | 1266 | 10.4 |
| 2007 | 221.4 | 35.3 | 0.1 | 128 | 185.0 | 2.326 | 1276 | 10.4 |
| 2006 | 218.5 | 48.8 | 0.1 | 126 | 182.0 | 2.4 | 1124 | 9.47 |
| 2005 | 214.9 | 54.3 | 0.1 | 116 | 178.4 | 2 | 1115 | 9.02 |
| 2000 | 196.0 | 51.0 | 0.1 | 97 | 2.2 | 671 | 7.16 | |
| 1995 | 135.8 | 67.2 | 0.1 | 99.1 | 2 | 582 | 6.2 | |
| 1990 | 80.7 | 75.4 | 37.7 | 1.6 | 364 | 6.8 | ||
| 1985 | 41.39 | 3.96 | 11.95 | 1.42 | 820 | 4.5 | ||
| 1980 | 43.3 | 19.01 | 1.38 | 600 | 4.7 | |||
| 1975 | 58.4 | 0.991 | 3.2 | |||||
- EDR includes Ore Reserves and most Measured and Indicated Mineral Resources reported in compliance with the JORC Code.
- Total Inferred Resources in economic, subeconomic and undifferentiated categories.
- Accessible Economic Demonstrated Resources (AEDR) is the portion of total EDR that is accessible for mining. AEDR does not include resources that are inaccessible for mining because of environmental restrictions, government policies or military lands.
- Source: Office of the Chief Economist (Resources and Energy Quarterly) and, since 2016, aggregated state and NT production statistics.
- Source: United States Geological Survey (Mineral Commodity Summaries).
- These figures have been revised from those previously reported.
Table 4. Australia's identified rutile resources and world figures (million tonnes) for selected years from 1975-2016.
| Year | Demonstrated Resources | Inferred Resources2 | Accessible EDR3 | Australian Mine Production4 | World Economic Resources5 | World Mine Production5 | ||
|---|---|---|---|---|---|---|---|---|
| Economic1 | Paramarginal | Submarginal | ||||||
| 2016 | 33.0 | 0.3 | 0.06 | 34.1 | 29.1 | 0.3 | 64.6 | 0.7 |
| 2015 | 29.66 | 0.3 | 0.06 | 39.46 | 25.76 | 0.32 | 68.5 | 0.66 |
| 2014 | 32.1 | 0.3 | 0.06 | 40.7 | 22.4 | 0.212 | 57.41 | 0.77 |
| 2013 | 32.1 | 0.3 | 0.06 | 42.3 | 28.3 | 0.2 | 56.21 | 0.57 |
| 2012 | 26.6 | 0.3 | 0.06 | 42.2 | 22.8 | 0.439 | 50.68 | 0.79 |
| 2011 | 27.2 | 0.5 | 0.06 | 40.2 | 23.9 | 0.474 | 51.28 | 0.77 |
| 2010 | 23.5 | 7 | 0.06 | 30.1 | 20.2 | 0.43 | 48 | 0.7 |
| 2009 | 22.7 | 7 | 0.06 | 31.3 | 19.4 | 0.28 | 46 | 0.5 |
| 2008 | 22.9 | 6.5 | 0.15 | 32.1 | 17.2 | 0.325 | 46 | 0.6 |
| 2007 | 23.1 | 9.6 | 0.14 | 31 | 17.4 | 0.312 | 46 | 0.6 |
| 2006 | 21.7 | 13.7 | 0.14 | 28 | 16 | 0.232 | 55 | 0.51 |
| 2005 | 20.5 | 13 | 0.1 | 29 | 14.8 | 0.177 | 51 | 0.38 |
| 2000 | 22.0 | 12 | 0.1 | 19 | 0.2 | 49.3 | 0.43 | |
| 1995 | 15.0 | 33.4 | 0.2 | 26.3 | 0.2 | |||
| 1990 | 11.6 | 39.2 | 21.3 | 0.23 | 90 | 0.5 | ||
| 1985 | 8.96 | 0.82 | 1.68 | 0.21 | 122 | 0.41 | ||
| 1980 | 8.99 | 2.24 | 0.31 | 32 | 0.44 | |||
| 1975 | 9.2 | 0.348 | 0.366 | |||||
- EDR includes Ore Reserves and most Measured and Indicated Mineral Resources reported in compliance with the JORC Code.
- Total Inferred Resources in economic, subeconomic and undifferentiated categories.
- Accessible Economic Demonstrated Resources (AEDR) is the portion of total EDR that is accessible for mining. AEDR does not include resources that are inaccessible for mining because of environmental restrictions, government policies or military lands.
- Source: Office of the Chief Economist (Resources and Energy Quarterly) and, since 2016, aggregated state and NT production statistics.
- Source: United States Geological Survey (Mineral Commodity Summaries).
- These figures have been revised from those previously reported.
Table 5. Australia's identified zircon resources and world figures (million tonnes) for selected years from 1975-2016.
| Year | Demonstrated Resource | Inferred Resources2 | Accessible EDR3 | Australian Mine Production4 | World Economic Resources5 | World Mine Production5 | ||
|---|---|---|---|---|---|---|---|---|
| Economic1 | Paramarginal | Submarginal | ||||||
| 2016 | 78.6 | 1.1 | 0.07 | 61.3 | 72.1 | 0.6 | 118.2 | 2.4 |
| 2015 | 71.06 | 1.1 | 0.07 | 73.56 | 64.46 | 0.601 | 121.12 | 2.43 |
| 2014 | 71.5 | 1.1 | 0.07 | 70.3 | 38.3 | 0.798 | 115.14 | 1.54 |
| 2013 | 57.8 | 1.1 | 0.07 | 71.6 | 51.4 | 98.9 | 1.44 | |
| 2012 | 47.4 | 1.1 | 0.07 | 68.3 | 41 | 0.605 | 88.62 | 1.41 |
| 2011 | 46.6 | 1.2 | 0.07 | 62.1 | 40.2 | 0.762 | 93.98 | 1.45 |
| 2010 | 39.4 | 10.3 | 0.07 | 34.9 | 33 | 0.54 | 89.4 | 1.24 |
| 2009 | 40 | 10.3 | 0.07 | 34.3 | 33.6 | 0.476 | 87.7 | 1.19 |
| 2008 | 39.1 | 9.8 | 0.15 | 36.5 | 30.9 | 0.55 | 87 | 1.75 |
| 2007 | 39 | 14.6 | 0.15 | 35.7 | 30.8 | 0.601 | 83 | 1.29 |
| 2006 | 33.9 | 19.9 | 0.15 | 30 | 25.7 | 0.49 | 78 | 0.93 |
| 2005 | 32.9 | 20.2 | 0.1 | 30 | 24.7 | 0.43 | 77 | 1.08 |
| 2000 | 28 | 19 | 0.2 | 23 | 0.4 | 69.3 | 0.9 | |
| 1995 | 22.5 | 24.2 | 0.2 | 20.9 | 0.5 | |||
| 1990 | 18 | 28.2 | 15.6 | 0.44 | 74 | 1 | ||
| 1985 | 11.49 | 2.04 | 2.42 | 0.45 | 44 | 0.79 | ||
| 1980 | 12.94 | 4.55 | 0.49 | 36 | 0.66 | |||
| 1975 | 15.73 | 0.382 | 0.51 | |||||
- EDR includes Ore Reserves and most Measured and Indicated Mineral Resources reported in compliance with the JORC Code.
- Total Inferred Resources in economic, subeconomic and undifferentiated categories.
- Accessible Economic Demonstrated Resources (AEDR) is the portion of total EDR that is accessible for mining. AEDR does not include resources that are inaccessible for mining because of environmental restrictions, government policies or military lands.
- Source: Office of the Chief Economist (Resources and Energy Quarterly) and, since 2016, aggregated state and NT production statistics.
- Source: United States Geological Survey (Mineral Commodity Summaries)
- These figures have been revised from those previously reported.
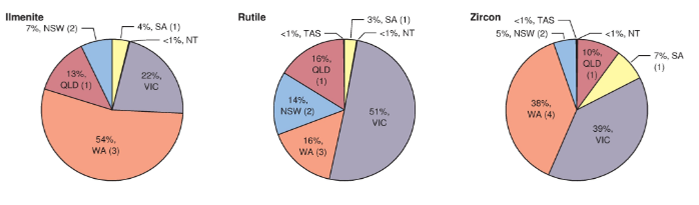
Figure 4. Distribution of ilmenite, rutile and zircon EDR in Australian states and Northern Territory, as at December 2016. Where applicable, the number of operating mines is in brackets after the percentage of EDR for each jurisdiction.
When EDR, rather than just Ore Reserves, are considered, Figure 5, Figure 6 and Figure 7 demonstrate the vast inventory of Australian mineral sands. Over the longer time period of 40 years, cumulative production of 66.7 Mt of ilmenite, 10.6 t of rutile and 20.0 Mt of zircon has removed more material than was estimated as EDR back in 1975 (58.4 Mt for ilmenite, 9.2 Mt for rutile and 15.7 Mt for zircon), yet EDR has grown enormously since 1975 with all of the exploited mineral sands replaced many times over.
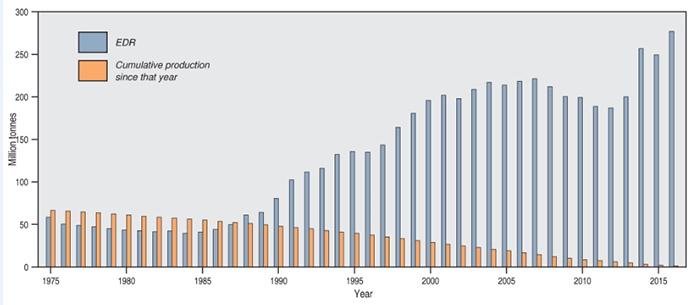
Figure 5. Economic Demonstrated Resources of ilmenite 1975-2016, as well as cumulative production since each year.
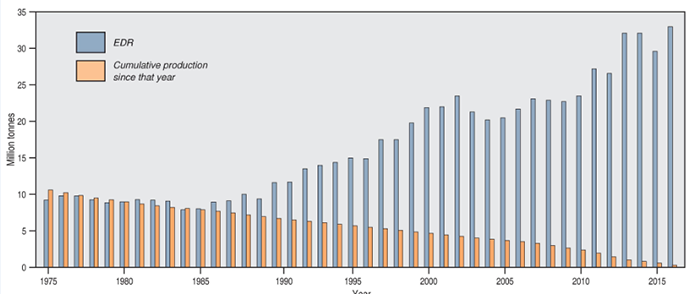
Figure 6. Economic Demonstrated Resources of rutile 1975-2016, as well as cumulative production since each year.
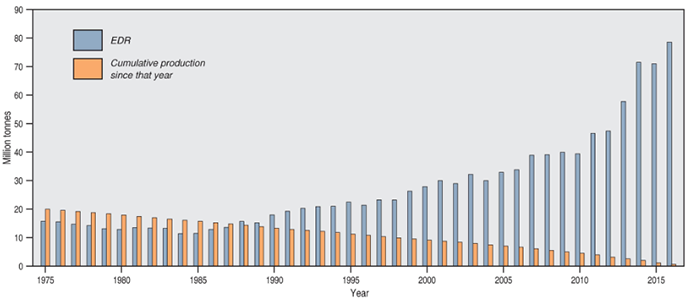
Figure 7. Economic Demonstrated Resources of zircon 1975-2016, as well as cumulative production since each year.
Increases in mineral sands EDR (as well as Inferred Resources) from 1996 to 2003 (Figure 8, Figure 9 and Figure 10) resulted from discovery and subsequent evaluation drilling of heavy mineral sand deposits in the Murray Basin which include the Ginkgo and Snapper deposits in New South Wales, Douglas-Bondi and Woornack deposits in Victoria, and the Mindarie project in South Australia. In addition, from 1998 onwards, there were progressive increases in resources at mineral sand deposits at Jacinth-Ambrosia and Cyclone in the Eucla Basin embracing parts of South Australia and Western Australia, in the North Swan Coastal Plain area north of Perth and the Blackwood Plateau region in Western Australia. From 2007 to 2012, the EDR of ilmenite declined (Figure 8) owing to reclassification of some resources to lower resource categories but has since increased due to new resource delineation, particularly in Western Australia.
Over the last 40 years, the mineral sands inventory has increased rapidly. From 1975 to 2016:
- ilmenite EDR increased 370% from 58.4 Mt to 276.9 Mt (Figure 8)
- rutile EDR increased 260% from 9.2 Mt to 33.0 Mt (Figure 9)
- zircon EDR increased 400% from 15.7 Mt to 78.6 Mt (Figure 10).
Mineral sands production over this period, however, has seen slower increases for ilmenite and zircon and a decrease for rutile. From 1975 to 2016:
- ilmenite production increased 40% from 0.99 Mt to 1.40 Mt (Figure 8)
- rutile production decreased 14% from 0.35 Mt to 0.30 Mt (Figure 9)
- zircon production increased 58% from 0.38 Mt to 0.60 Mt (Figure 10).
Since 1976, total mineral sand resources (EDR + Subeconomic + Inferred) have increased almost 750% for ilmenite (Figure 8), 500% for rutile (Figure 9) and 650% for zircon (Figure 10). Thus, at current rates of production, and even with increased rates of production, Australia has the potential to remain a top global producer for many decades.
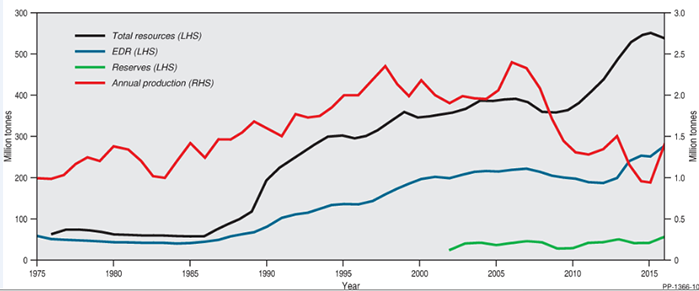
Figure 8. Trends in total resources, Economic Demonstrated Resources, Ore Reserves and annual production of ilmenite, 1975-2016.
LHS/RHS = refer to axis on left-hand side/right-hand side.
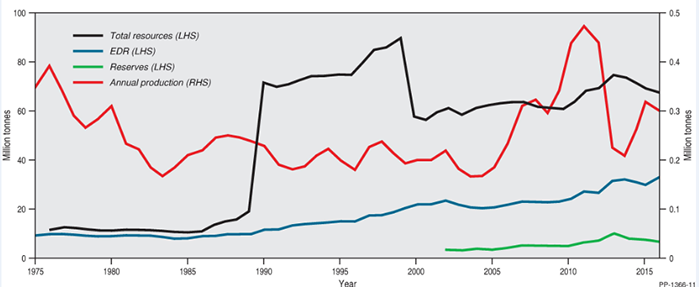
Figure 9. Trends in total resources, Economic Demonstrated Resources, Ore Reserves and annual production of rutile, 1975-2016.
LHS/RHS = refer to axis on left-hand side/right-hand side.
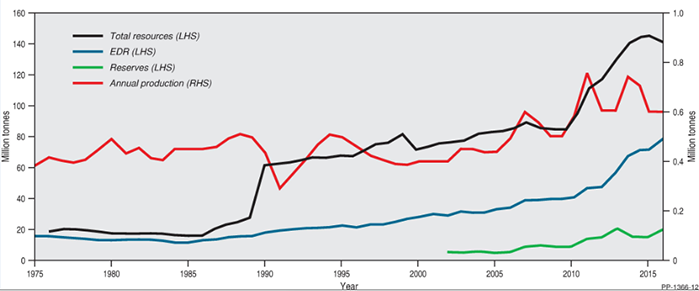
Figure 10. Trends in total resources, Economic Demonstrated Resources, Ore Reserves and annual production of zircon, 1975-2016.
LHS/RHS = refer to axis on left-hand side/right-hand side.
Accessible EDR
Some of Australia's mineral sands EDR are located in areas that are quarantined from mining because they are designated national parks, military zones or other areas with restrictions on mining. Geoscience Australia estimates that around 89% of Australia's ilmenite, 88% of rutile and 92% of zircon EDR are accessible for mining. Deposits that are inaccessible for mining include Moreton Island, Bribie Island, Fraser Island, the Cooloola sand mass, the Byfield sand mass and the Shoalwater Bay area, all in Queensland, and the Yuraygir, Bundjalung, Hat Head and Myall Lakes National Parks in New South Wales.
Exploration
Exploration expenditure across all commodities has trended downward since the exploration peak circa 2012. However, some commodities have begun to exhibit slowing downward trends and, in some cases, tentative upward trends in recent quarters. Mineral sands exploration in 2016 was $19.4 million1, down 19% on 2015 expenditure ($23.9 million). In 2016, mineral sands exploration expenditure comprised around 1% of total Australian exploration spend ($1426 million).
Production
In 2016, Australia produced 1.4 Mt of ilmenite, 0.3 Mt of rutile and 0.6 Mt of zircon (Table 2). Of the three commodities, only ilmenite production substantially changed, up 56% from 0.9 Mt in 2015 (Table 1).
In the same period, Australia exported about 0.611 Mt of ilmenite concentrate, 0.217 Mt of rutile concentrate and 0.560 Mt of zircon concentrate2 .
World Ranking
The United States Geological Survey compiles international mineral resources and production data. These data for 2016, in conjunction with Australian mineral sands resources and production data from Geoscience Australia, show that Australia is ranked first globally for rutile and zircon resources and second for ilmenite (Table 6). Australia is also a top mineral sands producer, ranked first in the world for rutile and zircon and third for ilmenite after South Africa and China (Table 6).
Table 6. Australia's world ranking for economic resources and production of mineral sand commodities as at December 2016.
| Commodity | Resources | Production |
|---|---|---|
| Ilmenite | 2 | 3 |
| Rutile | 1 | 1 |
| Zircon | 1 | 1 |
Industry Developments
In 2017, Sheffield Resources Limited increased the Proved Ore Reserve for its Thunderbird Project in Western Australia to 235.8 Mt @ 13.3% heavy minerals (HM). This increase is the result of an upgrading of reserves previously classified as Probable. The total Ore Reserve for the project is 680.5 Mt @ 11.3% HM, including in-situ mineral grades of 0.87% zircon, 0.27% HiTi leucoxene, 0.26% leucoxene and 3.10% ilmenite. The company reports that tests show Thunderbird low-temperature roast ilmenite to be high grade with low impurities and high reactivity. A bankable feasibility study released in early 2017 forecast total earnings before interest, taxes, depreciation and amortization (EBITDA) of $5.1 billion over a 42-year mine life. In June 2017, the company announced that the National Native Title Tribunal had determined that Mining Lease 04/459, on which Thunderbird is located, could be granted. Work to obtain environmental approvals and off-take negotiations are continuing. Construction is scheduled to begin in late 2017 with commissioning and initial production slated for 2019. As of May 2017, Sheffield had off-take agreements with companies in India, Spain and China for the sale of about 70% of the premium zircon, 45% of the zircon concentrate and 45% of the low temperature roast ilmenite produced from the first stage of the Thunderbird project.
Image Resources NL announced the results of a 10-hole, 468 m drilling and assay program that confirms a 5.6 km extension of its Boonanarring deposit in southwest Western Australia. Notable drilling intersections include 8 m @ 23.8% HM, 8 m @ 21.1% HM and 8 m @ 16.3% HM. The total estimated mineral resources of the deposit are 43.8 Mt @ 5.6% HM with 18.1% of HM as high-value zircon and 72% of HM as valuable heavy minerals. As at March 2017, the company had secured a mining lease and general purpose lease, EPBC approval, landowner agreements and a groundwater abstraction licence. Work on project management and radiation management plans, works approval and mining proposal was ongoing. In May 2017, the company released a strong bankable feasibility study for its Boonanarring and Atlas deposits and announced a 100% offtake agreement with a Chinese heavy mineral concentrate (HMC) processing company. Image aims for first production in early 2018.
MZI Resources Limited opened its Keysbrook mineral sands operation in Western Australia in April 2016. The project is a major producer of leucoxene and zircon. In March 2017, the company announced it had successfully started up and commissioned a new mobile Mining Field Unit. Use of the new unit is expected to shorten significantly ore haulage distances, increase production and reduce maintenance and operating costs. The company also holds exploration tenements elsewhere in Western Australia and the Tiwi Islands in the Northern Territory.
Strandline Resources Limited reports it has completed a definitive feasibility study for its Coburn project in Western Australia, and that the project is fully permitted and construction-ready.
Iluka Resources Limited holds exploration and mining tenements in Australia's Murray, Eucla and Perth basins with estimated total mineral resources of 108.9 Mt in-situ HM, including 16.7 Mt of Ore Reserves. The company has mining operations at Jacinth-Ambrosia in the Eucla Basin and Tutunup South in the Perth Basin. In response to low-cycle market conditions, mining operations at Jacinth-Ambrosia were suspended for 18-24 months in April 2016. In June 2017, Iluka announced that mining operations would recommence in December 2017 due to improving mineral sand markets, a tightening zircon market, and the substantial drawdown of the company's HMC inventory during 2017.
Iluka has completed a definitive feasibility study for its Cataby deposit in Western Australia. The deposit is execute-ready and off-take arrangements are currently being sought. When operational, it is estimated the deposit will produce around 380 kt of ilmenite, 30 kt rutile and 50 kt zircon annually. The ilmenite will be used as a feed source for Iluka's Synthetic Rutile kiln 2 in southwest Western Australia. Further production capacity is expected from the company's Balranald and Nepean deposits in the Murray Basin, New South Wales. A definitive feasibility study completed in 2016 favoured underground mining using directional drilling technology as a less capital-intensive option offering flexible production expansion and lower environmental impact. Further evaluation of this option will take place in 2017. Due to the unconventional nature of the Balranald project with new mining technology being tested before use, commercial HMC production is not expected before 2021. Greenfield exploration has been undertaken in the Murray Basin and Canning Basin, and is planned for the Eucla Basin in 2017.
Following reanalysis of recent (2015-2016) and historic (1998-2002) drill-hole data, Broken Hill Prospecting Limited announced a significant upgrade of resources estimates for its Copi North heavy mineral sands deposit in western New South Wales. The estimated deposit tonnage increased by 22% from 11.6 Mt to 14.2 Mt with 77% of the resource in the Indicated category, up from 60%. The deposit strike length increased by 2.6 km to 16 km. Total heavy mineral content is estimated to be 6.6%, comprising ilmenite (54.4%), rutile (10.8%), zircon (11.3%), monazite (1%), leucoxene (10%) and other heavy minerals (12.6%). The reanalysed data also prompted the company to apply for exploration licences over other areas in the New South Wales Murray Basin. In June 2017, it announced it had been granted an additional three tenements ¿ Tararra (EL8558), Central Para (EL8559) and Budgeree (EL8560). Priority targets already identified in the Central Para tenement include the Jaws and Gilligans strands. With the granting of the additional tenements, Broken Hill Prospecting holds the third largest tenement portfolio in the Murray Basin after Iluka Resources and Cristal Mining Australia Limited.
Astron Corporation Limited is finalising a definitive feasibility study for its Donald project in northwestern Victoria for release in early 2017. The company is working towards satisfying contract requirements for the supply and installation of mining unit and wet concentration plants for the first phase of the project. It reports a Measured and Indicated Mineral Resource of 3526 Mt @ 3.2% HM.
Following the completion of two drilling programs over 12 months, WIM Resource Pty Ltd announced a Maiden Inferred Resource estimate of 205 Mt @ 2.7% for its Bungalally project. The deposit is located approximately 10 km south of Horsham in western Victoria within the Loxton Parilla Sands, which host a variety of mineral sands projects. Testing indicates 35% ilmenite, 21% zircon, 17% leucoxene, 2% rutile, 11.8% anatase and 1.4% monazite content in the mineral assemblage.
Diatreme Resources Limited announced in January 2017 it had signed a compensation and conduct agreement with traditional land owners for the Cape Bedford silica and mineral sands project in north Queensland. Limited exploration work has shown elevated mineral content at two sites. The signing of the agreement will allow a tenement exploration program to begin.
In February 2017, NSYE-listed Tronox Limited announced plans to acquire Saudi company Cristal Global's TiO2 business for US$1.673 billion cash plus Class A shares representing 24% ownership in Tronox. The funds are expected to be raised through the sale of Tronox assets and cash on hand. Tronox's Australian assets include the Cooljarloo mine and concentration plant, Chandala processing plant, Cooljarloo West deposit and Dongara project, all in Western Australia. Through its Australian subsidiary, Cristal Mining Australia, Cristal has extensive mineral sands interests in the Perth Basin in Western Australia and the Murray Basin in New South Wales and Victoria. The acquisition is expected to close by the first quarter 2018. Tronox will remain NYSE-listed and incorporated in Western Australia and will become the world's largest TiO2 pigment producer.
Citation
Bibliographical reference: Hitchman, A.P., 2018. Australian Resource Reviews: Mineral Sands 2017. Geoscience Australia, Canberra. http://dx.doi.org/10.11636/9781925297706
References
1 Australian Bureau of Statistics, www.abs.gov.au, data set 8412.0
2 Office of the Chief Economist, Resources and Energy Quarterly, December 2017.