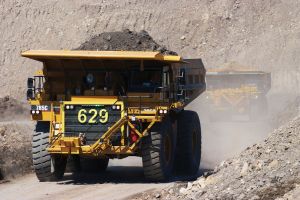
Australia has a robust and world-leading mining industry evidenced by a top five position as a producer for some 16 commodities including gold, bauxite, iron ore, rare earths, mineral sands, zinc, nickel and coal. In 2018, Australia’s mineral exports (excluding petroleum products) amounted to $201 billion which was 58% of all export merchandise and 46% of all exported goods and services1. In 2018, mining accounted for 8.4% of gross domestic product2. In addition, the mining industry employed some 241 000 people in 2018, with many more employed by related industries3.
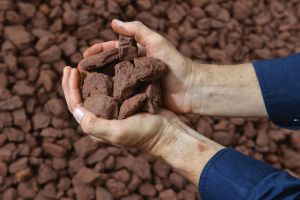
The major commodities of iron ore, black coal, gold, aluminium and copper contributed some $174 billion to Australia’s export income in 20181. Australia is also richly endowed with many other minerals, particularly those that are regarded as critical, or strategic, minerals by many trading partners. Growing markets for these commodities, particularly for those associated with emerging technologies such as battery storage, renewable energy and electric vehicles have stimulated exploration and resource delineation in Australia in recent years.
Geoscience Australia and its predecessors have prepared the annual assessment of Australia’s mineral resources since 1975. Thus, this publication—Australia’s Identified Mineral Resources (AIMR)—is able to draw on more than 40 years of data to reveal trends in reserve estimates, resource estimates and mine production over a range of periods. This assessment also provides useful long-term indicators of potential resource life and future supply capability. AIMR is designed to assist government policy decision making, enable mineral sector program planning, and contribute to the sustainable development of Australia’s mineral resources.
AIMR presents Australia’s Ore Reserves at operating mines (Table 1) and all deposits (Table 2), and also longer-term estimates of the nation’s Identified Mineral Resources (Table 3) and changes in resource estimates from the previous year (Table 4). AIMR also provides useful comparisons of the mine inventory as a proportion of the national inventory (Table 5), national reserves as a proportion of national resources (Table 6) and insights into the distribution of Australia’s mineral wealth within the largest deposits (Table 7). It is also of interest to note Australia’s ranking as a global source of minerals as many countries are dependent on reliable supply from Australia for their own economies (Table 8).
The estimates in AIMR 2019 of Australia’s Ore Reserves and Mineral Resources are as at 31 December 2018. The data in the national minerals inventory is sourced primarily from published company reports but includes some confidential and historical data. The category of highest geological and economic confidence in the national inventory is Economic Demonstrated Resources (EDR) which, in essence, combines the Joint Ore Reserves Committee (JORC) Code categories of Proved and Probable Ore Reserves and most of Measured and Indicated Mineral Resources.
Mine production figures are sourced from the Office of the Chief Economist at the former Department of Industry, Innovation and Science, state government publications and company reports. World rankings of Australia’s mineral resources have been calculated mainly using information published by the United States Geological Survey (USGS).
1 Office of the Chief Economist, Resources and Energy Quarterly, December 2019, Table 17. Department of Industry, Innovation and Science.
2 Australian Bureau of Statistics (ABS), Australian National Accounts, National Income, Expenditure and Product, cat. no. 5206.0, Figure of 8.4% calculated by dividing Mining (B) Table 45 by Gross Domestic Product Current Table 1.
3 Australian Bureau of Statistics. Labour Force, Australia, Detailed, Quarterly, cat. no. 6291.055.003, August 2019 Table 4.
Contact Details
Email: mineral.promotions@ga.gov.au
Department of Industry, Science, Energy and Resources
Minister for Resources, Water and Northern Australia: The Hon Keith Pitt MP
Secretary: Mr David Fredericks PSM
Geoscience Australia
Chief Executive Officer: Dr James Johnson
This product is published with the permission of the CEO, Geoscience Australia.
Geoscience Australia has tried to make the information in this product as accurate as possible. However, it does not guarantee that the information is totally accurate or complete. Therefore, you should not solely rely on this information when making a commercial decision.
Geoscience Australia is committed to providing web accessible content wherever possible. If you are having difficulties accessing this document please email clientservices@ga.gov.au.
ISSN: 1327-1466
eCat ID: 132457
Bibliographical reference
Senior, A., Britt, A., Summerfield, D., Hughes, A., Hitchman, A., Cross, A., Champion, D., Huston, D., Bastrakov, E., Sexton, M., Moloney, J., Pheeney, J. and Schofield, A., 2020. Australia’s Identified Mineral Resources 2019.
Geoscience Australia, Canberra. http://dx.doi.org/10.11636/1327-1466.2019