Cooper Basin Prospectivity Study
Page last updated:1 June 2016
Overview
Australia is a leading player in the global oil and natural gas industry and is poised to become the world's largest liquefied natural gas (LNG) exporter within this decade. However, further resources need to be identified to provide feed stocks to the LNG terminals located on the northern, eastern and western sides of the continent.
One objective of Geoscience Australia's Energy Systems Branch (ESB) is to understand the petroleum resource potential of both frontier and mature sedimentary basins in Australia which can be achieved by mapping source rock occurrence, thickness, quality and maturity, and the distribution and volumes of oil and gas. The ESB is now undertaking a series of studies focussing on the geological (sequence stratigraphic, structural, and palaeoenvironmental) controls on the deposition of source rock facies, and the geochemistry of source rocks and their generated petroleum fluids. These studies will address nationally significant questions relating to Australia's total petroleum systems by enabling the better prediction of source rock distribution and the typing of hydrocarbons to their source kitchens.
The source rocks of the Cooper Basin are the first to be assessed as part of this work program (Figure 1), in collaboration with the Department of State Development, South Australia and the Geological Survey of Queensland. The basin is Australia's premier onshore hydrocarbon producing province and is nationally significant in providing gas to the East Coast Gas Market. The basin also hosts a range of unconventional gas play types within the Permian Gidgealpa Group, including basin-centred gas and tight gas accumulations, deep dry coal gas associated with the Patchawarra and Toolachee formations and the Murteree and Roseneath shale gas plays (e.g. Goldstein et al. 2012; Hall et al., 2015a, 2016c; Carr et al., 2016).
The principal source rocks for these plays are the Permian coals and coaly shales of the Gidgealpa Group (Gravestock et al., 1998; Draper, 2002), so mapping the petroleum generation potential of these source rocks, together with describing the resulting fluid composition, is critical for understanding the hydrocarbon prospectivity of the basin.
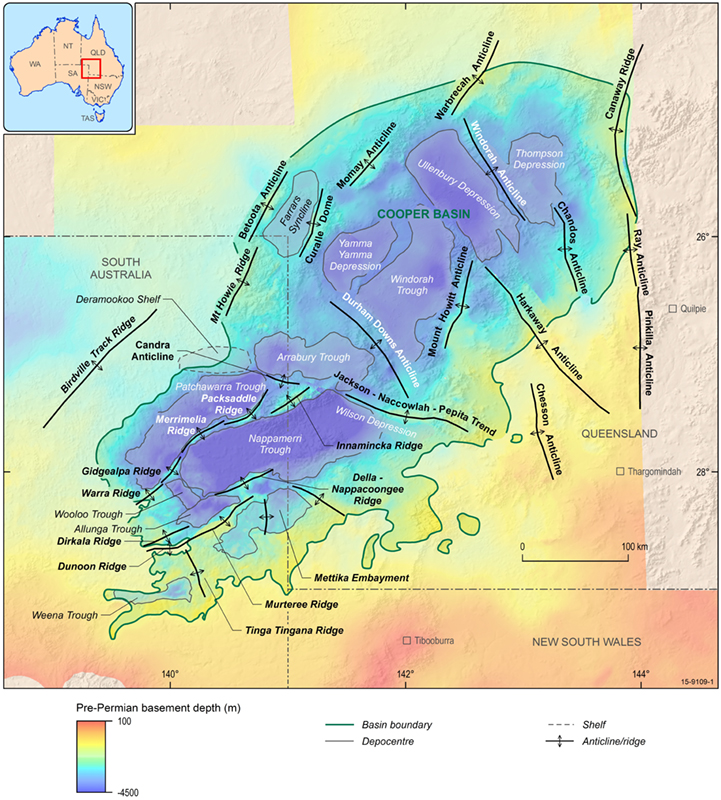
Figure 1. Structural elements of the Cooper Basin overlain on a structure contour map of the top pre-Permian basement surface.
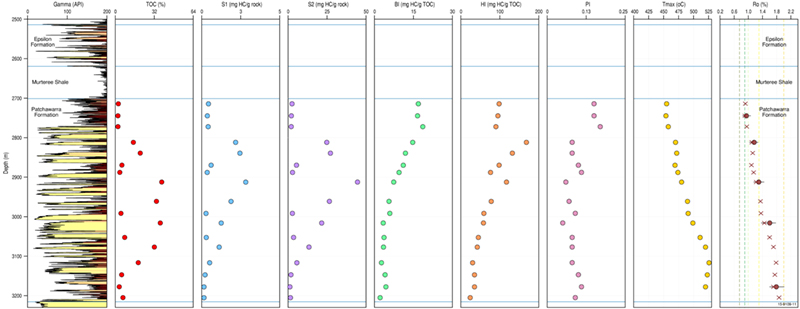
Figure 2. Source rock geochemistry and maturity data.
Workflow and Products
A 3D basin model, characterising regional basin architecture, has been constructed through the integration of existing horizons with formation tops and seismic interpretations. Isopach maps, extracted from the model, highlight the extent and gross thickness of each key formation containing key source, reservoir and seal intervals (Hall et al., 2015a).
Source rock distribution, amount and quality have been reviewed through the analysis of log data and organic geochemical data (including new sample data), characterising source rocks across the whole basin (Kuske et al., 2015; Hall et al., 2015a; Hall et al., 2016a,c). The net source rock thickness of coals and coaly shales were mapped for the Toolachee, Daralingie, Epsilon and Patchawarra formations using electrofacies analysis studies. The quantity, quality, kerogen type, thermal maturity and distribution of the organic matter are investigated for each source rock using an updated compilation of all open file Total Organic Carbon (TOC), Rock-Eval pyrolysis and vitrinite reflectance data (Hall et al., 2016a,c). Additional Rock-Eval pyrolysis analyses and vitrinite reflectance measurements were conducted to ensure a full range of source rock maturities were included in the sample set (Figure 2).
Five Permian Cooper Basin source rocks were analysed for petroleum generation potential and PhaseKinetic characterisation (Mahlstedt et al., 2015). The modelled decrease in Hydrogen Index (HI) with increasing maturity is verified through comparison with observed data trends. The kinetics models and observed data trends were used to estimate oil and gas windows for the basin.
Petroleum systems modelling, incorporating new Cooper-specific kinetics, highlight the abundance of potential source rock facies across the basin and variations in their distribution and thickness both spatially and by formation (Figure 3; Hall et al., 2016h).
1D burial history and maturity models were constructed for over 90 wells across the basin. Key variables influencing the thermal history include: higher radiogenic heat production associated with the Big Lake suite granodiorites, Late Cretaceous uplift and erosion of the Winton Formation and the thermal blanketing effect of the thick Permian coals. The 1D burial and thermal history models were integrated with the 3D basin model and source rock property data to create a multi-1D petroleum systems model (Hall & Palu, 2016; Hall et al., 2016h). Key outputs include maturity and hydrocarbon generation maps (Figure 4). A probabilistic modelling approach was applied to better quantify the uncertainty associated with source rock generation potential, aiding the evaluation of the main exploration risks.
The systematic workflow applied here demonstrates the importance of integrated geochemical and petroleum systems modelling studies as a predictive tool for understanding the petroleum resource potential of Australia's sedimentary basins. Results highlight that the best source rocks in the Cooper Basin are the Patchawarra coals and coaly shales, followed by those of the Toolachee Formation. The broad extent of the Permian source kitchen and its large generation potential highlight the significance of the basin as a world class hydrocarbon province.
The new precompetitive data and analyses from these studies will help de-risk key exploration issues associated with known Australian source rocks and will aid in the identification of new prospective energy provinces across the country. The geological datasets produced as part of this study have also contributed to range of other Geoscience Australia activities, including the Cooper Basin petroleum resource assessment, the Cooper basin bioregional assessment (Smith et al., 2015) and the CO2CRC (Golding et al., 2016).
The results presented here are being published as a series of public reports (Hall et al., 2015a, 2016a,h; Mahlstedt et al., 2016) and datasets (Hall & Palu; 2016; Hall et al., 2016b,c,d,e). All reports and datasets available from the Geoscience Australia website to date are listed below.
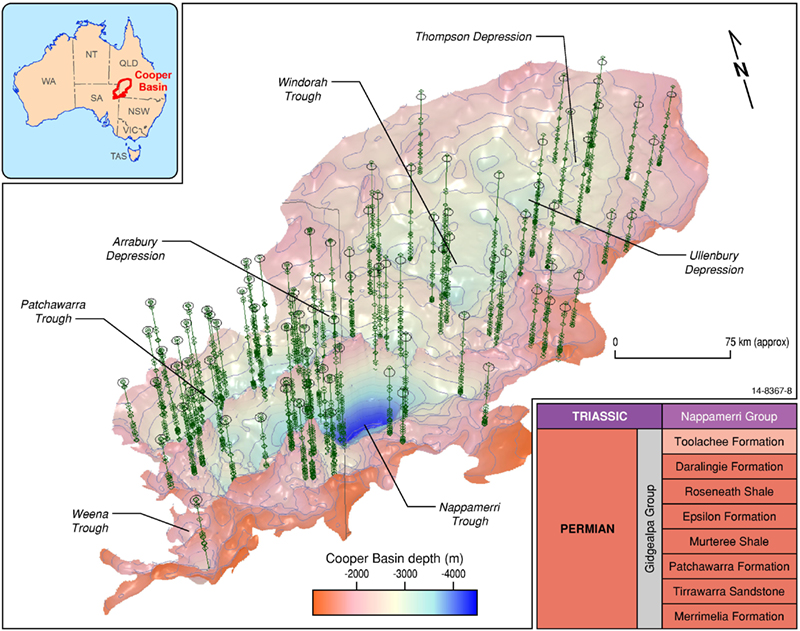
Figure 3. 3D perspective image of the regional 3D Cooper Basin model.
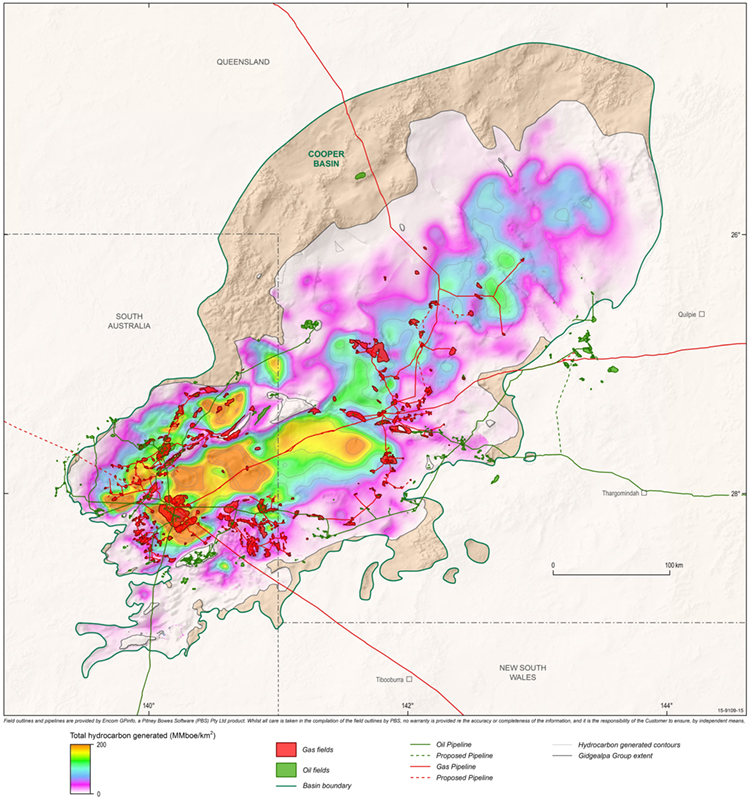
Figure 4. Map of the combined modelled volume of hydrocarbons generated from all Permian source rocks.
Reports
- Public talk for on demand viewing
- Hall, L.S., Palu, T.J., Edwards, D.S. & Boreham, C.J., 2016. The Cooper Basin petroleum prospectivity study, presented as part of the 2016 Distinguished Geoscience Australia Lecturer series.
- Geoscience Australia records and other reports
- Carr, L K., Korsch, R.J., Palu. T.J. & Reese, B. 2016. Onshore Basin Inventory: the McArthur, South Nicholson, Georgina, Wiso, Amadeus, Warburton, Cooper and Galilee basins, central Australia. Record 2016/04. Geoscience Australia, Canberra.
- Golding, S.D., Dawson, G.K.W., Pearce, J.K., Farrajota, F., Mernagh, T., Boreham, C., Hall L.S., Palu, T.J. & Sommacal, S. 2016. Great Artesian Basin Authigenic Carbonates as Natural Analogues for Mineralisation Trapping. CO2CRC Project 1.5.2 ANLEC Project 7-1011-0189. CO2CRC Report No RPT16-5497.
- Hall, L.S., Hill, A., Troup, A., Korsch, R., Radke, B., Nicoll, R.S., Palu, T., Wang, L. & Stacey, A. 2015a. Cooper Basin architecture and lithofacies: regional hydrocarbon prospectivity of the Cooper Basin, Part 1. Record 2015/31. Geoscience Australia, Canberra.
- Hall, L.S., Boreham, C.J., Edwards, D.S., Palu, T.J., Buckler, T., Hill, A.J. & Troup, A. 2016a. Cooper Basin Source Rock Geochemistry: Regional Hydrocarbon Prospectivity of the Cooper Basin, Part 2. Record 2016/06. Geoscience Australia, Canberra.
- Hall, L.S., Palu, T.J., Murray, A.P., Boreham, C.J., Edwards, D.S., Hill, A.J. & Troup, A. 2016h. Cooper Basin Petroleum Systems Analysis: Regional Hydrocarbon Prospectivity of the Cooper Basin, Part 3. Record 2016/29. Geoscience Australia, Canberra.
- Mahlstedt, N., di Primo, R., Horsfield, B. & Boreham, C.J., 2015. Multi-component kinetics and late gas potential of selective Cooper Basin source rocks. Record 2015/019. Geoscience Australia, Canberra.
- Smith, M.L., Cassel, R. & Hall, L.S. Context statement for the Cooper subregion Product 1.1 for the Cooper subregion from the Lake Eyre Basin Bioregional Assessment.
- Geoscience Australia data packages
- Hall, L.S. & Palu, T.J. 2016. Cooper Basin regional petroleum systems model. Geoscience Australia, Canberra.
- Hall, L.S., Hill, A. J., Troup, A., Lawson, C., Wang, L. & Smith. M. 2016b. Cooper Basin Architecture and Lithofacies: Regional Hydrocarbon Prospectivity of the Cooper Basin, Data Pack 1. Geoscience Australia, Canberra.
- Hall, L.S., Boreham, C.J., Edwards, D.S., Palu, T.J., Buckler, T., Hill, A.J., Troup, A. and Lawson, C. 2016c. Cooper Basin Source Rock Geochemistry: Regional Hydrocarbon Prospectivity of the Cooper Basin, Data Pack 2. Geoscience Australia, Canberra.
- Hall, L.S., Palu, T. J., Boreham, C., Edwards, D., Hill, A. J., Troup, A. & Lawson, C. 2016d. Cooper Basin Petroleum Systems Analysis, Regional Hydrocarbon Prospectivity of the Cooper Basin, Data Pack 3. Geoscience Australia, Canberra.
- Hall, L.S., Lawson, C., Edwards, D., Boreham, C., Palu, T. J., Hill, A.J. & Troup, A. 2016e. Cooper Basin Source Rock Atlas GIS. Geoscience Australia: Canberra.
- Conference presentations
- Kuske, T.J., Hall, L.S., Hill, A.J., Troup, A.J., Edwards, D.S., Boreham, C.J. & Buckler, T. 2015. Source rocks of the Cooper Basin. Search and Discovery Article #90217, AAPG/SEG International Conference & Exhibition, Melbourne, Australia, September 13-16, 2015
- Hall, L.S., Palu, T.J., Edwards, D.S., Boreham, C.J., Hill, A.J., Troup, A.J. & Henson, P. 2016f. Cooper Basin Source Rock Atlas. 2016 APPEA conference poster and extended abstract.
- Hall, L.S., Palu, T.J., Edwards, D.S., Boreham, C.J., Hill, A.J. & Troup, A.J. 2016g. Regional Petroleum Prospectivity of the Cooper Basin. 2016 Digging Deeper conference presentation
- Hall, L.S., Hill, A.J., Wang, L., Edwards, D.S., Palu, T.J., Troup, A.J. & Boreham, C.J. 2015b. Petroleum Systems Modelling for Unconventional Play Analysis in the Cooper Basin, Australia. Search and Discovery Article #10818, adapted from oral presentation given at AAPG/SEG International Conference & Exhibition, Melbourne, Australia, September 13-16, 2015,
- Hall, L.S., Hill, A.J., Palu, T.J., Edwards, D.S., Budd, A.R., Troup, A, Boreham, C.J., Wang, L. & Smith, M., 2015b. Cooper Basin Prospectivity Studies Update. - SA Oil and Gas Roundtable Presentation
- Hall, L.S., Hill, A.J., Edwards, D.S., Kuske, T.J., Troup, A & Boreham, C.J., 2015c. Unconventional hydrocarbon prospectivity of the Cooper Basin - 2015 APPEA conference presentation and extended abstract.
- Edwards, D.S., Hall, L.S. and Ayling, B., 2014. Geochemical Applications and Petroleum Systems Modelling to Investigate Petroleum Prospectivity; Case Studies from the Georgina and Cooper Basin. RIU Good Oil Conference, 9-10 September 2014, Perth, Australia. Oral Presentation.
- Other key reference
- Draper, J.J. (ed.) 2002. Geology of the Cooper and Eromanga Basins, Queensland. Queensland Government, Natural Resources and Mines, Queensland Mineral and Energy Review Series.
- Goldstein, B., Menpes, S., Hill, A., Wickham, A., Alexander, E., Jarosz, M., Pepicelli, D., Malavazos, M., Staritski, K., Taliangis, P., Coda, J., Hill, D. & Webb, M. 2012. Roadmap for Unconventional Gas Projects in South Australia. South Australia Department for Manufacturing, Innovation, Trade, Resources and Energy, Energy Resources Division.
- Gravestock, D.I., Hibburt, J.E. & Drexel, J.F. (eds.) 1998. Petroleum geology of South Australia, Volume 4: Cooper Basin. South Australia Department of Industries and Resources, Report Book, 1998/9.