Australia's Energy Commodity Resources 2026 Coal
Page last updated:10 August 2026
Black Coal
|
TDR 1,981,889 PJ (1.1%) | |
|
EDR 1,877,705 PJ (1.2%) |
|
Production 11,398 PJ (5.7%) | |
|
Exports 10,057 PJ (4.7%) $91.4 b (38.0%) |
|
Production World Ranking 5 (5%) | |
|
Export World Ranking 2* (25%) |
Brown Coal
|
TDR 3,247,899 PJ (-) | |
|
EDR 730,660 PJ (-) |
|
Production 416 PJ (3.8%) | |
|
Exports nil |
|
Production World Ranking 8 (3%) | |
|
Export World Ranking - (-) |
Notes
Statistics are for 2024 except production and export income that are reported on a financial year basis (2023–24). Percentage increases or decreases are in relation to 2023. World rankings are followed by percentage share in brackets *Australia ranks second behind Indonesia for total (black and brown) coal exports with 25% (>9,000 PJ) of world coal exports (Energy Institute, 2025). TDR = total demonstrated resources (the sum of economic and subeconomic demonstrated resources); EDR = economic demonstrated resources; PJ = petajoules; $b = billion dollars (Australian).
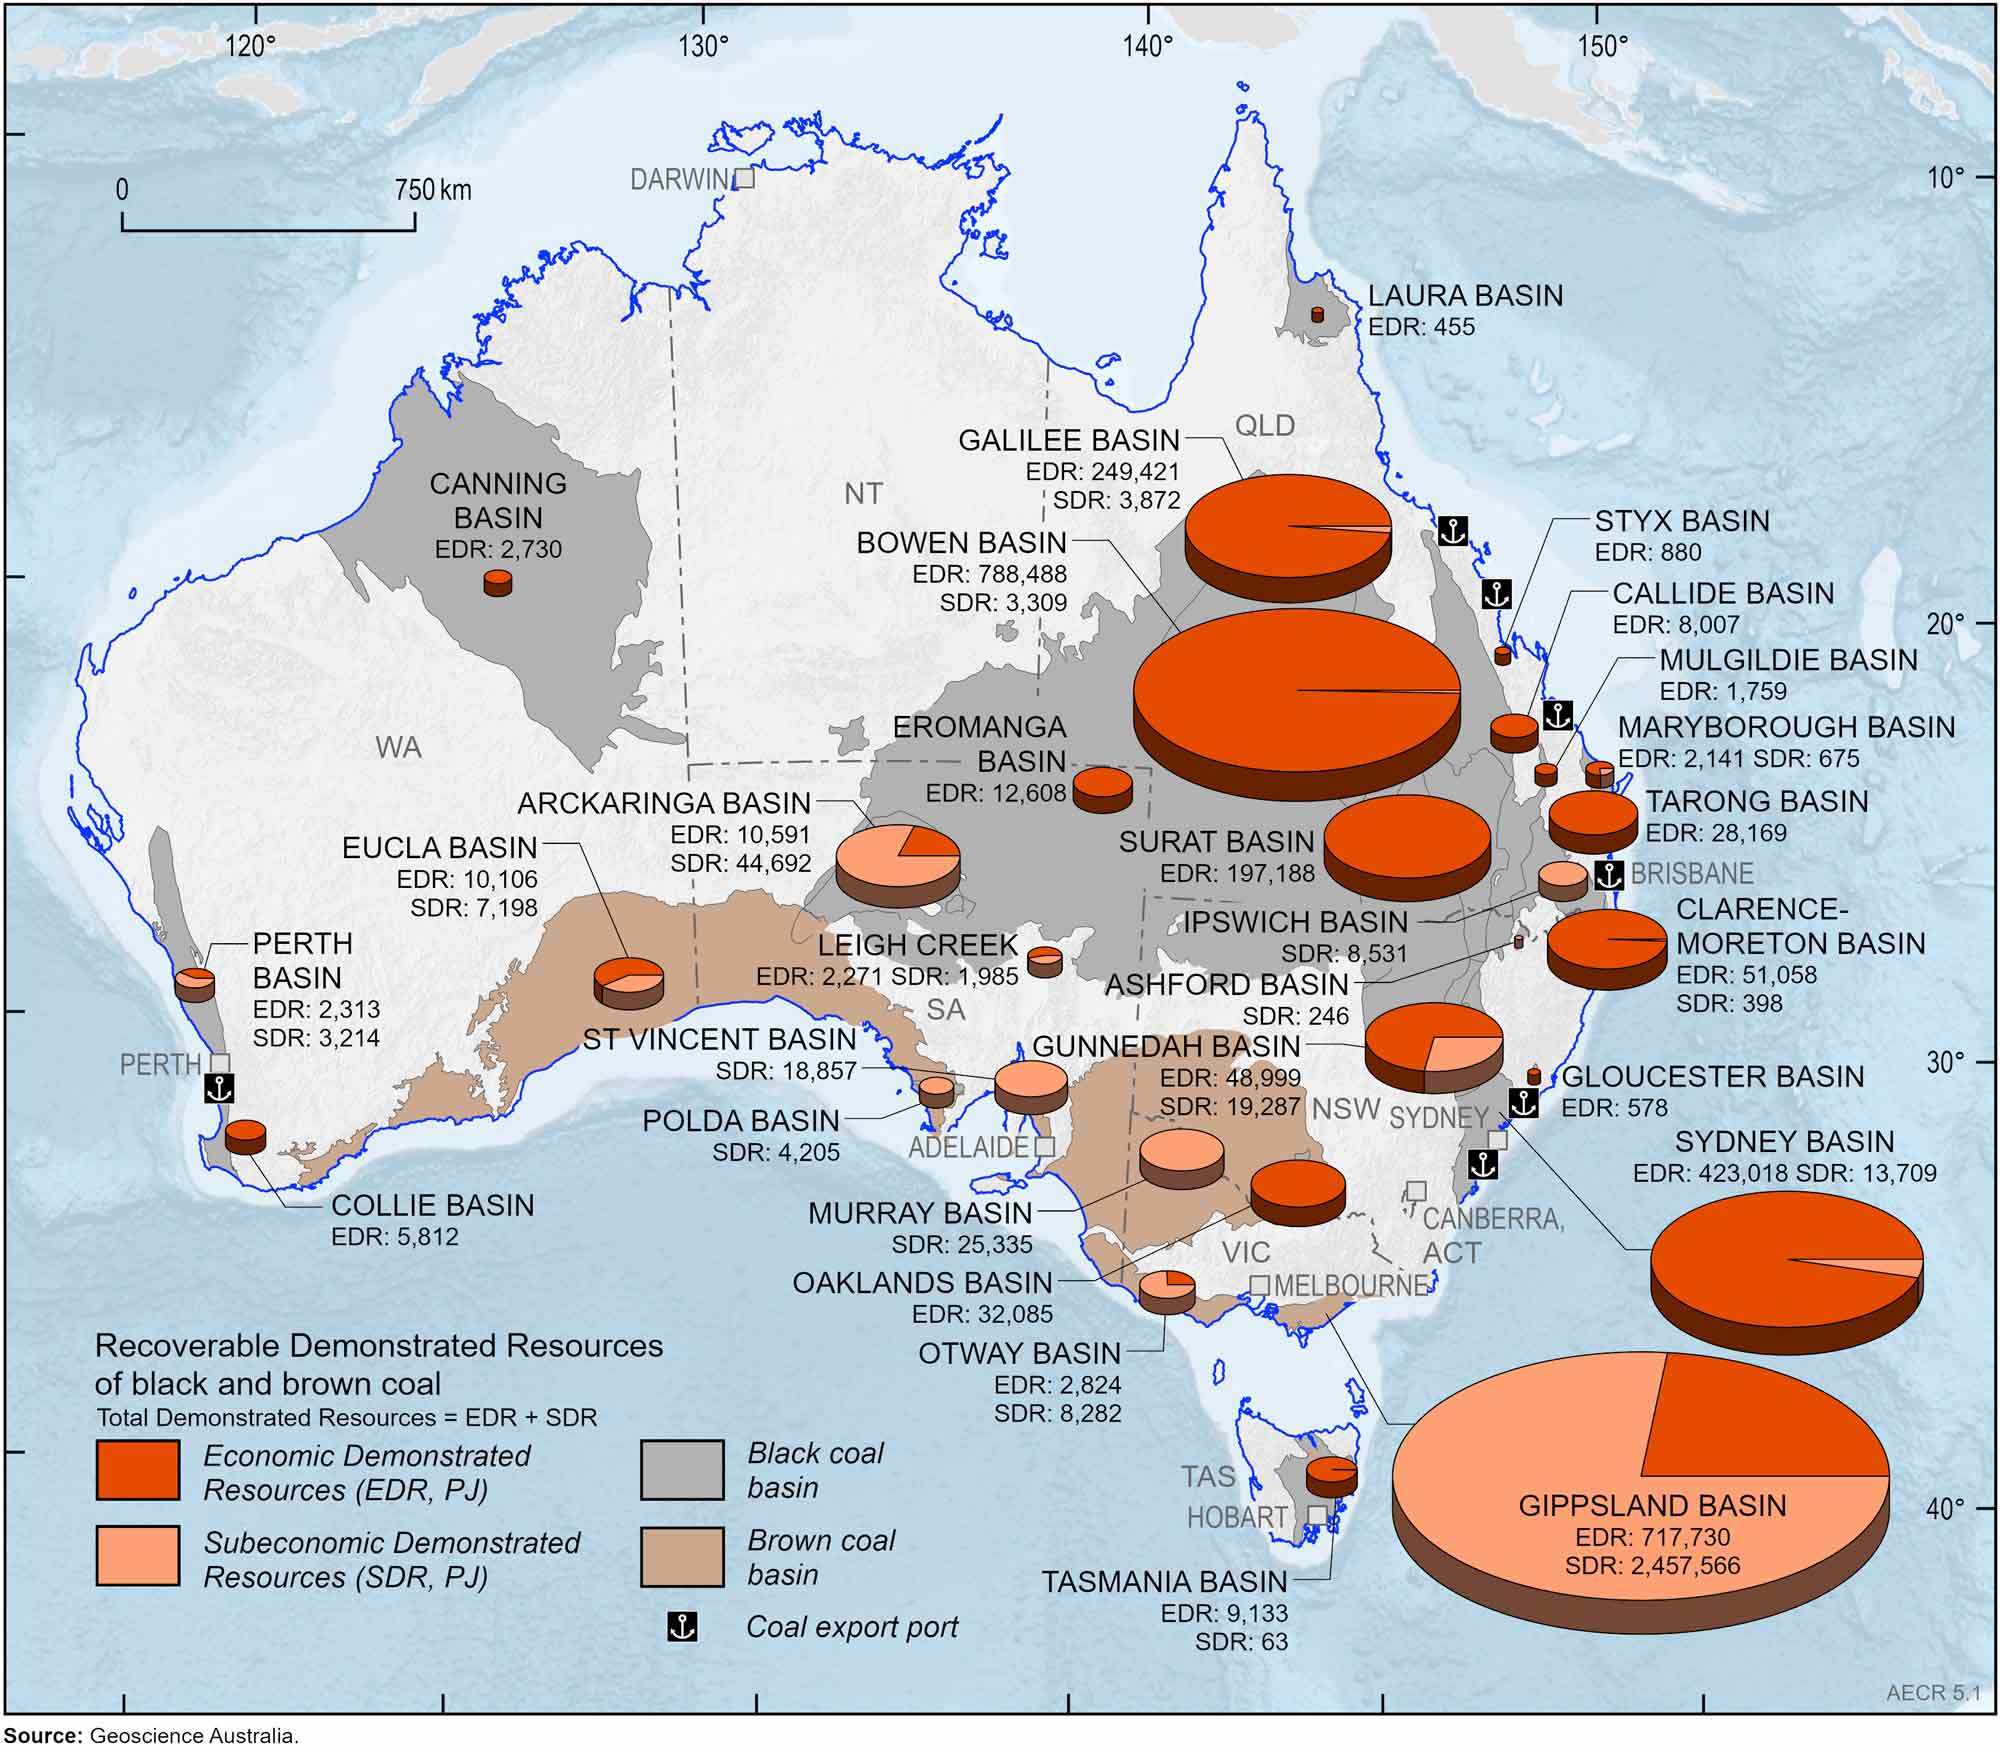
Figure 5.1 Australia’s recoverable total demonstrated resources in petajoules (PJ) of black and brown coal, as at end 2024. For physical units (Mt) refer to Table 5.1.
Highlights
- Coal is one of Australia’s most significant energy resources, supporting 46% of Australia’s electricity generation (DCCEEW, 2025) and about half of our energy export earnings (DISR, 2025) during 2023–24.
- As of December 2024, Australia’s recoverable total demonstrated resources (TDR) of black coal were estimated at 1,981,889 PJ (78,248 Mt). Recoverable TDR of brown coal were estimated at 3,247,899 PJ (331,424 Mt).
- Australia ranks second globally for economic demonstrated resources (EDR) of brown coal and fourth for black coal. At the end of 2024, Australia’s recoverable EDR were 730,660 PJ (74,039 Mt) for brown coal and 1,877,705 PJ (72,985 Mt) for black coal.
- Australia is the fourth largest producer, the second largest exporter and has the third largest reserves of coal in the world (Energy Institute, 2025).
- During 2023–24, export earnings from black coal totalled $91.4 billion, down 38.0% from $127.4 billion in 2022–23 (DISR, 2025). All produced brown coal was for domestic use.
- In 2023 and 2024, coal exploration expenditure remained stable at $322 million. In 2025, investment in coal exploration fell by 25%, in comparison to 2024, to $242 million. Coal exploration was approximately 8% of the 2024 total exploration spend in Australia and 6% of the total exploration spend in 2025 (ABS, 2025).
Coal resources
Australia’s coal resources are expressed as Economic Demonstrated Resources (EDR), Subeconomic Demonstrated Resources (SDR) and Inferred Resources. Refer to Appendix 4 for definitions of these terms and further information on the National Classification System for reporting of Identified Mineral Resources. At 31 December 2024, Australia had substantial EDR (Figure 5.1) and Inferred Resources (Figure 5.2) of black and brown coal (Table 5.1 and Table 5.2).
Black coal
Most of Australia’s black coal EDR are located in Queensland and New South Wales, followed by smaller volumes in South Australia, Western Australia and Tasmania. There are two main types of black coal products: metallurgical coal and thermal coal. Metallurgical coal (also called met coal or coking coal) is mostly used for steel making and other industrial processes. Thermal coal (also called steaming coal) is used for electricity generation.
Total in-situ resources of black coal in Australia (Economic Demonstrated Resources plus Subeconomic Demonstrated Resources plus Inferred Resources) are estimated at 192,299 Mt, comprising 86,640 Mt of EDR, 7,104 Mt of SDR and 98,554 Mt of Inferred Resources (Hughes et al., 2026). Australia’s total recoverable Identified Resources of black coal are estimated to be 155,324 Mt (3,821,356 PJ), comprising 72,985 Mt (1,877,705 PJ) of EDR, 5,264 Mt (104,185 PJ) of SDR and 77,076 Mt (1,839,467 PJ) of Inferred Resources (Table 5.1). Australia is thought to hold 9% of world economic resources of black coal, ranking fourth behind the United States (27%), China (19%) and India (17%; Federal Institute for Geosciences and Natural Resources, 2024).
Brown coal
Total in situ resources (all categories) of brown coal, are estimated to be 488,664 Mt, of which in situ EDR are 81,234 Mt, SDR are 284,921 Mt and Inferred Resources are 122,509 Mt. Total recoverable Identified resources of brown coal are estimated at 436,651 Mt (4,283,623 PJ), of which recoverable EDR are 74,039 Mt (730,660 PJ), SDR are 257,384 Mt (2,517,239 PJ) and Inferred Resources are 105,228 Mt (1,035,724 PJ; Table 5.2). Nearly all of Australia’s recoverable brown coal EDR is in Victoria, with more than 90% in the Gippsland Basin (Latrobe Valley). Australia is estimated to hold 23% of the world’s economic resources of brown coal, ranking second in the world behind Russia (28%) (Federal Institute for Geosciences and Natural Resources, 2024).
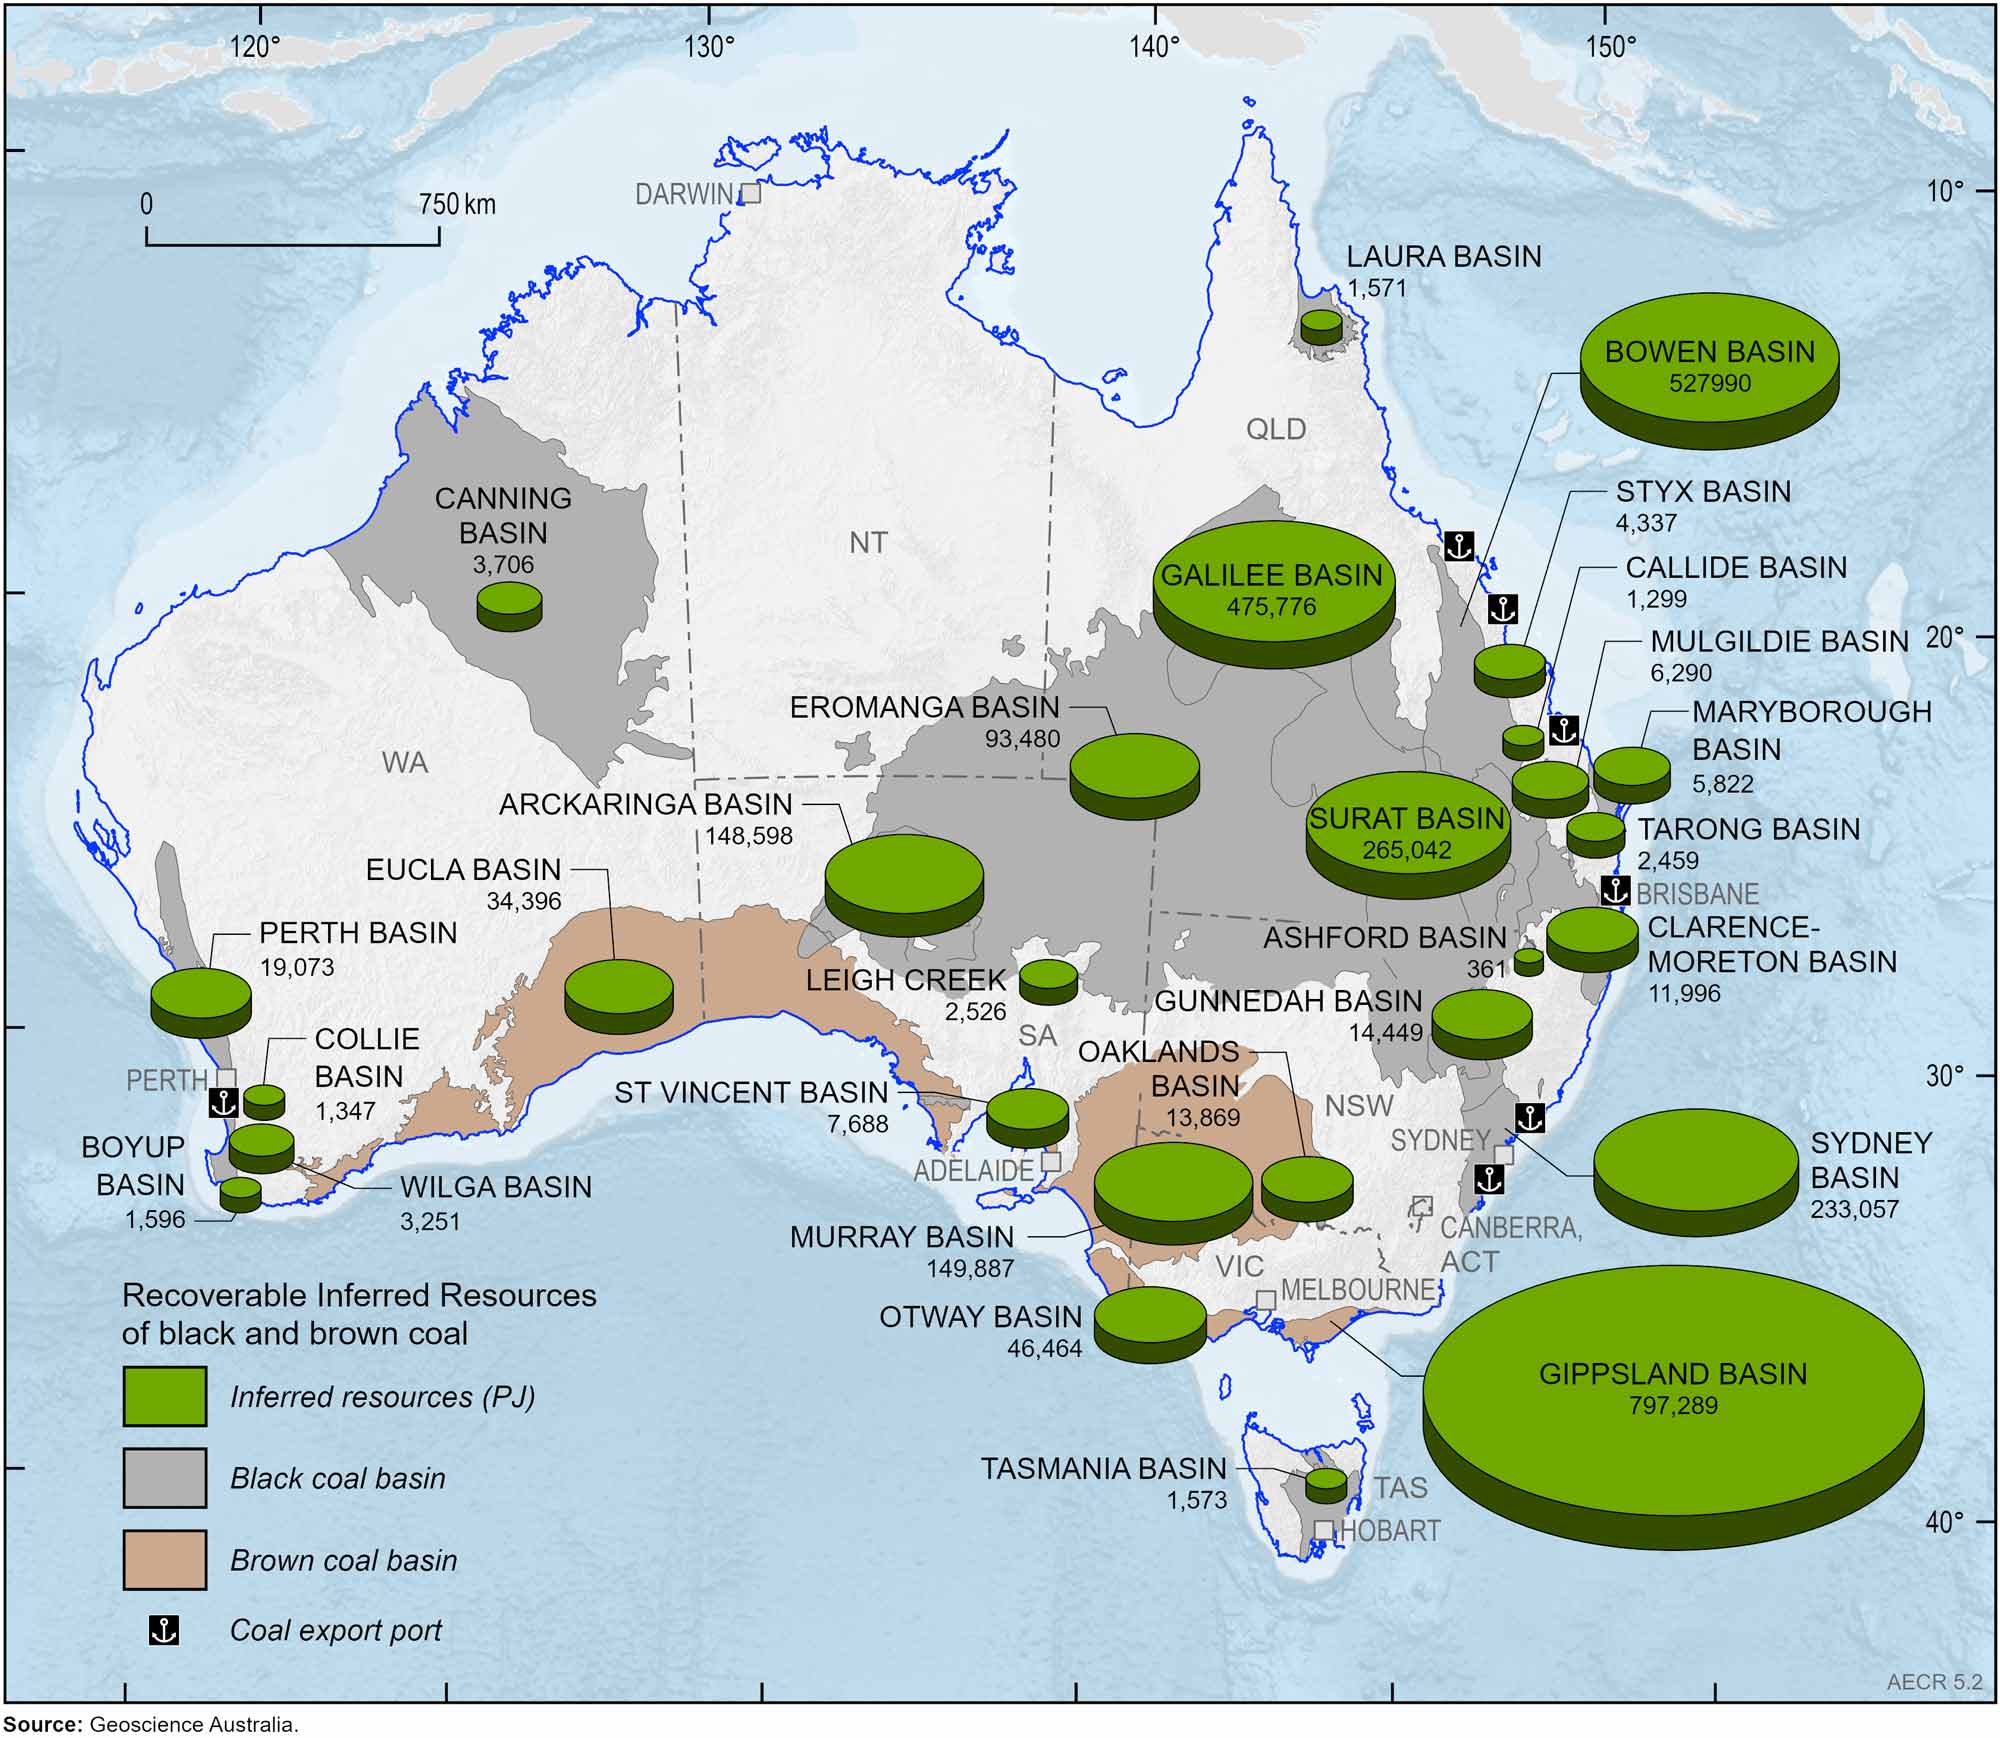
Figure 5.2 Australia’s black and brown coal Inferred Resources as at end 2024 (PJ). For physical units (Mt) refer to Table 5.1 and Table 5.2.
Table 5.1 Australia's remaining black coal resources by basin area to year end 2024 (Mt and PJ).
| Basin | Black Coal | |||||
|---|---|---|---|---|---|---|
| EDR (PJ) | SDR (PJ) | Inferred (PJ) | EDR (Mt) | SDR (Mt) | Inferred (Mt) | |
| Arckaringa | 10,591 | 44,692 | 148,598 | 623 | 2,538 | 8,577 |
| Ashford | 0 | 246 | 361 | 0 | 8 | 13 |
| Bowen | 788,488 | 3,309 | 527,990 | 28,452 | 123 | 19,051 |
| Boyup | 0 | 0 | 1,596 | 0 | 0 | 81 |
| Callide | 8,007 | 0 | 1,299 | 430 | 0 | 70 |
| Canning | 2,732 | 0 | 3,706 | 139 | 0 | 188 |
| Clarence-Moreton | 51,058 | 398 | 11,996 | 1,922 | 15 | 448 |
| Collie | 5,812 | 0 | 1,347 | 295 | 0 | 68 |
| Eromanga | 12,608 | 0 | 93,480 | 614 | 0 | 4,755 |
| Galilee | 249,421 | 3,872 | 475,776 | 11,207 | 176 | 21,227 |
| Gloucester | 578 | 0 | 0 | 21 | 0 | 0 |
| Gunnedah | 48,999 | 19,287 | 14,449 | 1,815 | 945 | 535 |
| Ipswich | 0 | 8,531 | 0 | 0 | 328 | 0 |
| Laura | 455 | 0 | 1,571 | 15 | 0 | 52 |
| Leigh Creek* | 2,271 | 1,985 | 2,526 | 151 | 131 | 166 |
| Maryborough | 2,141 | 675 | 5,822 | 74 | 23 | 198 |
| Mulgildie | 1,759 | 0 | 6,290 | 65 | 0 | 233 |
| Oaklands | 32,085 | 0 | 13,869 | 1,395 | 0 | 603 |
| Pedirka | 0 | 0 | 0 | 0 | 0 | 0 |
| Perth | 2,313 | 3,214 | 19,073 | 117 | 177 | 991 |
| Polda | 0 | 4,205 | 0 | 0 | 288 | 0 |
| Styx | 880 | 0 | 4,337 | 31 | 0 | 152 |
| Surat | 197,188 | 0 | 265,042 | 7,949 | 0 | 10,393 |
| Sydney | 423,018 | 13,709 | 233,057 | 15,832 | 509 | 8,915 |
| Tarong | 28,169 | 0 | 2,459 | 1,437 | 0 | 125 |
| Tasmania | 9,133 | 63 | 1,573 | 401 | 3 | 69 |
| Wilga | 0 | 0 | 3,251 | 0 | 0 | 165 |
| Total | 1,877,705 | 104,185 | 1,839,467 | 72,985 | 5,264 | 77,076 |
| Change from 2023 (PJ/Mt) | 22,449 | 0 | 20,622 | 498 | 0 | 654 |
| Change from 2023 (%) | 1.2% | 0% | 1.1% | 0.7% | 0% | 0.8% |
Table 5.2 Australia's remaining brown coal resources by basin area to year end 2024 (Mt and PJ).
| Basin | Brown Coal | |||||
|---|---|---|---|---|---|---|
| EDR (PJ) | SDR (PJ) | Inferred (PJ) | EDR (Mt) | SDR (Mt) | Inferred (Mt) | |
| Eucla | 10,106 | 7,198 | 34,396 | 513 | 365 | 1,746 |
| Gippsland | 717,730 | 2,457,566 | 797,289 | 73,238 | 250,772 | 81,222 |
| Murray | 0 | 25,335 | 149,887 | 0 | 3,478 | 15,295 |
| Otway | 2,824 | 8,282 | 46,464 | 288 | 845 | 6,181 |
| St Vincent | 0 | 18,857 | 7,688 | 0 | 1,924 | 784 |
| Total | 730,660 | 2,517,239 | 1,035,724 | 74,039 | 257,384 | 105,228 |
| Change from 2023 (PJ/Mt) | - | - | - | - | - | - |
| Change from 2023 (%) | 0% | 0% | 0% | 0% | 0% | 0% |
Abbreviations on tables 5.1 and 5.2
EDR = economic demonstrated resources. SDR = subeconomic demonstrated resources. Mt = million tonnes. PJ = petajoules.
Notes on tables 5.1 and 5.2
Additional coal resources are also present outside of these basin areas, which are included in the totals documented in AECR. The data shown have been rounded. *Leigh Creek is a deposit.
Source: Geoscience Australia OZMIN database, 2026.
Production and Trade
In 2024, Australia accounted for nearly 7% of coal production (black and brown), ranking fourth behind China (52%), India (10%) and Indonesia (9%) (Energy Institute, 2025). During 2024, Australia had 96 operating black coal mines, 3 operating brown coal mines (Figure 5.3), and more than 300 known coal deposits. Most of Australia’s black coal is produced in Queensland (57%) and New South Wales (42%), the remainder is mined in Western Australia and Tasmania. Brown coal produced in Victoria, mainly from the Gippsland Basin, contributed 40.3 Mt and 416 PJ equating to nearly 9% of total coal production and nearly 4% of total coal energy production in 2023–24 (DCCEEW, 2025).
In 2023–24 Australia’s production of saleable black and brown coal was 11,815 PJ, which accounted for 54% of total energy production (including uranium production; DCCEEW, 2025). In 2023–24, 88% of Australia’s black coal energy production was exported (Figure 5.4).
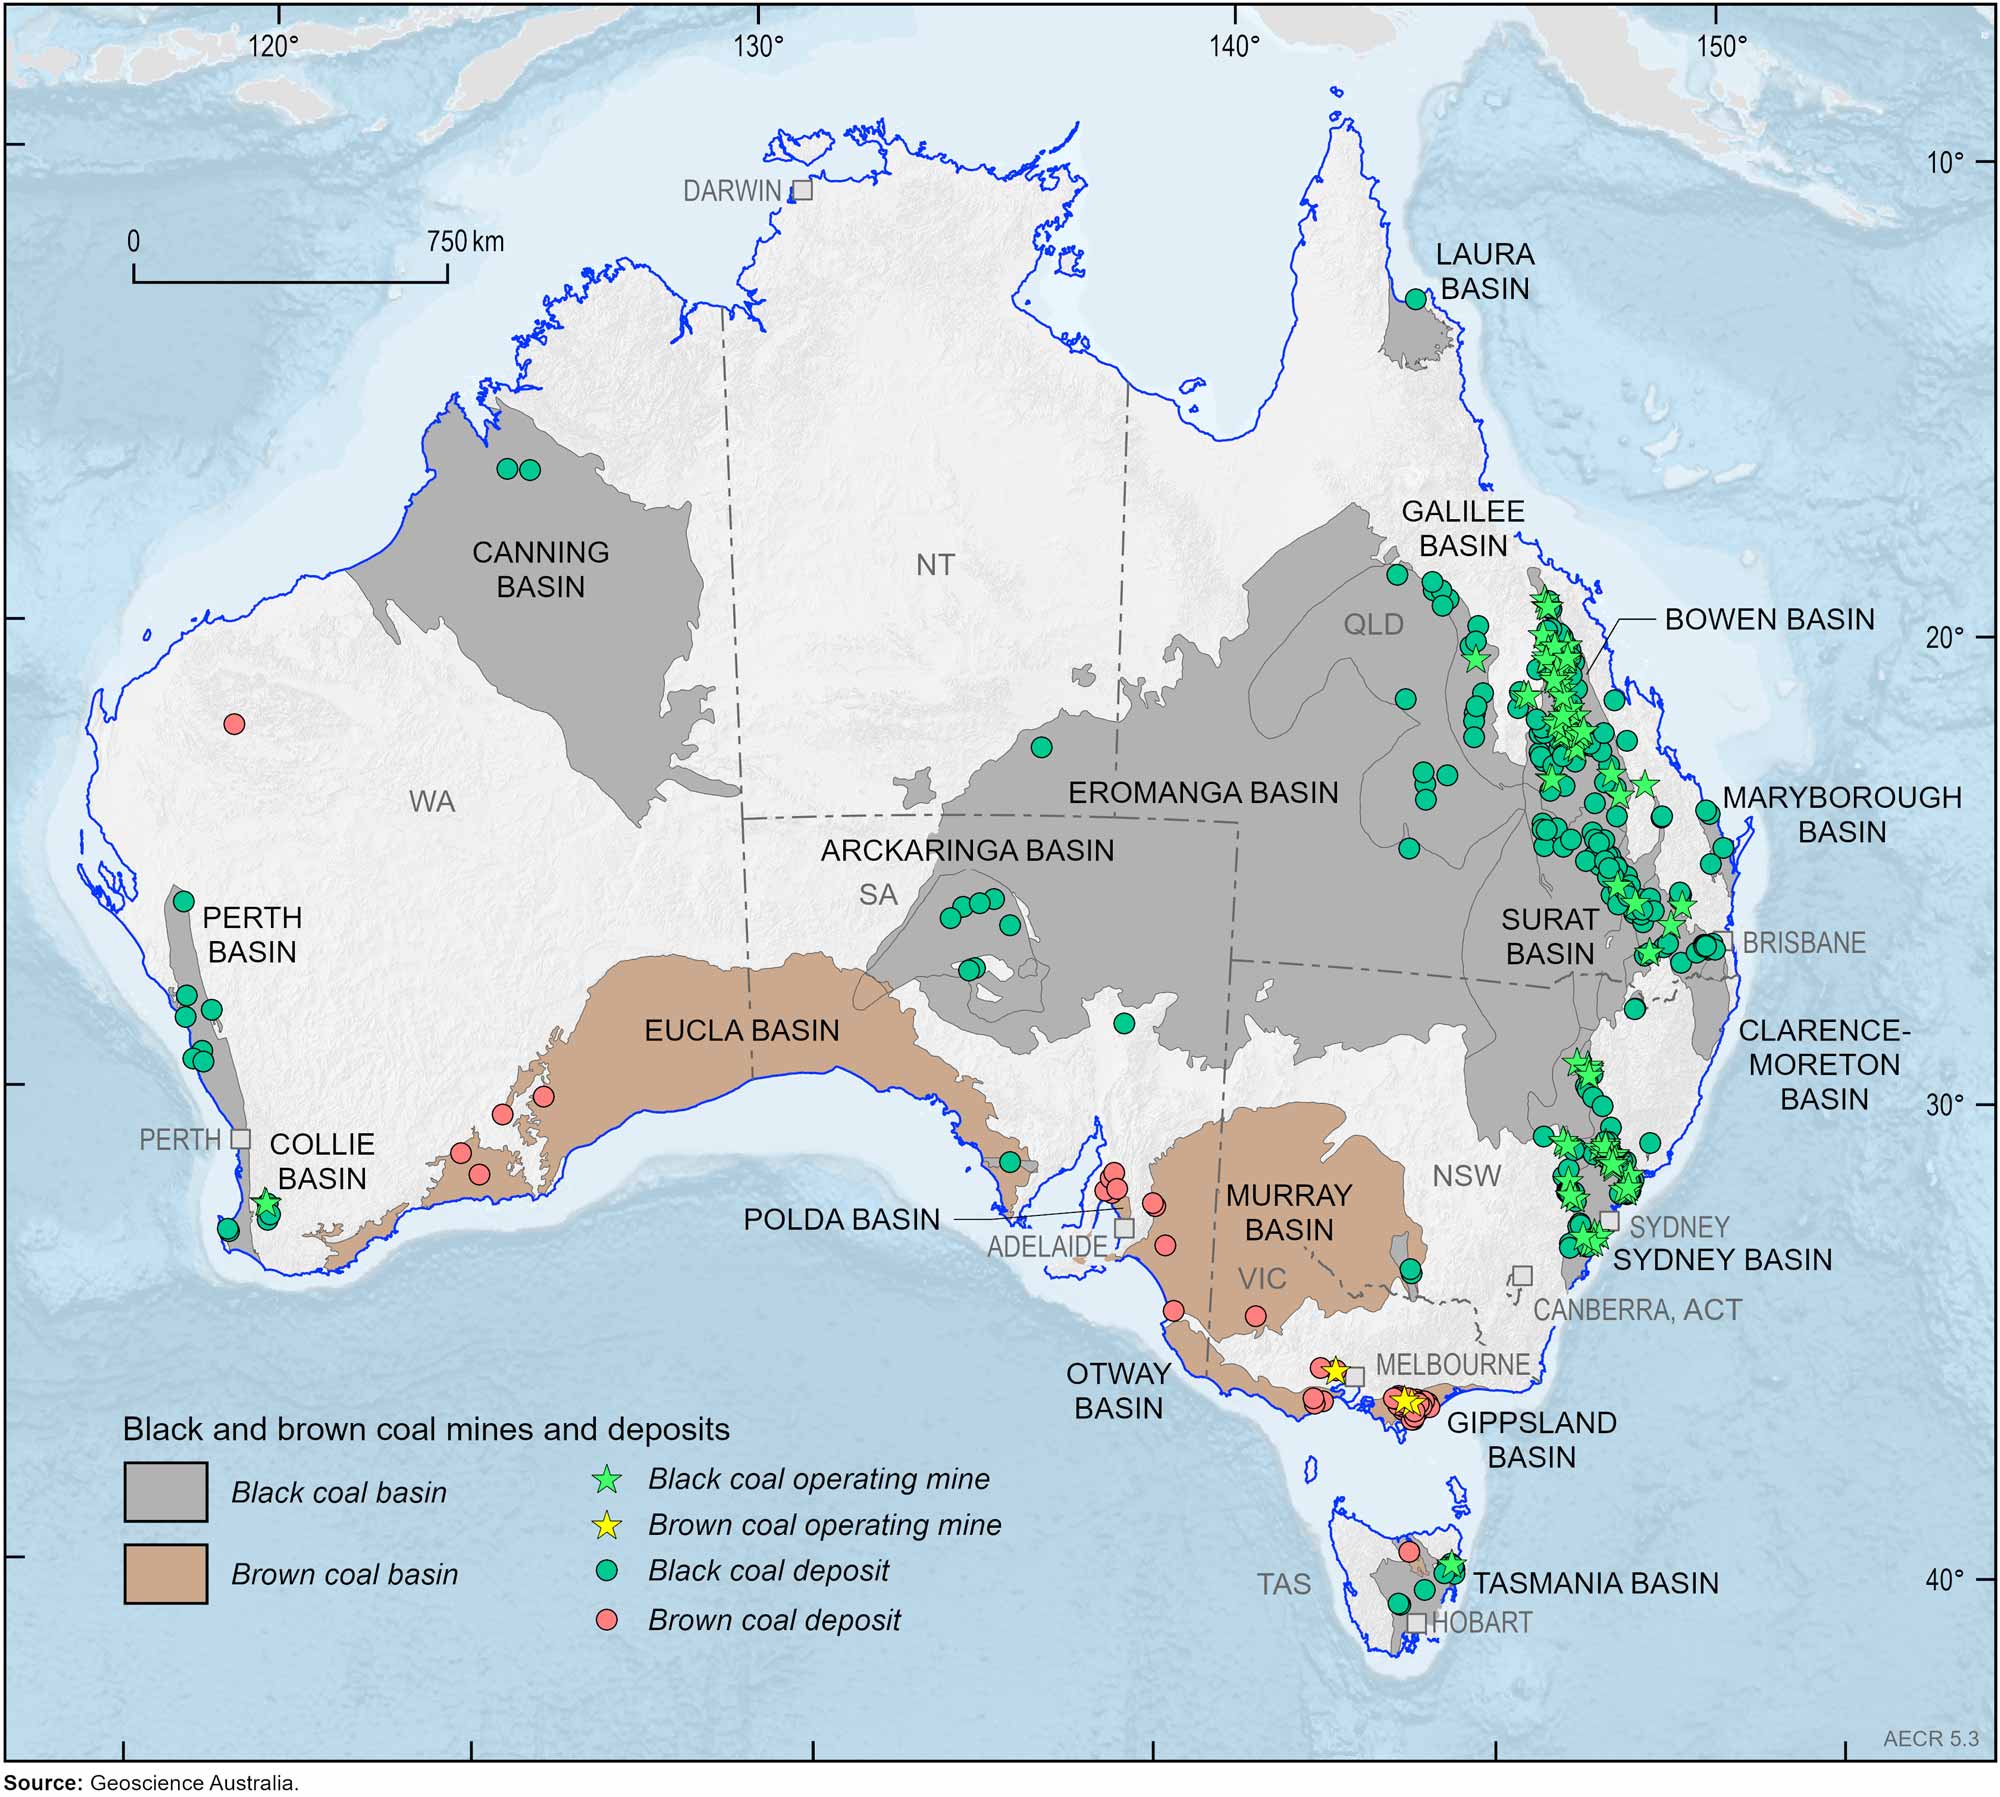
Figure 5.3 Australia's black and brown coal mines and deposits.
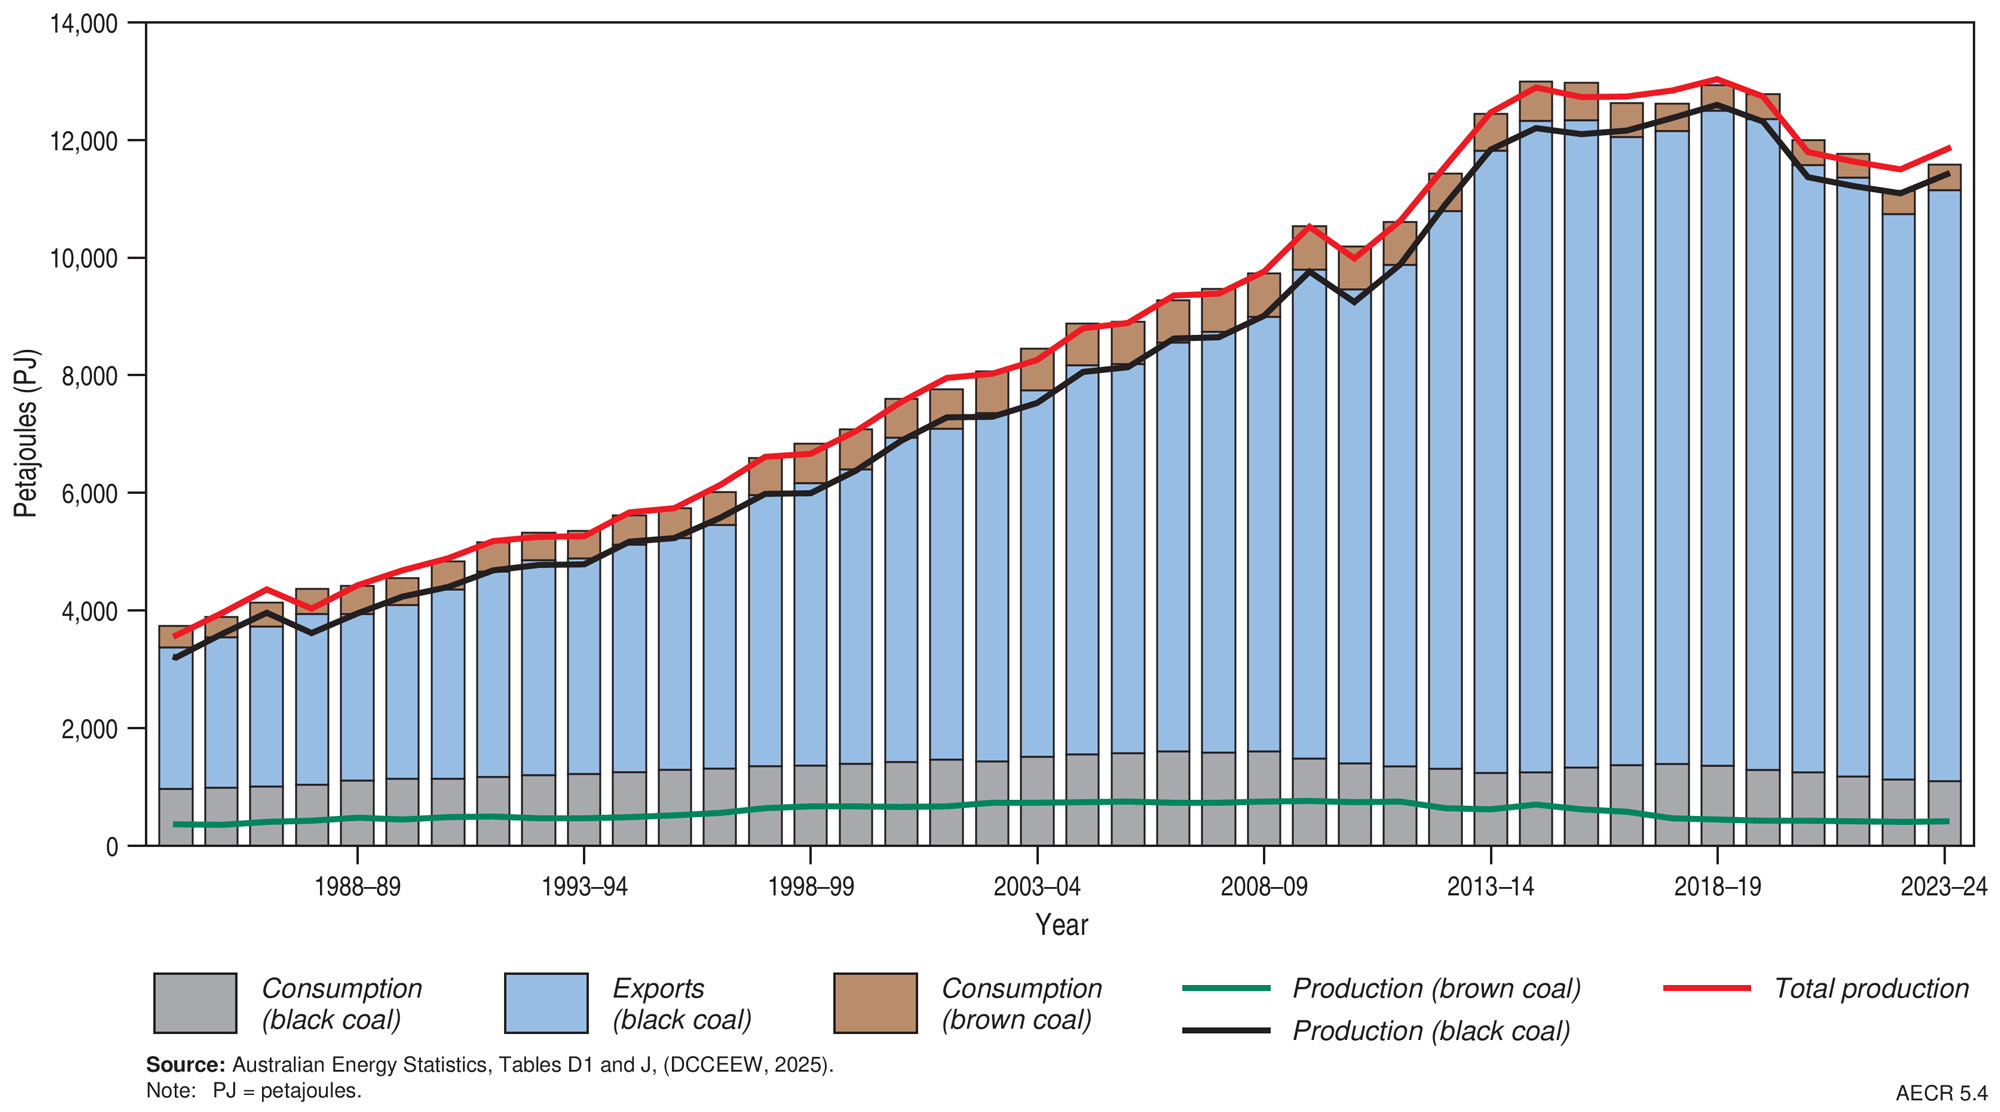
Figure 5.4 Australia’s coal production, consumption and exports, 1984–85 to 2023–24.
Australia accounts for 25% of world coal exports, ranking second behind Indonesia for total (black and brown) coal exports (Energy Institute, 2025). The majority of Australia’s black coal is exported to meet strong ongoing coal demand from Asia with all of Australia’s brown coal used to support energy generation in Victorian power stations, capitalising on its abundant coal resources. Australia exported 10,074 PJ of coal and coal products in 2023–24, which represents 56% of Australia’s total energy exports (DCCEEW, 2025). Coal exports rose by 5%, from a 10-year low of 338 Mt in 2022–23, to 356 Mt in 2023–24. Despite the relative increase, coal export volumes remained lower than the historical average of ~374 Mt per annum during the 10 years from 2014–15 to 2023–24. Over the same period coal prices were volatile and the total value of coal exports fluctuated, from a low of $34.58 bn in 2015–16, to a high of $127.42 b before moderating to $91.39 b in 2023–24. In 2024, the average Newcastle thermal coal spot price decreased to A$173/t, from A$233/t in 2023, and the Australian east coast premium hard coking coal spot price averaged A$344/t, down from A$396/t in 2023 (DISR, 2025).
In 2024, China’s thermal coal imports grew as widespread heat waves and the growth of data centres increased demand for electricity (DISR, 2024). Highly variable rainfall affected hydroelectric output and new safety protocols and capacity controls at Chinese coal mines impacted coal production (DISR, 2024). In 2024, Australia’s metallurgical coal exports to China grew to help offset lower volumes from Russia and Mongolia and to support India’s growing steel sector (DISR, 2024).
References
ABS (Australian Bureau of Statistics), 2025. Mineral and Petroleum Exploration, Australia, Table 5. Released 28 February 2025. (Last accessed May 2026).
Federal Institute for Geosciences and Natural Resources (Bundesanstalt für Geowissenschaften und Rohstoffe [BGR]), 2024. BGR Energy Data 2024 – Data and developments concerning German and Global Energy Supplies (data for 2023). (Last accessed May 2026).
DCCEEW (Department of Climate Change, Energy, the Environment and Water), 2025. Australian Energy Update. (Last accessed May 2026).
DISR (Department of Industry, Science and Resources), 2024. Resources and Energy Quarterly: December 2024 (last accessed June 2026).
DISR (Department of Industry, Science and Resources), 2025. Resources and Energy Quarterly: September 2025. (Last accessed May 2026).
Energy Institute, 2025. Statistical Review of World Energy. (Last accessed May 2026).
Hughes, A., Britt, A., Pheeney, J., Kucka, C., Morfiadakis, A., Munns, C., Boyd, J., Senior, A., Cross, A. and Thorne, J. 2026. Australia’s Identified Mineral Resources 2025. Geoscience Australia, Canberra.
Data download
Data tables and full report are downloadable from the Geoscience Australia website.