Australia's Energy Commodity Resources 2026 Geothermal
Page last updated:10 August 2026
| Production capacity | |
|
Electricity – | |
|
Direct use & ground source heat pumps
134 MWth* (25% since 2023) |
|
Exploration 123 tenements (1%) - 34 granted - 89 under application |
|
Status Early stages of development |
Notes
Statistics as of December 2025. *MWth – Megawatts thermal, Beardsmore et al., (2026).
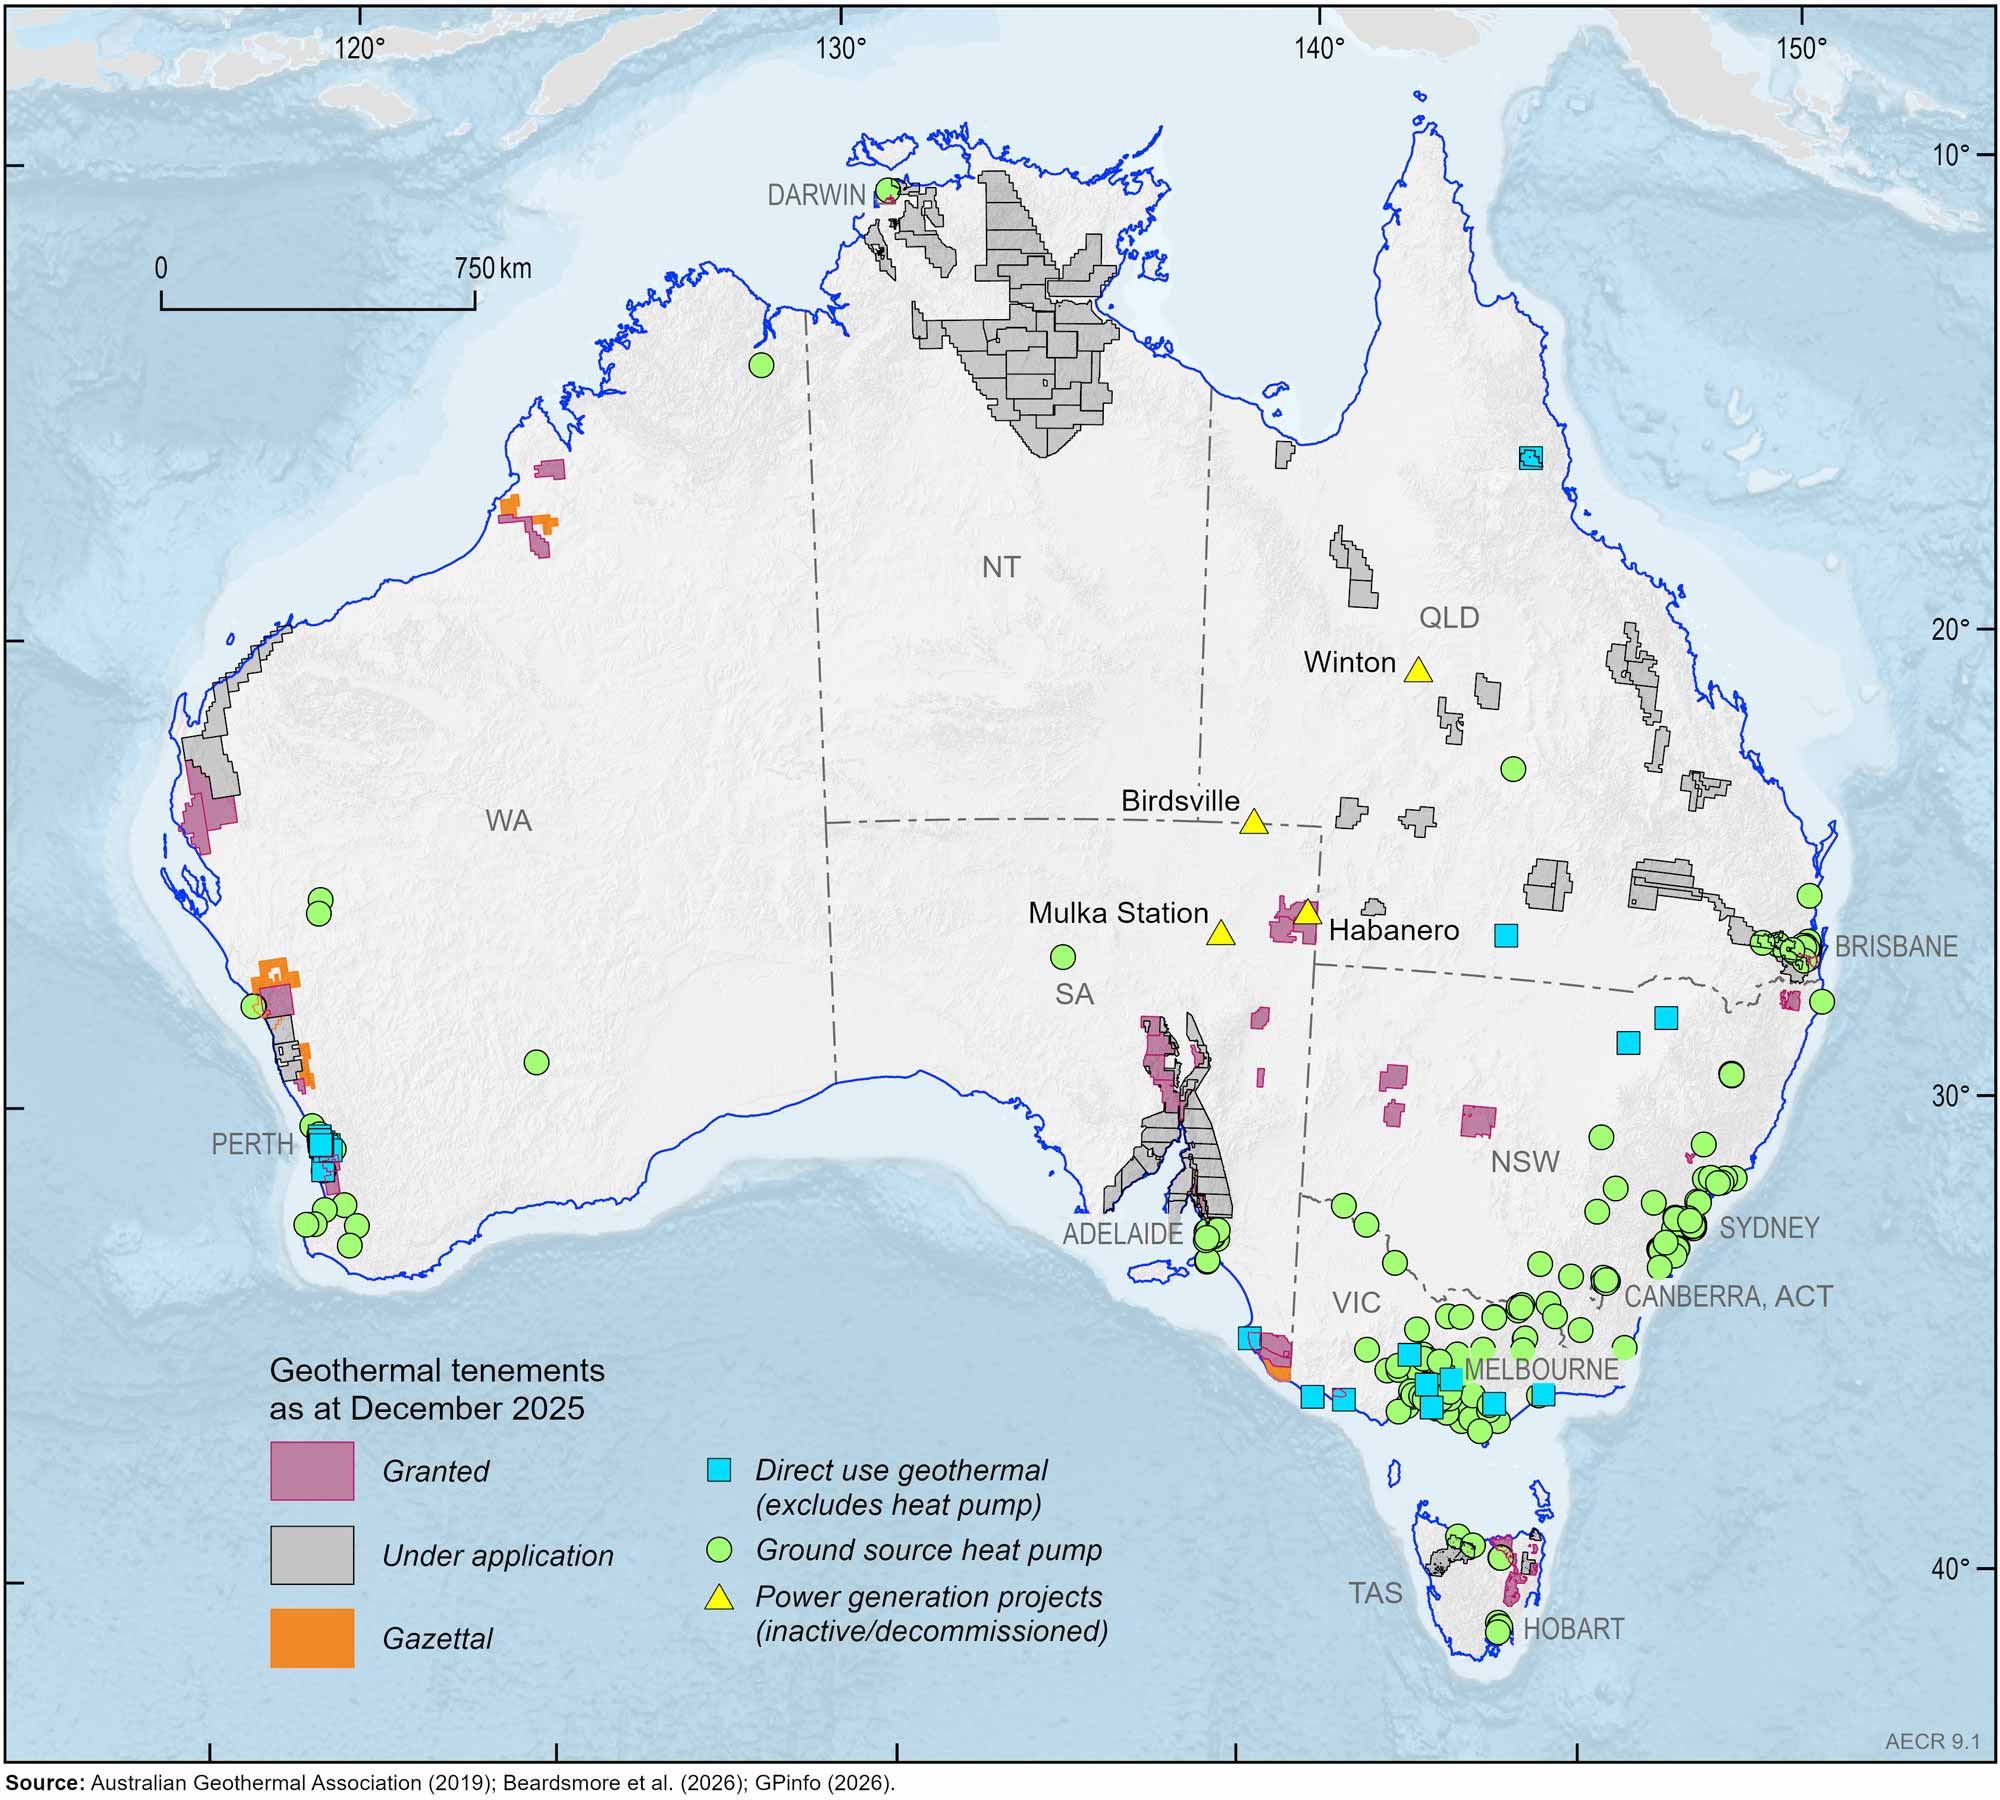
Figure 9.1 Map of Australian geothermal projects and current geothermal tenements as of December 2025. Direct use and ground source heat pump data from Beardsmore et al. (2026).
Highlights
- There continues to be interest in geothermal energy resources in Australia, with 123 exploration tenements and permit applications across the country as of December 2025.
- While commercial investment in geothermal power projects continues to be low in Australia, with no geothermal power generation, direct use and ground source heat pump capacity in Australia has increased by 25% since 2023, reaching 134 MWth in 2025.
- Next-generation geothermal technologies—Enhanced Geothermal Systems and Advanced Geothermal Systems—are advancing internationally and driving a resurgence of interest in geothermal energy.
Geothermal energy: resources, technologies and applications
Geothermal energy in Australia remains at an early stage of development, with activity primarily focused on exploration and targeted project evaluation rather than large-scale energy use and electricity generation. Although commercial deployment has been limited, advances in geothermal technologies—particularly enhanced and advanced geothermal systems (EGS/AGS)—are improving feasibility, supported by international progress in deep drilling, reservoir development, and well performance. These advances are addressing key technical barriers, including the ability to drill deep, hot formations more efficiently, better predict subsurface temperatures, and manage heat exchange and reservoir behaviour. For example, recent EGS developments in the United States by Fervo Energy (2026a, 2026b) demonstrate how advances in drilling efficiency and reservoir stimulation are rapidly improving the commercial viability of geothermal energy. Global investment in geothermal power projects is estimated to have risen from more than US$1 billion in 2020 to US$6 billion in 2025, and is projected to keep growing to 2030 (Rystad Energy and ThinkGeoEnergy 2026).
Exploration and project-level initiatives continue across several basins, reflecting ongoing efforts to better characterise Australia’s geothermal resource potential (Figure 9.1). At the same time, geothermal is increasingly recognised for its potential role in the evolving energy system, offering a low-emissions, dispatchable energy source that is not weather-dependent and can support a range of applications, including electricity generation, industrial heat, hydrogen production, and desalination. While direct-use applications such as heating and cooling remain the most mature segment, emerging technologies look set to enable broader deployment and improve the commercial outlook for geothermal energy in Australia.
Power generation
No Australian geothermal electricity generation facilities were active in 2025. Four small projects have been trialled over the last two decades, the most recent being a small-scale (310 kW) Hot Sedimentary Aquifer Organic Rankine Cycle geothermal power station in Winton, Queensland, in 2019 (Figure 9.1; ThinkGeoEnergy, 2019). Earlier small scale applications include the Mulka Station facility that produced 0.02 MW of electricity in the late 1980s (Burns et al., 2000), the Habanero (Innamincka Deeps) Project 1 MW pilot plant, which generated from an EGS resource for five months in 2013 (Geodynamics, 2014), and Ergon Energy’s low temperature geothermal power station at Birdsville, which sourced hot (98°C) waters at relatively shallow depths from the Great Artesian Basin between 1992 and 2017 (ThinkGeoEnergy, 2018).
Direct-use and heat applications
According to Beardsmore et al. (2026), recent years have seen steady growth in terms of direct use geothermal in Australia, both with and without heat pumps. Large-scale direct-use Hot Sedimentary Aquifer systems, such as those used to heat swimming pools or provide hydronic heating systems and commercial-scale geoexchange systems, are increasing in number in Australia (Figure 9.1).
Established and effective examples of direct-use geothermal systems include Robarra (Robe, South Australia) and Mainstream Aquaculture (Werribee, Victoria), both growing barramundi using 28–29°C bore water. Midfield Meats (Warrnambool, Victoria), uses warm bore water (boosted to 82°C) for washing and sterilising its industrial meat processing facility. The use of geoexchange technology at scale in housing developments and other large commercial applications has become increasingly common. Prominent examples include the Geoscience Australia building in Canberra and the 72 MWth (megawatts thermal) Barangaroo water-loop heat rejection cooling system in Sydney. In October 2024, Australia’s largest GSHP project began operations at the Australian War Memorial in Canberra (ThinkGeoEnergy, 2024).
As of December 2025, over 38 MWt of installed capacity for direct use of geothermal heat from hot aquifers has been identified (Beardsmore et al., 2026), an increase of 2 MWt (5%) since 2023. Ground source heat pump capacity is estimated to be 96 MWt, an increase of 25 MWt (35%) since 2023.
International production and consumption
The world’s installed geothermal electricity generation capacity has been growing over the past decade, estimated at approximately 16.2 GW in 2023 (Table 9.1; IGA, 2024), growing to 17.2 GW in 2025 (ThinkGeoEnergy, 2026). Global generation capacity is predicted to grow rapidly over the next decade, with more than 14 GW of prospective capacity at announced, pre-construction and construction stage (Global Energy Monitor, 2026). In 2023, global geothermal power plants produced approximately 96-98 TWh of electricity which was about 0.3% of the world’s electricity generation (IGA, 2024; IEA, 2024). Currently, most installed generation capacity resides along tectonic plate boundaries or ‘hot spot’ features (World Energy Council, 2016). However, technological improvements have made it possible for most countries to use shallow low-temperature geothermal resources in addition to higher-temperature resources, and these opportunities are expanding rapidly.
Australia is significantly lagging the leading geothermal electricity–generating countries (Table 9.1), with no installed capacity to date. Similarly, Australia’s use of geothermal energy is insignificant when compared to that of the world leader, China (Table 9.2). In 2023, Australia was ranked 43rd in the world in direct-use geothermal utilisation (IGA, 2024).
Table 9.1 Installed geothermal electricity generation capacity and generation for the top ten countries, Australia, and global total in 2023
| Rank | Country | Installed Capacity 2023 MWe | Generation 2023 GWh |
|---|---|---|---|
| 1 | United States | 3,889 | 18,702 |
| 2 | Indonesia | 2,335 | 16,592 |
| 3 | Philippines | 1,952 | 11,670 |
| 4 | Turkey | 1,717 | 10,840 |
| 5 | New Zealand | 1,055 | 7,820 |
| 6 | Mexico | 1,002 | 4,511 |
| 7 | Kenya | 952 | 5,590 |
| 8 | Italy | 916 | 5,917 |
| 9 | Iceland | 755 | 5,788 |
| 10 | Japan | 546 | 2,661 |
| 27 | Australia | 0.3 | 0 |
| Global total | 16,211 | 96,556 |
Abbreviations
MWe = megawatts electrical; GWh = gigawatt hours
Notes
Source: International Geothermal Association (IGA), 2024
Table 9.2 Selected world direct-use geothermal installed capacity and utilisation, 2023.
| Rank | Country | Installed capacity | Energy consumption |
|---|---|---|---|
| (MWth) | (TJ/year) | ||
| 1 | China | 100,220 | 828,882 |
| 2 | United States | 20,713 | 152,810 |
| 3 | Sweden | 7,280 | 67,680 |
| 4 | Germany | 5,381 | 32,184 |
| 5 | Turkey | 5,113 | 85,000 |
| 43 | Australia | 107 | 1,164 |
| Global total | 173,303 | 1,476,312 |
Abbreviations
MWth = megawatts thermal; TJ = terajoules.
Notes
Source: International Geothermal Association (IGA), 2024
References
Australian Geothermal Association, 2019. Census of Geothermal Projects. (Last accessed May 2026).
Beardsmore, G., Ballesteros, M., Davidson, C., Larking, A. and Pujol, M., 2023. Australia – Country Update, Proceedings, World Geothermal Congress 2023, Beijing, China (October 8-13, 2023).
Beardsmore, G., Ballesteros, M., Pujol, M., Archer, R., and Poesse, J., 2026. Australia – Country Update, Proceedings, World Geothermal Congress 2026, Calgary, Canada (June 8–11, 2026).
Burns, K. L., Weber, C., Perry, J. and Harrington, H. J., 2000. Status of the geothermal industry in Australia. In: Proceedings of the World Geothermal Congress 2000, Kyushu–Tokohu, Japan, 28 May –10 June 2000, 99-108.
Fervo Energy, 2026a. Enhanced Geothermal Has Been Proven at Scale. Here's What Two Years of Production Data Show. (Last accessed June 2026).
Fervo Energy, 2026b. Cape Station. (Last accessed June 2026).
Geodynamics Pty Ltd, 2014. Habanero Geothermal Project Field Development Plan, 9 October 2014. (Last accessed May 2026).
Global Energy Monitor, 2026. Global Geothermal Power Tracker. (Last accessed June 2026).
International Energy Agency (IEA), 2024. The Future of Geothermal Energy. (Last accessed May 2026).
International Geothermal Association (IGA), 2024. Geothermal Energy Database, 2023 data. (Last accessed May 2026).
Rystad Energy and ThinkGeoEnergy, 2026. Geothermal at an inflection point: Market Dynamics, Technology Evolution, and Growth Pathways, June 2026.
ThinkGeoEnergy, 2018. Birdsville in Australia abandons plans for renewal of geothermal plant. (Last accessed May 2026).
ThinkGeoEnergy, 2019. 310 kW Winton geothermal power plant in Queensland, Australia starts operation. (Last accessed May 2026).
ThinkGeoEnergy, 2024. Australian War Memorial switches on geothermal heating and cooling system. (Last accessed May 2026).
ThinkGeoEnergy, 2026. Global Top 10 Geothermal Power Countries at Year-End 2025. (Last accessed May 2026).
World Energy Council, 2016. World Energy Resource, Geothermal 2016. (Last accessed May 2026).
Data download
Data tables and full report are downloadable from the Geoscience Australia website.