

Australia’s Identified Mineral Resources
The National Classification System for Identified Mineral Resources has been used by the Australian Government since 1975 for classifying mineral resources for regional and national assessments. It provides a long-term view on what is likely to be available for mining.
The National Classification System uses two general criteria for classifying Australia’s national inventory of mineral resources:
- the geological certainty of the existence of the mineral resource, and
- the economic feasibility of its extraction over the long term.
The National Classification System uses reports on mineral resources published by companies using the JORC Code (or equivalent foreign codes) and, to a lesser extent, confidential information, to compile national totals for the resource classification categories set out in Table 3 (see page 8 for terminology and definitions). Both the National Classification System and the JORC Code are based on the McKelvey resource classification system used by the USGS. Thus Australia’s national system is compatible with the JORC Code and remains comparable to the USGS system, as published in the annual USGS Mineral Commodity Summaries.
Economic Demonstrated Resources (EDR) is the category used for the national totals of economic resources and provides a basis for meaningful comparisons of Australia’s economic resources with those of other nations. For major commodities, Section 8 presents long-term trends in EDR, Ore Reserves, total resources, production and resource life, with accompanying notes on significant changes.
Estimating the total amount of each mineral commodity likely to be available for mining over the long term (EDR) is not a precise science. The long-term perspectives presented herein take account of the following:
- Ore Reserves reported in compliance with the JORC Code (or equivalent foreign codes) will all be mined, but they only provide a short-term view on what is likely to be available for mining.
- Most current Measured and Indicated Resources reported in compliance with the JORC Code are also likely to be mined.
- Some current Inferred Resources will be transferred to Measured and Indicated Resources and Ore Reserves.
- New discoveries will add to the resource inventory.
In addition, some resources that, all being equal, would normally be considered EDR are not accessible because of environmental, legal or military land-use restrictions. Thus Table 3 also lists Accessible Economic Demonstrated Resources (AEDR). Of the 36 mineral commodities assessed in this publication, only black coal, brown coal, gold, mineral sands, platinum group elements and uranium have EDR that is considered inaccessible.
Over time, all of Australia’s current EDR of gold, silver, tin, zinc, lead and any number of other commodities will be mined. At first glance, this statement might seem somewhat paradoxical because, obviously, not every deposit that contributes to EDR will have all of that EDR brought into production. Indeed, some deposits currently contributing to EDR will never produce any metal. However, the National Classification System is not designed to be used for individual mine assessments but, instead, is a way of estimating regional and national totals. So, from an aggregated point of view, it is a reasonable proposition that, eventually, all of the current EDR (and more) will be mined. Gold, for example, had an EDR of 5,018 t in 1999; since then Australian mines have produced 5,685 t of gold.
Australia is yet to run out of EDR because, to use JORC Code terminology, as individual Ore Reserves are depleted, Measured and Indicated Resources are reassessed into Proved and Probable categories, Inferred Resources are worked on to bring them to Measured and Indicated status and new drilling at existing mines as well as new greenfield discoveries add to the resource inventory. In addition, extractive technologies improve over time and if a commodity becomes rare then the laws of supply and demand result in previously subeconomic deposits becoming profitable. Thus EDR fundamentally differs from Ore Reserves under the JORC Code because it is not meant to provide a picture of what is currently commercial to mine but rather an outlook on what is likely to be available for mining over the long term, i.e., of opportunity for supply at regional and national scales.
Table 3. Australia's Identified Mineral Resources as at December 2019.
| Commodity | Unit | Australia | World | ||||||
|---|---|---|---|---|---|---|---|---|---|
| Demonstrated Resources | Inferred Resources2 | Accessible EDR3 | Mine Production4 | Economic Resources5 | Mine Production6 | ||||
| Economic (EDR)1 | Subeconomic | ||||||||
| Paramarginal | Submarginal | ||||||||
| Antimony | kt Sb | 100.5 | 8.8 | 0 | 37.2 | 100.5 | 2.037 | 1,150 | 160 |
| Bauxite | Mt | 5,292 | 30 | 1,429 | 3,170 | 5,292 | 105.5 | 29,700 | 372 |
| Black Coal | |||||||||
| In situ | Mt | 89,707 | 2,524 | 4,314 | 105,772 | ||||
| Recoverable | Mt | 75,428 | 1,934 | 3,856 | 84,097 | 68,546 | 5888 | 749,1679 | 7,18210 |
| Brown Coal | |||||||||
| In situ | Mt | 85,634 | 44,399 | 234,825 | 124,496 | ||||
| Recoverable | Mt | 73,865 | 40,314 | 215,449 | 103,732 | 63,796 | 4311 | 320,46912 | 73913 |
| Chromium | kt Cr | 0.5 | 302.0 | 0 | 6583.6 | 0.5 | 0 | 570,00014 | 44,00014 |
| Cobalt | kt Co | 1,399 | 268 | 5 | 1,179 | 1,399 | 5.715 | 7,200 | 144 |
| Copper | Mt Cu | 93.36 | 1.27 | 0.62 | 45.44 | 93.36 | 0.93 | 877 | 20.3 |
| Diamond | Mc | 10.97 | 0 | 0 | 20.30 | 10.97 | 12.9916 | 1,10017 | 147 |
| Fluorine | kt F | 343 | 721 | 6 | 2,543 | 343 | 0 | 153,000 | 3,40018 |
| Gold | t Au | 10,795 | 148 | 208 | 4,822 | 10,768 | 326 | 51,100 | 3,300 |
| Graphite | Mt | 7.97 | 0.10 | 0 | 7.32 | 7.97 | 0 | 308 | 1.1 |
| Iron | |||||||||
| Iron ore | Mt | 50,593 | 8,858 | 1,582 | 91,059 | 50,593 | 919 | 171,000 | 2,500 |
| Contained iron | Mt Fe | 24,508 | 2,690 | 426 | 42,071 | 24,508 | 569 | 83,000 | 1,500 |
| Lead | Mt Pb | 37.31 | 1.35 | 0.14 | 25.06 | 37.31 | 0.509 | 91.7 | 4.60 |
| Lithium | kt Li | 5,702 | 0 | <1 | 1,594 | 5,702 | 4519 | 19,500 | 80 |
| Magnesite | Mt MgCO3 | 285 | 75 | 35 | 992 | 285 | <120 | 8500 | 2821 |
| Manganese Ore | Mt | 272 | 3 | 190 | 396 | 272 | 7.522 | 82623 | 1923 |
| Mineral Sands | |||||||||
| Ilmenite | Mt | 274.7 | 16.3 | 10.9 | 255.5 | 264.8 | 1.024 | 1,260 | 13 |
| Rutile | Mt | 35.4 | 0.1 | 3.1 | 35.9 | 32.9 | 0.224 | 55 | 1 |
| Zircon | Mt | 79.7 | 0.3 | 4.7 | 57.8 | 77.1 | 0.524 | 110 | 2 |
| Molybdenum | kt Mo | 248 | 366 | <1 | 1,737 | 248 | 0 | 18,000 | 290 |
| Nickel | Mt Ni | 21.2 | 2.5 | <1 | 19.5 | 21.2 | 0.155 | 90 | 2.7 |
| Niobium | kt Nb | 216 | 15 | 0 | 397 | 216 | n.a.25 | >13,000 | 74 |
| Oil Shale (recoverable) | GL | 0 | 213 | 2,074 | 1,472 | 0 | 0 | 961,87326 | n.a. |
| PGE | t metal | 37.6 | 134.4 | 0 | 107.2 | 35.6 | 0.48327 | 69 000 | 39428 |
| Phosphate | |||||||||
| Phosphate rock29 | Mt | 1,091 | 498 | 0 | 2,364 | 1,091 | 1.030 | 70,000 | 240 |
| Contained P2O5 | Mt P2O5 | 178 | 90 | 0 | 389 | 178 | n.a. | n.a. | n.a. |
| Potash | Mt K2O | 35 | 11 | <1 | 148 | 35 | 0 | >3,600 | 41 |
| Rare Earths31 | Mt oxide | 4.03 | 4.29 | 35.88 | 26.62 | 4.03 | 0.01832 | 115 | 0.210 |
| Scandium | kt Sc | 26.91 | 8.10 | 0.00 | 19.59 | 26.91 | 0 | n.a. | n.a. |
| Silver | kt Ag | 90.26 | 1.86 | 0.48 | 45.37 | 90.26 | 1.325 | 560 | 27.0 |
| Tantalum | kt Ta | 93.5 | 1.4 | 0.2 | 35.9 | 93.5 | 0.09633 | >127 | 1.9 |
| Thorium | kt Th | 0 | 16 | 543 | 707 | 0 | 0 | n.a. | n.a. |
| Tin | kt Sn | 561 | 63 | 32 | 301 | 561 | 7.6 | 4,880 | 312 |
| Tungsten | kt W | 403 | 0 | 5 | 322 | 403 | <134 | 3,200 | 82 |
| Uranium | kt U | 1,147 | 56 | 27 | 722 | 1,091 | 6.613 | 3,792(35 | 54.736 |
| Vanadium | kt V | 6,019 | 196 | 1376 | 22,838 | 6,019 | 0 | 24,000 | 73 |
| Zinc | Mt Zn | 68.92 | 0.43 | 0.75 | 46.12 | 68.92 | 1.337 | 251 | 13 |
Abbreviations
t = tonne; kt = kilotonnes (1,000 t); Mt = million tonnes (1,000,000 t); Mc = million carats (1,000,000 carats); GL = gigalitre (1,000,000,000 L); n.a. = not available; PGE = platinum group elements (Pt, Pd, Os, Ir, Ru, Rh).
Where an element symbol follows the unit it refers to contained metal content.
Notes
1. Economic Demonstrated Resources (EDR) predominantly comprise Ore Reserves and most Measured and Indicated Mineral Resources that have been reported in compliance with the Joint Ore Reserves Committee (JORC) Code to the Australian Securities Exchange (ASX). In addition, some reserves and resources have been reported using other reporting codes to foreign stock exchanges and Geoscience Australia may hold confidential data for some commodities.
2. Total Inferred Resources in economic, subeconomic and undifferentiated categories.
3. Accessible Economic Demonstrated Resources (AEDR) is the portion of total EDR that is accessible for mining. AEDR does not include resources that are inaccessible for mining because of environmental restrictions, government policies or military lands.
4. Australian mine production from Resources and Energy Quarterly, September 2020 published by the Office of the Chief Economist, Department of Industry, Science, Energy and Resources unless otherwise stated. Production data often have a higher level of certainty than reserve and resource estimates and, thus, may be presented with more significant figures.
5. World economic resources from Mineral Commodity Summaries 2020 published by the USGS and adjusted with Geoscience Australia data, unless otherwise stated.
6. World production from Mineral Commodity Summaries 2020 published by the USGS and adjusted with Geoscience Australia data, unless otherwise stated.
7. Australian antimony production from company reports (Mandalay Resources Ltd).
8. Australian black coal production refers to raw coal.
9. World economic resources of black coal derived from BP Statistical Review of World Energy June 2020.
10. World mine production of black coal derived from International Energy Agency, Coal Information 2020 Overview.
11. Australian production of brown coal is supplied by Internation Energy Agency 2019.
12. World economic resources of brown coal derived from BP Statistical Review of World Energy June 2020.
13. World mine production of brown coal from International Energy Agency (Coal Information 2020 Overview).
14. World economic resources and mine production are presented as chromite ore.
15. Australian cobalt production data from Department of Mines, Industry Regulation and Safety, Western Australian Government, 2019 Major commodities resources file.
16. Australian diamond production from Rio Tinto Ltd annual report 2019.
17. World resource figures are for industrial diamonds only, no data provided for resources of gem diamonds.
18. World mine production of fluorine excludes the USA.
19. Australian lithium production data (tonnes of spodumene concentrates) from Department of Mines, Industry Regulation and Safety, Western Australian Government, 2019 Major commodities resources file. Production of Lithium calculated assuming 6% Li2O in spodumene concentrates.
20. The Department of State Development, South Australia (Report Book 2020/00010) reported magnesite production of 5,511t in 2019 .The Queensland Department of Natural Resources and Mines (Queensland Annual Mineral Summary 2018–19) reported magnesite production of 407,761 t in 2018–19.
21. World mine production excludes the USA.
22. Australian manganese production from company reports and total reported production from Department of Mines, Industry Regulation and Safety, Western Australian Government, 2018–2019 Major commodities resources file.
23. World economic resources and mine production are presented as manganese content, not manganese ore.
24. Australian mineral sands production from company reports.
25. There are no mines producing niobium as a primary product in Australia. It is likely that niobium is produced as a by-product at some lithium/tantalum operations, but these data have not been reported.
26. World resources of oil shale from World Energy Council, World Energy Resources 2016.
27. Australian platinum and palladium production data from Department of Mines, Industry Regulation and Safety, Western Australian Government, 2019 Major commodities resources file.
28. World mine production is platinum and palladium only.
29. Phosphate rock is reported as being economic at grades ranging from 8.7% to 30.2% P2O5.
30. Geoscience Australia estimate based on reported mining production of 259,835 t from Christmas Island in 2019,462 t from South Australia in 2019 (Report Book 2020/00010), and 720,186 t from Queensland Department of Natural Resources and Mines (Queensland Annual Mineral Summary 2018–19).
31. Rare earths comprise rare earth oxides (REO) and yttrium oxide (Y2O3).
32. Australian rare earths production is based on Western Australian production of concentrates from Mount Weld (17,613 t) and from trial mining and processing at Browns Range (45.66 t).
33. Australian tantalum production data from Department of Mines, Industry Regulation and Safety, Western Australian Government, 2019 Major commodities resources file. Production represents a maximum as no correction has been made for actual tantalite concentration in reported concentrates.
34. Australian tungsten production from company correspondence (Tasmania Mines Pty Ltd).
35. World economic resources from the International Atomic Energy Agency estimate for Reasonably Assured Resources recoverable at costs of less than US$130/kg U published in Uranium 2020: Resources, Production and Demand (the Red Book).
36. World production of uranium in 2019 from World Nuclear Organisation (World Uranium Mining Production, September 2020 update).
Trends in EDR
Australia’s EDR of the following mineral commodities increased significantly (>5%) during 2019: copper, gold, graphite, manganese ore, molybdenum, nickel, platinum group elements, potash, tantalum, tin and vanadium (Table 4). The EDR of five commodities decreased significantly in 2019: antimony, brown coal, diamond, magnesite and uranium (Table 4). All other mineral EDR stayed within 5% of the previous year’s estimates (Table 4).
Trends in EDR for Australia’s major mineral commodities have undergone significant and sometimes dramatic changes over the period 1975 to 2019 (see Section 8). These changes can be attributed to one, or a combination, of the following factors:
- Increases in resources resulting from discoveries of new deposits and delineation of extensions at known deposits.
- Depletion of resources as a result of mine production.
- Advances in mining and metallurgical technologies, e.g. carbon-based processing technologies for gold have enabled economic extraction from low-grade deposits that were previously uneconomic.
- Adoption of the JORC Code for resource classification and reporting by the Australian minerals industry and the subsequent impacts on re-estimation of Ore Reserves and Mineral Resources to comply with the requirements of the JORC Code. The impacts of the JORC Code on EDR occurred at differing times for each of the major commodities.
- Significant changes in the prices of mineral commodities driven largely by both escalating and cooling demand from China over the past two decades.
Table 4. Changes in Australia's EDR from 2018 to 2019.
| Commodity | Unit | EDR | ||
|---|---|---|---|---|
| 2018 | 2019 | Change (%) | ||
| Antimony | kt Sb | 142.7 | 100.5 | -30% |
| Bauxite | Mt | 5,118 | 5,292 | 3% |
| Black Coal | ||||
| In situ | Mt | 88,085 | 89,707 | 2% |
| Recoverable | Mt | 73,719 | 75,428 | 2% |
| Brown Coal | ||||
| In situ | Mt | 92,244 | 85,634 | -7% |
| Recoverable | Mt | 76,951 | 73,865 | -4% |
| Cobalt | kt Co | 1,353 | 1,399 | 3% |
| Copper | Mt Cu | 88.17 | 93.36 | 6% |
| Chromium | kt Cr | 0.0 | 0.5 | |
| Diamond | Mc | 25.48 | 10.97 | -57% |
| Fluorine | kt F | 343 | 343 | 0% |
| Gold | t Au | 10,165 | 10,795 | 6% |
| Graphite | Mt | 7.25 | 7.97 | 10% |
| Iron | ||||
| Iron ore | Mt | 49,604 | 50,593 | 2% |
| Contained iron | Mt Fe | 24,122 | 24,508 | 2% |
| Lead | Mt Pb | 35.78 | 37.31 | 4% |
| Lithium | kt Li | 5,4371 | 5,702 | 5% |
| Magnesite | Mt MgCO3 | 316 | 285 | -10% |
| Manganese Ore | Mt | 232 | 272 | 17% |
| Mineral Sands | ||||
| Ilmenite | Mt | 276.3 | 274.7 | -1% |
| Rutile | Mt | 35.4 | 35.4 | 0 |
| Zircon | Mt | 79.9 | 79.7 | 0 |
| Molybdenum | kt Mo | 171 | 248 | 45% |
| Nickel | Mt Ni | 19.7 | 21.2 | 8% |
| Niobium | kt Nb | 216 | 216 | 0% |
| PGE | t metal | 31.5 | 37.6 | 19% |
| Phosphate | ||||
| Phosphate rock | Mt | 1,091 | 1,091 | 0% |
| Contained phosphate | Mt P2O5 | 178 | 178 | 0% |
| Potash | Mt K2O | 302 | 35 | 17% |
| Rare Earths3 | Mt oxide | 4.12 | 4.03 | -2% |
| Scandium | kt Sc | 26.05 | 26.91 | 3% |
| Silver | kt Ag | 88.36 | 90.26 | 2% |
| Tantalum | kt Ta | 88.6 | 93.5 | 5% |
| Tin | kt Sn | 430 | 561 | 30% |
| Tungsten | kt W | 394 | 403 | 2% |
| Uranium | kt U | 1,325 | 1,147 | -13% |
| Vanadium | kt V | 4,646 | 6,019 | 30% |
| Zinc | Mt Zn | 66.96 | 68.92 | 3% |
Abbreviations
t = tonne; kt = kilotonnes (1,000 t); Mt = million tonnes (1,000,000 t); Mc = million carats (1,000,000 carats); PGE = platinum group elements (Pt, Pd, Os, Ir, Ru, Rh).
Where an element symbol follows the unit it refers to contained metal content.
EDR = Economic Demonstrated Resources.
Notes
1. Geoscience Australia published an EDR of lithium amounting to 4,718 kt in Australia’s Identified Mineral Resources 2019. New information has become available, resulting a re-evaluation of Australia’s lithium inventory for that period.
2. Geoscience Australia published an EDR of potash amounting to 72 Mt in Australia’s Identified Mineral Resources 2019. New information has become available, particularly around the drainable recovery from some deposits, resulting a re-evaluation of Australia’s potash inventory to 30 Mt for 2018.
3. Rare earths comprise rare earth oxides (REO) and yttrium oxide (Y2O3).
Mine inventories as a proportion of EDR
While the national inventory is an aggregation of individual resources, it is useful to compare the EDR attributable to currently operating mines with all mines and the national total as shown in Table 5. In many cases, operating mines dominate the minerals inventory. With the exception of mineral sands, black coal and nickel, operating mines of most major commodities contain more than 50% of Australia’s EDR (Table 5). When all mines are considered (operating + care and maintenance + developing), only the mineral sand commodities of ilmenite, rutile and zircon have more than 50% of EDR associated with undeveloped deposits. For copper, diamond and uranium, Australian operating mines account for 80% or more of EDR (Table 5).
The high proportion of the national EDR attributed to operating mines is not unexpected as most resource delineation occurs at, and in the vicinity of, existing operations. However, this concentration of EDR at operating mines results in a number of potential supply vulnerabilities in the minerals sector. Many commodities have large EDR (e.g. manganese ore, bauxite, uranium and mineral sands; Table 3) but relatively few operating mines (Table 1). Price shocks or other circumstances leading to the permanent closure of one or more of these mines would dramatically impact Australia’s potential to supply these minerals. If there is no foreseeable possibility of a mine reopening, then the deposit is removed from EDR. Economic Demonstrated Resources will only be replaced from new deposits if mining and exploration companies can attract the capital necessary for exploration, drilling and development.
Other commodities with large EDR, such as gold, black coal and iron ore, have many mines (Table 1). Thus, Australia’s EDR of these commodities and ability to supply appear unlikely to be significantly impacted by the fortunes of individual mines. Black coal, for example, has 263 deposits contributing to the national EDR, but the 96 operating mines comprise only 41% of that EDR (Table 5). If even a sizeable proportion of coal mines were inaccessible in the future, a large resource could potentially still be exploited.
However, this is not necessarily the case for gold. Australia has the largest EDR of gold in the world (Table 8) but most of it is associated with large, low-grade, multi-commodity deposits such as Olympic Dam (South Australia) and Cadia (New South Wales). The majority of production, however, comes from lode-gold deposits which produced 67% of Australia’s gold in 2019. At 2019 rates of production, 685 gold deposits have a potential resource life of 35 years based on AEDR (Table 9), but the operations mining lode gold only have a comparable resource life of 10 years. With depletion of these high-grade mines, it is unlikely that production at the other types of deposit could make up the shortfall in the same period, thus Australia’s gold production, and associated export income, would inevitably decline. This circumstance is, of course, based on the very unlikely scenario that three things will happen: (1) future rates of production are unchanged from those of 2019, (2) deposits currently assessed as economic/subeconomic remain so in the future and (3) companies do not replace depleted gold resources. More probably, the EDR from depleted lode-gold deposits will be replaced by successful mineral exploration. Advances in extractive technologies or substantial price rises could also contribute to future EDR.
Mineral exploration will occur in and around existing mines (brownfield exploration) but the most important contributions to Australia’s future EDR of gold and other commodities is more likely to come from successful exploration in new and under-explored areas of the continent (greenfield exploration). It is through the discovery of large, globally significant mineral deposits such as Broken Hill, Mount Isa, Olympic Dam and the Kalgoorlie goldfields, that Australia has become a mining world leader. If Australia is to remain globally competitive, then new discoveries are essential as only the very best deposits will attract the investment necessary for development in an internationally competitive investment environment.
Table 5. Comparisons of EDR of major commodities at Australian mines to total EDR as at December 2019.
| Commodity | Unit | EDR | Number of | Percentage of EDR | ||||
|---|---|---|---|---|---|---|---|---|
| Deposits with EDR | Operating Mines | All Mines | Operating Mines | All Mines | Other Deposits | |||
| Bauxite | Mt | 5,292 | 20 | 10 | 15 | 63% | 72% | 28% |
| Black Coal – Recoverable | Mt | 75,428 | 263 | 96 | 119 | 41% | 51% | 49% |
| Copper | Mt Cu | 93.36 | 181 | 43 | 55 | 83% | 84% | 16% |
| Diamond | Mc | 10.97 | 3 | 1 | 3 | 95% | 100% | 0% |
| Gold | t Au | 10,795 | 685 | 150 | 243 | 70% | 72% | 28% |
| Iron Ore | Mt | 50,593 | 80 | 36 | 54 | 56% | 65% | 35% |
| Lead | Mt Pb | 37.31 | 77 | 19 | 27 | 64% | 89% | 11% |
| Lithium | kt Li | 5,702 | 11 | 7 | 7 | 71% | 71% | 29% |
| Manganese Ore | Mt | 272 | 6 | 3 | 4 | 74% | 74% | 26% |
| Mineral Sands | ||||||||
| Ilmenite | Mt | 274.7 | 79 | 12 | 18 | 18% | 45% | 55% |
| Rutile | Mt | 35.4 | 58 | 10 | 15 | 15% | 29% | 71% |
| Zircon | Mt | 79.7 | 80 | 10 | 16 | 15% | 47% | 53% |
| Nickel | Mt Ni | 21.2 | 95 | 10 | 21 | 36% | 54% | 46% |
| Silver | kt Ag | 90.26 | 133 | 31 | 42 | 64% | 79% | 22% |
| Uranium | kt U | 1,147 | 33 | 3 | 4 | 80% | 81% | 19% |
| Zinc | Mt Zn | 68.79 | 84 | 20 | 26 | 79% | 89% | 11% |
Abbreviations
t = tonne; kt = kilotonnes (1,000 t); Mt = million tonnes (1,000,000 t); Mc = million carats (1,000,000 carats).
Where an element symbol follows the unit it refers to contained metal content.
Notes
All Mines = mines that are currently operating, placed on care and maintenance or under development.
'Deposits with EDR’ is inclusive of the mines.
Ore Reserves as a proportion of EDR and AEDR
The National Classification System’s category of EDR captures those Demonstrated Resources that are considered to be economic under current conditions or those of the foreseeable future: EDR indicate potential supply. However, just because a deposit could be exploited profitably does not mean that it will be. The EDR category does not capture modifying factors (such as metallurgical, engineering, processing, infrastructure, environmental, social and regulatory considerations) and commercial considerations (e.g. costs and internal rates of return) that mining companies must consider for individual deposits to determine an Ore Reserve and mine plan. Table 6 compares the short-term outlook provided by Ore Reserves to the long-term outlook of EDR.
In addition, some resources that would normally meet the criteria to be considered EDR are not accessible because of environmental, legal or military land-use restrictions. Only five mineral commodities are currently affected by land-use restrictions: 9% of black coal EDR, 14% of brown coal EDR, <1% of gold EDR, around 5% of mineral sands EDR, 7% of platinum group elements EDR and 5% of uranium EDR (see Table 3 for comparisons of EDR and AEDR). Thus, it is more applicable to compare Ore Reserves to AEDR for these commodities (Table 6).
Table 6. Comparisons of Ore Reserves of major commodities to total EDR and AEDR as at December 2019.
| Commodity | Unit | Ore Reserves | EDR | AEDR | Ore Reserves/EDR (%) | Ore Reserves/AEDR (%) | ||
|---|---|---|---|---|---|---|---|---|
| Bauxite | Mt | 2,045 | 5,292 | 5,292 | 39% | 39% | ||
| Black Coal – Recoverable | Mt | 19,459 | 75,428 | 68,546 | 26% | 28% | ||
| Copper | Mt Cu | 22.99 | 93.36 | 93.36 | 25% | 25% | ||
| Diamond | Mc | 10.30 | 10.97 | 10.97 | 94% | 94% | ||
| Gold | t Au | 4,069 | 10,795 | 10,768 | 38% | 38% | ||
| Iron Ore | Mt | 23,714 | 50,593 | 50,593 | 47% | 47% | ||
| Lead | Mt Pb | 11.52 | 37.31 | 37.31 | 31% | 31% | ||
| Lithium | kt Li | 3,761 | 5,702 | 5,702 | 66% | 66% | ||
| Manganese Ore | Mt | 91 | 272 | 272 | 34% | 34% | ||
| Mineral Sands | ||||||||
| Ilmenite | Mt | 63.6 | 274.7 | 264.8 | 23% | 24% | ||
| Rutile | Mt | 9.9 | 35.4 | 32.9 | 28% | 30% | ||
| Zircon | Mt | 24.9 | 79.7 | 77.1 | 31% | 32% | ||
| Nickel | Mt Ni | 8.3 | 21.2 | 21.2 | 39% | 39% | ||
| Silver | kt Ag | 25.08 | 90.26 | 90.26 | 28% | 28% | ||
| Uranium | kt U | 284 | 1,147 | 1,091 | 25% | 26% | ||
| Zinc | Mt Zn | 24.37 | 68.92 | 68.92 | 35% | 35% | ||
Abbreviations
t = tonne; kt = kilotonnes (1,000 t); Mt = million tonnes (1,000,000 t); Mc = million carats (1,000,000 carats).
Where an element symbol follows the unit it refers to contained metal content.
EDR = Economic Demonstrated Resources.
AEDR = Accessible Economic Demonstrated Resources.
Contribution of largest deposits to EDR
Most of Australia’s EDR of major commodities are skewed heavily toward a small number of relatively large deposits. Table 7 shows that more than 80% of all EDR lies in the top 20 deposits for most commodities. The two exceptions are gold and black coal, both of which have the greatest number of deposits of all mineral commodities in Australia, as well as the greatest number of deposits that contribute to EDR. Even so, the top 20 deposits of gold, which make up less than 3% of the 710 deposits with an EDR, account for 63% of all gold EDR (Table 7). For black coal, the top 20 deposits (8% of 263 deposits with an EDR) account for 42% of EDR.
Table 7. Distribution of EDR of major commodities in Australia as at December 2019.
| Commodity | Unit | EDR | Number of | Percentage of EDR in largest | ||
|---|---|---|---|---|---|---|
| Deposits | Deposits with EDR | 10 deposits | 20 deposits | |||
| Bauxite | Mt | 5,292 | 40 | 20 (50%) | 99 | 100 |
| Black Coal– Recoverable | Mt | 75,428 | 416 | 263 (63%) | 28 | 42 |
| Copper | Mt Cu | 93.36 | 404 | 181 (45%) | 84 | 90 |
| Diamond | Mc | 10.97 | 12 | 3 (25%) | 100 | 100 |
| Gold | t Au | 10,795 | 1,880 | 710 (38%) | 52 | 63 |
| Iron Ore | Mt | 50,593 | 353 | 80 (23%) | 63 | 84 |
| Lead | Mt Pb | 37.31 | 169 | 77 (46%) | 89 | 96 |
| Lithium | kt Li | 5,702 | 15 | 11 (73%) | 100 | 100 |
| Manganese Ore | Mt | 272 | 44 | 6 (14%) | 100 | 100 |
| Mineral Sands | ||||||
| Ilmenite | Mt | 274.7 | 227 | 79 (35%) | 66 | 81 |
| Rutile | Mt | 35.4 | 204 | 58 (28%) | 69 | 88 |
| Zircon | Mt | 79.7 | 227 | 80 (35%) | 76 | 89 |
| Nickel | Mt Ni | 21.2 | 239 | 95 (36%) | 68 | 87 |
| Silver | kt Ag | 90.26 | 271 | 133 (49%) | 76 | 87 |
| Uranium | kt U | 1,147 | 112 | 33 (30%) | 94 | 99 |
| Zinc | Mt Zn | 68.92 | 186 | 84 (46%) | 87 | 93 |
Abbreviations
t = tonne; kt = kilotonnes (1,000 t); Mt = million tonnes (1,000,000 t); Mc = million carats (1,000,000 carats).
Where an element symbol follows the unit it refers to contained metal content.
EDR = Economic Demonstrated Resources.
Notes
For classification as a mineral deposit there must be, at a minimum, an Inferred Resource compliant with the JORC Code (or equivalent) or, in some cases, a historical (pre-JORC) resource estimate.
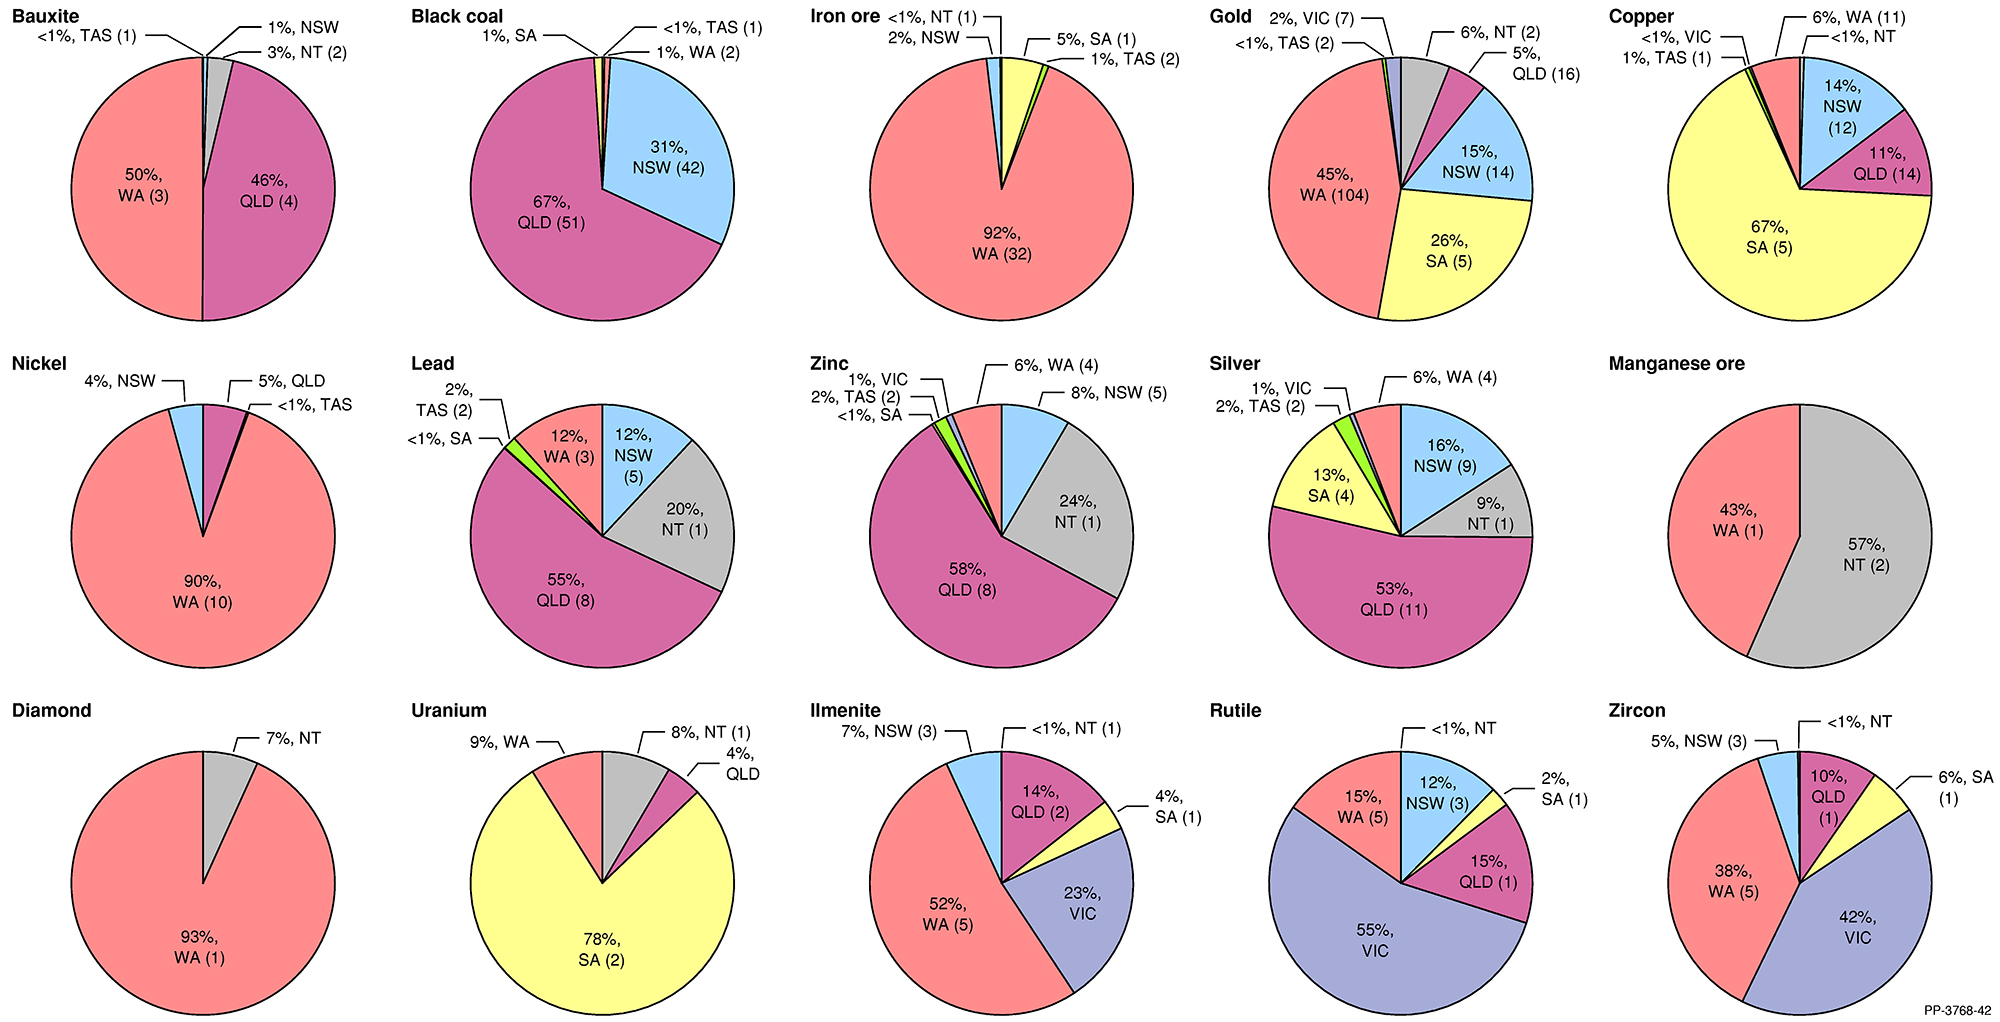
Geographical distribution of EDR
Most bauxite EDR are attributable to Queensland and Western Australia (Figure 2) where the giant deposits in Cape York and the Darling Range, respectively, dominate. Similarly, Australia’s enormous iron ore EDR are geographically concentrated in the Pilbara region of Western Australia. Western Australia also holds almost all of nickel and diamond EDR, though the latter has fallen dramatically in 2020 with the imminent closure of the Argyle mine (Table 4). Manganese ore EDR are found in Western Australia and the Northern Territory. On the other side of the country, almost all black coal EDR are located in Queensland and New South Wales (Figure 2). Silver, lead, zinc, copper, uranium and mineral sands are more dispersed across the country (Figure 2), but the top ten deposits for each of these minerals dominate EDR (66–94%; Table 7).
National Classification System
The following terminology and definitions are used in Australia’s National Classification System for Identified Mineral Resources.
Resource: A concentration of naturally occurring solid, liquid, or gaseous materials in or on the Earth’s crust and in such form that its economic extraction is presently or potentially (within a 20–25 year timeframe) feasible.
Identified Resource: A specific body of mineral-bearing material whose location, quantity and quality are known from specific measurements or estimates from geological evidence for which economic extraction is presently or potentially (within a 20–25 year timeframe) feasible.
To reflect degrees of geological assurance, Identified Resources can be divided into Measured Resources, Indicated Resources and Inferred Resources where Measured Resources have the most geological confidence and Inferred Resources the least. The National Classification System’s definitions for Measured, Indicated and Inferred Resources are consistent with those of the JORC Code.
Under the JORC Code, with the application of Modifying Factors and mine planning, Measured Resources can be converted into Proved Ore Reserves or Probable Ore Reserves and Indicated Resources can be converted into Probable Ore Reserves.
Demonstrated Resource: A collective term for the sum of Measured and Indicated Resources, including Proved and Probable Ore Reserves.
Economic: This term implies that, at the time of determination, profitable extraction or production under defined investment assumptions has been established, analytically demonstrated, or assumed with reasonable certainty.
Economic Demonstrated Resource (EDR): A Demonstrated Resource that is regarded as economic under the definition above. The EDR category provides a long-term view of what is likely to be available for mining (potential supply). It does not include Inferred Resources which do not have enough geological confidence to support mine planning. For shorter-term, commercial viewpoints of the economic category see Table 1 (Ore Reserves and Mineral Resources at Operating Mines) and Table 2 (Australia’s Ore Reserves).
- Subeconomic: This term refers to those resources that are geologically demonstrated but which do not meet the criteria of Economic at the time of determination. Subeconomic Resources include paramarginal and submarginal categories:
- Paramarginal: That part of Subeconomic Resources which, at the time of determination, could be produced given postulated limited increases in commodity prices or cost-reducing advances in technology. The main characteristics of this category are economic uncertainty and/or failure (albeit just) to meet the criteria of economic.
Submarginal: That part of Subeconomic Resources that would require a substantially higher commodity price or major cost-reducing advance in technology to render them economic.
Accessible Economic Demonstrated Resource (AEDR): Some resources have enough geological confidence to be considered a Demonstrated Resource and, in normal circumstances, would also be regarded as economic but they are not currently available for development because of legal and/or land-use restrictions. They are included in EDR but not in AEDR.
Banner image: Permanent magnets in many home appliances contain copper coils and cobalt. Australia has the world’s second largest resources of both.