

Antimony
Antimony is a silvery, lustrous grey metal that exhibits poor heat and electrical conductivity. It is relatively soft, measuring only 3.25 on Moh’s scale of mineral hardness. Antimony is commonly found in association with gold mineralisation but it also occurs with some silver-lead-zinc deposits. Its average abundance in the Earth’s crust ranges from 0.2 to 0.5 ppm, which is 10 times that of silver.
It is most commonly used with other metals to form antimony alloys or combined with oxygen to form antimony trioxide (ATO; Sb2O3). Metallic antimony is used as a hardening agent for lead and its use in lead storage batteries accounts for around one third of global use. Antimony alloys are also used for manufacturing solder, sheet and pipe metal, ammunition, bearings, castings and pewter.
ATO is used in non-metallic products such as paint (pigment and fire retardant), ceramics (opacifier), enamels (fire retardant), rubber (fire retardant), glass (de-gassing), paper (fire retardant), plastics (fire retardant) and textiles (fire retardant). ATO’s use as a fire retardant also accounts for about one third of global antimony use. In its purest forms, antimony is used in semiconductor technology, infrared detectors and diodes. Antimony is regarded as a critical mineral by many advanced economies and is listed in Australia’s Critical Minerals Strategy 201912.
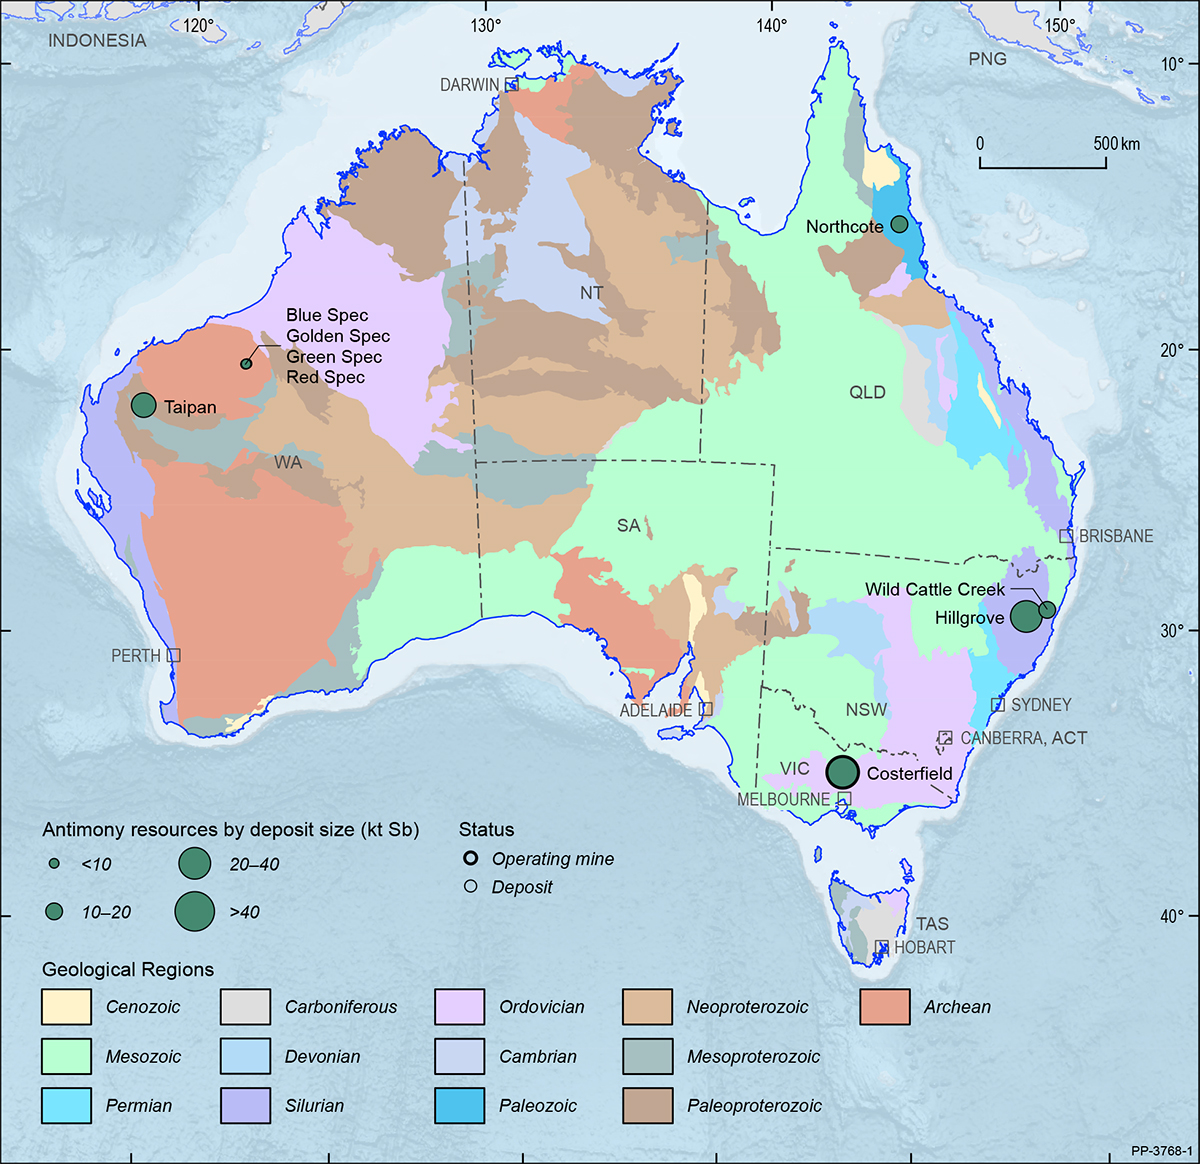
Australia’s EDR of antimony in 2019 were 100.5 kt (Table 3), a decrease from 142.7 kt in 2018, or 30% (Table 4). This ranks Australia’s resources as the world’s fourth largest (Table 8) behind China, Russia and Bolivia. Antimony deposits that contribute to Australia’s EDR occur in New South Wales, Victoria and Western Australia; a minor deposit also occurs in Queensland (Figure 7). Australia’s only antimony producing mine is Costerfield in Victoria. In 2019, the mine produced 2.03 kt of antimony, a decrease of 1.54 kt compared to 2018 (3.57 kt). Australia is ranked seventh in the world for antimony production and accounts for only 1% of global production (Table 8). Antimony production is dominated by China (63%) and Russia (19%).

12 See above n 7.
Bauxite
Australia’s EDR of bauxite had a small rise in 2019, up 3% from 5,118 Mt in 2018 to 5,292 Mt in 2019 (Table 3, Table 4). Subeconomic resources remain unchanged in 2019 at 1,459 Mt and Inferred Resources of bauxite fell slightly in 2018, by 2 Mt to 3,170 Mt in 2019.
Bauxite production increased from 96.5 Mt in 2018 to 105.5 Mt in 2019 (Table 1), an increase of 9%. Ore Reserves of bauxite in 2019 were 2,045 Mt (Table 2), up 4% from 1,962 Mt in 2018. This small increase in Ore Reserves is in line with increased production, thus Australia’s reserve life for bauxite remained similar to the previous year, falling from 20 years to 19 years (Table 2). Resource life (based on AEDR) fell from 55 years to 50 years (Table 9). Australia’s bauxite deposits are shown in Figure 8 on a total resource basis along with alumina refineries and aluminium smelters.
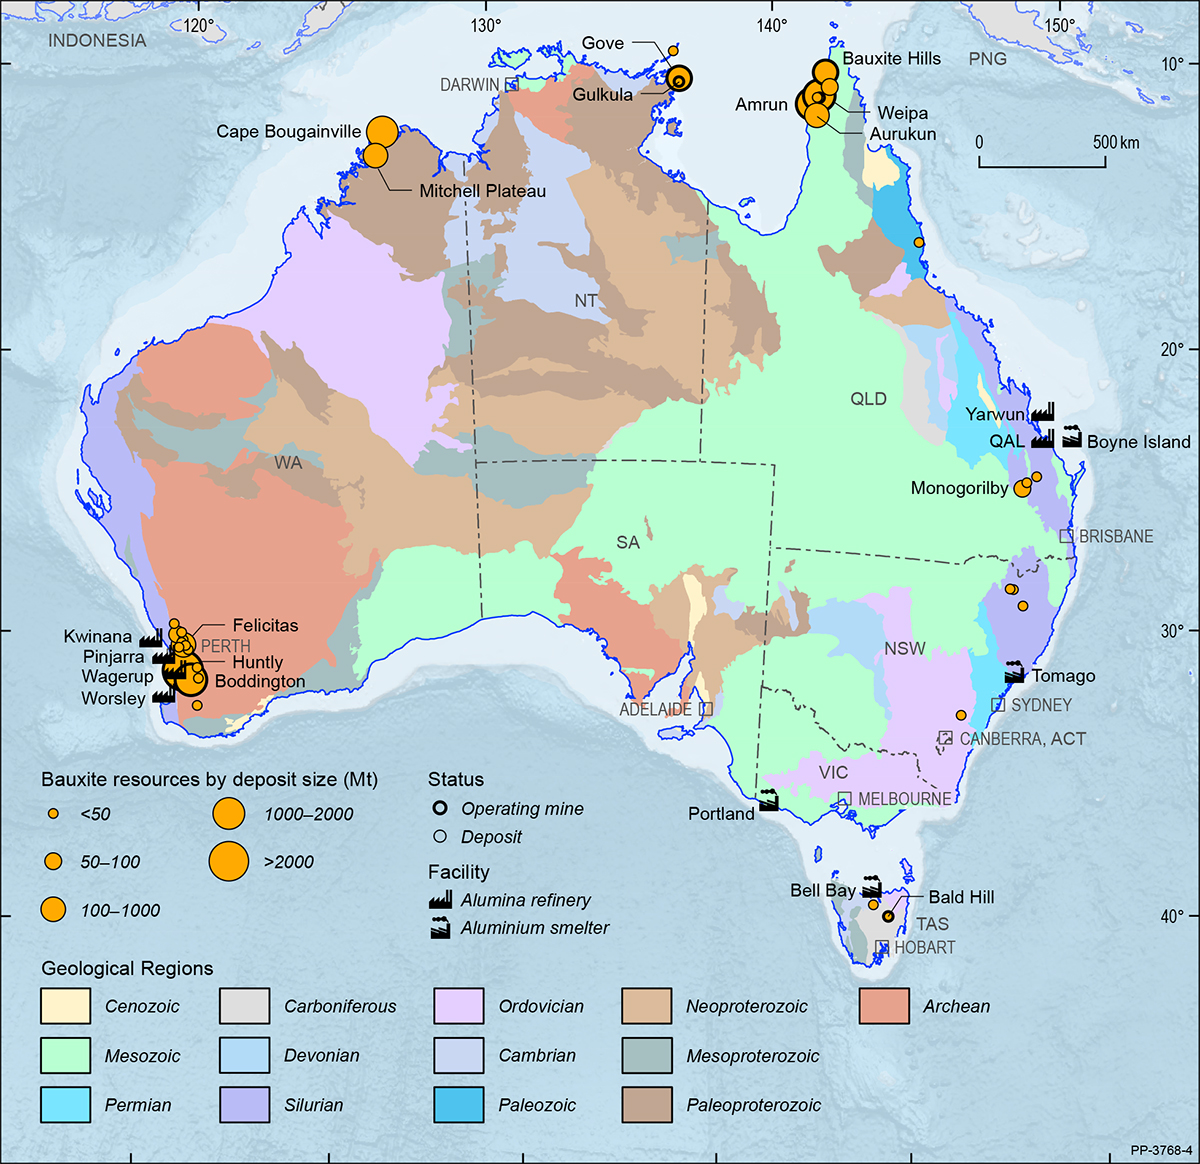
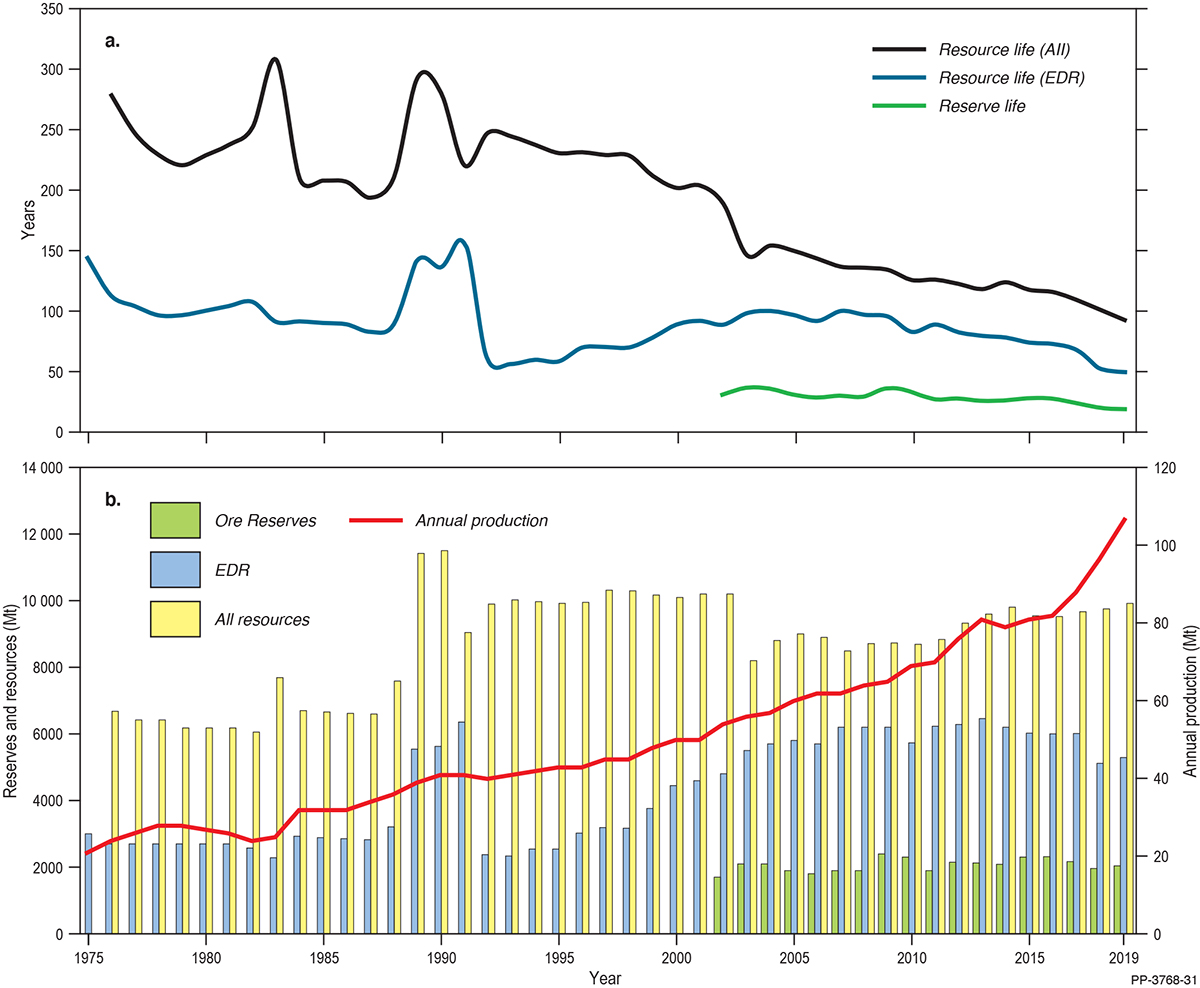
Figure 9 shows that, since 1975, bauxite production has increased more rapidly than the bauxite inventory. In 1975, bauxite production was 21 Mt which rose to 105.5 Mt in 2019, an increase of 402%. Bauxite EDR have increased 76% over the same period (3,000 Mt in 1975 to 5,292 Mt in 2019) and total resources of bauxite (EDR + Subeconomic + Inferred) have increased from 6,678 Mt in 1976 to 9,921 Mt in 2019, an increase of 49%.
Australia had ten operating bauxite mines in 2019. The large mines of Huntly and Boddington continued to operate in the Darling Range of Western Australia, supplying the alumina refineries of Pinjarra, Kwinana, Wagerup (Huntly) and Worsley (Boddington). The Huntly operation also includes the Willowdale deposit which is being moved to a different part of the mining lease to ensure grades are maintained and haulage costs contained. Other activity in Western Australia includes an early-stage proposal to mine 6 Mtpa of bauxite from the Wuudagu deposit in the Kimberly of Western Australia.
In the Northern Territory, the major bauxite mine is Gove, run by Rio Tinto Ltd near the town of Nhulunbuy. Gumatj Corporation Ltd also produces bauxite from the Gulkula mine near Gove. It is Australia’s first 100%-indigenous owned and operated bauxite mine. In December 2019, Rio Tinto announced that it had signed a new sales agreement to continue purchasing bauxite from Gulkula for another two years.
In Queensland, Rio Tinto operates major mines at Weipa and Amrun on the western side of the Cape York Peninsula. In 2019, Rio Tinto opened a new Bauxite Integrated Operations Centre in Brisbane that enables mining and product dispatch to be managed remotely. It also provides ore information downstream to the refineries and smelters, enabling them to adapt their processing operations with minimal disruption.
Also in Cape York, Bauxite Hills, owned by Metro Mines Ltd, produced 3.5 Mt of ore in 2019 and received a Loan Facility of up to $47 million from the Northern Australia Infrastructure Facility for its Stage 2 Expansion to take production to 6 Mtpa. Unfortunately, in September 2020, when the mine had produced almost 2.5 Mt that year, it was put onto care and maintenance ahead of its planned wet-season shutdown, owing to the impacts of the COVID-19 pandemic on sales to China. The company plans to re-open in April 2021 at the end of the wet season.
The Binjour project in southeast Queensland was also impacted by COVID-19. Australian Bauxite Ltd and its partner, Rawmin Mining and Industries of India, plan to supply a new low-temperature alumina refinery in southern China from this deposit but some aspects of the development have been put on hold until the effects of the pandemic become clearer. Positively, Australian Bauxite continued to produce bauxite from its Bald Hill operation in Tasmania for cement and fertiliser applications.
Australia remains the world’s largest producer of bauxite accounting for 28% of global production (Table 8). Australia is also the world’s second largest producer of alumina (15%), after China, and the largest exporter, and is ranked sixth in the world for aluminum production (2%). Australia’s resources of bauxite are the second largest in the world with only Guinea holding more, 25% compared to Australia’s 18% (Table 8).
Black Coal
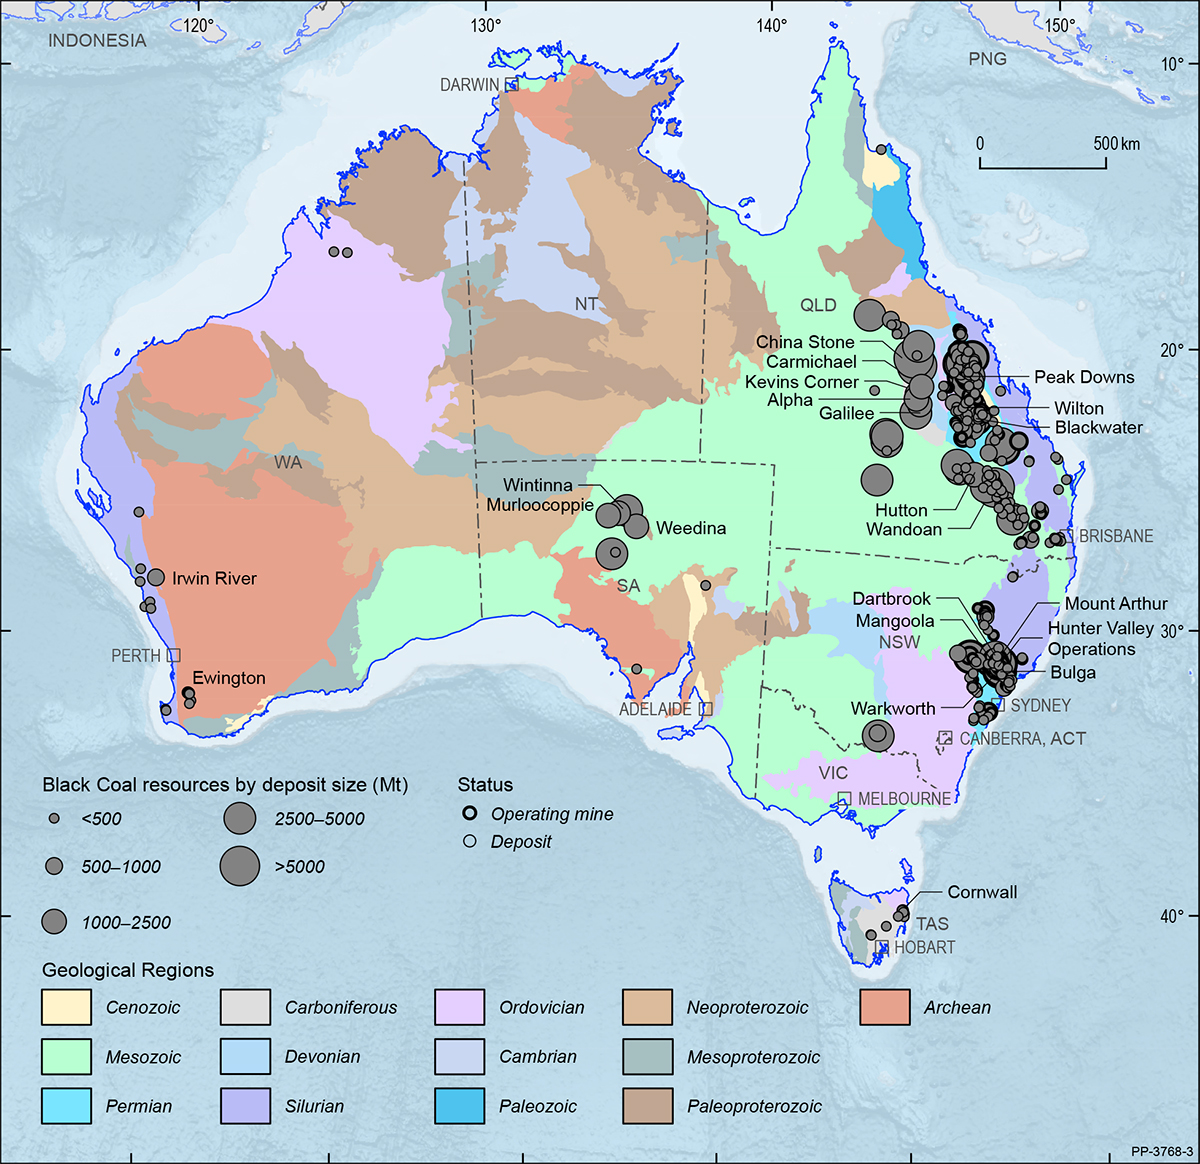
Most of Australia’s recoverable EDR of black coal are in Queensland (67%) and New South Wales (31%) within four coal-bearing sedimentary basins (Bowen, Sydney, Surat and Galilee); the remainder is in South Australia, Western Australia and Tasmania (Figure 2). Major deposits are shown in Figure 10 on a total resource basis. In the twelve months to December 2019, Australia produced 588 Mt of raw coal (Table 1). Of this total, Queensland produced 322 Mt (55%) and New South Wales 258 Mt (44%); the remainder was produced in Western Australia and Tasmania.
From 2018 to 2019, the estimate of Australia’s recoverable EDR of black coal increased by 2% to 75,428 Mt (Table 3, Table 4), and the estimate of in situ EDR also increased during this period by 2% to 89,707 Mt. Australia is thought to hold approximately 10% of world economic resources of black coal and ranks fourth (Table 8), behind the United States (29%), China (18%) and India (13%).
Over the same period, Paramarginal Demonstrated Resources of recoverable black coal decreased by 3 Mt to 1,934 Mt, whilst Submarginal Demonstrated Resources and Inferred Resources increased by 216 Mt to 3,856 Mt and by 1,891 Mt to 84,097 Mt, respectively. Queensland holds the majority of Inferred Resources at 59,555 Mt (71%), followed by New South Wales at 13,522 Mt (16%) and South Australia at 9,307 Mt (11%), with the remainder in Tasmania and Western Australia.
Total Ore Reserves of black coal reported in compliance with the JORC Code amounted to 19,458 Mt in 2019 (Table 2), of which 11,670 Mt (60%) was attributable to 96 operating mines (Table 1, Figure 1). Total Ore Reserves saw a modest decrease of 1% from 19,715 Mt in 2018 to 19,458 Mt in 2019, whilst the Ore Reserves at operating mines saw a larger decrease of 7% from 12,592 Mt to 11,670 Mt.
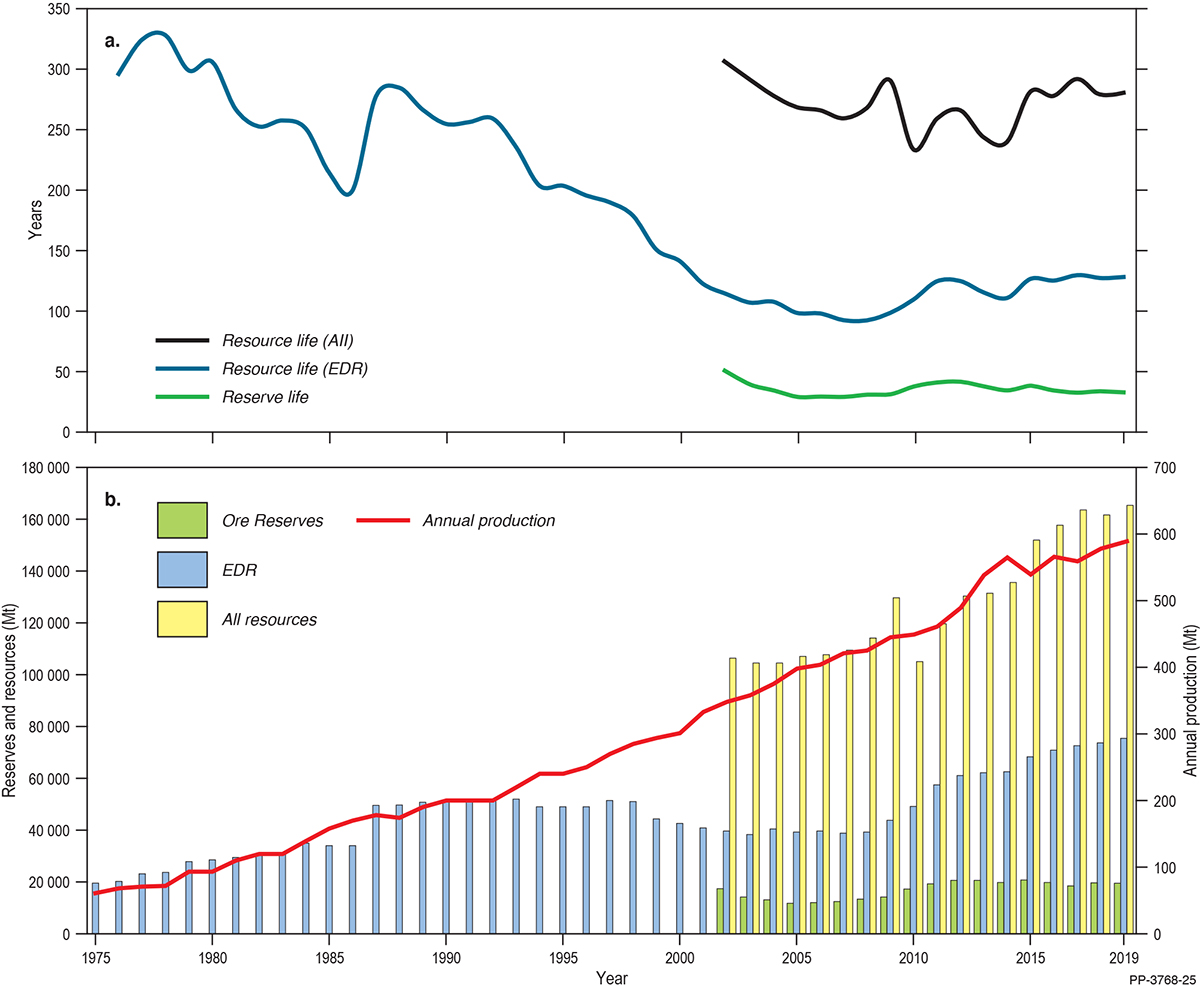
Resource life is a snapshot in time derived by taking a reserve or resource number and dividing it by a production number. At 2019 production levels, the reserve life at operating mines for black coal is potentially 20 years (Table 1, Figure 11), and the resource life, when all resource categories are included, is an estimated 76 years (Table 1).
Last century, resource life (based on EDR) for black coal declined rapidly from more than 300 years in the late 1970s to less than half that by the year 2000 as rapidly increasing production was not matched by new resource delineation. Since the turn of the century, however, the reserve/production and resource/production ratios for recoverable black coal have been generally steady because companies have been demarcating new Ore Reserves and Mineral Resources at approximately the same rate that they have been increasing production (Figure 11).
The majority of Australian black coal production is exported. During the 2019 calendar year, 184 Mt of metallurgical coal (coal used in steel-making), and valued at $41.28 billion (Table 11), was exported primarily to India, China, Japan, South Korea and Taiwan. During the same period, 212 Mt of thermal coal (used in electricity generation), valued at $22.61 billion (Table 11), was exported primarily to Japan, China, South Korea, Taiwan and India.
Exploration expenditure for black coal during 2019 was $229.3 million, an increase of 32% since 2018 ($55.7 million). In 2019, the Bluff coal project in Queensland commenced operations and began shipping pulverised injection coal for use in steel production. Bluff is owned by Carabella Resources Pty Ltd and has the potential to produce up to 1.2 Mtpa of coal.
Brown Coal
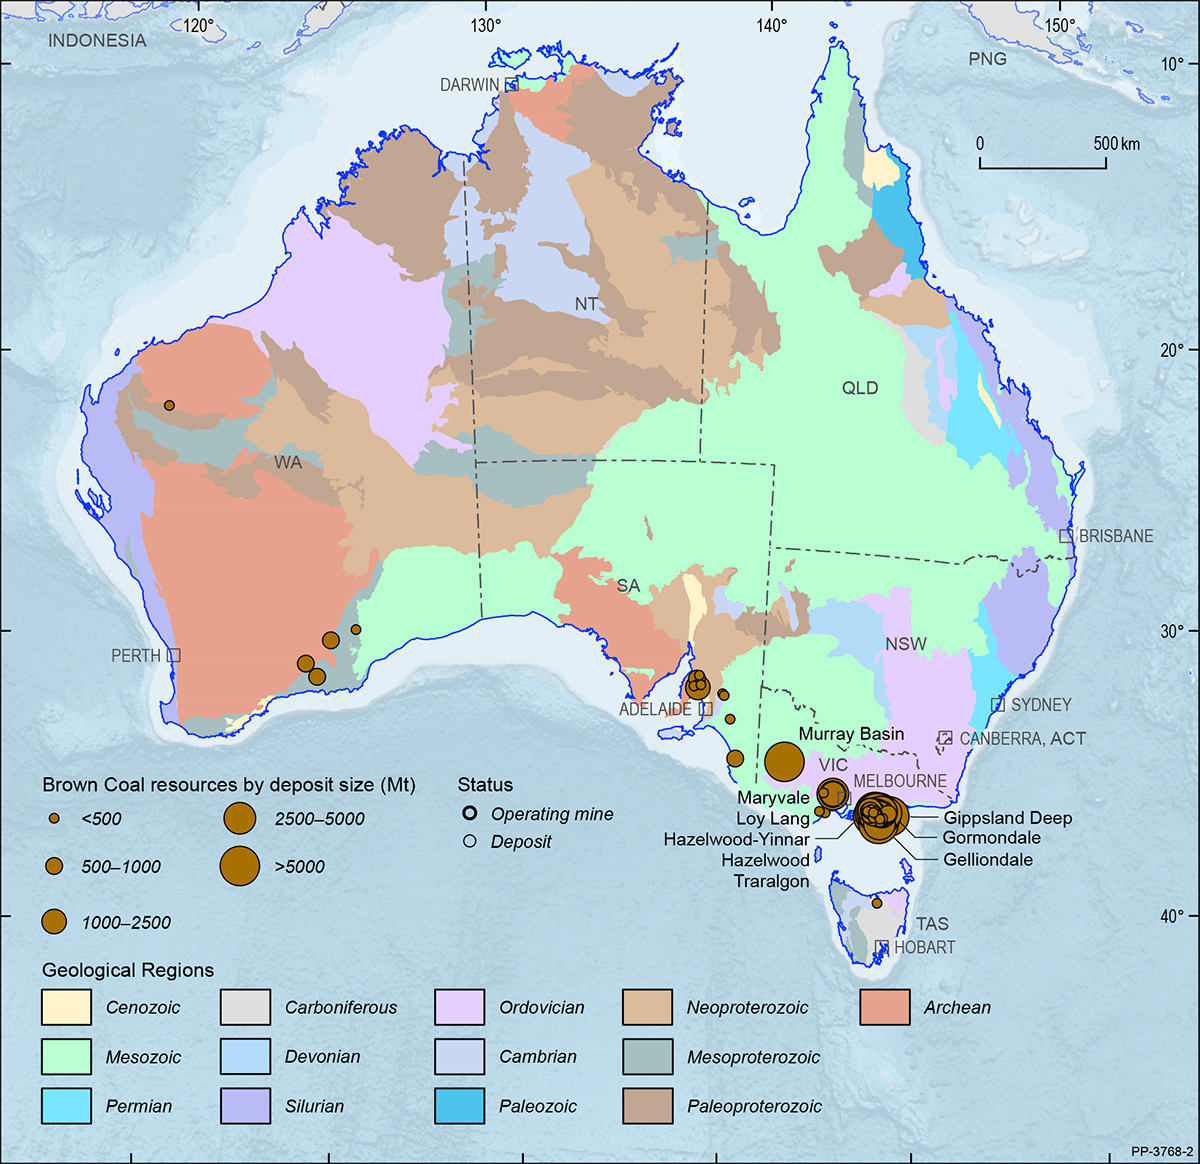
Australia’s substantial brown coal, or lignite, resources are principally hosted in the Gippsland Basin of Victoria (Figure 12). Australian brown coal is mined at three open-cut operations in Victoria where it is used mainly as a feedstock for power stations. Mines at Loy Yang and Yallourn provide coal to power stations in the Latrobe Valley, and a small mine at Maddingley, 50 km northwest of Melbourne, uses brown coal to produce agricultural products.
During 2019, Australia’s three brown coal mines produced an estimated 43 Mt and, at 2019 rates of extraction, AEDR (63,796 Mt; Table 3) will support over 1,000 years of production. Australia is ranked seventh in the world for brown coal production (Table 8) behind Germany, Turkey, Russia, Poland the USA and India.
Australia’s 2019 recoverable brown coal EDR were estimated to be 73,865 Mt (Table 3), a decrease from 76,951 Mt in 2018. Nearly all of Australia’s recoverable brown coal is located in Victoria with more than 90% of EDR in the Latrobe Valley alone. Australia’s share of the world’s economic resources of brown coal is in the order of 24%, ranking Australia second in the world (Table 8) behind Russia (28%) and followed by Germany (11%) and the USA (9%).
The Hydrogen Energy Supply Chain pilot project commenced construction in 2019 and, with the achievement of major project milestones, a one-year pilot project will demonstrate the production and supply of hydrogen gas from coal from 2021. The pilot project is a Japanese-Australian collaboration, whereby brown coal from Loy Yang mine will be used to make hydrogen at a trial plant at AGL’s Loy Yang complex. The hydrogen will be liquefied at a facility at the Port of Hastings, loaded on to a specialised marine carrier and shipped to Japan where it will be used in hydrogen fuel cell vehicles and residences.
Cobalt
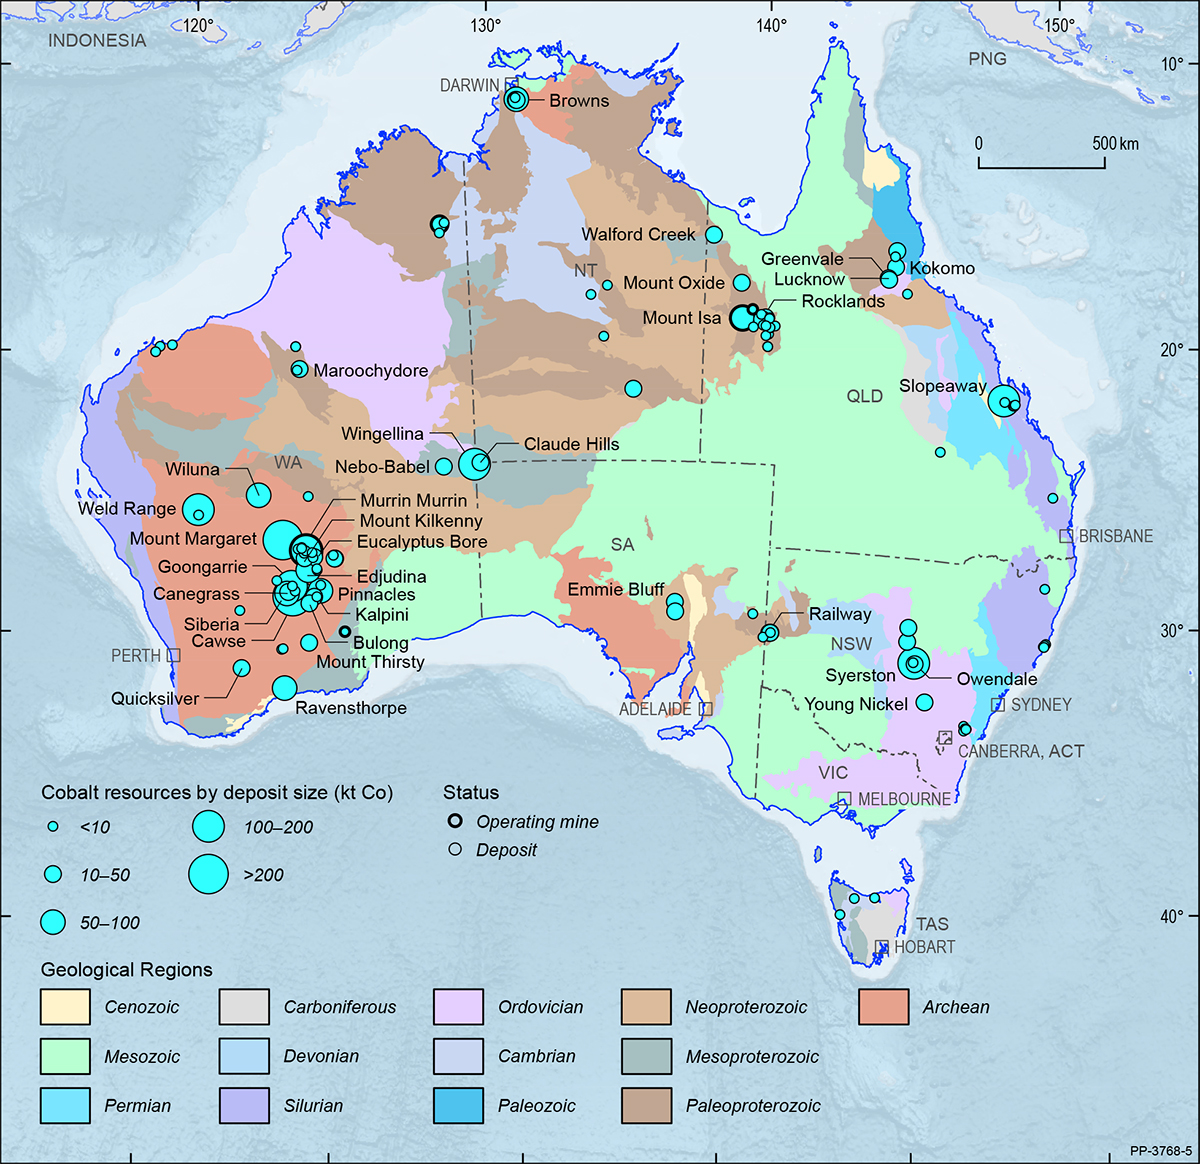
Australia’s EDR of cobalt were 1,399 kt (Table 3) in 2019, an increase of 3% from the 2018 estimate of 1,353 kt (Table 4). Total Ore Reserves were 556.8 kt (Table 2), down 12% from 635 kt in 2018. Most cobalt deposits in Australia occur in Western Australia (Figure 13), which hosts the largest proportion of cobalt EDR (69%). Queensland has the second largest EDR of cobalt (16%) followed by New South Wales (13%) and South Australia (1%). Major deposits are shown in Figure 13 on a total resource basis.
In world rankings, Congo dominates the global economic resources of cobalt with an estimated 3,600 kt which is equivalent to 50% of the global inventory. Australia follows with 19% of global economic resources of cobalt with Cuba third (7%). In 2019, Australia produced 5.7 kt of cobalt (Table 3) ranking third globally (4%; Table 8), behind Congo (100 kt; 70%) and Russia (6.1 kt; 4%).
Cobalt is used as a metal in numerous diverse commercial, industrial and military applications, many of which are strategic and critical. Its main use is in rechargeable battery electrodes. Cobalt is also used in superalloys for gas engine components, as a catalyst for the petroleum and chemical industries, in alloys for tools and in many industrial products such as paints, magnets and tyres. The United States Department of the Interior included cobalt in its published list of 35 critical minerals13, and is listed in Australia’s Critical Minerals Strategy 201914.
The present upward trend of electric vehicle production has increased the interest in cobalt mineral exploration and project development. Commonly, cobalt minerals occur as accessories to nickel and copper, thus it is usually produced as a by-product of nickel and copper mining. However, as the electric car battery industry grows globally, it has been accompanied by increased development activity at deposits where cobalt is regarded as the primary resource.
The average price for cobalt in 2019 was approximately $33,000 per tonne down from $55,000 per tonne in 201815. The USGS notes the average cobalt price trended downward during the first seven months of 2019 owing to oversupply, consumer destocking and announcements by major battery companies about the use of less cobalt in batteries in the future. However, by August, prices began to slightly increase again16.
13 United States Government Federal Register, Final List of Critical Minerals 2018, Document 83 FR 23295 (Interior Department Notice, 18 May 2018). See https://www.federalregister.gov/documents/2018/05/18/2018-10667/final-list-of-critical-minerals-2018 (accessed 18 December 2020).
14 See above n 7.
15 S&P Global, Cobalt Price Chart. See https://platform.marketintelligence.spglobal.com/web/client?auth=inherit#industry/priceChart (accessed 18 December 2020).
16 United States Geological Survey (USGS), Mineral Commodity Summaries 2020, Cobalt. See https://pubs.usgs.gov/periodicals/mcs2020/mcs2020-cobalt.pdf (accessed 18 December 2020).
Copper
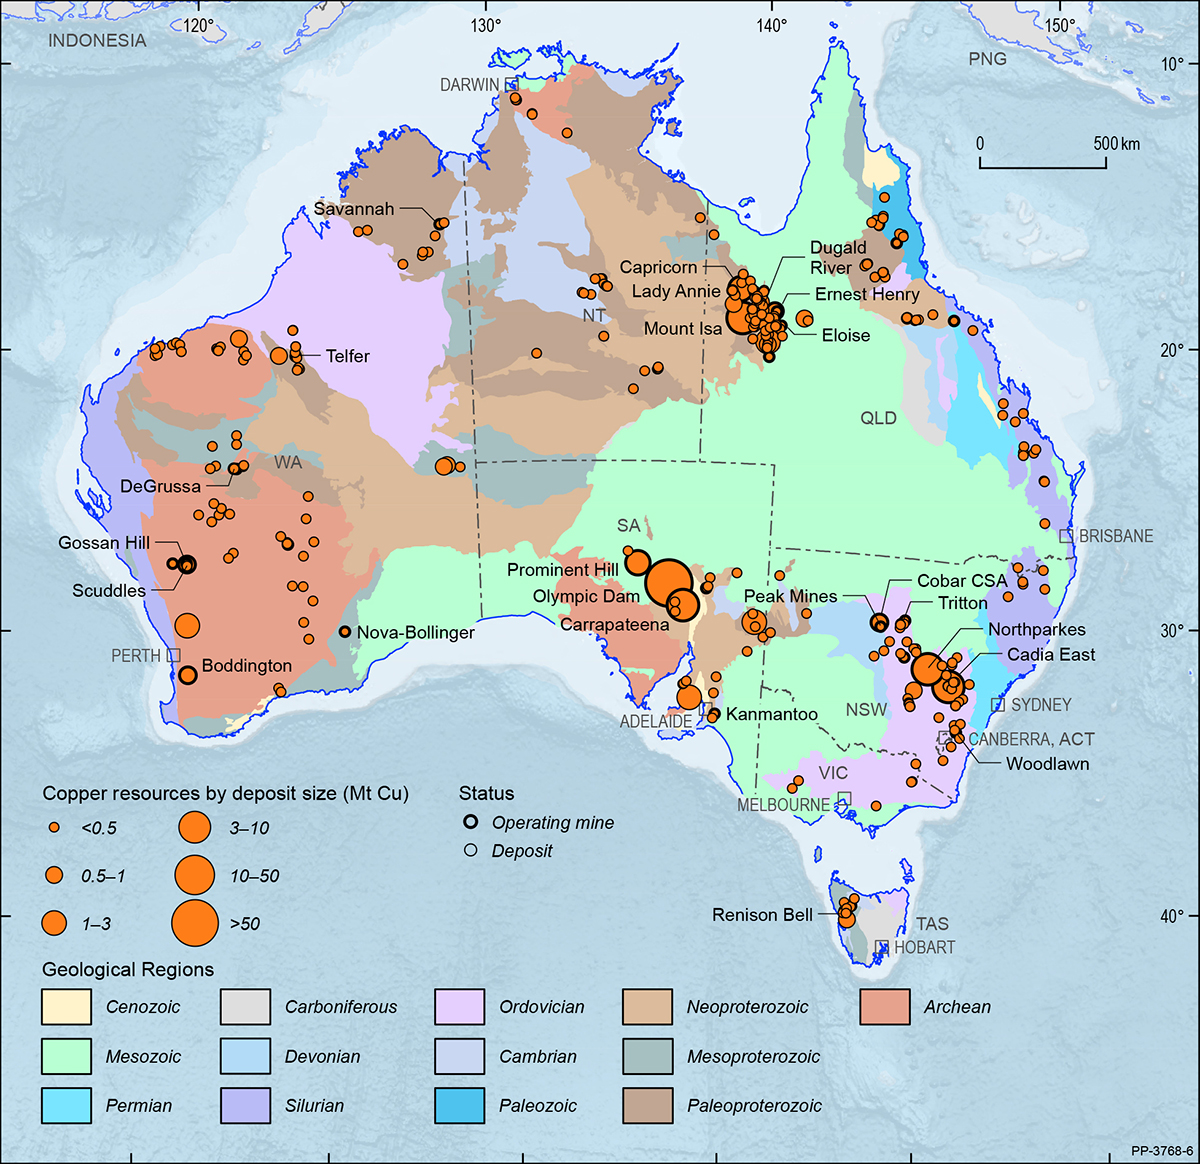
Australia’s EDR of copper were 93.36 Mt at the end of December 2019 (Table 3), a significant increase of 6% from 88.17 Mt in 2018 (Table 4). South Australia holds 67% of Australia’s copper EDR, New South Wales (14%), Queensland (11%), Western Australia (6%), with minor (<1%) EDR each held by Tasmania, Northern Territory and Victoria (Figure 2). Major operating mines and deposits are shown in Figure 14 on a total resource basis.
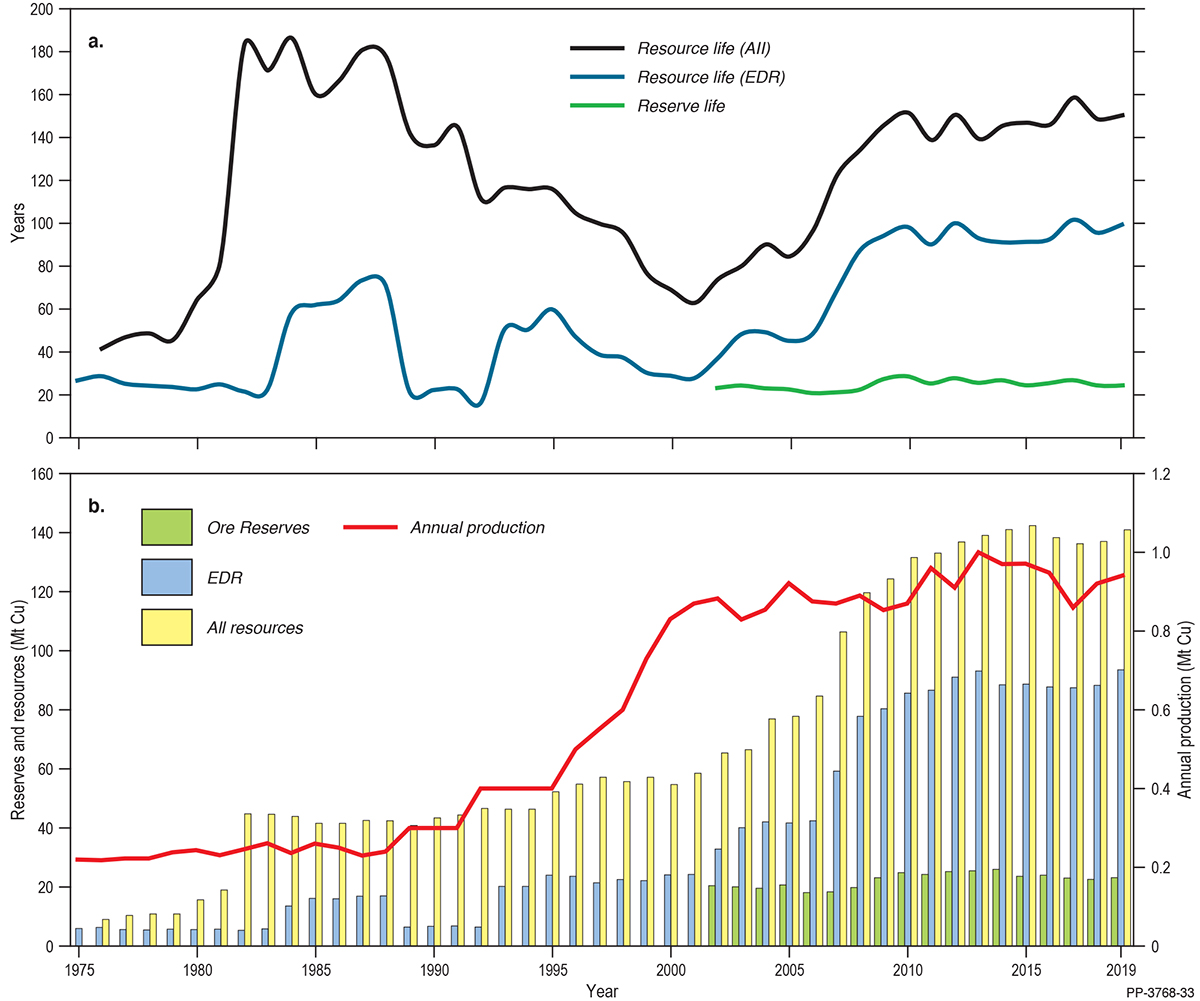
As at December 2019, total Ore Reserves of copper reported in compliance with the JORC Code amounted to 22.99 Mt (Table 2) of which 19.8 Mt (86%) was attributable to 43 operating mines (Figure 1, Table 1). Ore Reserves at operating mines increased by nearly 4% from 19.13 Mt of copper in 2018 to 19.8 Mt in 2019. Total Ore Reserves at all deposits increased in 2019, from 22.38 Mt in 2018, to 22.99 Mt (Table 2). Copper production totalled 0.93 Mt (Table 1), a small increase of 2% on 2018 levels and accounting for 5% of global supply (Table 8).
Resource life is a snapshot in time derived by taking a reserve or resource number and dividing it by a production number. At 2019 production levels, the reserve life at operating mines for copper is potentially 21 years (Table 1). At 2019 production levels, the Measured and Indicated Mineral Resource life at operating mines is 90 years and the Measured, Indicated and Inferred Mineral Resource life at operating mines is 118 years.
While copper reserve life has been broadly constant (Figure 15), resource life (EDR) increased rapidly from 30 years in 2001 to 100 years in 2009 as new resources were added to the inventory but were not matched by increasing production rates (Figure 15). Since 2009, resource life (EDR) has ranged between 90 and 100 years reflecting a congruency between production and resource replacement (Figure 15).
Spending on copper exploration in 2019 was $414.9 million, a 59% increase on 2018 ($260.8 million; Figure 6). With increases in copper exploration expenditure occurring over the last three years, expenditure has now exceeded the levels seen in 2012 ($413.7 million). Exploration activity in 2019 included drilling at Rio Tinto tenements in the Yeneena Basin of the Paterson Province (Western Australia), at the Winu project. In 2019, Canterbury Resources Ltd reported a maiden Inferred Resource at the Briggs porphyry-style copper deposit in the New England Orogen of Queensland.
Australia hosts 11% of the world’s copper resources (Table 8), second only to Chile (23%) and ahead of Peru (10%). For global production, Australia ranks sixth (Table 8), behind Chile, Peru, China, the United States and Congo. The value of Australia’s exports of copper ore and concentrates and refined copper in 2019 totalled $10.1 billion (Table 11), up 9% on $9.3 billion in 2018. In 2019, the London Metal Exchange cash price averaged US$6,005/t, a decrease from US$6,525/t in 2018.
Diamond
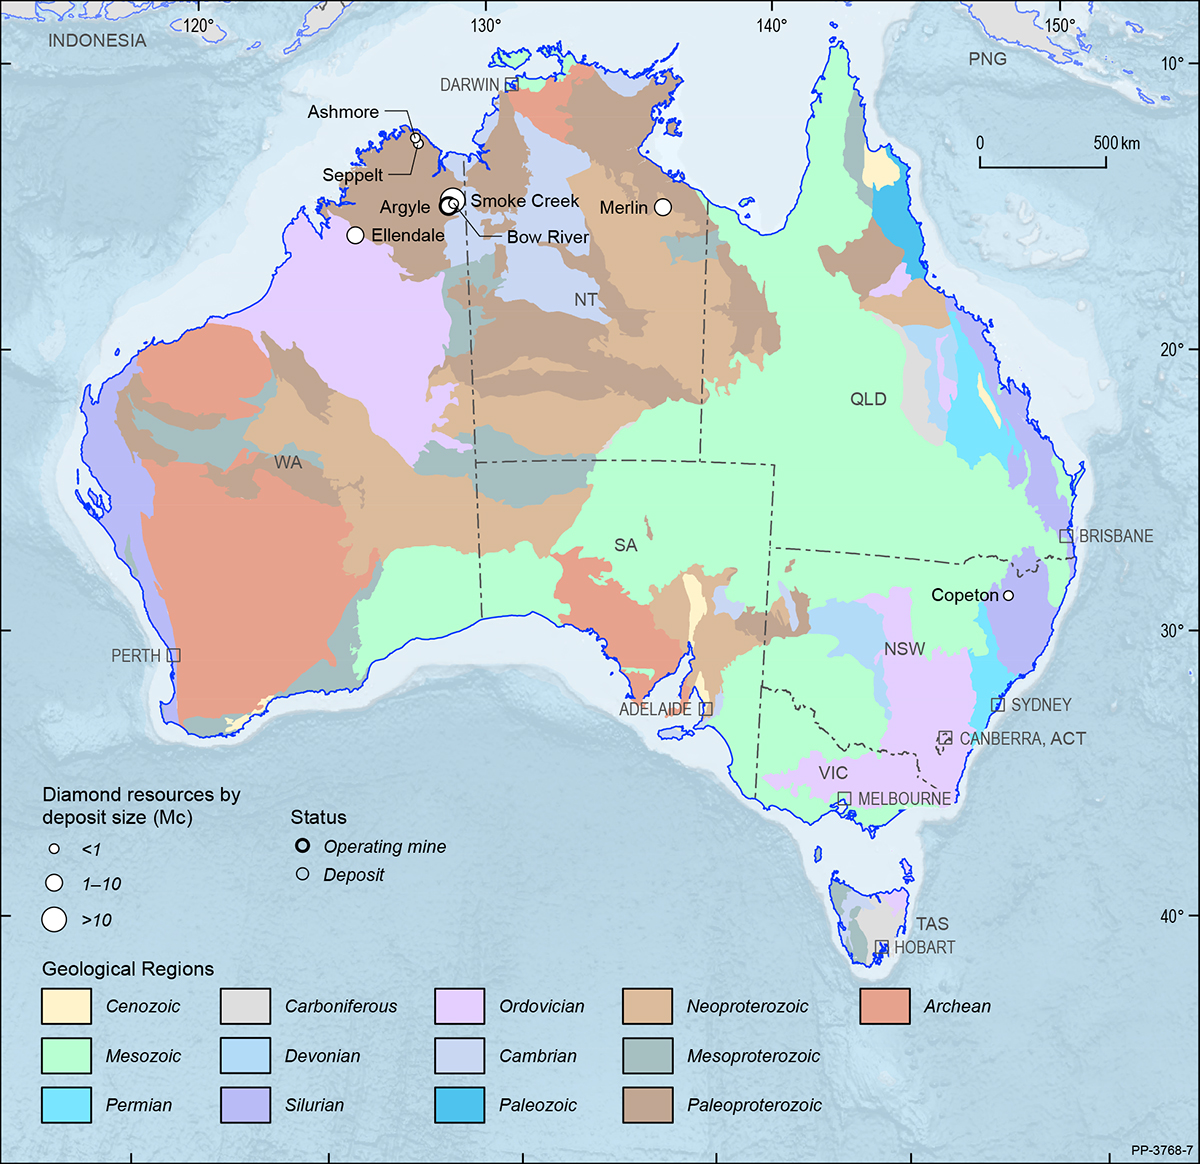
In 2019, Australia’s total EDR of diamond were 10.97 Mc (Table 3), down 57% from 25.48 Mc in 2018 (Table 4). This is largely owing to resources at Argyle being depleted by mining and lower grades. Despite a 58% decrease in export volume of sorted gem diamonds, export earnings went up 26% due to a massive increase of 198% in value (Table 12). Total production also decreased, from 14.01 Mc in 2018 to 12.99 Mc in 2019 (Table 3). This combination of declining resources and mine production has resulted in an Australian diamond reserve life of only one year (Table 9).
The Argyle lamproite pipe in the east Kimberley region of Western Australia was responsible for all diamond production in Australia. The Argyle mine is scheduled to cease operation by the end of 2020. Operating mines and deposits for diamond are shown in Figure 16 on a total resource basis.
Gold
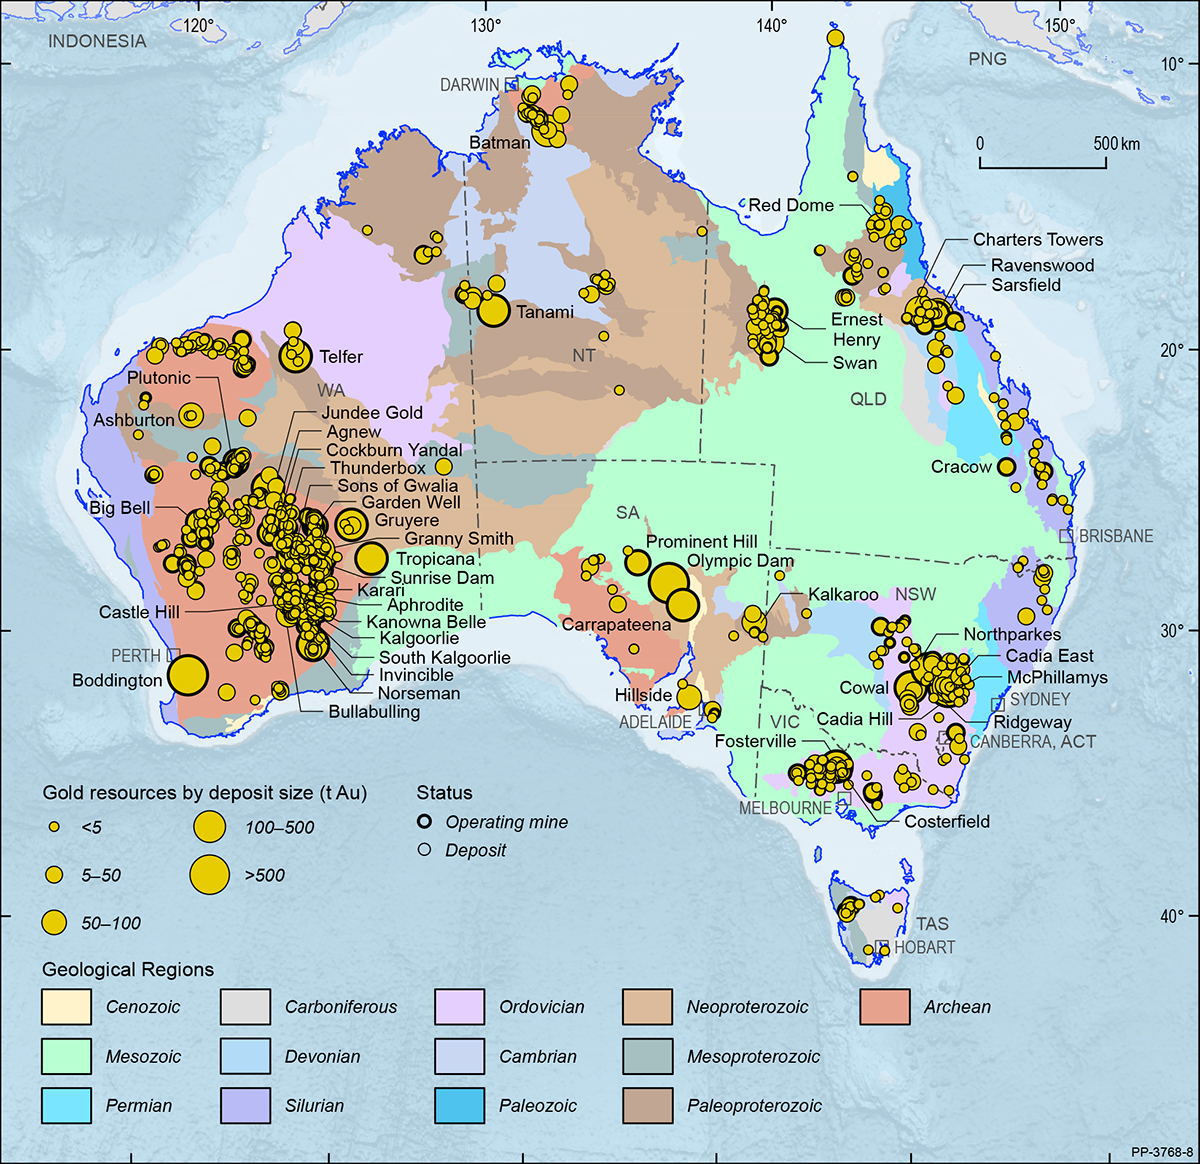
Australia’s gold resources occur in all states and the Northern Territory (Figure 17). In 2019, EDR of gold increased 630 t (6%) to 10,795 t (Table 3) from 10,165 t in 2018 (Table 4). Western Australia has the largest share of EDR (45%), followed by South Australia (26%) and New South Wales (16%): collectively, these three states hold slightly less than 87% of national EDR (Figure 2).
Based on estimates provided by the USGS and adjusted for Australia by Geoscience Australia, world economic resources of gold in 2019 were 51,100 t (Table 3). Australia, with EDR of 10,795 t, or slightly more than 21% of world gold resources (Table 8), has the largest share ahead of Russia with 5,300 t (10%), South Africa with 3,200 t (6%), and the United States with 3,000 t (6%).
From 2018 to 2019, Paramarginal Demonstrated Resources of gold declined by 9 t to 148 t and Submarginal Demonstrated Resources increased by 8 t to 208 t. Over the same period, Inferred Mineral Resources of gold in Australia decreased 446 t, or 8%, from 5,268 t to 4,822 t (Table 3). Western Australia’s Inferred Mineral Resources of gold remain the largest of any state or territory at 2,203 t (46%), followed by South Australia with 1,092 t (23%) and Queensland with 713 t (15%).
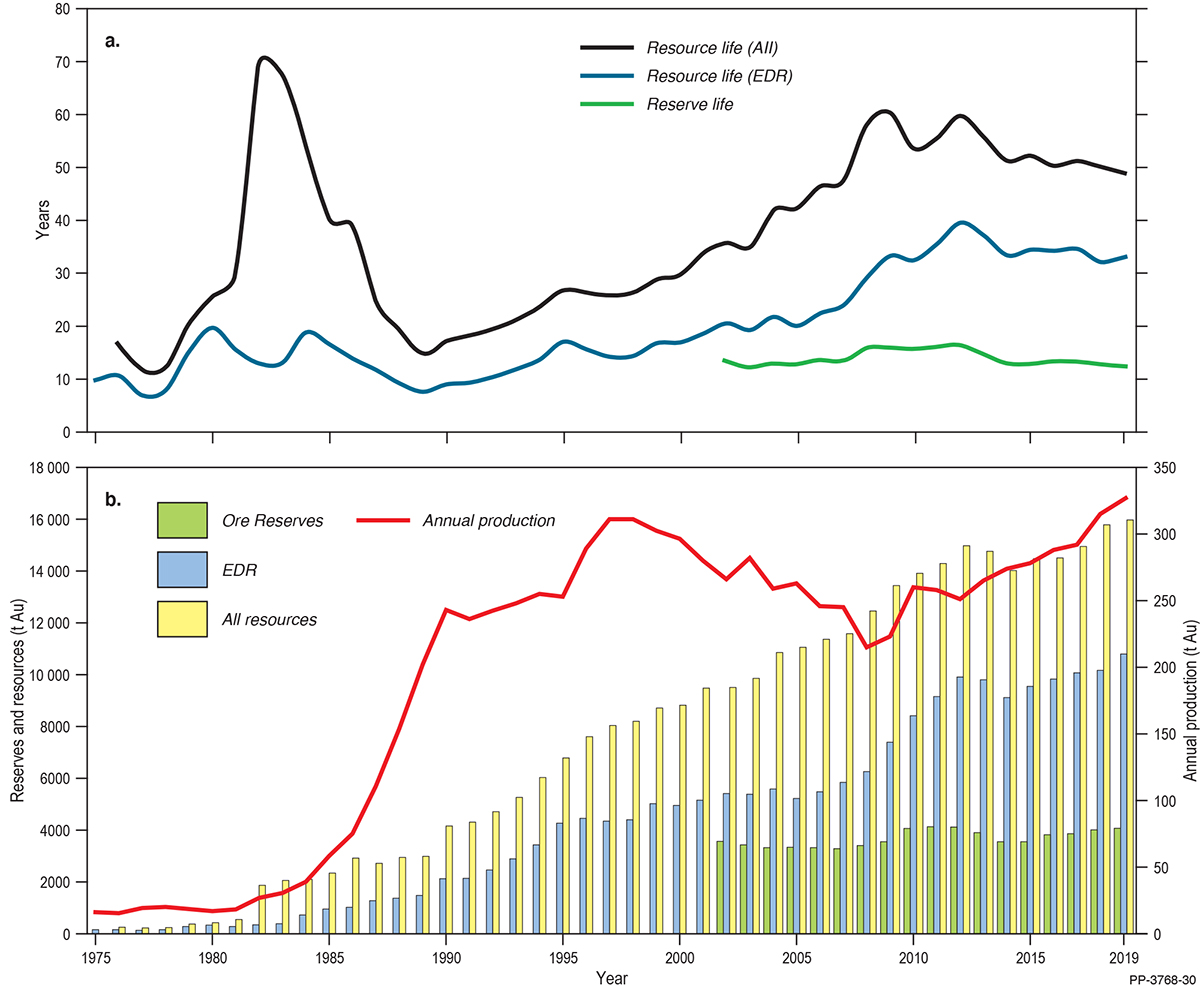
Total Ore Reserves of gold reported in compliance with the JORC Code increased by 51 t from 4,018 t in 2018 to 4,069 t in 2019 (Table 2) and comprised 38% of EDR (Table 6). Ore Reserves of gold at operating mines, based on 2019 production rates, have a reserve life of 9 years, which extends to 12 years when reserves at other deposits are included (Table 9).
Reserve/resource life is a snapshot in time derived by taking a reserve or resource number and dividing it by a production number. Resource life for Australian gold dramatically increased, briefly, during the early 1980s as the introduction of new gold extraction technologies stimulated exploration (Figure 18). Resource life then declined rapidly as gold production surged 800% from 27 t in 1982 to 243 t in 1990 (Figure 18). Since 1990, resource life for gold has generally trended upward (Figure 18) as new resource delineation has outpaced increases in production. It is only since 2012 that gold resource life has decreased owing to favourable exchange rates stimulating increased production but with slower increases in new resource delineation (Figure 18).
Exploration expenditure for gold reached an all-time high in 2019 increasing by 20% on the previous year from $892 million to $1,068 million17 (Figure 6). Gold had the highest exploration expenditure of all commodities in 2019, accounting for 40% of all mineral exploration expenditure ($2,648 million). This reflects the strong price of gold in Australian dollars, which had a monthly average price of $2,007/oz in 2019. This was $309/oz higher than in 201818.
Domestic mine production increased by 11 t of gold in 2019 to 326 t (Table 1)19. By jurisdiction, Western Australia maintained the highest output of gold at 218 t (67%), New South Wales gold production retained second position at 41 t (13%) and Queensland had the third highest production at 23 t (7%). According to the USGS, the world produced 3,300 t of gold from mining in 2019 (Table 3). Thus, Australia’s mine production of 326 t accounts for 10% of world production (Table 8) and was second to that of China (13%), but ahead of the Russia (9%) and the USA (6%). In 2019, Australia exported 362 t of gold valued at $23,372 million with a value of $64.7 million/tonne (Table 11). Gold accounted for 10% of total mineral export earnings in 2019 (Table 11).
Australian gold deposits can be grouped into a number of geological or metal-association types with differing contributions to production and resources. In 2019, lode-gold deposits (e.g. Kalgoorlie Super Pit) yielded 219 t or 67% of Australian mine production, more than double the next largest producing type—copper-gold deposits. Copper-gold deposits include porphyries (e.g. Cadia) and the iron oxide-copper-gold deposits (e.g. Olympic Dam). Gold output in 2019 from these deposits amounted to 91 t or 28% of national production. The remaining 5% of national gold production for the year came from polymetallic and other deposits, including epithermal and antimony-gold deposits, totalled 16 t.
Significant industry activity includes the start of construction at PYBAR Mining Services Pty Ltd’s Dargues gold mine in New South Wales in 2019, which is expected to produce 50,000 oz of gold per annum. In Western Australia, RNC Minerals Corporation (now Karora Minerals Inc) announced high-grade drill results from the Father’s Day vein discovery of 2 m at 1,017.3 g/t Au in January 2019.
17 See above n 11.
18 See above n 1, Table 27.
19 ibid.
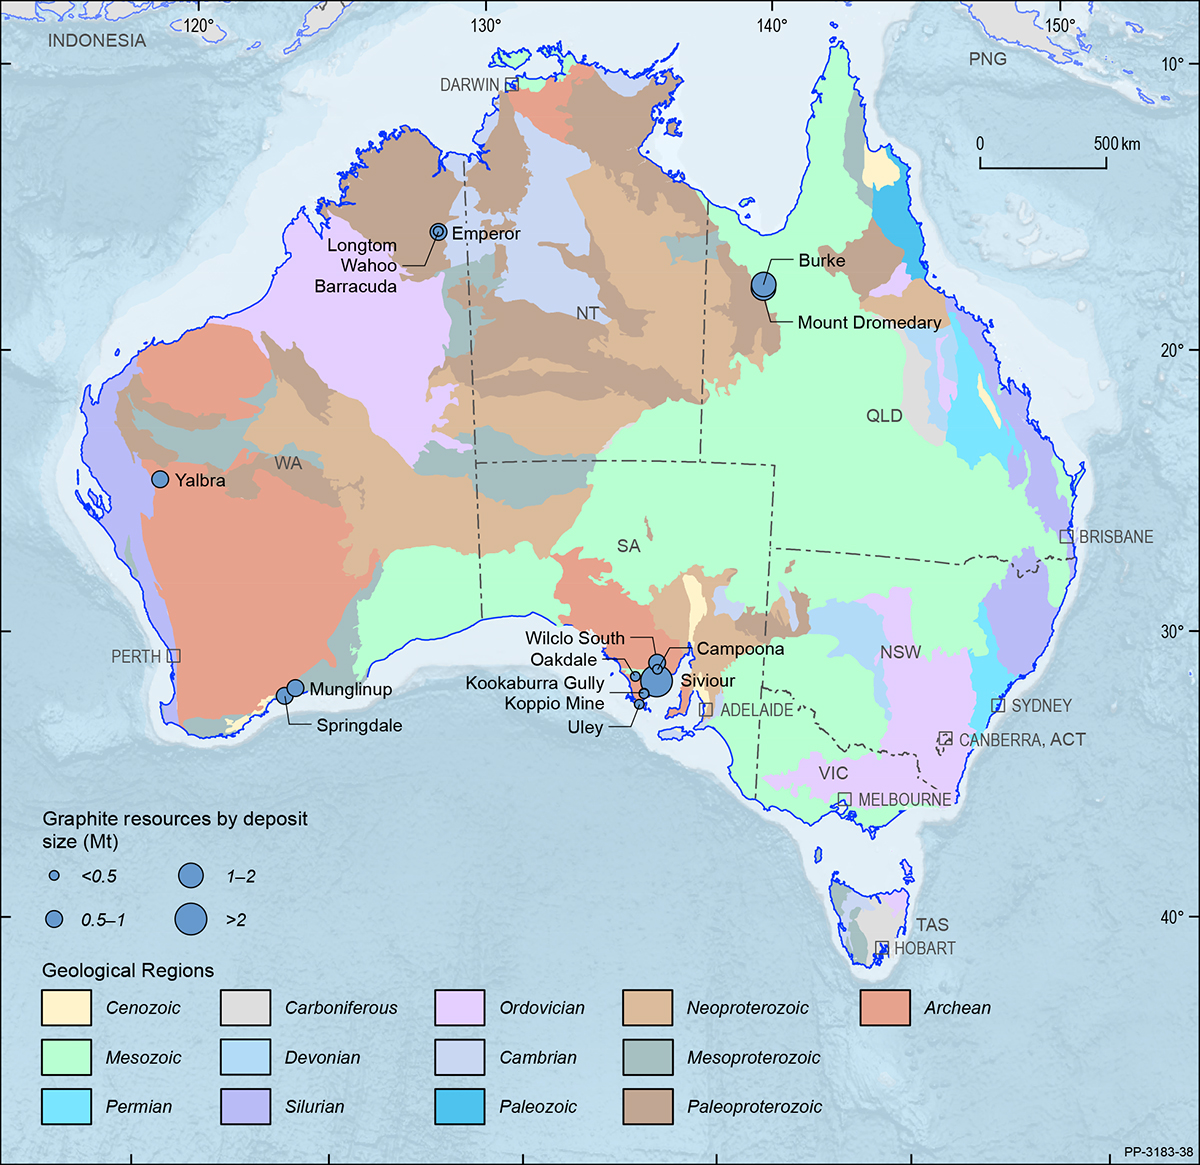
Graphite
Graphite is a good electrical conductor and has a high fusion point and good lubricating properties. It is used as an anode in batteries, as a refractory material in industries producing molten metal for crucibles and blast furnace linings, and to replace asbestos in brake shoes for heavier vehicles. Graphite is also used in pencils. Because of its use in low-carbon technologies, graphite demand is projected to rise significantly (383%) by 205020. Graphite is regarded as a critical mineral by many advanced economies and is listed in Australia’s Critical Minerals Strategy 201921.
In Australia, graphite deposits occur across Queensland, Western Australia and South Australia. South Australia hosts 65% of graphite EDR, followed by Queensland (17%) and Western Australia (18%). Graphite deposits include: Uley, Oakdale, Siviour, Kookaburra Gully, Wilclo South, Koppio and Campoona in South Australia; Mount Dromedary and Burke in Queensland; and Springdale, Emperor, Longtom, Munglinup and Yalbra in Western Australia (Figure 19).
Australia’s EDR of graphite in 2019 were approximately 7.97 Mt (Table 3), a 10% increase from the previous year’s estimate of 7.25 Mt (Table 4). In 2019, there were no significant changes from the previous year to Australia’s total graphite Ore Reserve estimate at 4.77 Mt (Table 2). Inferred Resources of graphite were estimated at 7.32 Mt in 2019, a nominal increase from 6.98 Mt in 2018.
Graphite mining occurs globally, with China remaining the leading producer in 2019, accounting for 62% of world supply, followed by Mozambique (9%). Economic resources of graphite have shown notable increases since 2013, with Turkey hosting the largest graphite inventory (29%) in 2019, followed by China (24%) and Brazil (23%).
20 See above n 6.
21 See above n 7.
Iron Ore
Australia’s EDR of iron ore increased by 2% to 50,593 Mt during 2019 (Table 4), with the EDR of contained iron estimated to be 24,508 Mt (Table 3). Of this, 83% of EDR occur in the Pilbara region of Western Australia. Major deposits and operating mines are shown in Figure 20 on a total resource basis. The slight increase in iron ore EDR was the upshot of regional project expansion and developments by Australia’s major producers—BHP Ltd, Rio Tinto and Fortescue Metals Group Ltd. Australia has the world’s largest economic resources of iron ore (30%; Table 8), followed by Brazil (17%). Australia also ranks first for global production of iron ore, accounting for 36% in 2019 (Table 8), followed by Brazil (19%) and China (14%).
The market view is that the unexpected, but welcome, price spike of iron ore during 2019 and through most of 2020 was influenced by the anticipated shortfall in supply owing to the collapse of the Brumadinho tailings dam in Brazil and from the effects of Cyclone Veronica on Australia’s major producers in the Pilbara region22,23,24. This latter disruption cost about 3% of Australia’s annual production, according to the Reserve Bank of Australia25, although production of iron ore still increased from 899 Mt in 2018 to 919 Mt in 2019 (Table 3), with Western Australia producing 910 Mt or 99%.
Australian iron ore production growth is expected to continue as output from new operations comes on line. Developing projects include Eliwana26, which is scheduled to be completed in late 2020, followed by South Flank27 and Koodaideri28, where both are anticipated to start in mid to late 2021. Another potential project that will support Australia’s production growth is the developing Iron Ridge DSO project, which also aims for its first shipment of ore in early 202129.
Existing operations will also support Australia’s continuing growth in iron ore production, through expansion projects from existing operations, such as the West Angelas C&D and the Robe Valley Mesa B, C and H mines, expected to come online in 202130. This supports the 15% production growth for iron ore projected by the Office of the Chief Economist for their outlook period31.
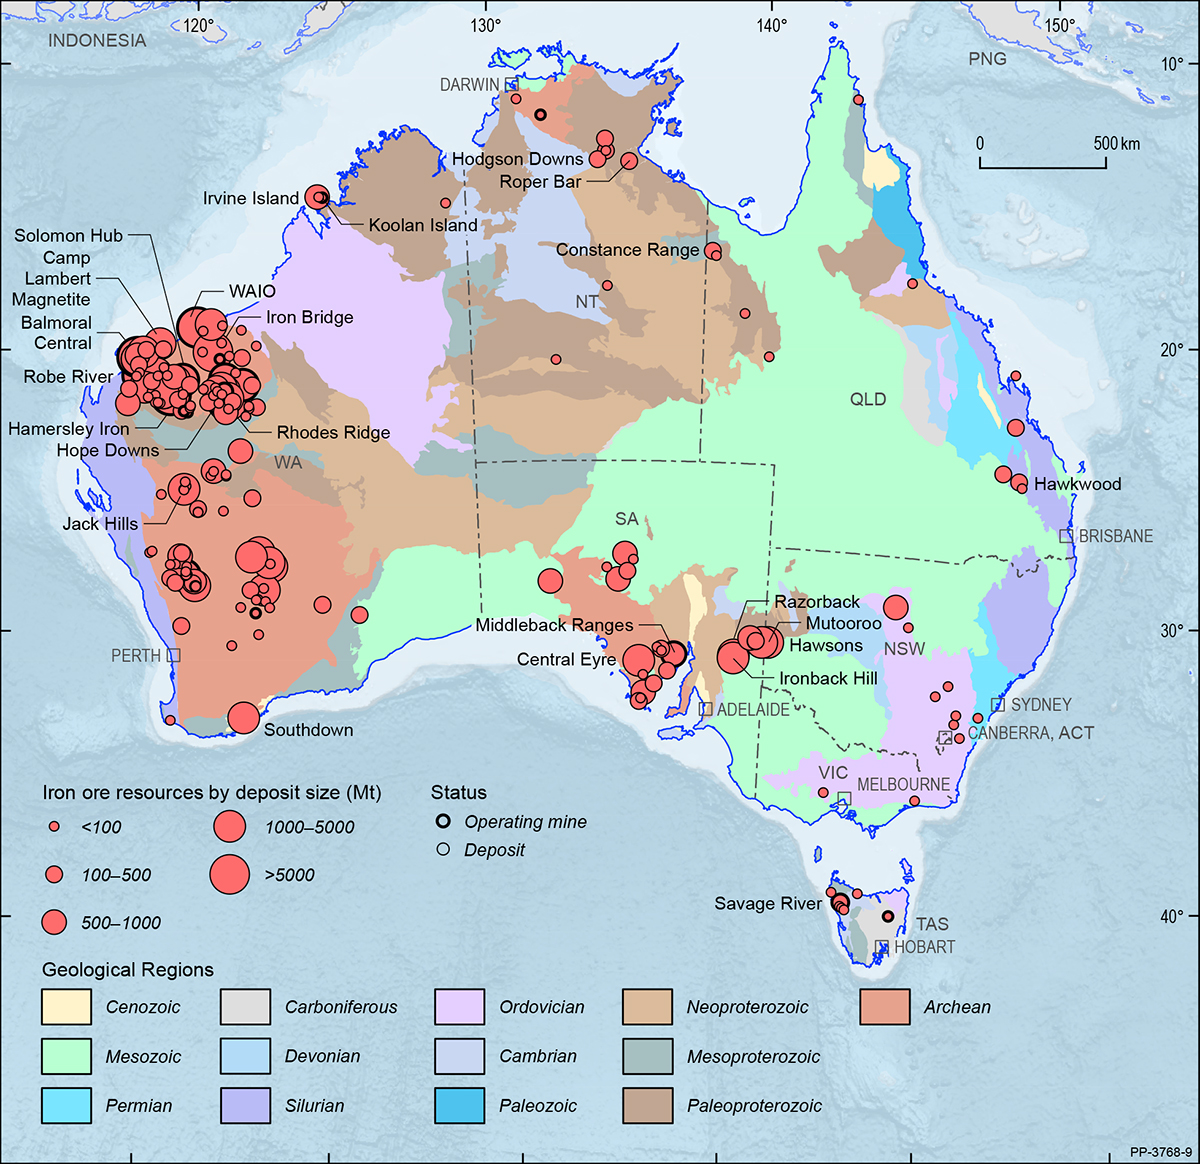
At the end of December 2019, Australia’s identified magnetite resource was 19,437 Mt, representing 38% of the national EDR of iron ore. Not unexpectedly, most of the magnetite EDR also occur in Western Australia (81%), while South Australia’s magnetite EDR remain the same at 13%, with the remaining resource occurring in Tasmania, New South Wales and Victoria. A review of the status of Australia’s iron ore deposits has reduced Australia’s Inferred Resources by 3% from 94,100 Mt in 2018 to 91,059 Mt in 2019.
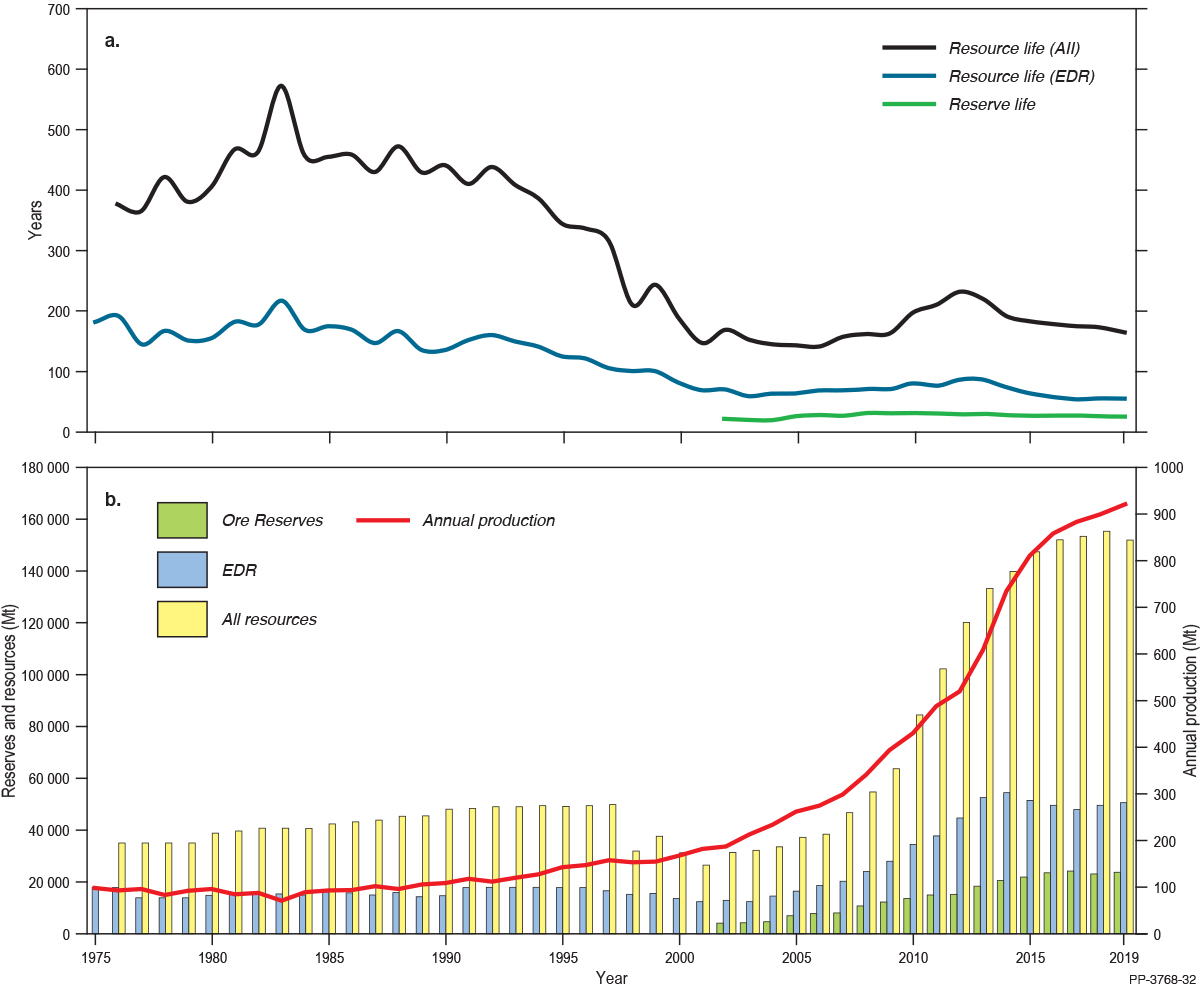
Reserve or resource life is a snapshot in time derived by taking a reserve or resource number and dividing it by a production number. Resource life for iron ore is expected to fluctuate as mine production responds to market demand. This is clearly seen with the falling resource life for iron ore from the 1980s to around the turn of this century as new resource discoveries were outpaced by rising production (Figure 21). It is only since 2003 that exploration drilling has added to the resource base, enabling resources to keep pace with rising production.
Iron ore exploration in Australia remained strong in 2019, increasing by 16% to $349.6 million (Figure 6), accounting for 13% of Australia’s total mineral exploration expenditure. Not unexpectedly, the bulk of the exploration expenditure and activities were centred in Western Australia where most of Australia’s iron ore deposits occur. Around 96% ($336.5 million) of iron ore exploration expenditure was spent in Western Australia, with 2% in South Australia.
22 Office of the Chief Economist (Department of Industry, Science, Energy and Resources), Resources and Energy Quarterly, March 2020. See https://publications.industry.gov.au/publications/resourcesandenergyquarterlymarch2020/documents/Resources-and-Energy-Quarterly-March-2020-Iron-Ore.pdf (accessed 18 December 2020).
23 Reserve Bank of Australia, The Recent Increase in Iron Ore Prices and Implications for the Australian Economy (Report, August 2019). See https://www.rba.gov.au/publications/smp/2019/aug/pdf/box-b-the-recent-increase-in-iron-ore-prices-and-implications-for-the-australian-economy.pdf (accessed 18 December 2020).
24 Barrera, Priscila, Iron Outlook 2020: Prices to Stabilize Following Supply Shock (Investing News Article, 1 January 2020). See http://investingnews.com/daily/resource-investing/base-metals-investing/iron-investing/iron-outlook/ (accessed 18 December 2020).
25 See above n 23.
26 Fortescue Metals Group, Eliwana Project Announcement (ASX Announcement, 28 May 2018). See https://www.fmgl.com.au/docs/default-source/announcements/eliwana-project-announcement.pdf?sfvrsn=b23b5e83_6 (accessed 18 December 2020).
27 BHP, BHP Operational Review for the Year Ended 30 June 2020 (ASX Announcement, 21 July 2020). See https://www.asx.com.au/asxpdf/20200721/pdf/44kpkd8gc3s6l1.pdf (accessed 18 December 2020).
28 Rio Tinto, Rio Tinto approves $2.6 billion investment in Koodaideri iron ore mine (ASX Announcement, 29 November 2018). See https://www.asx.com.au/asxpdf/20181129/pdf/440rjgj4h0jlnd.pdf (accessed 18 December 2020).
29 Fenix Resources Ltd, Iron Ridge Project Site Works Commence (ASX Announcement, 21 September 2020). See https://www.asx.com.au/asxpdf/20200921/pdf/44mtbz47b2qx4t.pdf (accessed 18 December 2020).
30 Rio Tinto, Interim Results 2020 (ASX Announcement, 29 July 2020). See https://www.asx.com.au/asxpdf/20200729/pdf/44kypftdnvqscx.pdf (accessed 18 December 2020).
31 See above n 22.
Lead, Zinc and Silver
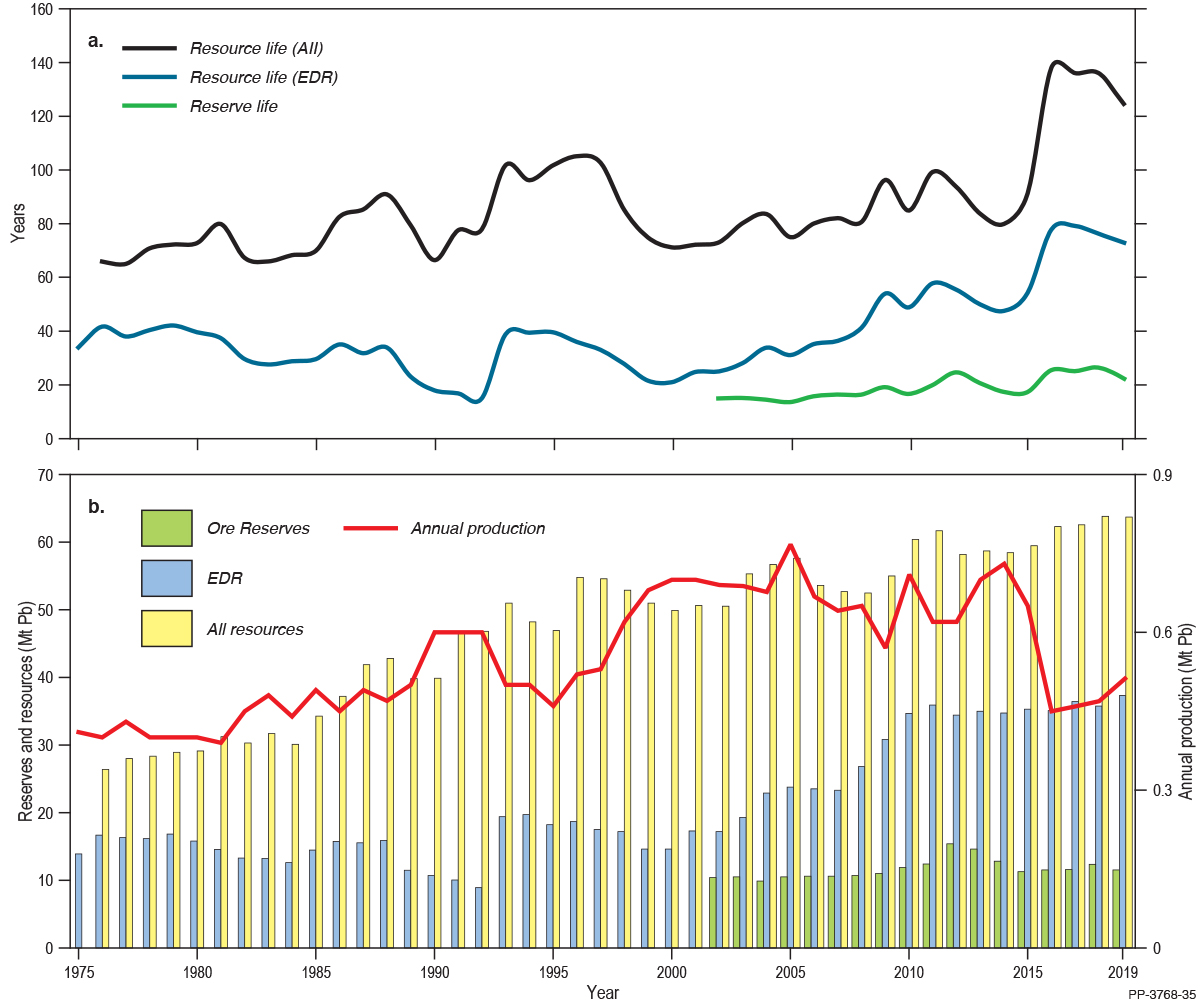
Australia’s EDR of lead were 37.31 Mt in 2019 (Table 3), up 4% from 35.78 Mt in 2018 (Table 4). Australia ranks first globally with 41% of the world’s economic resources (Table 8), and second for production (11%; Table 8), behind China (47%).
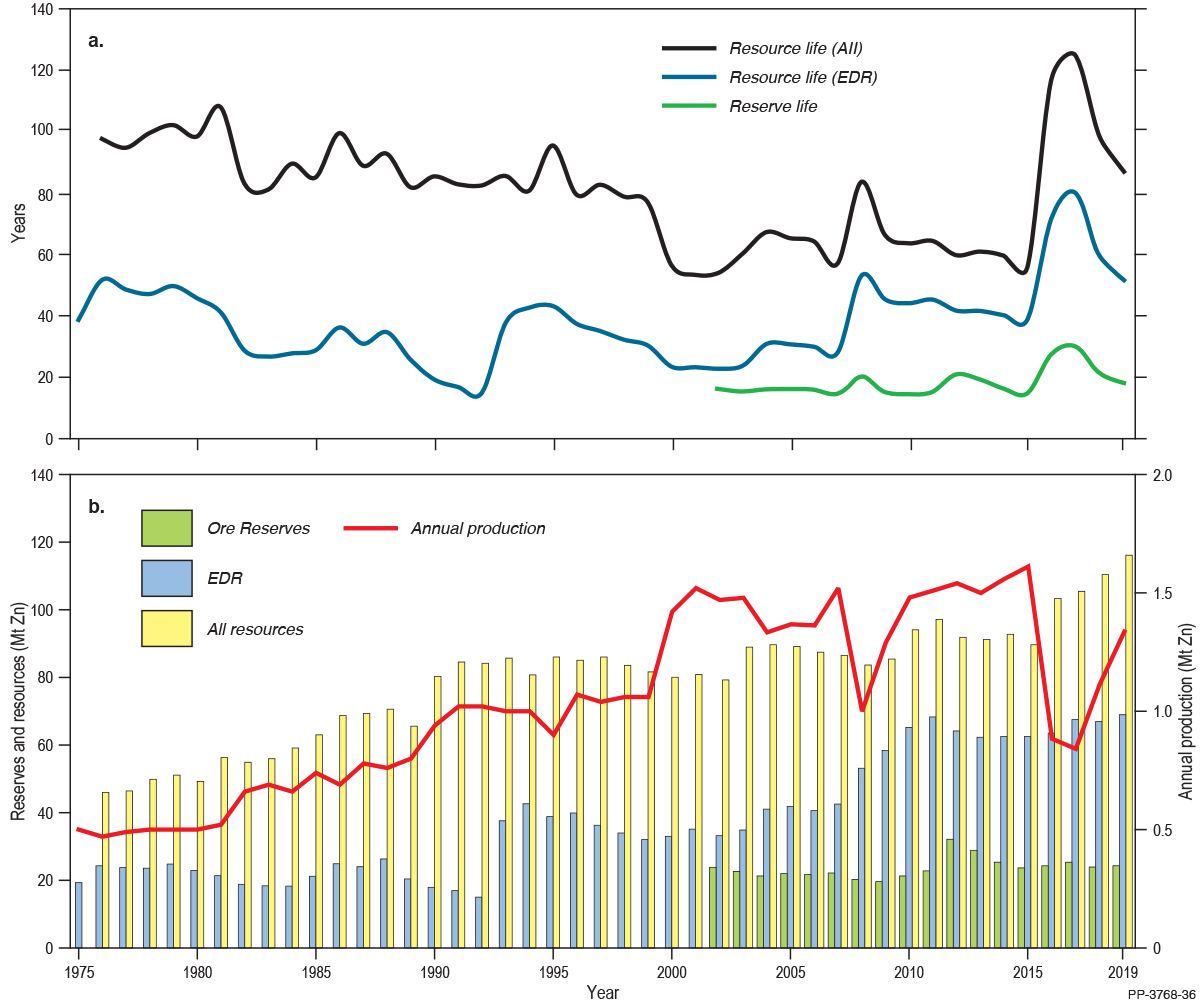
Australia’s EDR of zinc were 68.92 Mt in 2019 (Table 3), up 3% from 66.96 Mt in 2018 (Table 4). Australia ranks first globally with 27% of the world’s economic resources (Table 8), and third for production (10%; Table 8), behind China (34%) and Peru (11%).
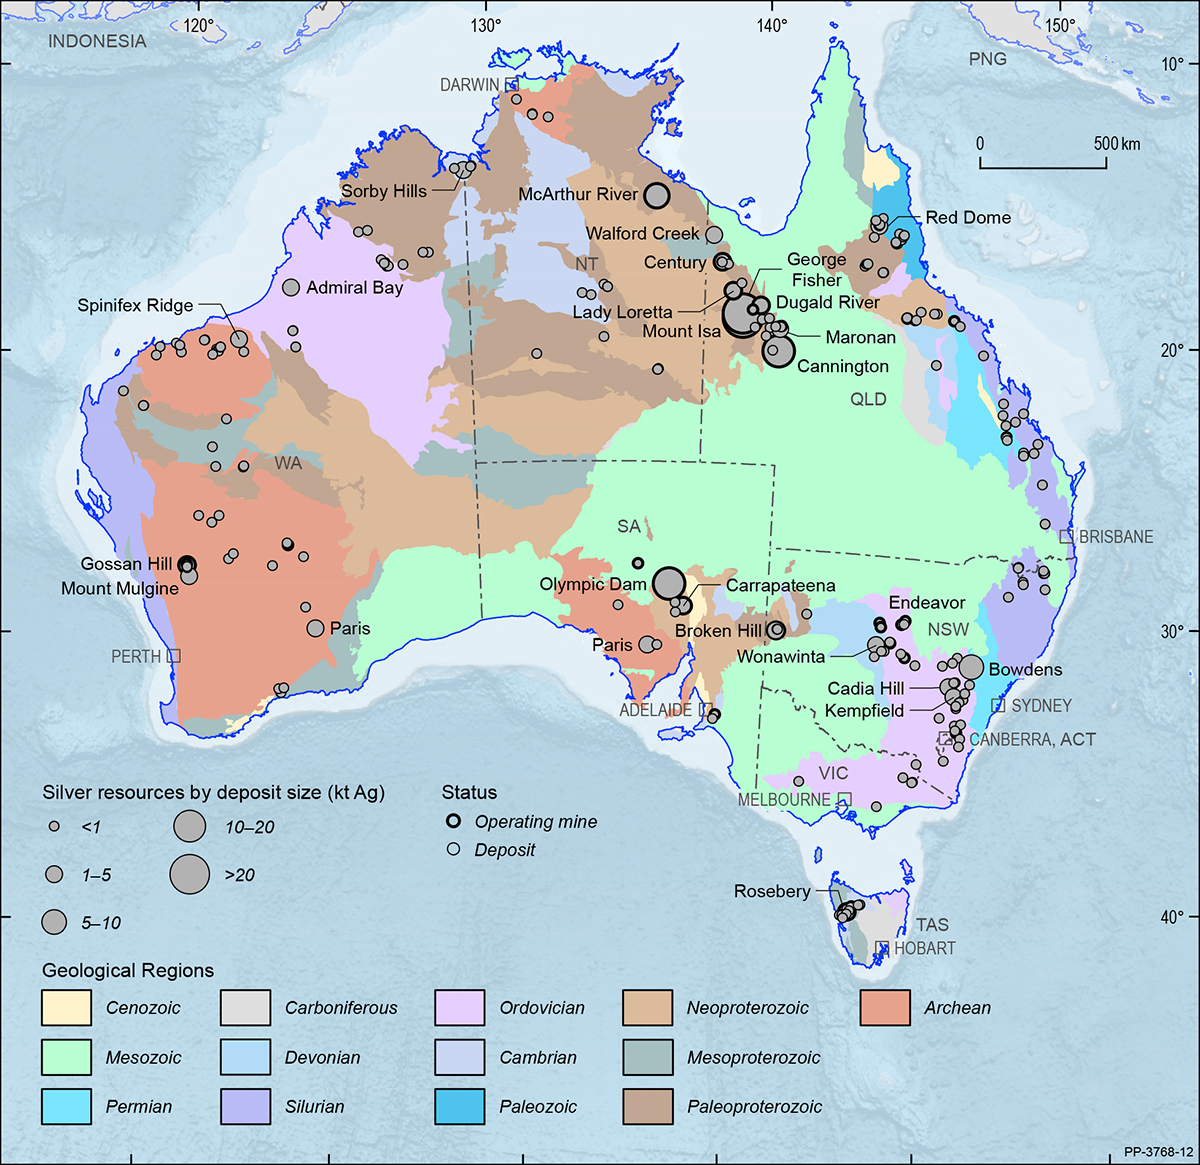
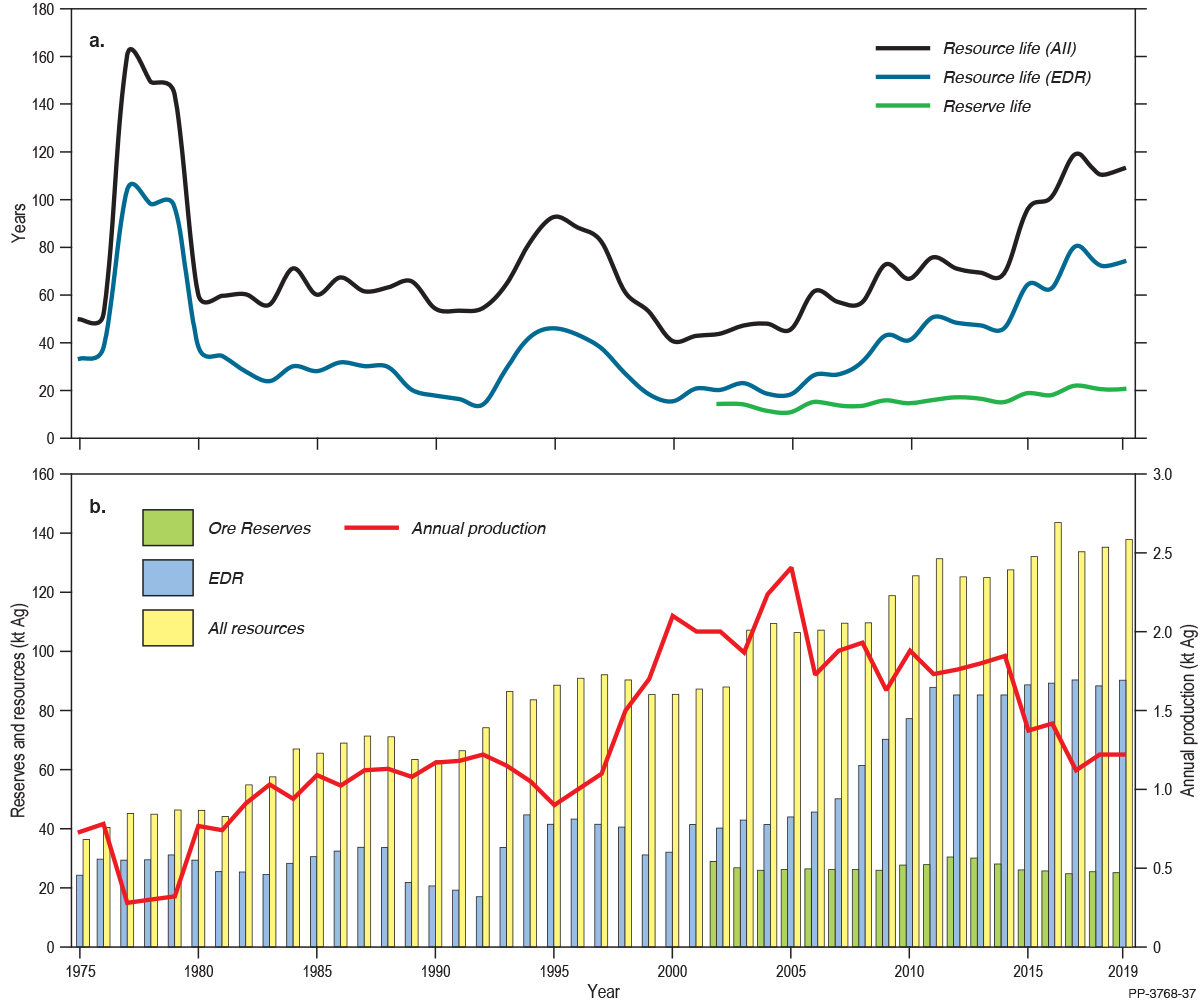
Australia’s EDR of silver were 90.26 kt in 2019 (Table 3), up 2% from 88.36 kt in 2018 (Table 4). Australia ranks third globally with 16% of the world’s economic resources (Table 8), behind Peru and Poland, and seventh for production (5%; Table 8), behind Mexico (23%), Peru (14%), China (13%), Russia (8%), Poland (6%) and Chile (5%).
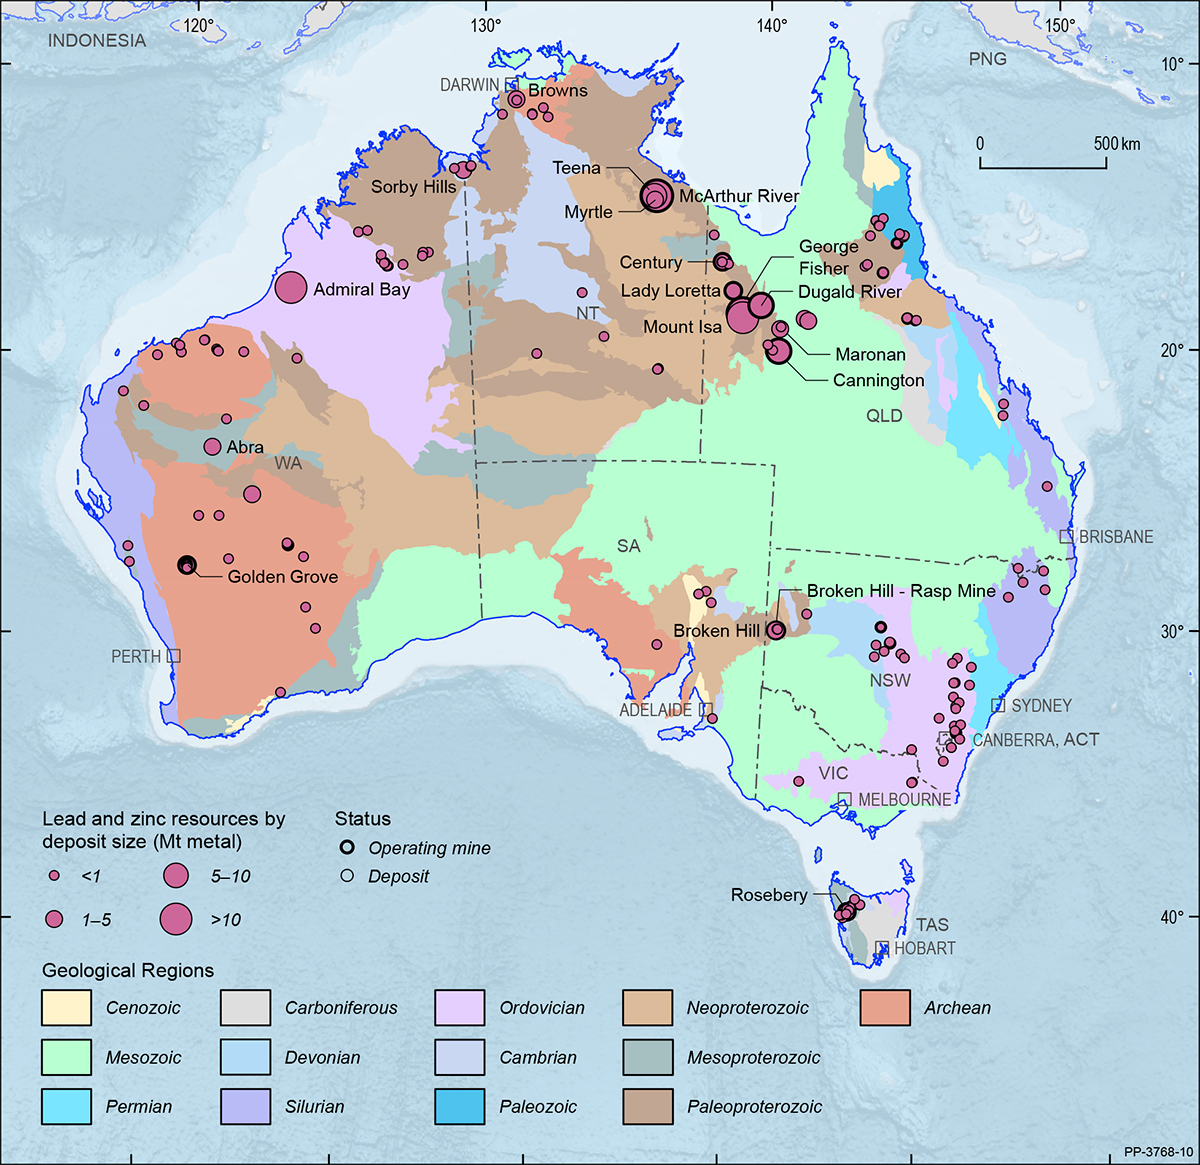
Operating mines and deposits for lead and zinc are shown in Figure 22 and silver in Figure 23, on a total resource basis. Virtually all of Australia’s EDR of zinc, lead and silver occur within hard-rock sulphide deposits, with resources in all states and the Northern Territory, but with the largest proportion of EDR for all three metals in Queensland (Figure 2). The Carpentaria Zinc Belt, which extends from northwest Queensland into the northeast Northern Territory is the largest repository of zinc-lead-silver deposits in Australia, including the major George Fisher-Hilton and McArthur River mines as well as some smaller, but still globally significant, deposits.
Between 2012 and 2016, five major global zinc deposits, including the Century and Black Star (Mount Isa) deposits in Queensland, closed. In 2015, Glencore Pty Ltd decreased its global zinc production by one third, partly from deposits in northern Australia. The closures and decreased zinc (and lead) production initially resulted in increasing zinc and lead prices until February-March 2018, followed by a broad trend of decreasing prices to the end of 2019.
Exploration spend for lead-zinc-silver decreased 18% in 2019 to $80.5 million after an increase in 2018 ($98.4 million; Figure 6). Exploration for zinc, lead and silver deposits in Australia since 2012 has been geographically targeted, with much of the exploration concentrated in the Carpentaria Zinc Belt. Other areas that have produced significant results include other parts of the Northern Territory, western and central New South Wales and northeastern Queensland.
The most significant discovery in the last decade was the Teena deposit near McArthur River, discovered in 2013. The Walford Creek deposit has also seen significant exploration and an upgrade to resources, which include copper and cobalt in addition to zinc, lead and silver.
In New South Wales, exploration in the Cobar region has seen some significant discoveries and the Hera and Woodlawn mines have (re)opened since 2012; although the latter has been affected by the COVID-19 pandemic and was placed in care and maintenance in 2020. Exploration in the Cobar region has seen some significant discoveries.
Ore reserves of zinc, lead and silver (Table 2) have remained relatively constant over recent years (Figure 24, Figure 25 and Figure 26). Reserve life, the ratio of reserves to production, was 18, 23 and 21 years for zinc, lead and silver, respectively (Table 9). The 2019 reserve life for zinc (18 years) is lower than that of 2018 (22 years) and continues the trend of decreasing reserve life seen in 2018 (Figure 25). This is due mostly to increased production. For lead, reserve life in 2019 (23 years) is also lower than 2018 (26 years) but silver (21 years) is unchanged.
Lithium, Tantalum and Niobium
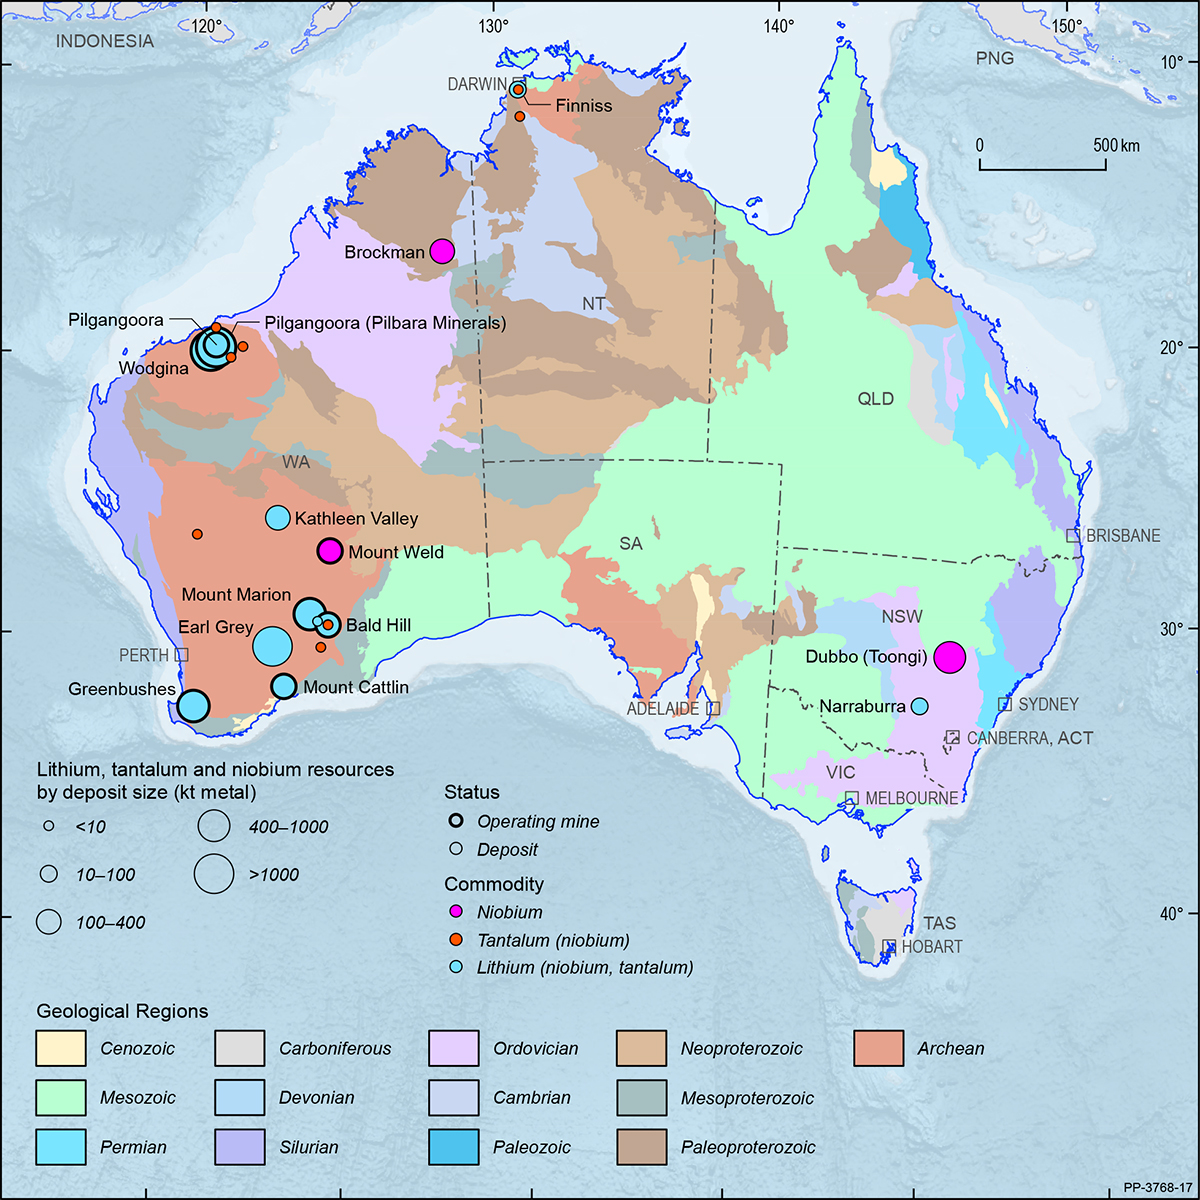
Lithium, tantalum and niobium are chemically associated and are mostly hosted together in hard rock pegmatite deposits, mainly occurring in Western Australia. Lithium, tantalum and niobium are all regarded as a critical minerals by many advanced economies, and are listed in Australia’s Critical Minerals Strategy 201932.
Australia’s EDR of lithium were 5,702 kt in 2019 (Table 3), up 5% from 5,437 kt in 2018 (Table 4). Australia ranks second globally with 29% of the world’s economic resources (Table 8), behind Chile (44%), and first for production (56%; Table 8). All of Australia’s EDR of lithium occur within hard rock pegmatite deposits.
Over 84% of Australia’s lithium EDR are hosted by four deposits: Greenbushes, Wodgina, Pilgangoora (Pilbara Minerals Ltd) and Earl Grey. Other resources occur at Mount Cattlin, Mount Marion, Bald Hill and Kathleen Valley in the Yilgarn region of Western Australia; at Wodgina and Pilgangoora (Altura Ltd) in the Pilbara region of Western Australia; and at the Grants deposit (Finniss Project) in the Northern Territory. Operating mines and deposits are shown in Figure 27 on a total resource basis.
Lithium prices since 2019 have decreased, driven largely by both softening demand (due to slower growth in electric vehicle uptake) and oversupply. As a result, Australian producers have delayed planned mine expansions (e.g. at Greenbushes) and also reduced production rates (e.g. Pilgangoora (Pilbara Minerals)). Two mines—Bald Hill and Wodgina—ceased production in the second half of 2019 and are now on care and maintenance. The decrease in price and demand follows five years of heightened activity in the Australian lithium industry which had seen significant increases in resources and the number of operating mines (seven operating mines at the height of production).
In 2019, Tianqi Lithium Australia Pty Ltd commenced production of lithium hydroxide at their processing plant in Kwinana, Western Australia, using ore from their Greenbushes deposit. Once fully operational, the plant will produce 24 ktpa of battery-grade lithium hydroxide. The stage two expansion (to 48 ktpa of lithium hydroxide) has been placed on hold.
In 2019, Albemarle Corporation commenced construction of a lithium hydroxide processing plant at Kemerton, Western Australia. Albemarle announced a downgrade in processing capacity of the plant in mid-2019, reducing production trains from seven to two. The company indicated an initial production capacity of about 50 ktpa of lithium hydroxide from the two trains. The company announced further spending cuts to the plant in 2020, with commissioning expected in 2021.
Prior to the recent downturn, there was a rapid growth in lithium resource delineation in Australia from 2016, evidenced by large increases in EDR (>800%) and total resources (>1,000%) of lithium. In the same period, total Ore Reserves increased by more than 2,000%. Increases in annual production were also significant, up over nine times as much as a decade ago. Ore Reserves at operating mines, based on 2019 production rates, have a reserve life of 69 years which extends to 84 years when Ore Reserves at other deposits are included (Table 9).
Australia’s EDR of tantalum were 93.5 kt in 2019 (Table 3), up from 88.6 kt33 in 2018 (Table 4). Australia holds 73% of the world’s documented economic resources, ranking first on this basis (Table 8). However, it should be noted that the USGS figures, on which the ranking is based, do not include resource data for Rwanda, Congo, Nigeria, Brazil or China, all significant tantalum producers. Australia ranks sixth for tantalum production with 5% of the total world production (Table 8).
Western Australia hosts 89% of Australia’s EDR of tantalum, with over 61% occurring at the Greenbushes and Wodgina deposits. Other resources include the lithium pegmatites at Pilgangoora, Kathleen Valley, Mount Cattlin, Bald Hill (all in Western Australia), and at the Dubbo (Toongi) zirconium-hafnium-niobium-yttrium-rare earth deposit in New South Wales (Figure 27).
Over the last year, Australia’s tantalum Ore Reserves have slightly decreased from 39.6 kt in 2018 to 39.2 kt in 2019. Tantalum production in Australia has increased from 60 t in 2018 to 96 t in 2019. Increases in production have largely been a by-product of the heightened activity in the Australian lithium industry in this period.
Australia’s EDR of Niobium were 216 kt in 2019 (Table 3), unchanged from 2018 (Table 4). Niobium commonly occurs within lithium-tantalum pegmatite deposits, but all of Australia’s EDR of niobium occur at two (per)alkaline deposits: the Brockman rare earth-niobium-zirconium project (also known as Hastings) in Western Australia; and the Dubbo deposit in New South Wales (Figure 27).
Although Australia ranks third in the world for economic resources of niobium, it only holds 2% (Table 8), as world resources are overwhelmingly dominated by Brazil (84%). Australia’s total Ore Reserves of niobium, as of 2019, were 58 kt (Table 2), all from the Dubbo deposit. This is unchanged from 2018. Annual production figures for Australia are not known but are not considered to be significant.
32 See above n 7.
33 Geoscience Australia revised down the 2018 tantalum EDR from 99.3 kt (reported in Australia’s Identified Mineral Resources 2019) to 88.6 kt. New information has become available resulting a re-evaluation of Australia’s tantalum inventory for that period.
Magnesite
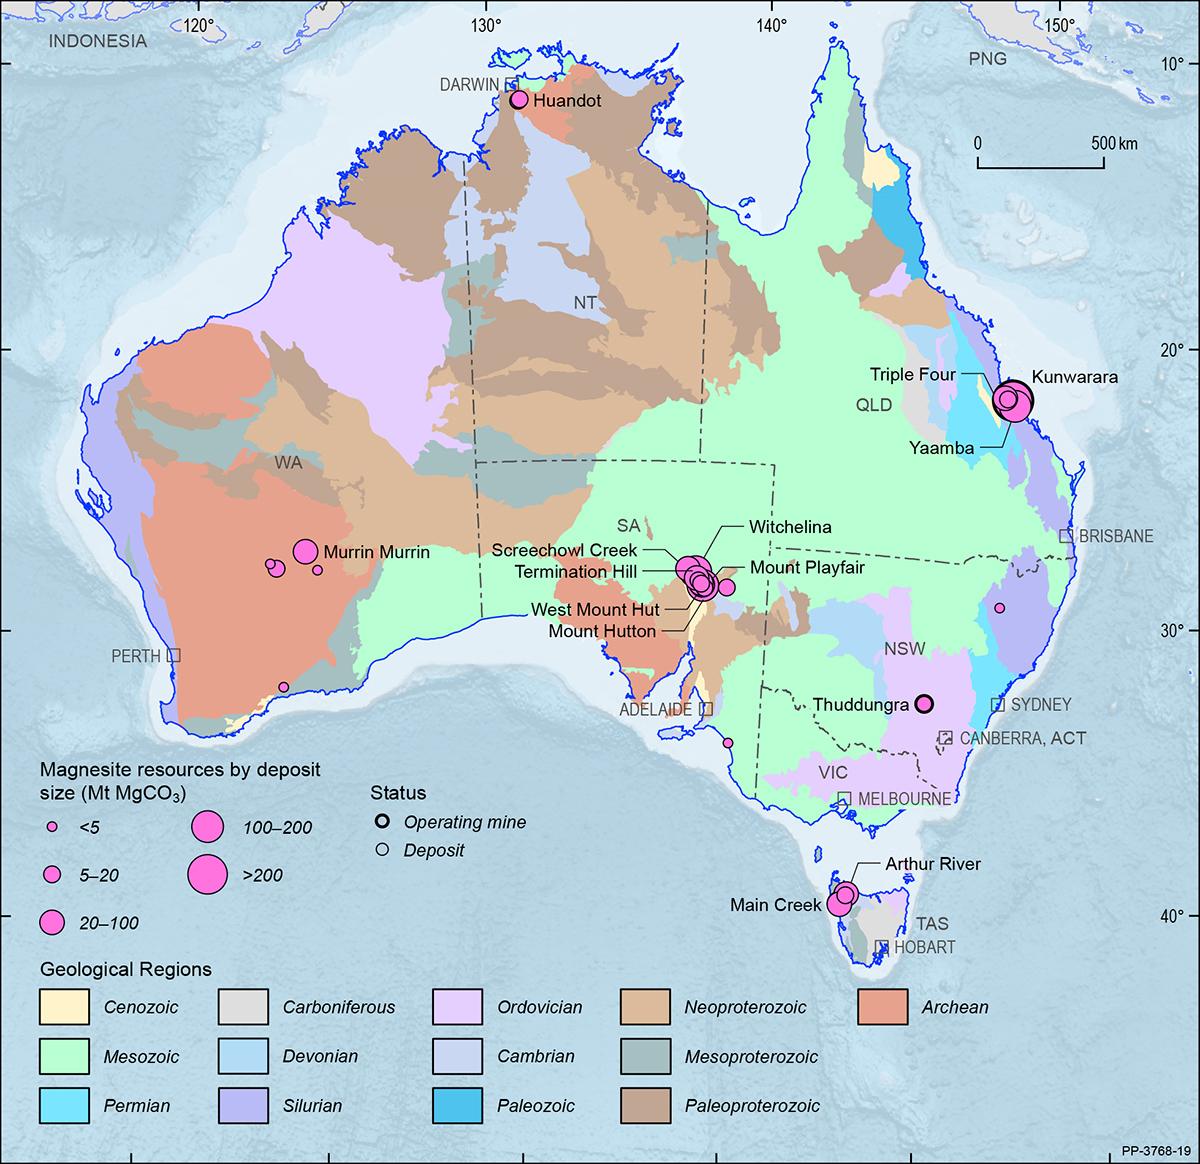
In 2019, Australia’s EDR of magnesite were 285 Mt (Table 3), a decrease of 31 Mt when compared to 2018 (Table 4), representing approximately 3% of the world total (Table 8). The South Australia Department of Premier and Cabinet reported magnesite production of 5,111 t in 2019, up (11%) from 4,587 t in 2018. The Queensland Department of Natural Resources Mines and Energy reported magnesite production of 407,761 t in 2018–19, also up (58%) from 258,859 t in 2017–18. Apart from South Australia and Queensland, magnesite EDR also occur in New South Wales, Western Australia and the Northern Territory (Figure 28).
Australia’s magnesite EDR comprises approximately 3% of total world economic resources and Australia is a minor producer (1%; Table 8). The world’s largest resources are found in North Korea (27%), followed by Russia (27%) and China (12%). Production is led by China (69%), Turkey (7%) and Brazil (6%).
Magnesium compounds are used for agriculture, chemical, construction, environmental and industrial applications. They also used for refractories in the form of dead-burned magnesia. Magnesium is regarded as a critical mineral by many advanced economies, including Australia which lists it in Australia’s Critical Minerals Strategy 201934.
34 See above n 7.
Manganese Ore
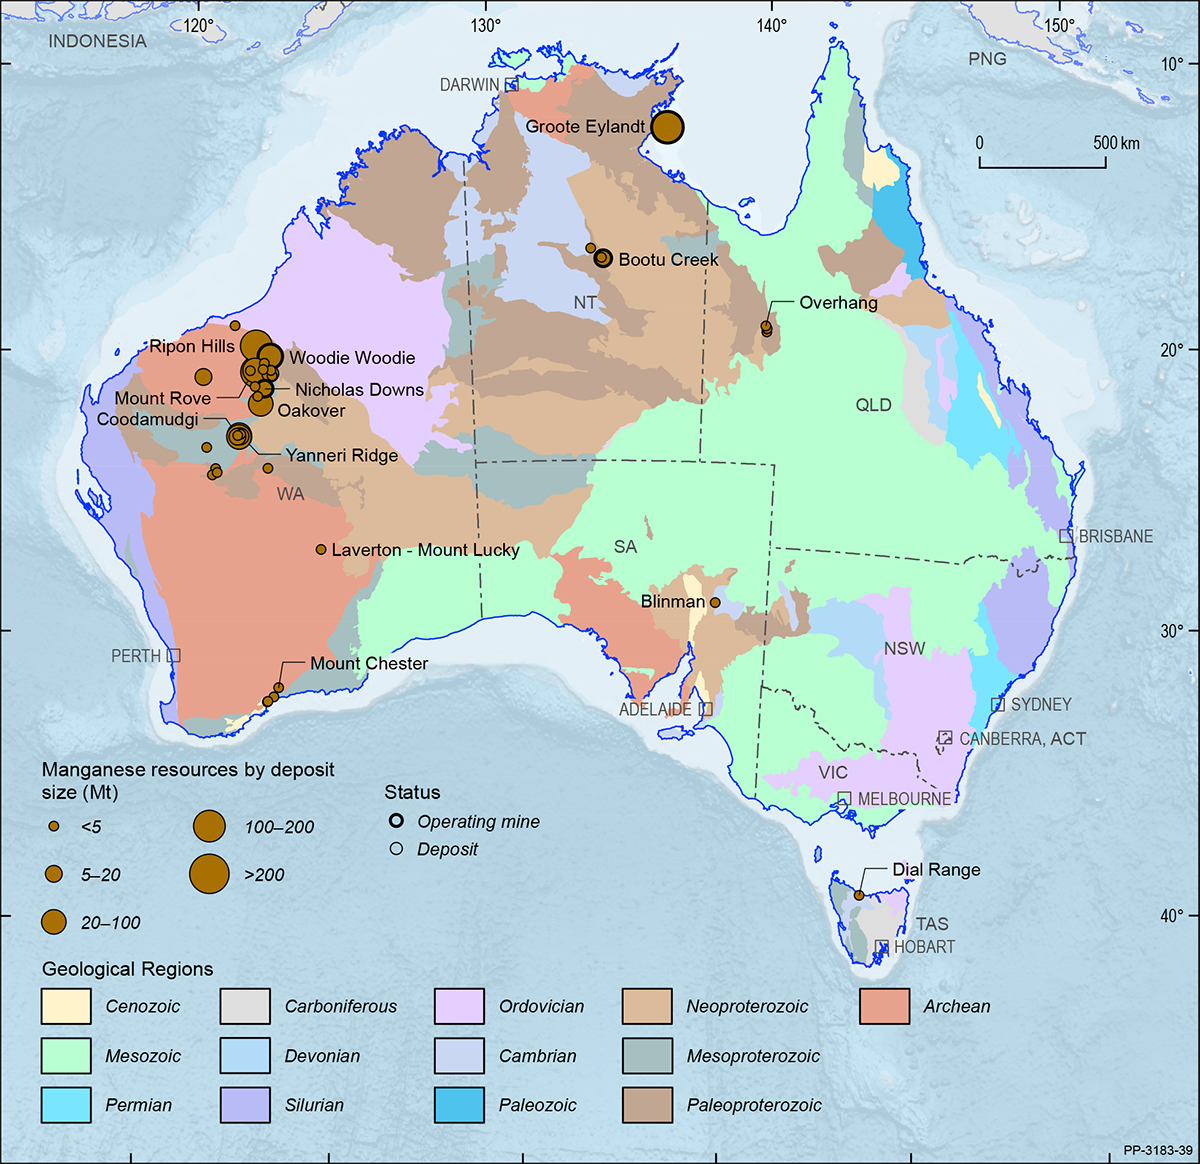
Australia’s EDR of manganese ore went up 40 Mt in 2019 to 272 Mt (Table 3), a 17% increase, compared to 2018 (Table 4). This ranks Australia’s resources as the world’s fourth largest, accounting for 14% of global manganese resources (Table 8) behind South Africa (31%), Brazil (17%) and Ukraine (17%). All of Australia’s EDR of manganese ore occur in the Northern Territory and Western Australia (Figure 2), although minor deposits also occur in other Australian states (Figure 29).
Australia’s mine production of manganese ore increased to 7.5 Mt in 2019, a 7% increase over the previous year’s production (7 Mt), reflecting increased production at all three of Australia’s operating manganese mines—Groote Eylandt, Woodie Woodie and Bootu Creek (Table 1). Australia’s manganese ore production accounts for 17% of world production, ranking second (Table 8) behind South Africa (29%). Manganese is regarded as a critical mineral by many advanced economies and is listed in Australia’s Critical Minerals Strategy 201935.
35 See above n 7.
Mineral Sands
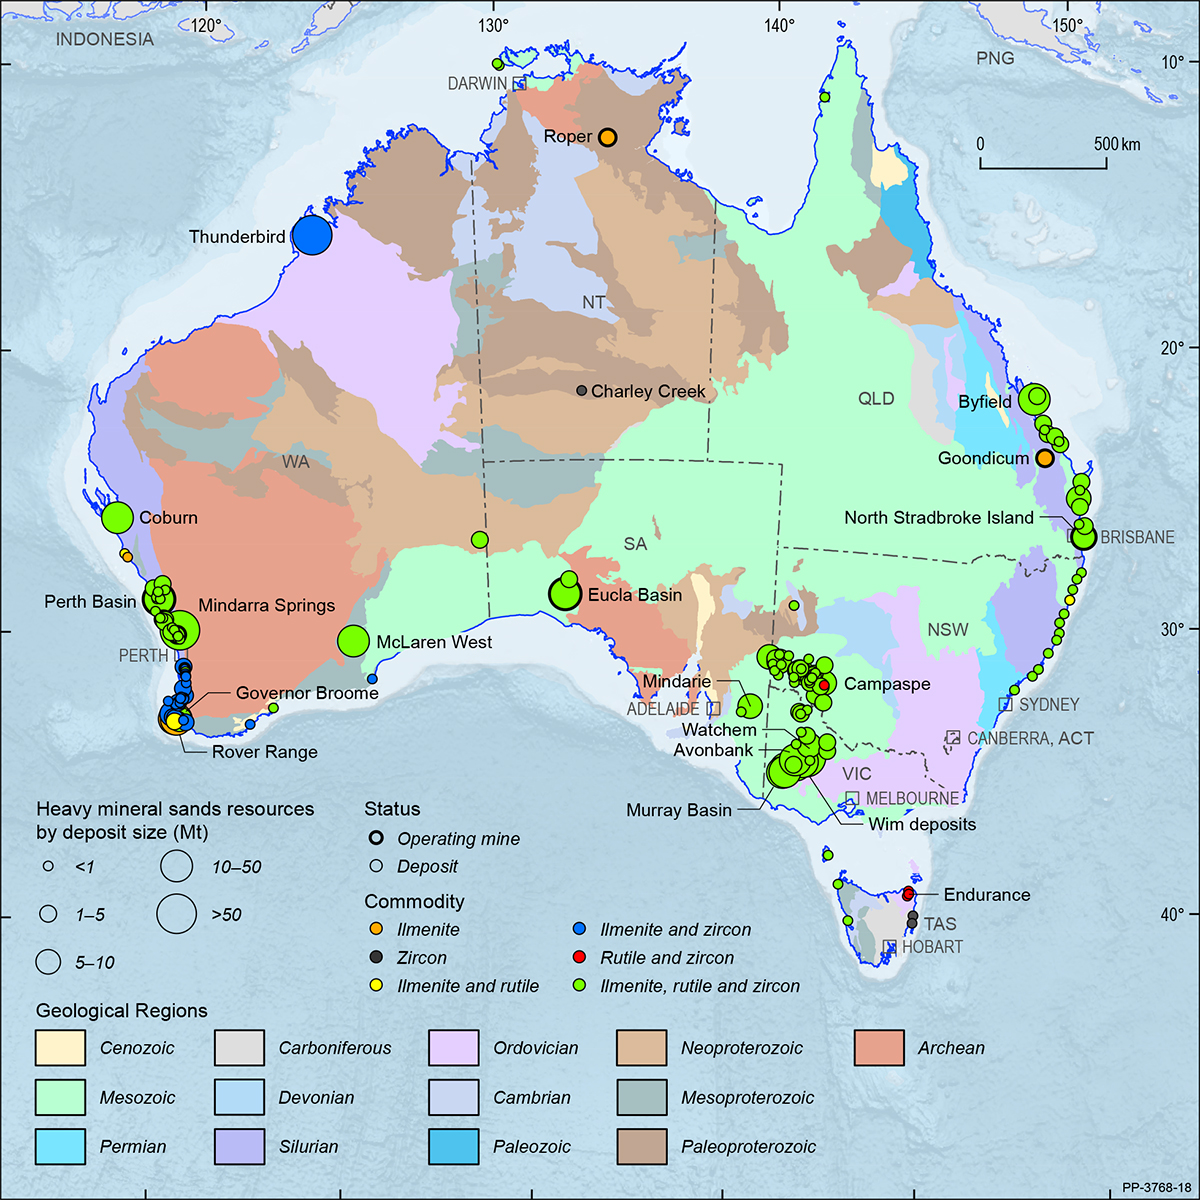
Every Australian state and the Northern Territory hosts heavy mineral sand deposits (Figure 30). The deposits contain a variety of minerals depending on their original source rock and the natural processes they have undergone during their formation. The main minerals of commercial interest are zircon and the titanium-bearing minerals ilmenite, rutile and leucoxene. Minor amounts of other minerals such as monazite and xenotime may also be present. Monazite commonly contains rare earth elements and thorium. Neither has been recently produced from Australian mineral sand operations; however, growing demand for rare earths is prompting some operators to begin including them in their production plans. The majority of Australia’s mineral sand resources are in the Murray Basin, encompassing parts of Victoria, New South Wales and South Australia; the Eucla Basin, in South Australia and Western Australia; and the Perth and Canning basins in Western Australia.
In 2019, Australia’s mineral sand EDR were estimated to be 274.7 Mt of ilmenite, 35.4 Mt of rutile and 79.7 Mt of zircon (Table 3). These estimates are largely unchanged from 2018 (Table 4). They represent the world’s:
- second largest economic resources of ilmenite (24% of global economic resources, Table 8) after China (34%) and ahead of India (12%);
- largest economic resources of rutile (65%; Table 8) followed by India (14%) and South Africa (12%); and
- largest economic resources of zircon (72%; Table 8) followed by South Africa (9%) and Mozambique (2%).
Australia also had Inferred Resources of 255.5 Mt of ilmenite, 35.9 Mt of rutile and 57.8 Mt of zircon plus smaller amounts regarded as subeconomic (Table 3). Heavy mineral sand deposits and operating mines are shown in (Figure 30) on a total resource basis.
In terms of total Ore Reserves, Australia had an estimated 63.6 Mt of ilmenite, 9.9 Mt of rutile and 24.9 Mt of zircon in 2019 (Table 2). Twelve operating mines produced a total of 1.0 Mt of ilmenite, 10 mines produced 0.2 Mt of rutile and 10 produced 0.5 Mt of zircon (Table 1), largely unchanged from 2018 production. Ore Reserves at these mines accounted for 26%, 24% and 18% of Australia’s ilmenite, rutile and zircon Ore Reserves, respectively (Figure 1).
From 1990 onward, new mineral sand discoveries resulted in significant increases in mineral resource estimates (Figure 31, Figure 32, Figure 33). Initially, ilmenite production almost kept pace with the new discoveries so resource life only increased gradually (Figure 31). In the 2000s, however, lower than average production rates resulted in larger increases to resource life and, since 2011, ilmenite resource life has again been boosted with new resource delineation combined with dramatically decreased production from 2014 (Figure 31).
Unlike ilmenite, production rates for rutile and zircon from around 1987 to 2006 decreased slightly or were steady, although these minerals also had increased resource estimates (Figure 32 and Figure 33). As a result, the significant increases in resources estimates from around 1990 caused dramatic increases in resource life (Figure 32 and Figure 33). Since 1990, the resource life for rutile and zircon have increased and decreased conspicuously in response to variable production rates (Figure 32 and Figure 33). Increased zircon resource delineation since 2011 has also contributed to the most recent increase in resource life (Figure 33).
Expenditure for mineral sand exploration during 2019 was approximately $34.7 million, largely unchanged since 2018 ($34.5 million). In 2019, an estimated 0.676 Mt of ilmenite concentrate, 0.312 Mt of rutile concentrate and 0.710 Mt of zircon concentrate were exported from Australia, down 16%, no change and up 15%, respectively, on 2018 export figures.
Molybdenum
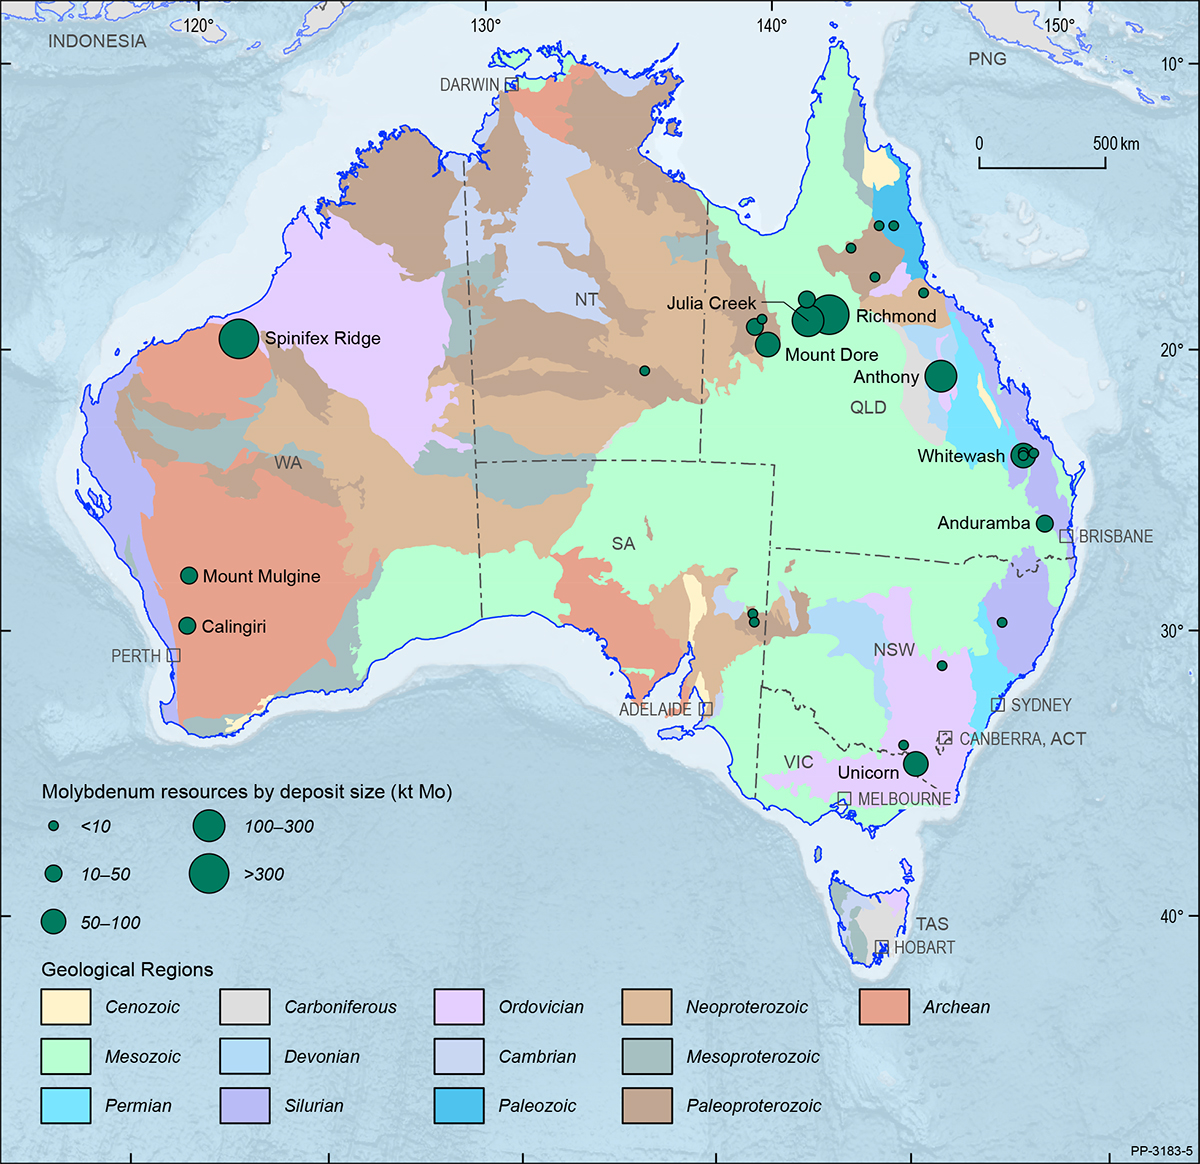
Australia’s EDR of molybdenum in 2019 were 248 kt (Table 3), a 45% increase from 171 kt in 2018 (Table 4). Australia ranks seventh globally for economic molybdenum resources but only hosts approximately 1% of world resources (Table 8), which are dominated by China (46%), Peru (16%), the USA (15%) and Chile (8%). The bulk of Australia’s EDR of molybdenum occur in Queensland (90%), followed by Western Australia (7%) and the Northern Territory (2%; Figure 34). In 2019, Inferred Resources of molybdenum in Australia totalled 1,737 kt and another 366 kt of molybdenum were categorised as Paramarginal (Table 3).
Molybdenum is ductile, resistant to corrosion and has a high melting point. It is used in the production of alloys to increase strength, hardness and electrical conductivity.
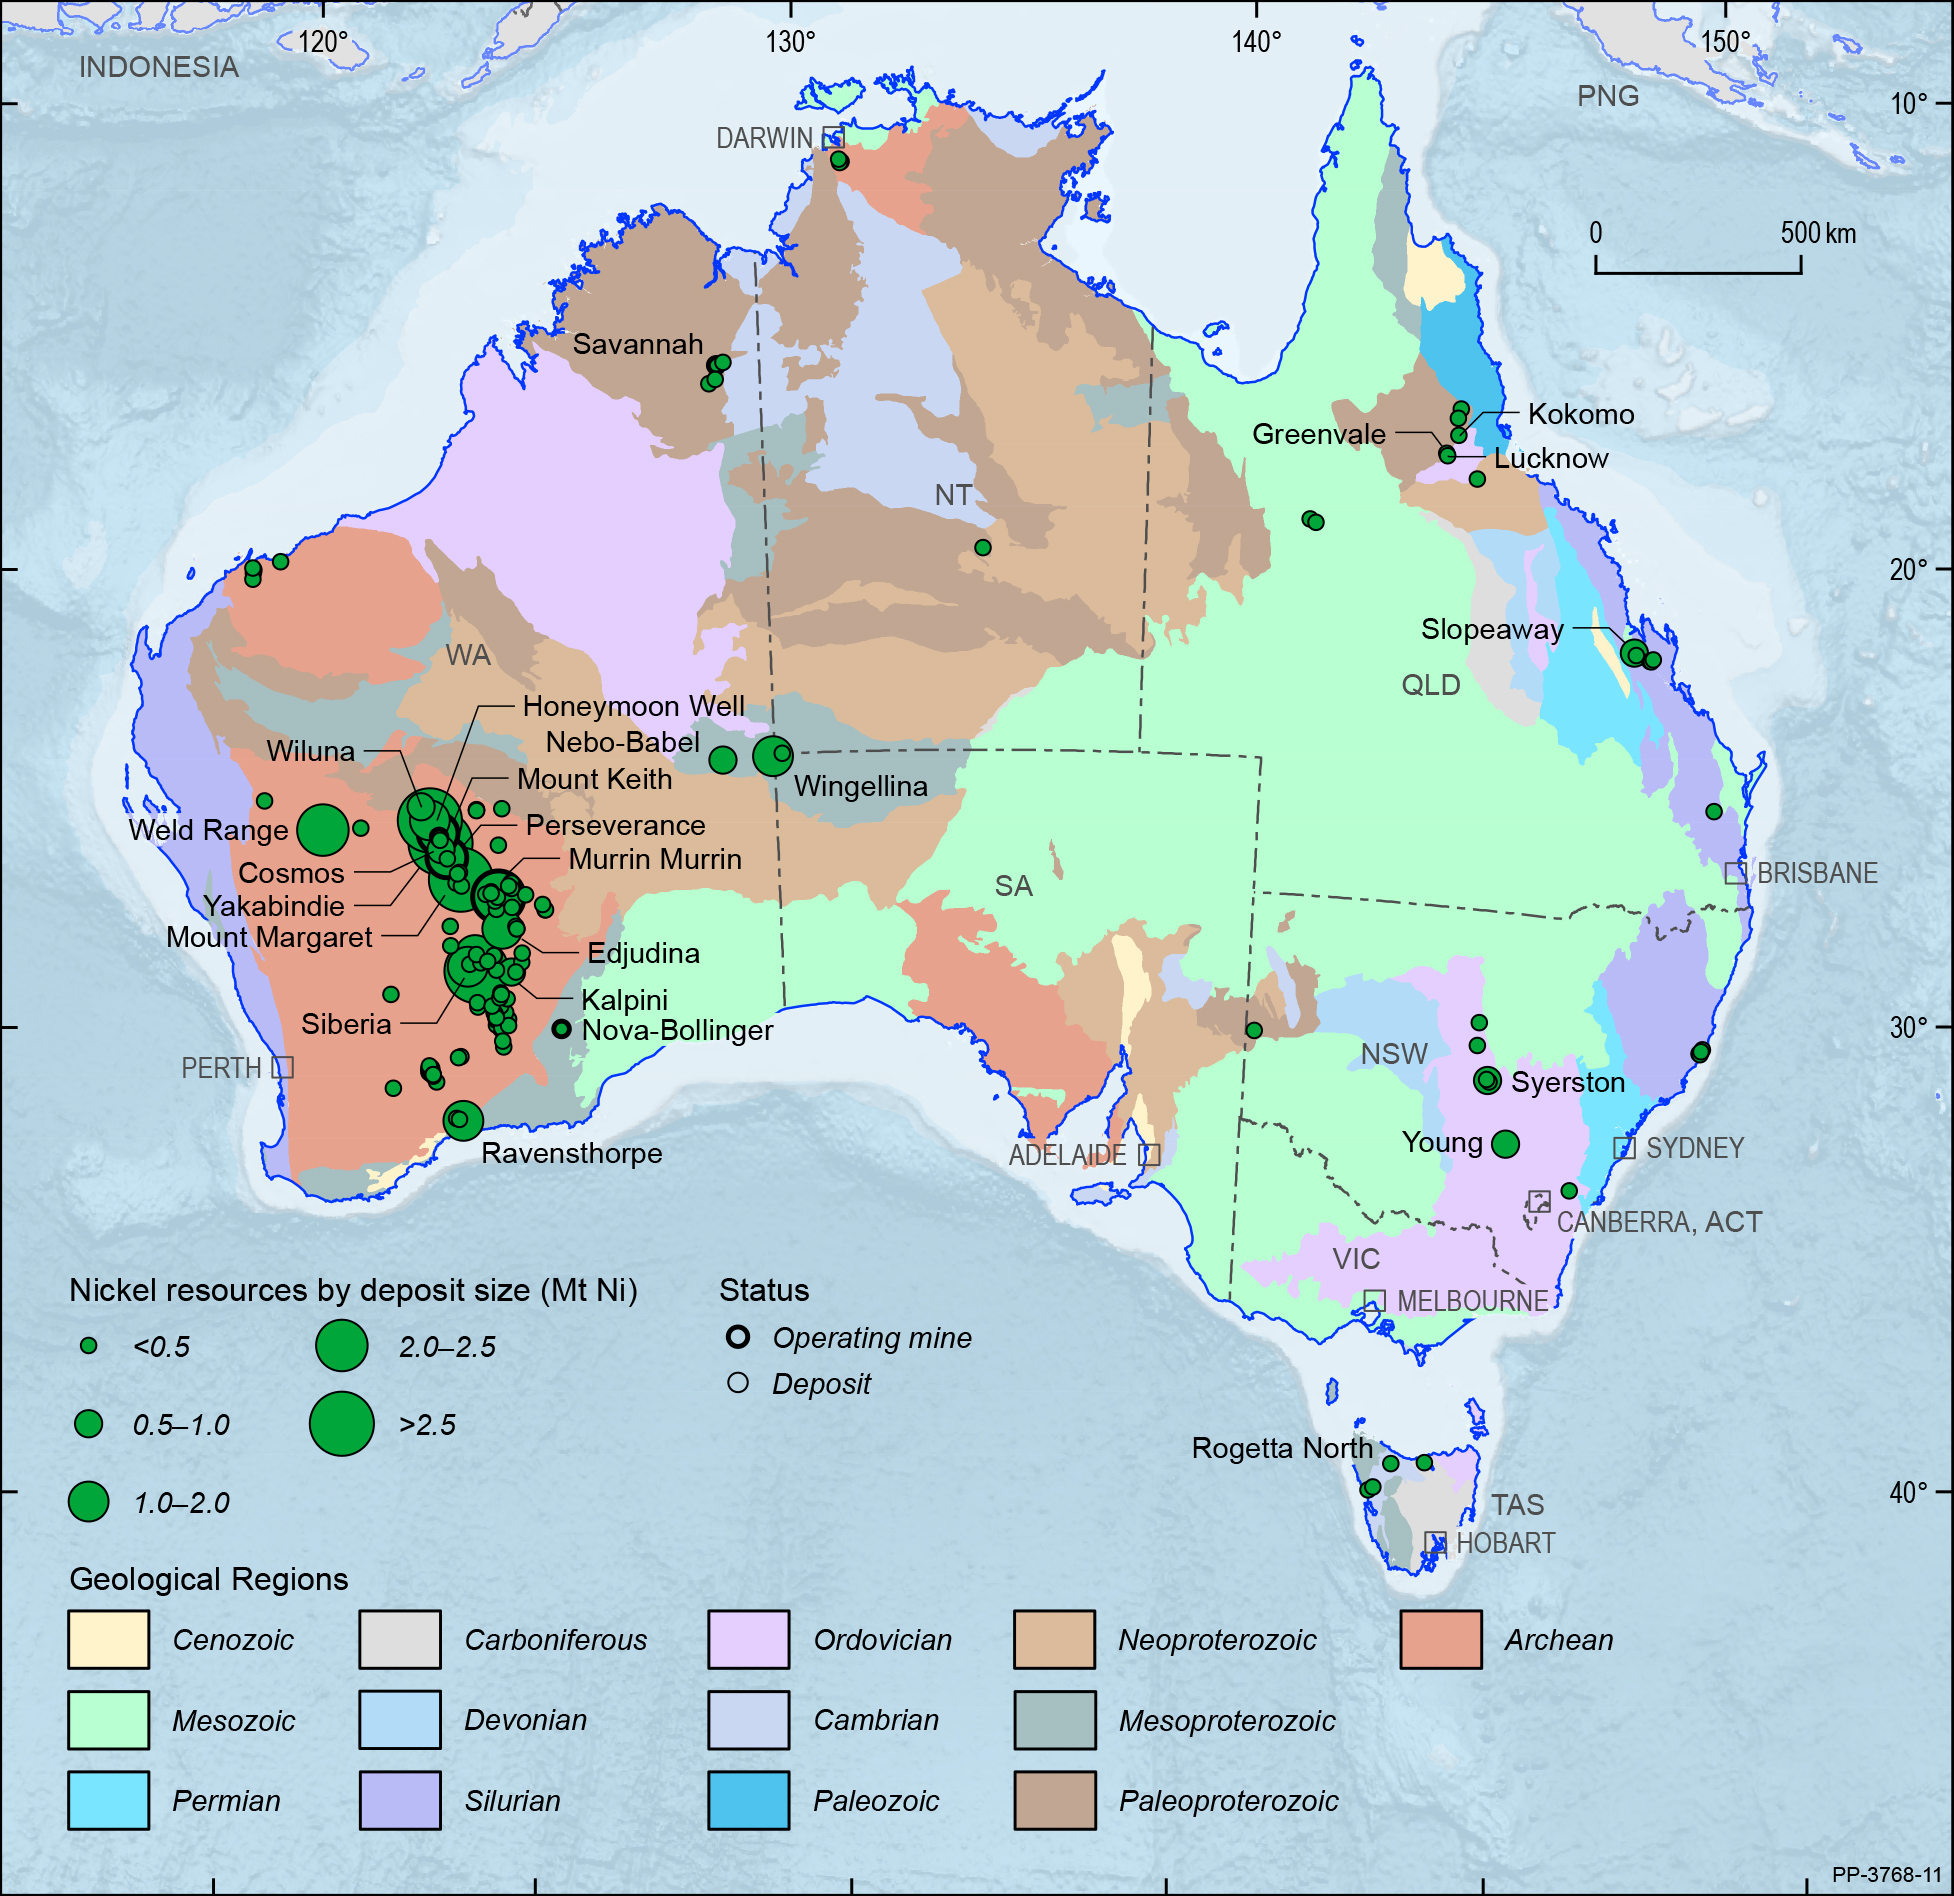
Nickel
Most nickel production is used in alloys. When alloyed with other elements, nickel imparts toughness, strength, resistance to corrosion and various electrical, magnetic and heat resistant properties. About 65% of world nickel output is consumed in the manufacture of stainless steel, which is used widely in the chemical industry, motor vehicles, the construction industry and in consumer products such as sinks, cooking utensils, cutlery and white goods.
Australia’s EDR of nickel were 21.2 Mt in 2019 (Table 3), up 1.5 Mt (8%) from 19.7 Mt in 2018 (Table 4). Australia ranks first globally with 24% of the world’s economic resources, and sixth for production (7%; Table 8).
Australia’s nickel deposits and operating mines are shown in Figure 35 on a total resource basis.
Australia’s total Ore Reserves of nickel were 8.3 Mt in 2019 (Table 2), up 34% from 6.2 Mt in 2018. Ten operating mines (Table 1) produced 0.16 Mt of nickel in 2019 (Table 1), up 7% from 0.15 Mt in 2018. The USGS notes that, in recent years, production of refined nickel decreased as stainless steel producers preferred lower-cost nickel pig iron. At the same time, production of nickel chemicals has increased, particularly nickel sulphate used in the production of batteries. Increased development and use of battery and electric vehicle technologies indicate a significant increase in global nickel consumption is likely.
In 2019, exports of nickel ore and concentrates (0.258 Mt) and intermediate and refined nickel (0.241 Mt) had a combined export value of $4,126 million (Table 11), slightly down from $4,286 million in 2018 owing to reduced value of refined nickel which fell 11.% to $15,235/t (Table 12).
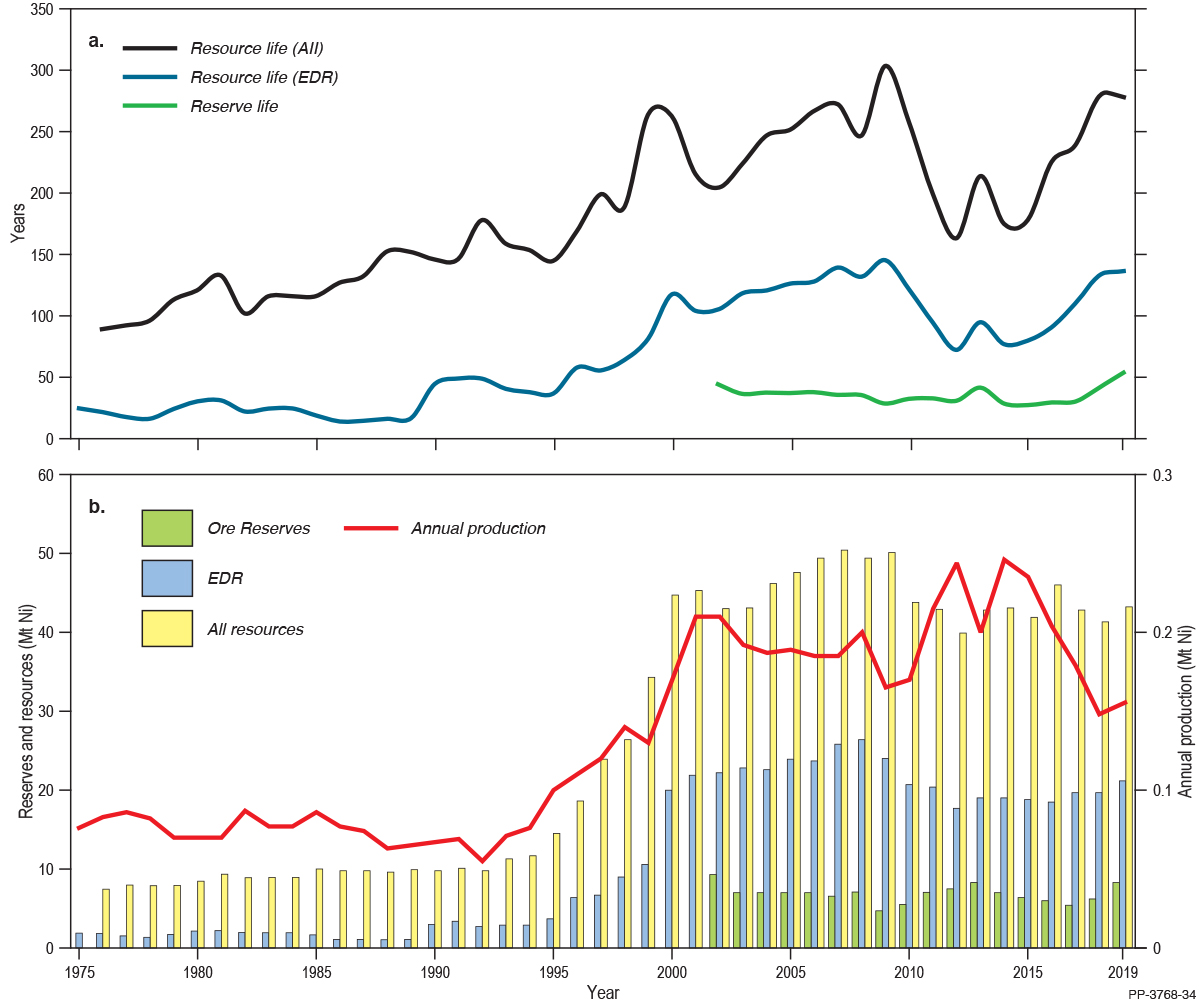
At 2019 rates of nickel production, the average reserve life at operating mines is 15 years and demonstrated resource life (Measured and Indicated categories) is 49 years (Table 1). If Ore Reserves at mines on care and maintenance, developing mines and undeveloped deposits are also considered, the average reserve life of nickel is potentially 54 years (Table 9) and if accessible EDR is used as an indication of long-term potential supply, then Australia’s nickel resources could last 135 years at 2019 rates of production (Table 9). At 2019 rates of production, and even with increased rates of production, Australia has the potential to produce nickel for many decades into the future and is well placed to provide reliable supply for use in decarbonising global economies.
Long-term trends show that reserve life for nickel has generally declined since 2002 because companies have been replacing Ore Reserves at a slower rate than production has been depleting them (Figure 36). Resource life for nickel gradually rose from 1990 to 2009 because companies delineated new resources faster than they increased production (Figure 36). Since the 2009 peak, resource life has declined but has begun to increase again in recent years owing to falling production and the delineation of new reserves and resources (Figure 36).
Oil shale
Resources of oil shale predominantly occur in sedimentary basins around Gladstone, Mackay and Proserpine in central Queensland. Subeconomic (contingent) resources were estimated at 2,287 GL (14,385 million barrels), and Inferred (prospective) resources were estimated at 1,472 GL (9,261 million barrels) in 2019 (Table 3). Australia currently has no EDR of oil shale, with all resources being assessed as subeconomic. There is currently no production from oil shales in Australia.
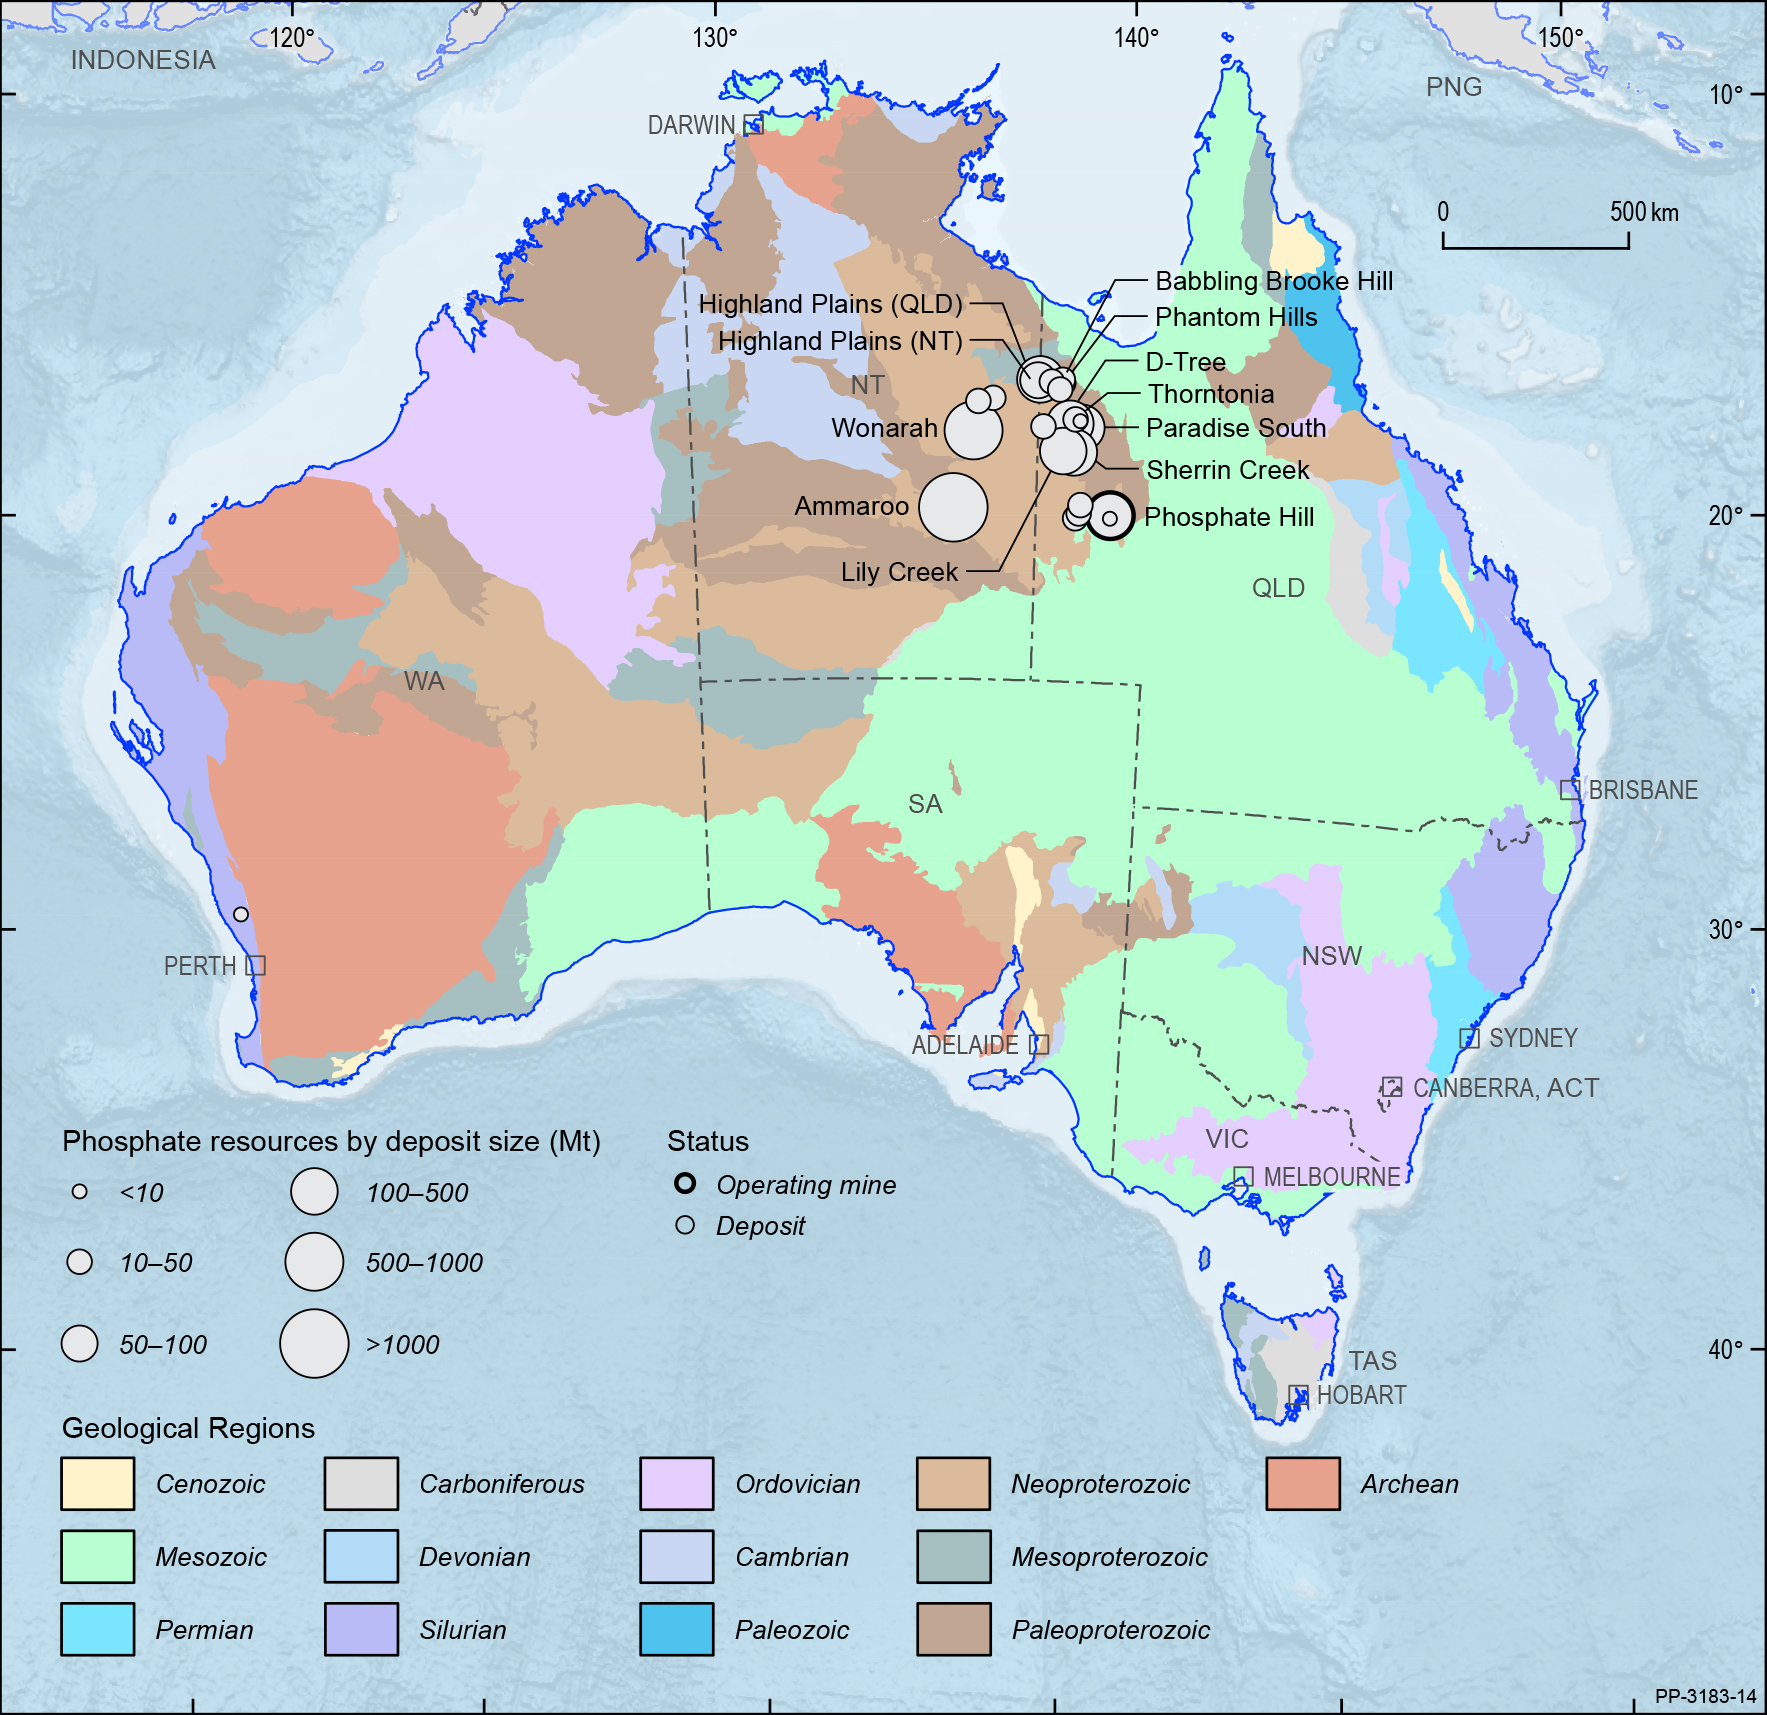
Phosphate
Phosphate rock is the main source of phosphorus which is essential to all forms of life. It is a key component of DNA, it is used in the control of energy transfer and storage at the cellular level as well as playing an important role in metabolic processes. Plants require three major nutrients for life—nitrogen (N), potassium (K) and phosphorus (P). There is no substitute for phosphorus in agriculture.
Geoscience Australia assesses both phosphate rock (phosphorite and guano) and contained P2O5 which, as well as being a component of phosphate rock, can be found in other rock types in which alternative minerals are the primary target.
In 2019, Australia’s EDR of phosphate rock and contained P2O5 were both unchanged compared to 2018 at 1,091 Mt and 178 Mt, respectively (Table 3, Table 4). The phosphorites of the Georgina Basin (encompassing parts of Queensland and the Northern Territory; Figure 37) account for almost all of Australia’s EDR of phosphate rock and 93% of Australia’s EDR of contained P2O5. The remaining phosphate rock occurs at Christmas Island. The rare earth deposits at Mount Weld (Western Australia) and Nolans Bore (Northern Territory) also have EDR of contained P2O5. Australia hosts less than 2% of the world’s economic resources of phosphate rock (Table 8) with Christmas Island and Phosphate Hill (Queensland) the only significant producers.
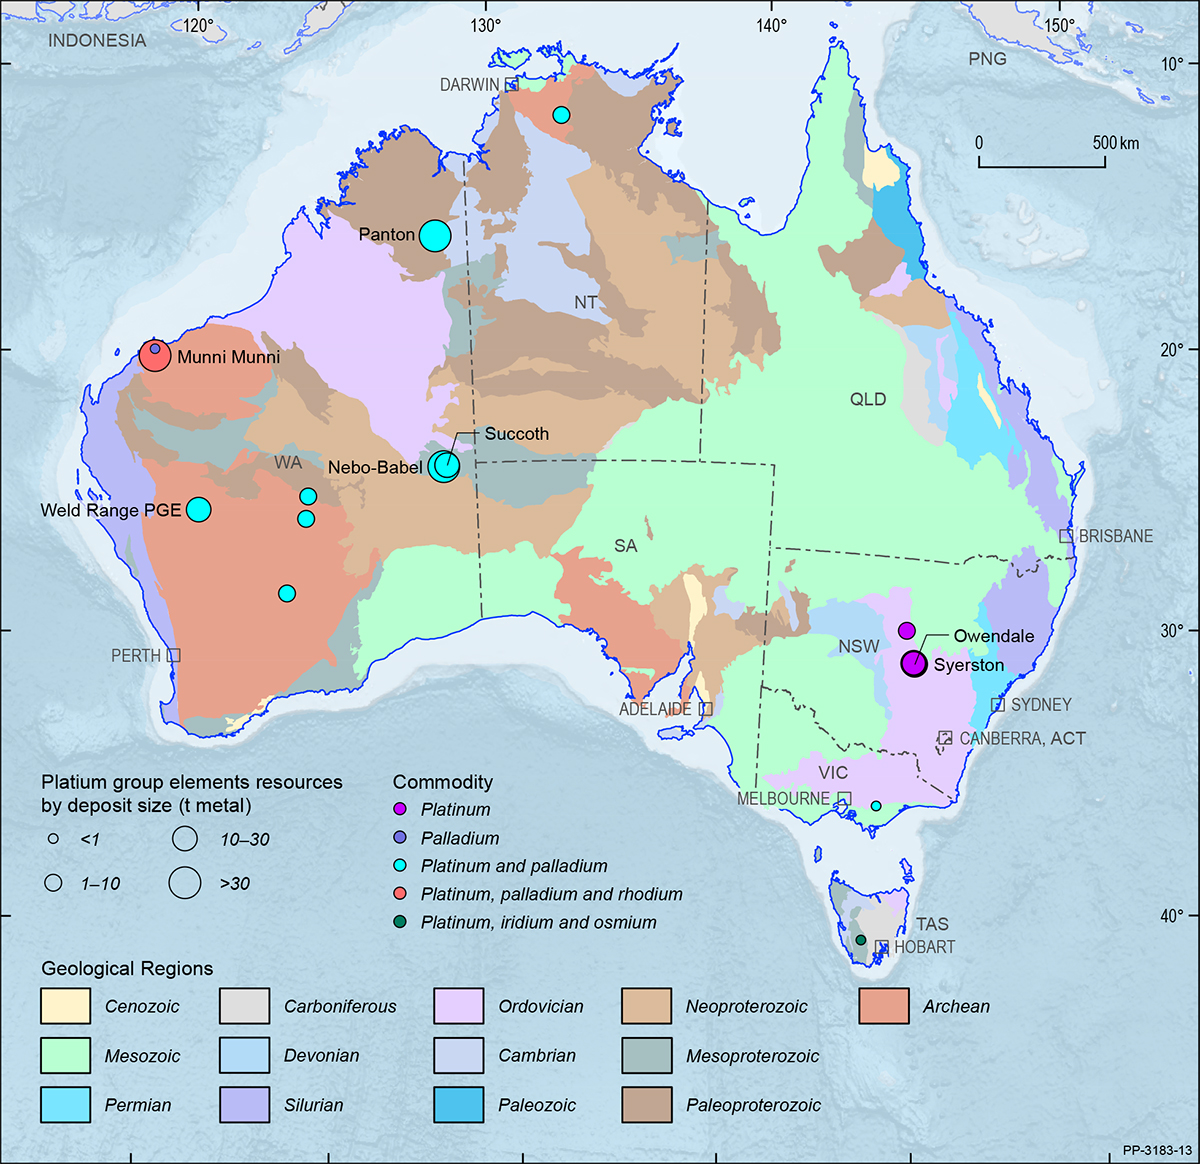
Platinum Group Elements
The platinum group elements (PGE) comprise platinum (Pt), palladium (Pd), iridium (Ir), osmium (Os), rhodium (Rh) and ruthenium (Ru). The elements of most commercial significance are platinum, palladium and, to a lesser degree, rhodium. The commercially important properties of PGEs include their resistance to corrosion and oxidation, high melting points, electrical conductivity and catalytic activity in the chemical, electrical, electronic, glass and motor vehicle industries. The emerging commercial importance of PGE is in applications associated with the motor vehicle industry resulting from increasing global emission controls, development of lead-free petrol and efforts to improve fuel efficiency. Other applications include the use of platinum-rhodium alloys to oxidise ammonia to nitric acid in the production of fertilisers, while platinum is used extensively in jewellery. Due to their diverse uses, PGE are regarded as critical minerals by many advanced economies and are listed in Australia’s Critical Minerals Strategy 201936.
Australia’s EDR of PGE increased 19% (6.1 t) from 31.5 t in 2018 to 37.6 t in 2019 (Table 4). Australian economic resources represent a minor portion of the world total of 69,000 t (Table 3). Australia also has Inferred Resources of PGE amounting to 107.2 t and another 134.4 t categorised as Paramarginal (Table 3). In addition to public resource reports, Australian mineral deposits may contain unreported resources of PGE that are recovered as by-products of the primary commodity being mined (usually from nickel sulphide ores). The Western Australian Department of Mines and Petroleum reported that 483 kg of platinum and palladium was produced during 2019 (Table 3), a decrease from 541 kg in 2018. The bulk (75%) of Australia’s EDR of PGE occur in Western Australia (Figure 38).
36 See above n 7.
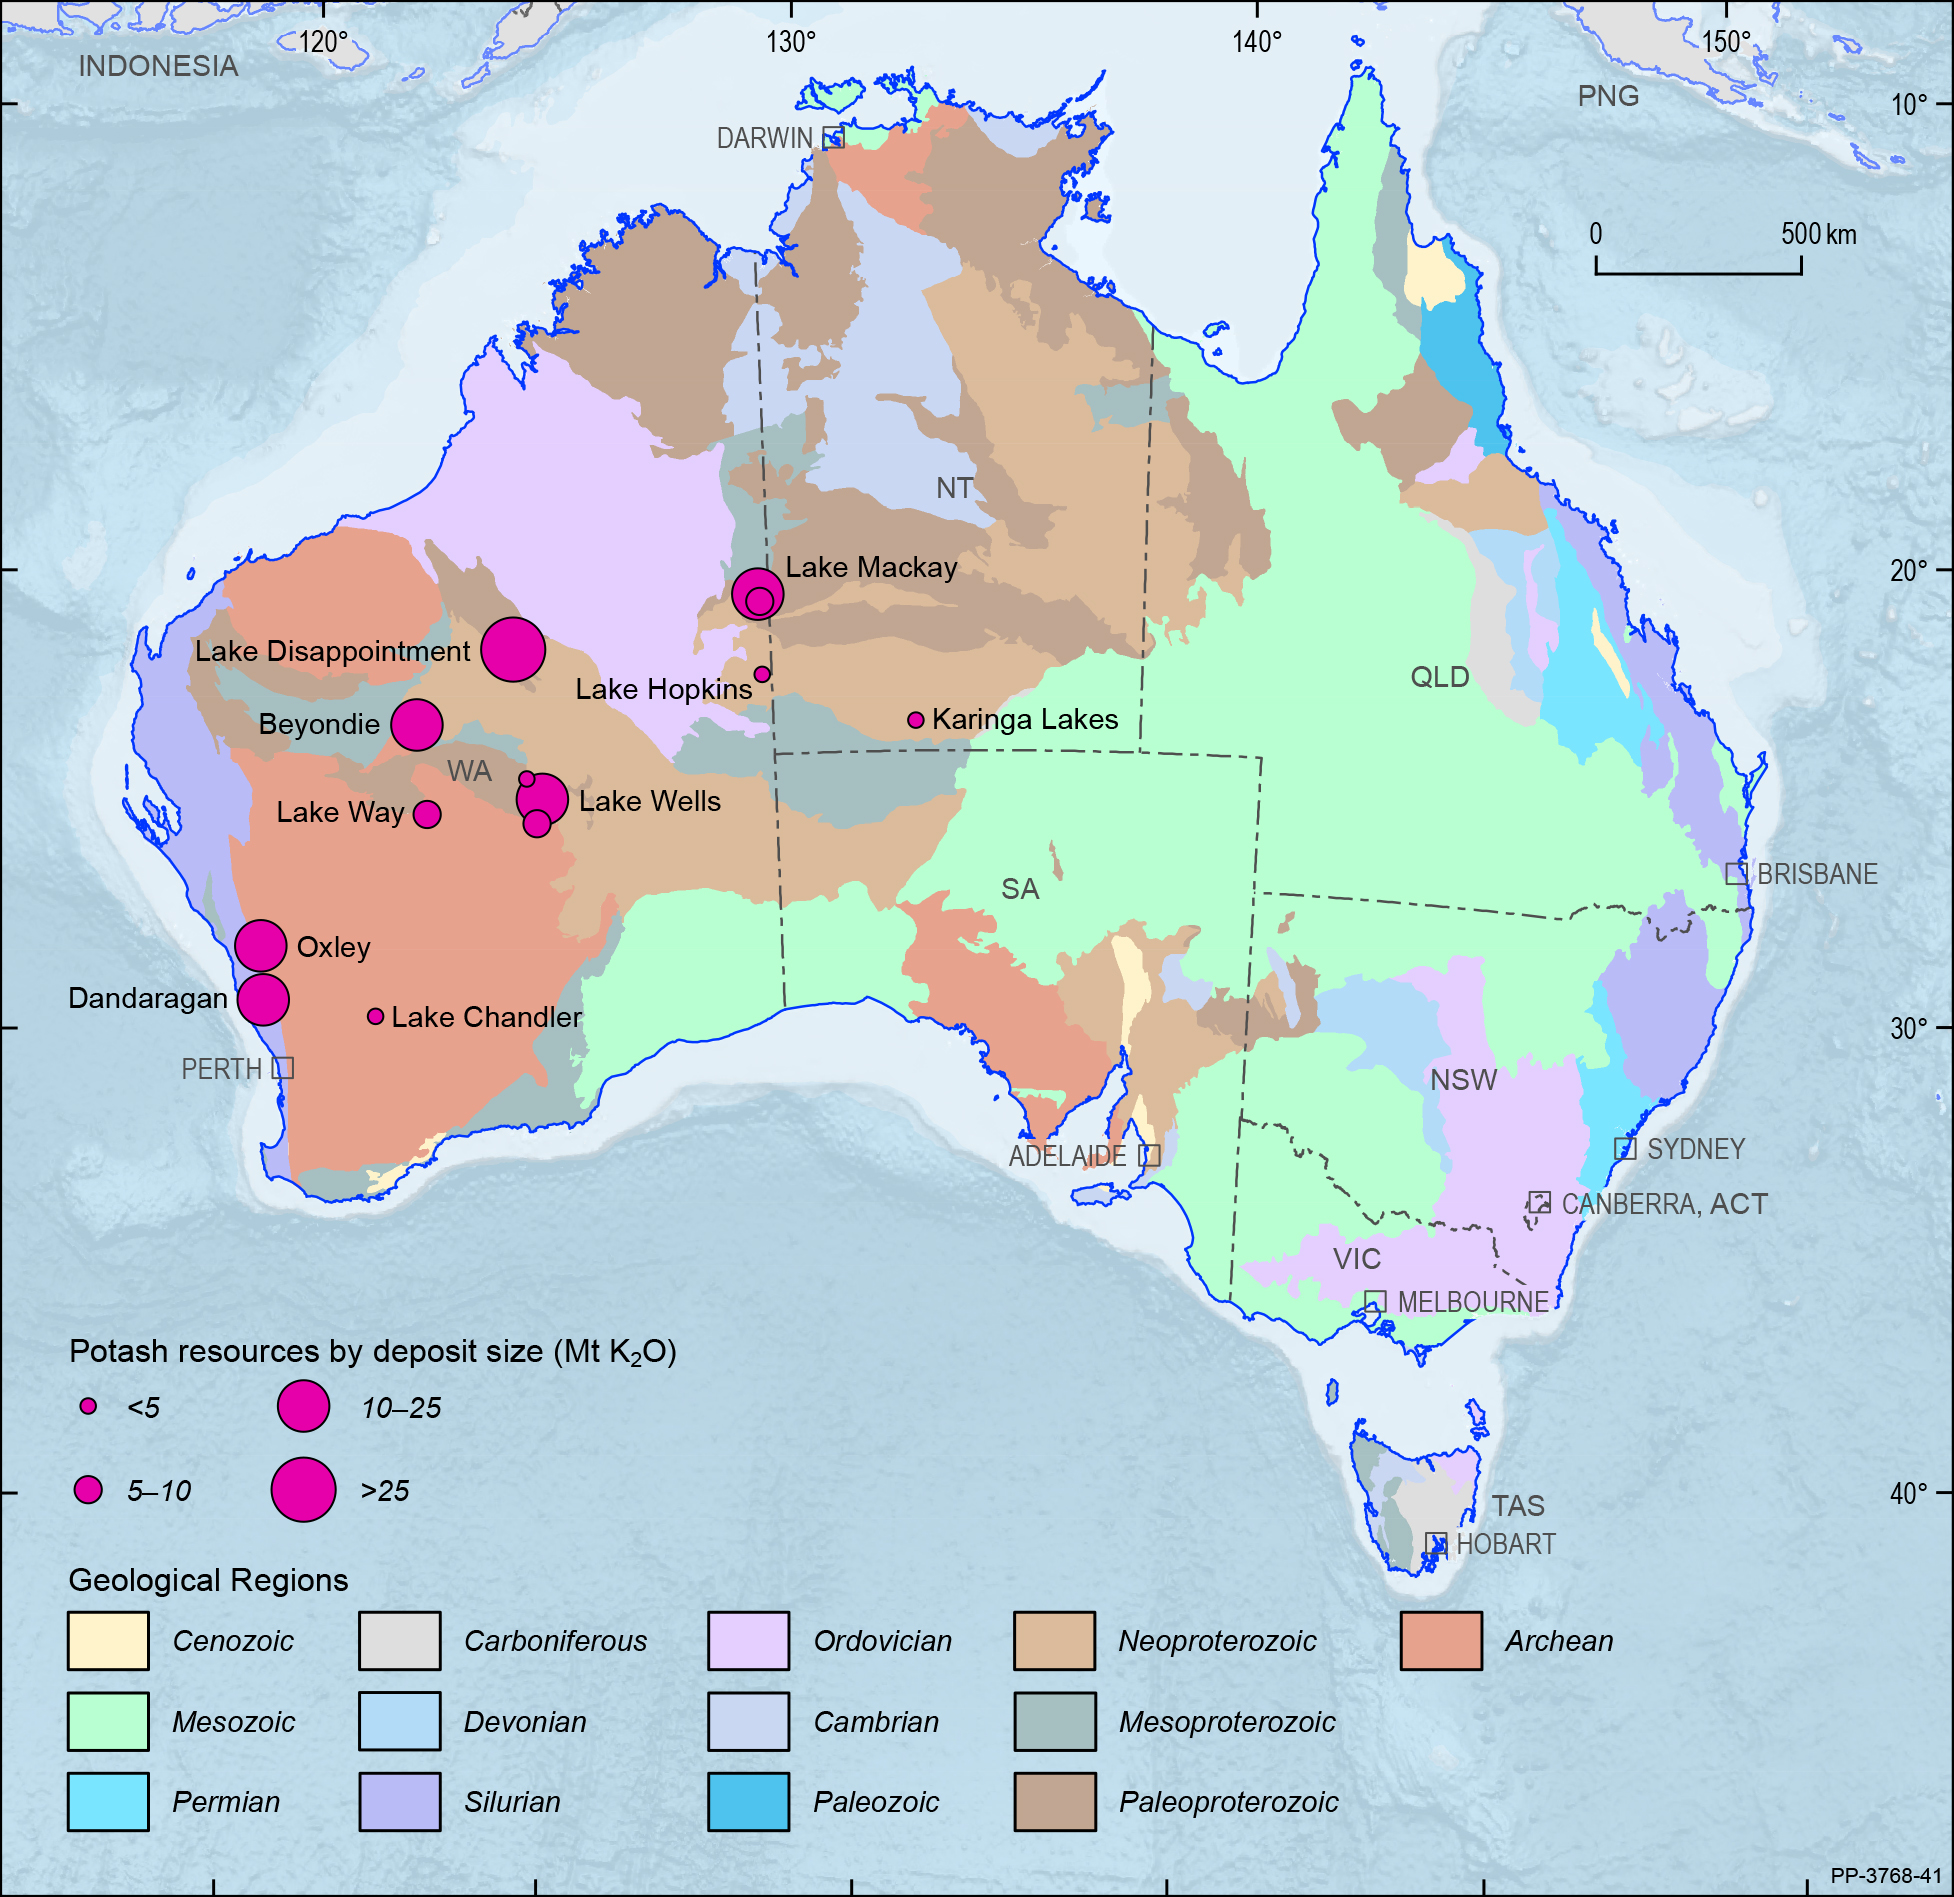
Potash
In 2019, Australia’s EDR of potash increased by 17% to 35 Mt, up from 30 Mt37 in 2018 (Table 4). The increase reflects significant industry and exploration activity as projects matured and companies reported maiden Ore Reserves and upgrades to Mineral Resources. Nearly all (96%) of Australia’s potash resources occur in Western Australia, with the exception of Karinga Lakes in the Northern Territory and Lake Mackay which occurs on the border between the two jurisdictions. In addition, nearly all Australian potash resources occur in lake brines with large resources also delineated at Kalium Lakes (Beyondie), Lake Disappointment, Lake Wells and Lake Way (Figure 39), with companies typically planning to produce sulphate of potash (SOP)38.
However, Australia’s potash resources remain small (1%) by world standards (Table 8). The countries with the largest economic resources of potash (K2O) in 2019 were Canada (1,000 Mt), Belarus (750 Mt) and Russia (600 Mt). The USGS estimates that Israel and Jordon also have large resources as the Dead Sea contains an estimated 2 billion tonnes of potassium chloride.
Australia did not produce potash commercially in 2019 (Table 8) but is on the verge of production just seven years after the publication of Geoscience Australia’s review of Australian salt lakes and their potential for strategic resources39. For example, Australian Potash Ltd published a definitive feasibility study in August 2019 that identified a 30-year mine life for their Lake Wells SOP project, 500 km northeast of Kalgoorlie. The project has a JORC (2012)-compliant Measured Mineral Resource of 18.1 Mt (SOP), the largest in Australia as at 31 December 2019.
Other advanced projects (all in Western Australia) include:
- Beyondie (Kalium Lakes Ltd) for which Australia’s first bankable feasibility study for a potash project was completed in 2018. The company aims to produce 90 ktpa for 30–50 years.
- Lake Way (Salt Lake Potash Ltd) as part of the Goldfields Salt Lakes Project. The project owner released a bankable feasibility study for Lake Way in 2019 that showed the operation could produce 245 ktpa SOP over 20 years. The company has offtake partners for 224 ktpa and the project is expected to begin production in 2021.
- Lake Mackay Potash (Agrimin Ltd) for which a positive definitive feasibility study was completed. The project comprises the mine, processing plant, transport and a port facility at Wyndham. The company announced significant upgrades to its reserves and resources in 2020, including an Ore Reserve of 20 Mt SOP that will contribute to Australia’s EDR in the next reporting period.
- Lake Disappointment (Reward Minerals Ltd) is promoted as the largest high-grade brine SOP resource in the world outside of China. The company completed a prefeasibility study in 2018 that indicated production of 400 ktpa SOP over 27 years was achievable. Most recently, it received both Commonwealth and Western Australia environmental approval in 2020.
BCI Minerals Ltd also plans to produce SOP, but from evaporated seawater, at its Mardi project located on the Pilbara coast of Western Australia. This project is primarily a high-purity salt (NaCl; table salt) operation that could produce up to 4.4 Mtpa but, in its 2020 definitive feasibility study, the company also included plans to abstract 120 ktpa SOP from the seawater.
Another industry action to note is adoption by the JORC Committee of brine guidelines that describe the unique technical considerations for reporting brine mineralisation, including a requirement for the Competent Person to consider brine composition and grade over time during its abstraction40. The guidelines improve resources reporting for potash reserves and resources in compliance with the JORC Code and should lead to greater confidence for investors and other stakeholders.
37 Geoscience Australia published an EDR of potash amounting to 72 Mt in Australia’s Identified Mineral Resources 2019. New information has become available, particularly around the drainable recovery from some deposits, resulting a re-evaluation of Australia’s potash inventory for that period.
38 There are two major sources of potash for agriculture. The lower-value muriate of potash (MOP; potassium chloride—KCl) is a ‘volume’ business, and six companies occupy over 80% of the global market share. In comparison, sulphate of potash (SOP; potassium sulphate—K2SO4) is used for high-value, chloride-sensitive or chloride-intolerant crops and is therefore a ‘value’ business. It is a more bespoke product and global production is significantly lower than MOP.
39 Mernagh, T.P. Bastrakov, E.N., Clarke, J.D.A., de Caritat, P., English, P.M., Howard, F.J.F., Jaireth, S., Magee, J.W., McPherson, A.A., Roach, I.C., Schroder, I.F., Thomas, M., Wilford, J.R. A Review of Australian Salt Lakes and Assessment of their Potential for Strategic Resources (Geoscience Australia Record 2013/039, 2013). See http://pid.geoscience.gov.au/dataset/ga/76454 (accessed 18 December 2020).
40 JORC, Guidelines for Resources and Reserve Estimation for Brines (JORC Guideline, 2019). See www.jorc.org/docs/Brine_Guideline_final.pdf (accessed 18 December 2020).
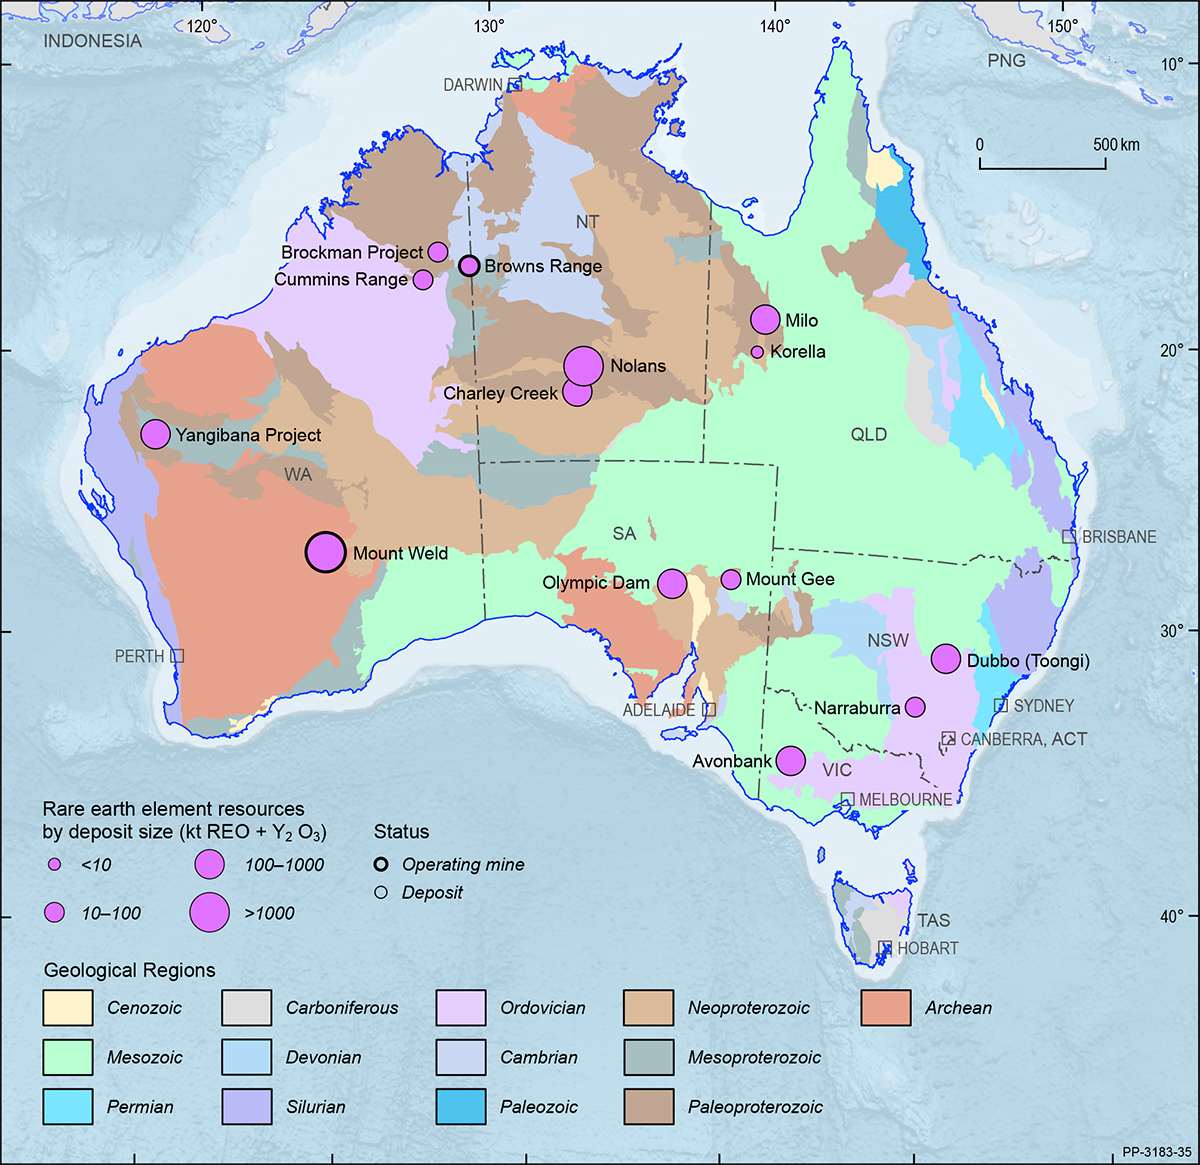
Rare Earth Elements
The rare earth elements (REE) are a group of metals comprising the 15 elements of the lanthanide series41. In addition, yttrium (Y) and scandium (Sc) are commonly considered part of the grouping because of their similar chemical properties. Resources of REE are reported as rare earth oxides (REO). Geoscience Australia incorporates yttrium when determining REO resource estimates but assesses scandium separately.
REE are used in renewable energy production; electric vehicles; military technologies; high-end technological applications, such as mobile phones and other electronics; lasers; speciality alloys; and batteries. REE are regarded as critical minerals by many advanced economies, and are listed in Australia’s Critical Minerals Strategy 201942.
As at December 2019, total Ore Reserves of REO, including yttrium but not scandium and reported in compliance with the JORC Code, amounted to 3.02 Mt (Table 2), an increase of 6.3% over 2018 (2.84 Mt). Ore Reserves accounted for 75% of Australia’s EDR of REO for 2019. Economic Demonstrated Resources of REO were 4.03 Mt at the end of December 2019 (Table 3), down by 2% from 4.12 Mt in 2018 (Table 4). The fall in EDR was due to company reassessment of resource inventories.
Australia also had 40.17 Mt of REO resources considered to be subeconomic at the end of 2019 (Table 3), an increase of 18% from the 33.99 Mt recorded at the end of 2018. Similarly, 26.62 Mt of Inferred Resources of REO in 2019 (Table 3), were 1.8% higher than the 26.15 Mt at the end of 2018. Rare earths deposits and operating mines are shown in Figure 40 on a total resource basis.
On the subject of subeconomic resources, the REO content of heavy mineral sands is seldom publicly reported. However, in 2019, Geoscience Australia identified new information to that indicate REO content of some heavy mineral sands deposits, and which is now included in the 2019 assessment of Paramarginal Demonstrated Resources of REO. Because of this inclusion, Paramarginal REO increased 898% from 0.43 Mt in 2018 to 4.29 Mt in 2019.
World production of rare earths, based on USGS data and modified for Australian production, was estimated to be 0.210 Mt of REO in 2019 (Table 3). Australia was the world’s fourth largest producer, providing 8% of global supply (Table 8). Australian production of REO in 2019 was 0.018 Mt (Table 1) and came predominantly from Lynas Corporation Ltd’s Mount Weld mine in Western Australia.
Concentrates from Mount Weld are processed at the Lynas Advanced Materials Plant in Malaysia to produce REO products. Under a deadline set by Malaysian authorities to cease processing in Malaysia due to the low-level radioactive waste by-product, Lynas is planning to build a processing plant in Kalgoorlie, Western Australia, by mid-2023. Lynas also signed an agreement with the US Department of Defense to build a heavy rare earths separation plant in Texas.
In addition to Mount Weld, 45.66 t of rare earth carbonate were produced and exported to China by Northern Minerals Ltd from its pilot mining and processing operation at the Browns Range project in the Kimberley region of Western Australia.
41 The lanthanide series comprises lanthanum (La), cerium (Ce), praseodymium (Pr), neodymium (Nd), promethium (Pm), samarium (Sm), europium (Eu), gadolinium (Gd), terbium (Tb), dysprosium (Dy), holmium (Ho), erbium (Er), thulium (Tm), ytterbium (Yb) and lutetium (Lu).
42 See above n 7.
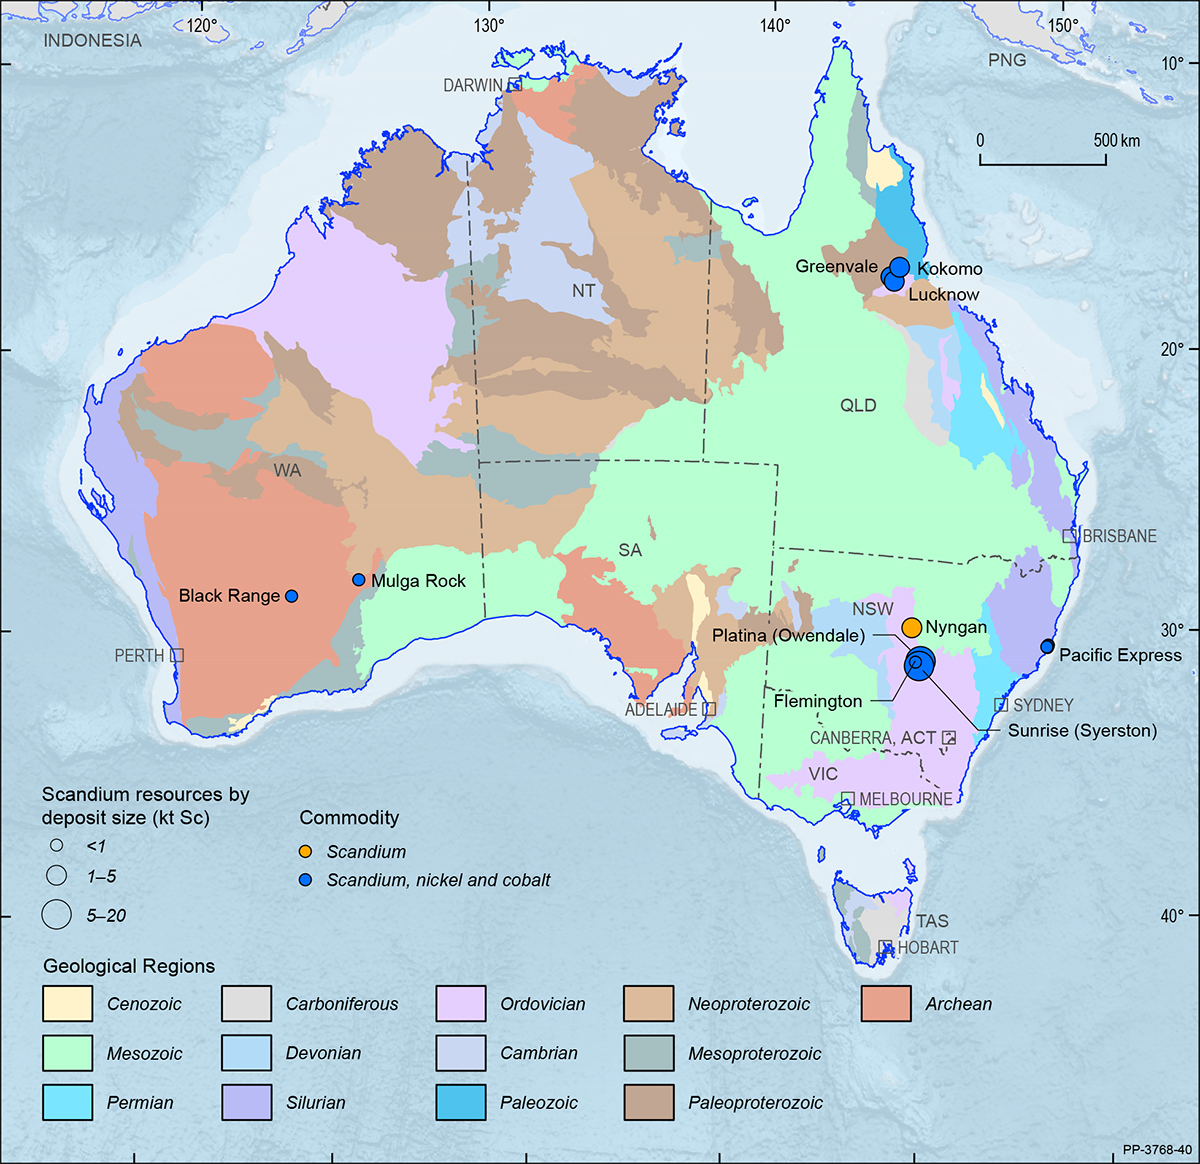
Scandium
Scandium is used in the production of alloys for the aerospace industry. It is also used in solid-oxide fuel cells, in specialised lighting applications, ceramics, lasers, electronics and in aluminium alloys for sporting goods production. Scandium is regarded as a critical mineral by many advanced economies and is listed in Australia’s Critical Minerals Strategy 201943.
Scandium is often grouped with the rare earths and yttrium. While not uncommon in the Earth’s crust (averaging an abundance of around 25 ppm), scandium, like the rare earths, does not often occur in concentrations that can support commercial mining operations.
In Australia, known occurrences of scandium are mostly associated with lateritic nickel-cobalt mineralisation and are independent of rare earth deposits. Australian resources of scandium occur in Queensland, New South Wales and Western Australia but none are currently mined (Figure 41).
As at December 2019, total Ore Reserves of scandium, reported in compliance with the JORC Code, were 12.7 kt (Table 2). Ore Reserves accounted for 47% of Australia’s EDR of scandium and have been reported from six projects. Scandium EDR were 26.91 kt in 2019 (Table 3) and Australia also had an estimated 8.10 kt of subeconomic scandium resources and Inferred Resources of 19.59 kt (Table 3).
43 See above n 7.
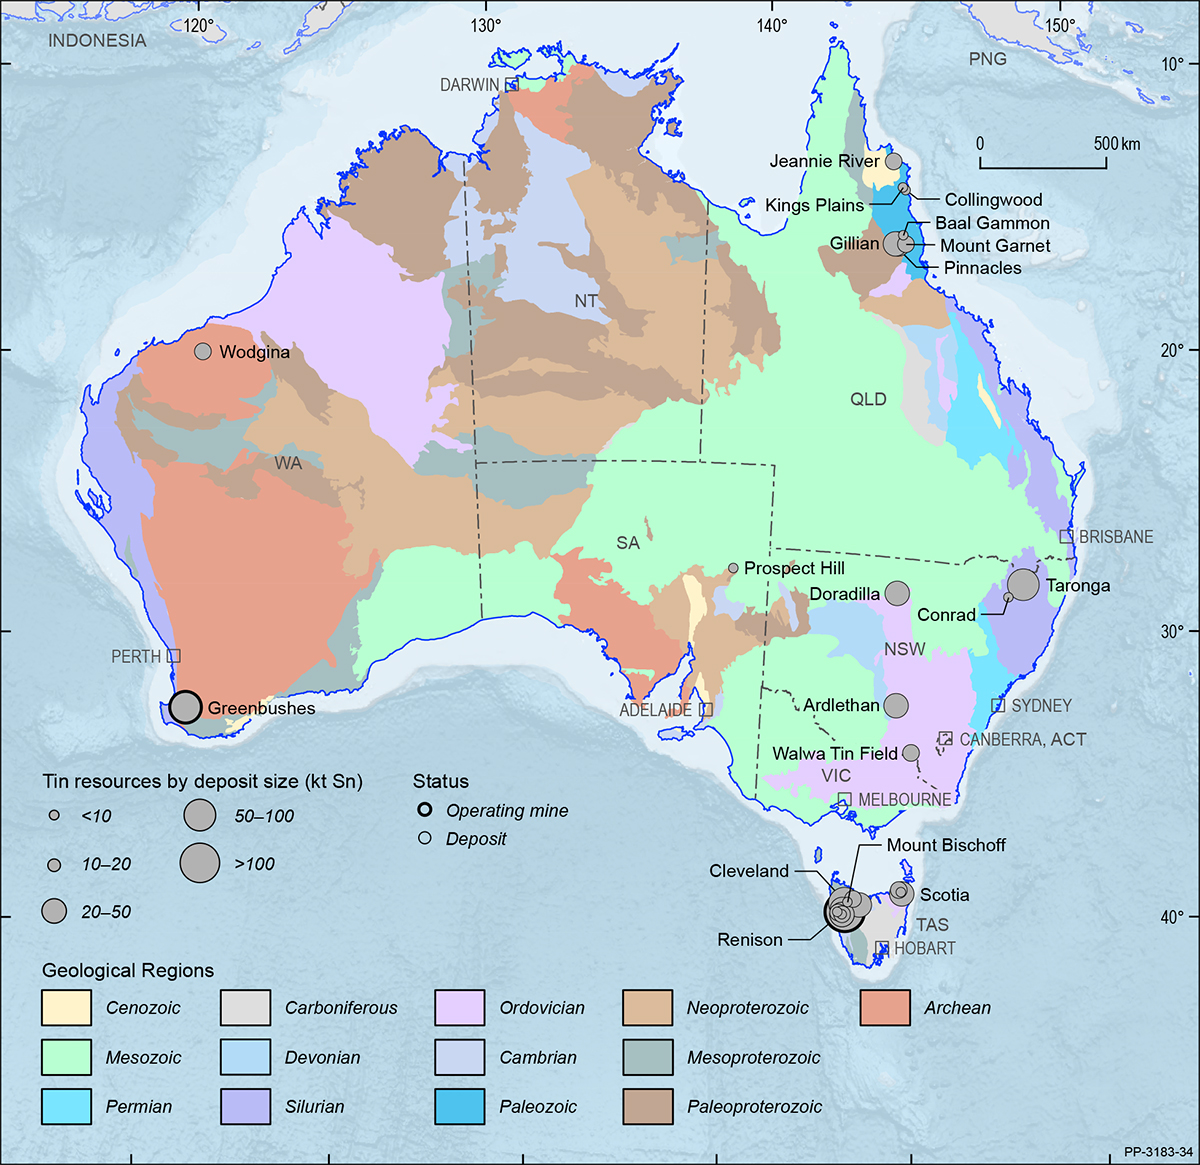
Tin
Australia’s EDR of tin were 561 kt in 2019 (Table 3), up 30% from 430 kt in 2018 (Table 4). The increase reflects growth in EDR at the Renison deposit, Tasmania, which, in 2019, held 62% of Australia’s EDR of tin. Other deposits with significant EDR (>10 kt) include Cleveland, Queen Hill, Severn, St Dizier and Mount Lindsay (all in Tasmania), Taronga (New South Wales), and Gillian and Pinnacles (both in Queensland). In 2019, Australia ranked fourth globally with 11% of the world’s economic resources of tin (Table 8).
Annual production of tin for Australia in 2019 was 7.6 kt (Table 3), up from 6.9 kt in 2018. Nearly all of this production was from the Renison deposit in Tasmania. Australian ranked eighth globally in 2019 with 2% of world production (Table 8).
Australia’s total Ore Reserves of tin in 2019 were 261 kt (Table 2), of which the majority (68%) are within the Renison deposit (Figure 1). Other delineated Ore Reserves are reported at the Taronga, Cleveland and Mount Lindsay deposits (Figure 42). Based on the 2019 Ore Reserves to production ratio, Australian tin has 35 years of reserve life, reducing to 24 years when only operating mines are considered (Table 9).
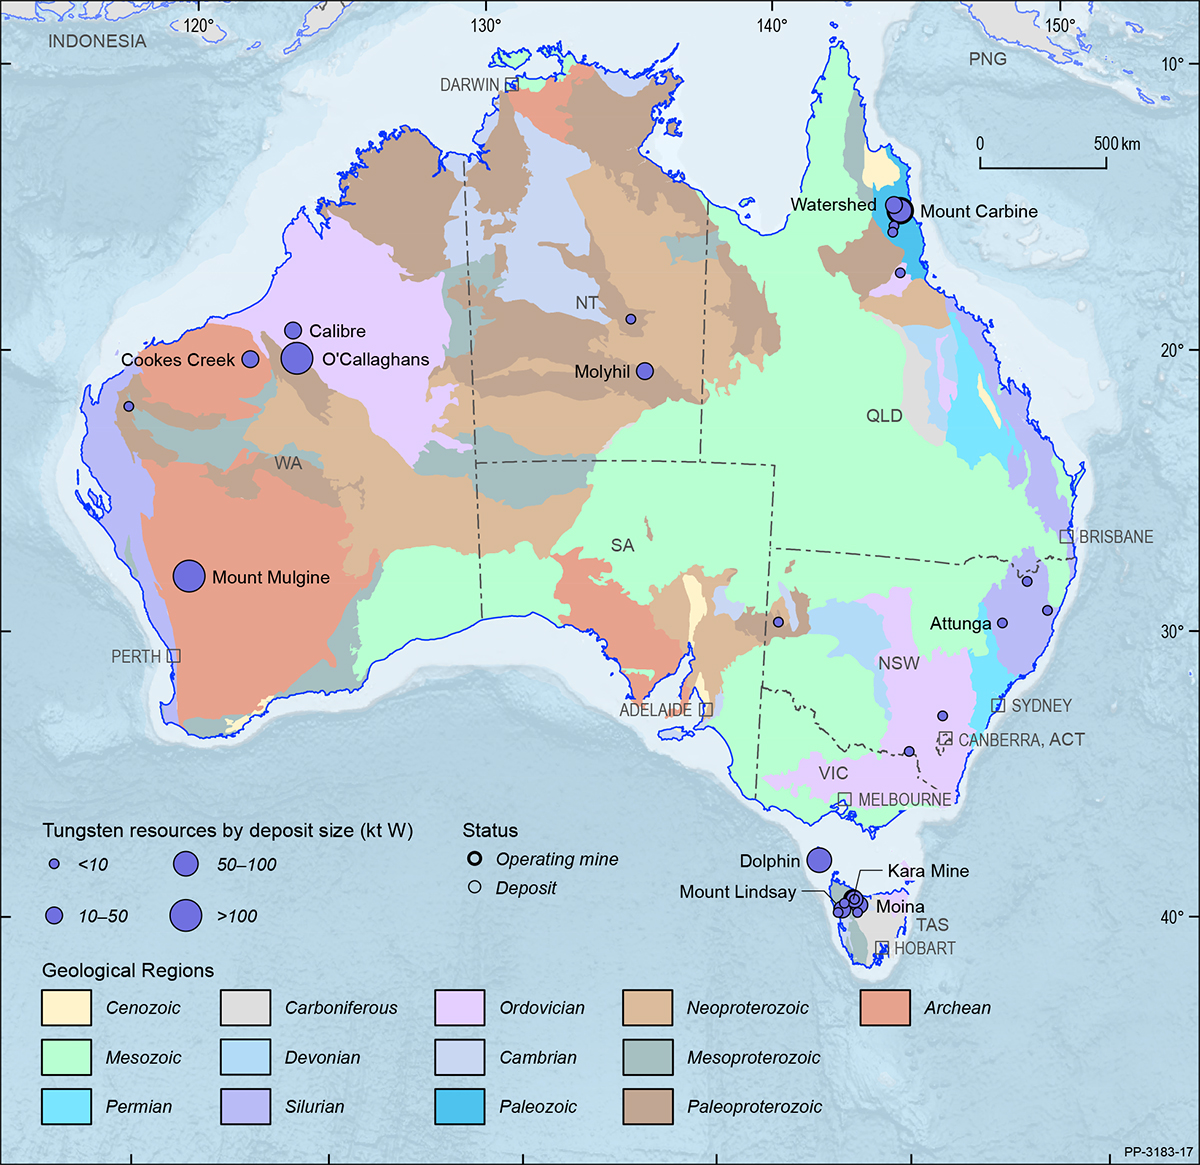
Tungsten
In 2019, the estimate of Australia’s EDR of tungsten increased by 2% to 403 kt (Table 3) from 394 kt in 2018 (Table 4). Western Australia holds 53% of EDR, Tasmania 31% and Queensland 14%. Minor (<5%) EDR occur in the Northern Territory and New South Wales (Figure 43). Australia ranks second in the world with 11% of global world economic resources (Table 8), behind China (50%). Australian production, however, remains minor on the world scale (Table 8), with China responsible for more than 80% of global production. Tungsten is regarded as a critical mineral by many advanced economies and is listed in Australia’s Critical Minerals Strategy 201944.
As at December 2019, total Ore Reserves of tungsten reported in compliance with the JORC Code amounted to 215 kt (Table 2) of which 23 kt was attributable to Australia’s two operating tungsten mines—Kara and Mount Carbine. In 2019, Ore Reserves had a small decrease of 1 kt to 215 kt from 216 kt in 2018 whilst production increased and, therefore, reserve life decreased. The large reserve life of more than 1,000 years (Table 2) is attributable to the relatively small production rate.
The Kara mine in Tasmania continued operations during 2019; it produced scheelite (calcium tungstate) concentrates as a by-product of magnetite processing. In December 2019, Mount Carbine in Queensland commenced tailings retreatment with planning for stockpile processing and open-cut mining ongoing.
Other significant industry activity in 2019 included:
- Thor Mining PLC continued discussions with potential financiers and offtake partners for the Molyhil Tungsten and Molybdenum Project (Northern Territory), and by 2020 the project was awarded major project status by the Northern Territory government.
- Venture Minerals Ltd identified an additional tin-tungsten target in proximity to the Mount Lindsay Project (Tasmania).
- Vital Metals Ltd reported updated Ore Reserves and Resources for Watershed (Queensland).
- In December 2019, Tungsten Mining NL reported a significant increase to the Inferred tungsten-molybdenum resource, and a maiden resource for gold and silver, at the Mulgine Trench deposit (Western Australia).
- At the Dolphin Project (Tasmania), King Island Scheelite Ltd entered into an offtake agreement for tungsten concentrate with Austrian-based Wolfram Bergbau und Hutton AG. During 2020, the company secured an additional offtake agreement with Asian-based Kalon Resources Ltd.
44 See above n 7.
Uranium
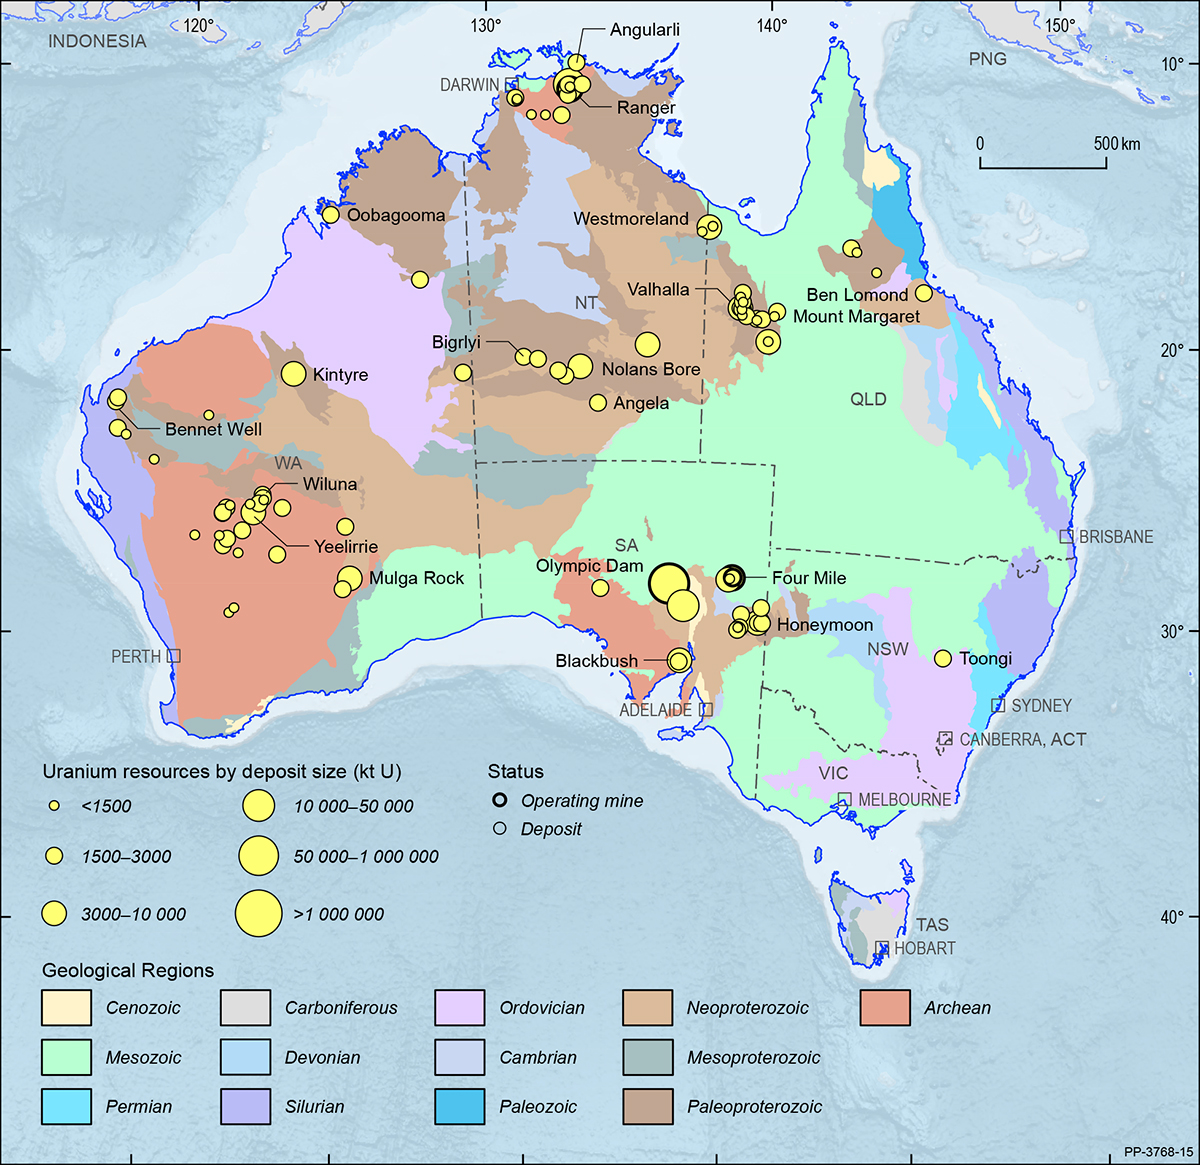
Australia has the world’s largest known resources of uranium, accounting for approximately 31% of the global inventory, and is the world’s third largest uranium producer (12%; Table 8) after Kazakhstan (41%) and Canada (13%). As at December 2019, Australia had uranium EDR of 1,147 kt (Table 3). This is equivalent to the Organisation for Economic Co-operation and Development, Nuclear Energy Agency and the International Atomic Energy Agency (OECD-NEA/IAEA) category of Reasonably Assured Resources (RAR) of uranium recoverable at costs of less than US$130/kg U (RAR <$130/kg U).
Ore Reserves of uranium in 2019 totalled 284 kt (Table 2), which was an approximately 4% decrease from 2018 (296 kt). Additionally, Australia has an estimated 722 kt of Inferred Resources of uranium and another 83 kt regarded as subeconomic (Table 3). Uranium deposits and operating mines are shown in Figure 44 on a total resource basis.
Australia’s uranium production in 2019 amounted to 6.613 kt (7.798 kt U3O8) and came from three operating mines—Olympic Dam and Four Mile in South Australia and Ranger in the Northern Territory (Table 1). This was a 13% increase on the previous year (5.872 kt). Uranium production is expected to decrease in the near future, however, as mining activities at the Ranger mine will cease in January 2021. In 2019, Australia exported 6.919 kt of uranium (8.159 kt U3O8) valued at $747 million (Table 11).
Australia’s uranium exploration expenditure has been in decline since the crash of the uranium price following the 2011 Fukushima Daiichi nuclear accident. Additionally, bans and uncertainties concerning uranium mining in some states has also have Australia’s ability to attract uranium exploration investment. Exploration investment in 2019 was $10.2 million, a fall of 17% compared with the previous year and the lowest it has been since 2003.
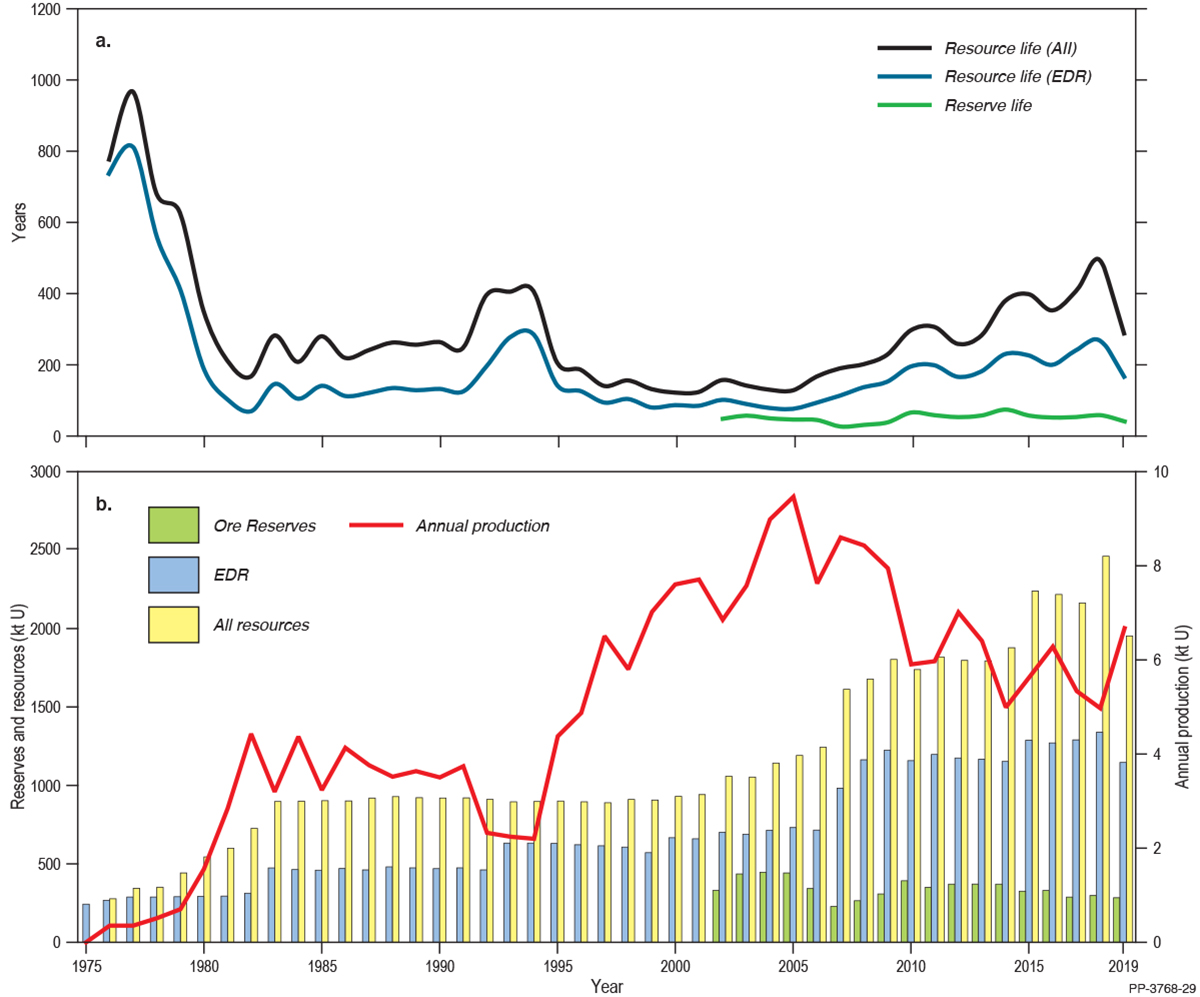
Resource life is a snapshot in time derived by taking a reserve or resource number and dividing it by a production number. After the flurry of discoveries in the 1970s, resource life (based on EDR) for uranium was more than 800 years in 1977 but this declined rapidly to around 100 years after uranium production increased in the 1980s (Figure 45). Resource life again ticked up in the early 1990s when the Kintyre and Olympic Dam resources were further delineated, and then decreased when production again rapidly increased from 1995. Since the turn of this century, resource life has again been increasing owing to a gradual increase in resources and a concurrent decline in production (Figure 45).
Following the closure of the Ranger uranium mine in January 2021, Australia will have two operating uranium production centres, Olympic Dam and Four Mile, both located in South Australia. Furthermore, because uranium at Olympic Dam is extracted as a by-product of copper mining (with gold and silver also recovered), Four Mile will stand as Australia’s only dedicated uranium mine. Five other deposits, which have received environmental approval are awaiting better market conditions before proceeding with development. These are Honeymoon in South Australia (Boss Resources Ltd), and Kintyre (Cameco Australia Pty Ltd), Wiluna (Toro Energy Ltd) and Mulga Rock (Vimy Resources Ltd), all in Western Australia.
Australia currently has no plans for a domestic nuclear power industry. However, interest in the industry at the state level led to the South Australian Nuclear Fuel Cycle Royal Commission in 2015 and, more recently, the New South Wales Uranium Mining and Nuclear Facilities (Prohibitions) repeal Bill 2019 and the Victorian Inquiry into Nuclear Energy Prohibition (2020). Additionally, at the Federal level, an Inquiry into the Prerequisites for Nuclear Energy in Australia by the House of Representatives Standing Committee on the Environment and Energy was undertaken 2019.
Vanadium
Vanadium is a soft, ductile, silver-grey metal that is used primarily with iron to make metal alloys for high-strength steel production. High-strength steel has a wide range of applications, including for gas and oil pipelines, tool steel, jet engines, the manufacture of axles and crankshafts for motor vehicles, as well as for reinforcing bars in building and construction.
Vanadium is also used in the production of ceramics and electronics, textile dyes, fertilisers, synthetic rubber, in welding, as well as in alloys used in nuclear engineering and superconductors. Vanadium chemicals and catalysts are used in the manufacture of sulphuric acid, the desulphurisation of sour gas and oil, and in the development of fuel cells and low-charge-time lightweight batteries.
Increased steel production in China meant that demand for vanadium remained strong in 2019. Vanadium is regarded as a critical mineral by many advanced economies and is listed in Australia’s Critical Minerals Strategy 201945.
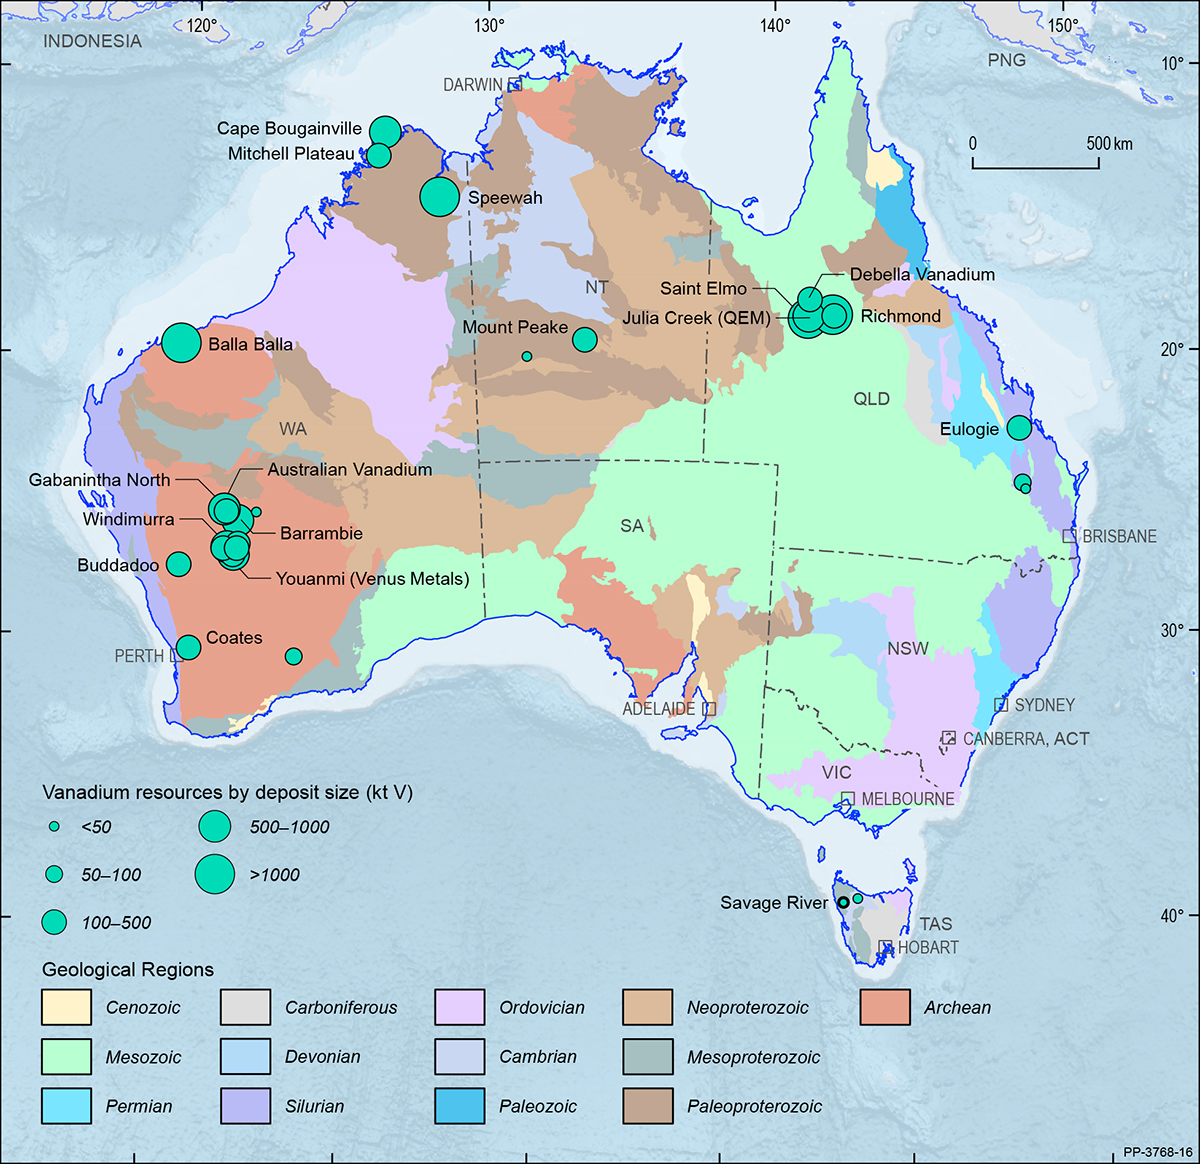
In Australia, there has been sustained momentum for developing vanadium projects, resulting in a 30% rise of vanadium EDR from 4,646 kt in 2018 to 6,019 kt in 2019 (Table 4). Vanadium EDR in Australia are mostly located in Western Australia at the developing deposits of Australian Vanadium, Balla Balla, Speewah, Barrambie and Gabanintha North, shown in Figure 46 on a total resource basis. Corresponding to the EDR, total Ore Reserves of vanadium reported in compliance with the JORC Code have also increased by 31% from 1,182 kt in 2018 to 1,554 kt in 2019 (Table 2). The Inferred Resource has also increased by 27% to 22,838 kt (Table 3), up from 18,013 kt in 2018.
In 2019, with 6,019 kt, Australia had the world’s second largest economic resources of vanadium (25%; Table 8), behind China with 9,500 kt (39%), and ahead of Russia (5,000 kt; 21%) and South Africa (3,500 kt; 14%). China also led the global production of vanadium in 2019, producing 40 kt (54%) of the 73 kt total (Table 3), followed by Russia (18 kt; 25%) and South Africa (8 kt; 12%). Australia does not have any operating vanadium mines.
45 See above n 7.
Banner image: Electronic devices contain a wide range of mineral commodities, including precious metals and rare earth elements.