Australia’s Identified Mineral Resources
The National Classification System for Identified Mineral Resources has been used by the Australian Government since 1975 for classifying mineral resources for regional and national assessments. It provides a long-term view on what is likely to be available for mining.
The National Classification System uses two general criteria for classifying Australia’s national inventory of mineral resources:
- the geological certainty of the existence of the mineral resource, and
- the economic feasibility of its extraction over the long term.
The National Classification System (See Appendix 2) uses reports on mineral resources published by companies using the JORC Code (or equivalent foreign codes) and, to a lesser extent, confidential information, to compile national totals for the resource classification categories set out in Table 3. Both the National Classification System and the JORC Code are based on the McKelvey resource classification system used by the USGS. Thus Australia’s national system is compatible with the JORC Code and remains comparable to the USGS system, as published in the annual USGS Mineral Commodity Summaries.
Economic Demonstrated Resources (EDR) is the category used for the national totals of economic resources and provides a basis for meaningful comparisons of Australia’s economic resources with those of other nations. Section 7 provides a snapshot of key facts and figures for the 36 mineral commodities covered in AIMR 2022, including EDR, Ore Reserves, production, rises and falls and world rankings.
Estimating the total amount of each mineral commodity likely to be available for mining over the long term (EDR) is not a precise science. The long-term perspectives presented herein take account of the following:
- Ore Reserves reported in accordance with the JORC Code (or equivalent foreign codes) will all be mined, but they only provide a short-term view on what is likely to be available for mining.
- Most current Measured and Indicated Resources reported in accordance with the JORC Code are also likely to be mined.
- Some current Inferred Resources will be transferred to Measured and Indicated Resources and Ore Reserves.
- New discoveries will add to the resource inventory.
In addition, some resources that, all being equal, would normally be considered EDR are not accessible because of environmental, legal or military land-use restrictions. Thus Table 3 also lists Accessible Economic Demonstrated Resources (AEDR). Of the 36 mineral commodities assessed in this publication, only black coal, brown coal, gold, mineral sands, platinum group elements and uranium have EDR that is considered inaccessible.
Over time, all of Australia’s current EDR of gold, silver, tin, zinc or any number of other commodities will be mined. At first glance, this statement might seem somewhat paradoxical because not every deposit that contributes to the national EDR will have all of that individual EDR brought into production. Indeed, some deposits currently contributing to EDR will never produce any metal. However, the National Classification System is not designed to be used for individual mine assessments. Instead, it is a way of estimating regional and national totals. So, from an aggregated point of view, it is a reasonable proposition that, eventually, all of the current EDR (and more) will be mined. Twenty years ago, gold for example, had an EDR of 5,156 t; since 2001, Australian mines have produced 5,721 t of gold.
Australia is yet to run out of EDR because, to use JORC Code terminology, as individual Ore Reserves are depleted, Measured and Indicated Resources are reassessed into Proved and Probable categories, Inferred Resources are worked on to bring them to Measured and Indicated status and new drilling at existing mines as well as new greenfield discoveries add to the resource inventory. In addition, extractive technologies improve over time and if a commodity becomes rare then the laws of supply and demand result in previously subeconomic deposits becoming profitable. Thus EDR fundamentally differs from Ore Reserves under the JORC Code because it is not meant to provide a picture of what is currently commercial to mine but rather an outlook on what is likely to be available for mining over the long term, i.e., of opportunity for supply at regional and national scales.
Table 3. Australia's Identified Mineral Resources as at December 2021.
| Commodity | Unit | Australia | World | ||||||
|---|---|---|---|---|---|---|---|---|---|
| Demonstrated Resources | Inferred Resources2 | Accessible EDR3 | Mine Production4 | Economic Resources5 | Mine Production6 | ||||
| Economic (EDR)1 | Subeconomic | ||||||||
| Paramarginal | Submarginal | ||||||||
| Antimony | kt Sb | 136.5 | 8.8 | 0 | 49.5 | 136.5 | 3.47 | 2,000 | 109 |
| Bauxite | Mt | 3,565 | 0 | 1,429 | 3,206 | 3,565 | 103.3 | 30,285 | 383 |
| Black Coal | |||||||||
| In situ | Mt | 89,012 | 2,475 | 4,638 | 104,208 | ||||
| Recoverable | Mt | 75,433 | 1,907 | 3,362 | 81,577 | 74,775 | 5548 | 756,2069 | 6,75410 |
| Brown Coal | |||||||||
| In situ | Mt | 81,234 | 45,696 | 239,225 | 122,509 | ||||
| Recoverable | Mt | 74,039 | 42,082 | 215,303 | 105,228 | 72,453 | 42.311 | 320,63612 | 96613 |
| Chromium | kt Cr | 0 | 302 | 0 | 6,584 | 0 | 0 | 569,62014 | 41,40014 |
| Cobalt | kt Co | 1,582 | 244 | 8 | 1,189 | 1,582 | 5.315 | 7,800 | 165 |
| Copper | Mt Cu | 100.07 | 1.51 | 0.25 | 44.25 | 100.07 | 0.82 | 883 | 20.9 |
| Diamond | Mc | 1.28 | 0 | 0 | 20.30 | 1.28 | 016 | 1,79117 | 37 |
| Fluorine | kt F | 343 | 721 | 6 | 2,543 | 343 | 0 | 153,000 | 4,17518 |
| Gold | t Au | 11,980 | 155 | 36 | 6,177 | 11,953 | 307 | 55,080 | 3,007 |
| Graphite | Mt | 7.97 | 0.10 | 0 | 7.42 | 7.97 | 0 | 333 | 1.0 |
| High-Purity Alumina | Mt Al2O3 | 16.72 | 0 | 0 | 33.26 | 16.72 | 0 | n.a. | n.a. |
| Iron | |||||||||
| Iron ore | Mt | 56,646 | 5,469 | 1,280 | 91,782 | 56,646 | 922 | 184,876 | 2,570 |
| Contained iron | Mt Fe | 26,497 | 1,776 | 426 | 41,424 | 26,497 | 571 | 86,105 | 1,587 |
| Lead | Mt Pb | 35.95 | 1.31 | 0.14 | 24.34 | 35.95 | 0.49 | 88.91 | 4.3 |
| Lithium | kt Li | 6,700 | 0 | <1 | 2,144 | 6,700 | 5519 | 23,400 | 105 |
| Magnesite | Mt MgCO3 | 286 | 75 | 35 | 999 | 286 | 0.920 | 7,265 | 3021 |
| Manganese Ore | Mt | 277 | 3 | 190 | 400 | 277 | 4.922 | 1,33823 | 19.523 |
| Mineral Sands | |||||||||
| Ilmenite | Mt | 273.8 | 16.3 | 10.9 | 262.9 | 263.9 | 0.624 | 1,163.7 | 14.4 |
| Rutile | Mt | 33.8 | 0.1 | 3.1 | 35.9 | 31.2 | 0.224 | 49.6 | 0.6 |
| Zircon | Mt | 78.6 | 0.3 | 4.7 | 64.3 | 76 | 0.524 | 105.5 | 1.6 |
| Molybdenum | kt Mo | 482 | 366 | <1 | 1,193 | 482 | 0 | 20,421 | 297 |
| Nickel | Mt Ni | 21.7 | 2.3 | <1 | 19.5 | 21.7 | 0.15 | 96 | 2.7 |
| Niobium | kt Nb | 216 | 15 | 0 | 397 | 216 | n.a.25 | >17,000 | 75 |
| PGE | t metal | 247.7 | 115.0 | 0 | 316.5 | 245.1 | 0.47026 | 70,158 | 38027 |
| Phosphate | |||||||||
| Phosphate rock28 | Mt | 1,080 | 498 | 0 | 2,364 | 1,080 | >0.429 | 71,000 | 217 |
| Contained P2O5 | Mt P2O5 | 178 | 91 | 0 | 388 | 178 | n.a. | n.a. | n.a. |
| Potash | |||||||||
| Recoverable | Mt K2O | 44.2 | 1.6 | 0 | 153.1 | 44.2 | <0.130 | >3,500 | 46,000 |
| In situ | Mt K2O | 44.2 | 290.4 | 0 | 1,111.3 | 44.2 | n.a | 250,000 | n.a. |
| Rare Earths31 | Mt oxide | 4.26 | 4.07 | 35.12 | 24.49 | 4.26 | 0.02332 | 125 | 0.24 |
| Scandium | kt Sc | 36.65 | 0.75 | 0 | 14.60 | 36.65 | 0 | n.a. | n.a. |
| Silver | kt Ag | 94.27 | 1.68 | 0.48 | 43.62 | 94.27 | 1.33 | 535 | 23.9 |
| Tantalum | kt Ta | 104.4 | 1.4 | 0.2 | 37.2 | 104.4 | 0.133 | >140 | 2.1 |
| Thorium | kt Th | 0 | 0 | 604 | 776 | 0 | 0 | n.a. | n.a. |
| Tin | kt Sn | 585 | 61 | 32 | 294 | 585 | 8.8 | 4,900 | 303 |
| Tungsten | kt W | 570 | 0 | 5 | 215 | 570 | <134 | 3,700 | 79 |
| Uranium | kt U | 1,227 | 52 | 29 | 623 | 1,224 | 3.79835 | 3,81536 | 47.337 |
| Vanadium | kt V | 8,110 | 121 | 1,376 | 17,319 | 8,110 | 0 | 26,300 | 110 |
| Zinc | Mt Zn | 66.25 | 0.43 | 0.75 | 47.19 | 66.25 | 1.32 | 248 | 13 |
Abbreviations
t = tonne; kt = kilotonnes (1,000 t); Mt = million tonnes (1,000,000 t); Mc = million carats (1,000,000 carats); n.a. = not available; PGE = platinum group elements (platinum, palladium, osmium, iridium, ruthenium, rhodium).
Where an element symbol follows the unit it refers to contained metal content.
Notes
- Economic Demonstrated Resources (EDR) predominantly comprise Ore Reserves and most Measured and Indicated Mineral Resources that have been reported in accordance with the Joint Ore Reserves Committee (JORC) Code to the Australian Securities Exchange (ASX). In addition, some reserves and resources have been reported using other reporting codes to foreign stock exchanges and Geoscience Australia may hold confidential data for some commodities.
- Total Inferred Resources in economic, subeconomic and undifferentiated categories.
- Accessible Economic Demonstrated Resources (AEDR) is the portion of total EDR that is accessible for mining. AEDR does not include resources that are inaccessible for mining because of environmental restrictions, government policies or military lands.
- Australian mine production from Resources and Energy Quarterly, September 2022 published by the Office of the Chief Economist, Department of Industry, Science and Resources unless otherwise stated. Production data often have a higher level of certainty than reserve and resource estimates and, thus, may be presented with more significant figures.
- World economic resources from Mineral Commodity Summaries 2022 published by the USGS and adjusted with Geoscience Australia data, unless otherwise stated.
- World production from Mineral Commodity Summaries 2022 published by the USGS and adjusted with Geoscience Australia data, unless otherwise stated.
- Australian antimony production from company reports (Mandalay Resources Ltd).
- Australian black coal production refers to raw coal.
- World economic resources of black coal from the Federal Institute for Geosciences and Natural Resources, Germany (Energy Study 2021).
- World mine production of black coal from the Federal Institute for Geosciences and Natural Resources, Germany (Energy Study 2021).
- Australian production of brown coal is sourced from the Victorian State Government, Earth Resources Regulation, Annual Statistical Report FY 2020-21.
- World economic resources of brown coal from the Federal Institute for Geosciences and Natural Resources, Germany (Energy Study 2021).
- World mine production of brown coal from the Federal Institute for Geosciences and Natural Resources, Germany (Energy Study 2021).
- World economic resources and mine production are presented as chromite ore.
- Australian cobalt production data from Department of Mines, Industry Regulation and Safety, Western Australian Government, 2021 Major commodities resources file.
- Australian diamond production from Office of the Chief Economist (Resources and Energy Quarterly September 2022).
- World resource figures are for industrial diamonds only, no data provided for resources of gem diamonds.
- World mine production of fluorine excludes the USA.
- Australian lithium production data (tonnes of spodumene concentrates) from Department of Mines, Industry Regulation and Safety Western Australian Government, 2021 Major commodities resources file. Production of lithium calculated assuming 6% Li2O in spodumene concentrates.
- The Department for Energy and Mining, South Australia (Report Book 2022/00002) reported magnesite production of 5,149 t in 2021. The Queensland Department of Natural Resources and Mines (Queensland Annual Mineral Summary 2020-21) reported magnesite production of 888,474 t in 2020-21.
- World mine production excludes the USA.
- Australian manganese production from Department of Mines, Industry Regulation and Safety, Western Australian Government (2021 Major commodities resources file) and company reports (OM Holdings Limited, South 32 Limited).
- World economic resources and mine production of manganese are published by the United States Geological Survey as manganese content, not manganese ore.
- Australian mineral sands production data based on estimates from New South Wales Government Department of Regional NSW (pers. comm.), Department of Mines, Industry Regulation and Safety Western Australian Government (2021 Major commodities resources file), South Australia Department for Energy (Mining Report Book 2022/00002), Northern Territory Department of Industry Tourism and Trade (2021 Territory Mining Production) and Queensland Department of Natural Resources and Mines (Queensland Annual Minerals Summary 2020-21).
- There are no mines producing niobium as a primary product in Australia. However, it is likely produced as a by-product at some lithium/tantalum operations, but these data have not been reported.
- Australian platinum and palladium production data from Department of Mines, Industry Regulation and Safety, Western Australian Government, 2021 Major commodities resources file.
- World mine production is platinum and palladium only.
- Phosphate rock is reported as being economic at grades ranging from 8.7% to 30.2% P2O5.
- Geoscience Australia estimate based on reported mining production from Christmas Island—435,737 t in 2021, South Australia—694 t in 2021 (South Australia Department for Energy and Mining Report Book 2022/00002) and Queensland—24 t in 2020–21 (Queensland Department of Natural Resources and Mines, Queensland Annual Mineral Summary 2020–21).
- Australian potash production from company reports (Kalium Lakes Ltd).
- Rare earths comprise rare earth oxides (REO) and yttrium oxide (Y2O3).
- Rare earths production is based on Western Australian production of concentrates from Mount Weld (15,616 t) and from 58,000 t of zircon - monazite concentrate produced at Eneabba, assuming 20% of concentrate is monazite and 60% of monazite is REO (6,960 t).
- Australian tantalum production data from Department of Mines, Industry Regulation and Safety, Western Australian Government, 2021 Major commodities resources file. Production represents a maximum as no correction has been made for actual tantalite concentration in reported concentrates.
- Tungsten production from company correspondence (Tasmania Mines Pty Ltd) and company reports (EQ Resources Ltd).
- Australian uranium production from company reports (BHP Ltd, Energy Resources Australia Ltd, Heathgate Resources Pty Ltd).
- World economic resources from the International Atomic Energy Agency estimate for Reasonably Assured Resources recoverable at costs of less than US$130/kg, personal communication, October 2022.
- World production of uranium in 2021 from World Nuclear Organisation (Uranium Production, Figures, 2012-2021, July 2022 update).
Trends in EDR
Australia’s EDR of the following mineral commodities increased significantly (up 5% or more) during 2021: antimony, cobalt, gold, iron ore, lithium, molybdenum, platinum group elements, scandium, tantalum, and vanadium (Table 4). Only the EDR of bauxite and diamond decreased significantly (down 5% or more) in 2021. All other mineral EDR stayed within 5% of the previous year’s estimates (Table 4).Australia’s EDR of a range of mineral commodities have undergone significant and sometimes dramatic changes since Geoscience Australia, and predecessor organisations, began keeping systematic records more than 40 years ago. These changes can be attributed to one, or a combination, of the following factors:
- Increases in resources resulting from discoveries of new deposits and delineation of extensions at known deposits.
- Depletion of resources as a result of mine production.
- Advances in mining and metallurgical technologies, e.g., carbon-based processing technologies for gold have enabled economic extraction from low-grade deposits that were previously uneconomic.
- Adoption of the JORC Code for resource classification and reporting by the Australian minerals industry and the subsequent impacts on re-estimation of Ore Reserves and Mineral Resources to comply with the requirements of the JORC Code. The impacts of the JORC Code on EDR occurred at differing times for each of the major commodities.
- Significant changes in the prices of mineral commodities driven largely by global trends, such as escalating and cooling demand from China over the last two decades and, more recently, growing demand for battery minerals.
Table 4. Changes in Australia's Economic Demonstrated Resources (EDR) and production from 2020 to 2021.
| Commodity | Unit | EDR | Production | ||||
|---|---|---|---|---|---|---|---|
| 2020 | 2021 | Change (%) | 2020 | 2021 | Change (%) | ||
| Antimony | kt Sb | 125.2 | 136.5 | 9% | 3.9 | 3.4 | -13% |
| Bauxite | Mt | 5,132 | 3,565 | -31% | 103.6 | 103.3 | 0% |
| Black Coal – Recoverable | Mt | 74,147 | 75,433 | 2% | 542 | 554 | 2% |
| Brown Coal – Recoverable | Mt | 74,039 | 74,039 | 0% | 41.5 | 42.3 | 2% |
| Chromium | kt Cr | 0 | 0 | 0% | 0 | 0 | 0% |
| Cobalt | kt Co | 1,495 | 1,582 | 6% | 5.6 | 5.3 | -5% |
| Copper | Mt Cu | 96.65 | 100.07 | 4% | 0.88 | 0.82 | -6% |
| Diamond | Mc | 10.97 | 1.28 | -88% | 9.98 | 0 | -100% |
| Fluorine | kt F | 343 | 343 | 0% | 0 | 0 | 0% |
| Gold | t Au | 11,101 | 11,980 | 8% | 328 | 307 | -6% |
| Graphite | Mt | 7.97 | 7.97 | 0% | 0 | 0 | 0% |
| High-Purity Alumina | Mt Al2O3 | n.a | 16.72 | n.a | n.a | 0 | n.a |
| Iron | |||||||
| Iron ore | Mt | 51,709 | 56,646 | 10% | 922 | 922 | 0% |
| Contained iron | Mt Fe | 27,553 | 26,497 | -4% | 571 | 571 | 0% |
| Lead | Mt Pb | 35.73 | 35.95 | 1% | 0.49 | 0.49 | 0% |
| Lithium | kt Li | 6,174 | 6,700 | 9% | 40 | 55 | 38% |
| Magnesite | Mt MgCO3 | 286 | 286 | 0% | 0.8 | 0.9 | 12% |
| Manganese Ore | Mt | 276 | 277 | 0% | 4.8 | 4.9 | 2% |
| Mineral Sands | |||||||
| Ilmenite | Mt | 274.0 | 273.8 | 0% | 1.1 | 0.6 | -45% |
| Rutile | Mt | 35.3 | 33.8 | -4% | 0.2 | 0.2 | 0% |
| Zircon | Mt | 79.3 | 78.6 | -1% | 0.4 | 0.5 | 25% |
| Molybdenum | kt Mo | 403 | 482 | 20% | 0 | 0 | 0% |
| Nickel | Mt Ni | 21.4 | 21.7 | 1% | 0.17 | 0.15 | -12% |
| Niobium | kt Nb | 216 | 216 | 0% | n.a | n.a | 0% |
| PGE | t metal | 107.0 | 247.7 | 131% | 0.522 | 0.470 | -10% |
| Phosphate | |||||||
| Phosphate rock | Mt | 1,081 | 1,080 | 0% | 1.3 | >0.4 | n.a. |
| Contained phosphate | Mt P2O5 | 178 | 178 | 0% | n.a | n.a | n.a. |
| Potash | Mt K2O | 42.5 | 44.2 | 4% | 0 | <0.1 | n.a. |
| Rare Earths1 | Mt oxide | 4.20 | 4.26 | 1% | 0.020 | 0.023 | 15% |
| Scandium | kt Sc | 30.34 | 36.65 | 21% | 0 | 0 | 0% |
| Silver | kt Ag | 92.50 | 94.27 | 2% | 1.34 | 1.33 | -1% |
| Tantalum | kt Ta | 99.4 | 104.4 | 5% | 0.1 | 0.1 | 0% |
| Thorium | kt Th | 0 | 0 | 0% | 0 | 0 | 0% |
| Tin | kt Sn | 574 | 585 | 2% | 8.1 | 8.8 | 9% |
| Tungsten | kt W | 577 | 570 | -1% | <1 | <1 | 0% |
| Uranium | kt U | 1,239 | 1,227 | -1% | 6.195 | 3.798 | -38% |
| Vanadium | kt V | 7,408 | 8,110 | 10% | 0 | 0 | 0% |
| Zinc | Mt Zn | 66.41 | 66.25 | 0% | 1.31 | 1.32 | 0% |
Abbreviations
t = tonne; kt = kilotonnes (1,000 t); Mt = million tonnes (1,000,000 t); Mc = million carats (1,000,000 carats); n.a. = not available; PGE = platinum group elements (platinum, palladium, osmium, iridium, ruthenium, rhodium).
Where an element symbol follows the unit it refers to contained metal content.
Notes
- Rare earths comprise rare earth oxides (REO) and yttrium oxide (Y2O3).
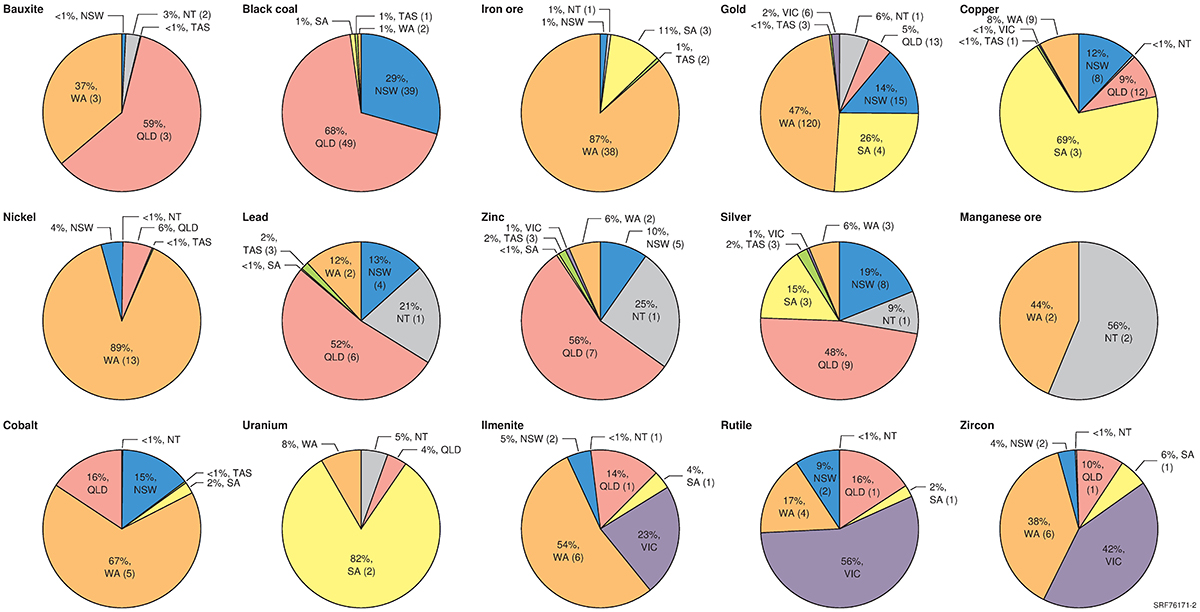
Geographical distribution of EDR
Most bauxite EDR are attributable to Queensland and Western Australia (Figure 2) where the giant deposits in Cape York and the Darling Range, respectively, dominate.Similarly, Australia’s enormous iron ore EDR are geographically concentrated in the Pilbara region of Western Australia. Western Australia also hosts the majority of the nation’s nickel EDR as well as significant amounts of manganese ore, with the majority of manganese EDR in the Northern Territory. On the other side of the country, almost all black coal EDR are located in Queensland and New South Wales (Figure 2). Cobalt EDR occurs in most Australian jurisdictions as it is associated with both the Western Australian nickel deposits and with many copper deposits. Copper, along with gold, silver, lead, zinc, uranium and mineral sands are dispersed across the country (Figure 2).