News
Water Observations from Space contribute to a greater understanding of flooding in Australia
Published:26 April 2016
Norman Mueller
Geoscience Australia contributes to a greater understanding of natural hazard and disaster exposure through observations of water from space. This supports Australia's capability to reduce the economic, social and environmental impacts of flood events.
First released in 2014, Geoscience Australia's Water Observations from Space (WOfS) product provides historical information about where surface water is found in Australia.
WOfS is the world's first continent-scale map of the presence of surface water derived from Landsat satellite imagery. It covers the entire Australian continent, showing the presence of water over a 27year period. By using Landsat data, WOfS is useful at `paddock scale', providing a quantitative indication of how often surface water has been seen anywhere in Australia.
Available online in map form through the Australian Flood Risk Information Portal, WOfS provides information on where water is usually seen, such as in lakes and rivers, and where it is unusual, such as during flooding events.
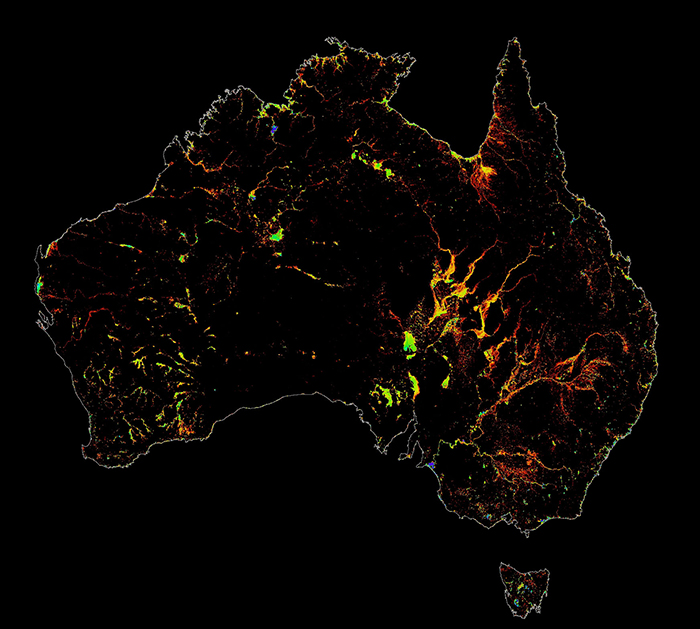
WOfS Australian coverage, showing the summary of how often water has been observed by Landsat satellites since 1987
Historical challenge - floods in Australia
With many areas having high vulnerability to flooding, Australia's management of this hazard is a key challenge for communities, governments, insurers, and industries. In financial terms, floods are one of the most damaging forms of natural hazard faced by Australia.
To increase the quality, availability and accessibility of flood information across Australia, the National Flood Risk Information Project (NFRIP) was commissioned by the Australian Government in 2011. A key component of NFRIP was the development of a water observations product to provide a consistent nation-wide assessment of where surface water has been observed over previous decades.
Historically, flood studies commissioned to understand exposure to floods have focused on populated areas, which are primarily located around Australia's coast. This is unsurprising, as these areas have the greatest potential to cause the highest damage in the shortest period of time. However, this left a significant information gap in understanding flood hazard, and surface water behaviour more generally, in Australia's extensive inland areas.
WOfS is playing a key role in filling this gap; complementing flood studies by providing a historical summary of how frequently surface water has been observed over the entire Australian continent between 1987 and present day.
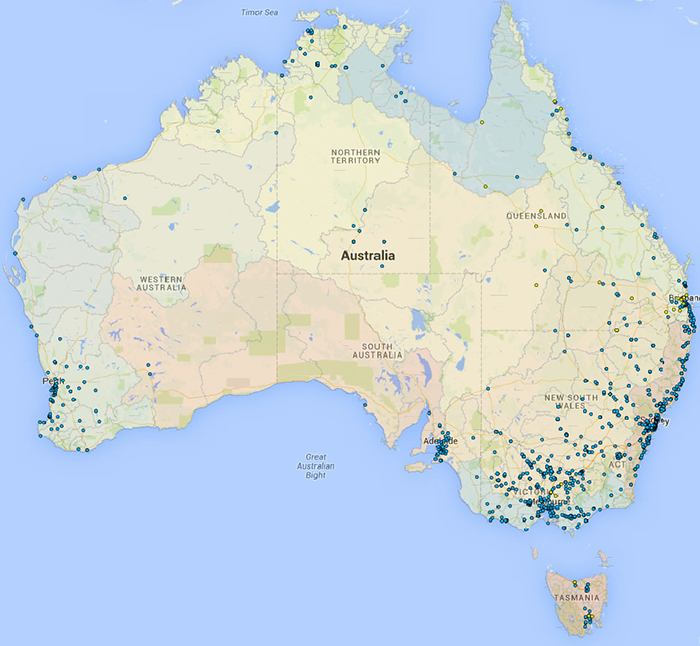
The locations around Australia for which flood studies are available, extracted from the Australian Flood Risk Information Portal
Mapping surface water using satellite data
To develop WOfS, Geoscience Australia created an automated water mapping algorithm to detect water from satellite images. Australia was divided into 25 metre by 25 metre grid cells, with each cell then having the algorithm applied. WOfS recorded the number of times water was detected for each cell for each pass of the satellite from 1987 to present day.
For each cell location, water detected is compared to clear observations (i.e. observations not affected by cloud, shadow, or other quality issues) to provide a percentage value of the number of times since 1987 that water was observed at each location. The colouring of this summary layer indicates how often water was observed in each cell, with possible floods appearing in the low values (red to yellow colours) while consistent water bodies such as lakes and dams have high values (blue to purple colours).
In each grid cell, WOfS displays: the number of clear satellite observations over the time period 1987 to present day; the number of occasions water was detected; the percentage of clear observations; and the confidence (or probability) that a water observation in this location is correct.
Landsat satellites have a specific orbital cycle, resulting in them passing over the same location every 16 days. This means that each satellite will see the same location about 23 times per year. For a typical location, over 600 clear observations covering 27 years are available for use in WOfS. For some locations, over 1000 observations are available. However, with the 16-day cycle resulting in a time gap between successive observations, it is possible to miss some flood events that might come and go before the satellite can observe them.
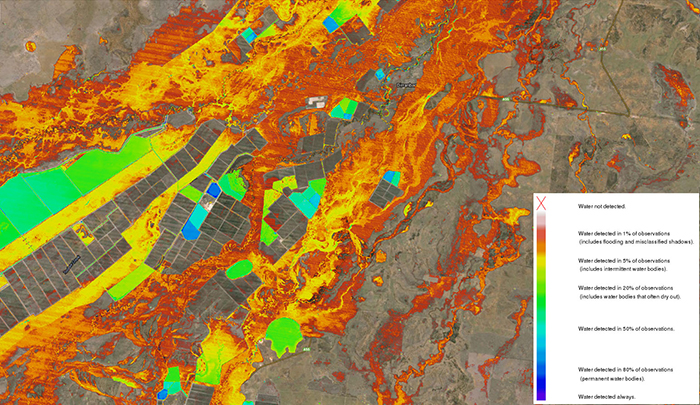
An example of the variation between water seen often (such as dams in blue colours) and water seen rarely (such as flooding in red colours) around the southern Queensland town of Dirranbandi
How WOfS can be applied to meet challenges
The consistency and quantitative nature of the data provided by WOfS results in improved efficiencies, reduced overheads and assists in understanding the effects of flooding
While WOfS serves as a complement to flood studies, the observations and data displayed by the product are critically important to areas without historical flood studies, such as the inland areas of Australia. Although less densely populated, these inland areas are important. They are home to significant agricultural and resource industries; provide key rail and road transportation links to connect major economic centres; and house environmental assets, whose importance to communities and economic activity located considerable distances away is becoming more apparent
These inland areas can be particularly vulnerable to flood, which can cover very large areas, take months to move through, and behave in less predictable patterns. The WOfS product provides a visualisation of inland areas that are more prone to flooding and where the flood waters historically travel.
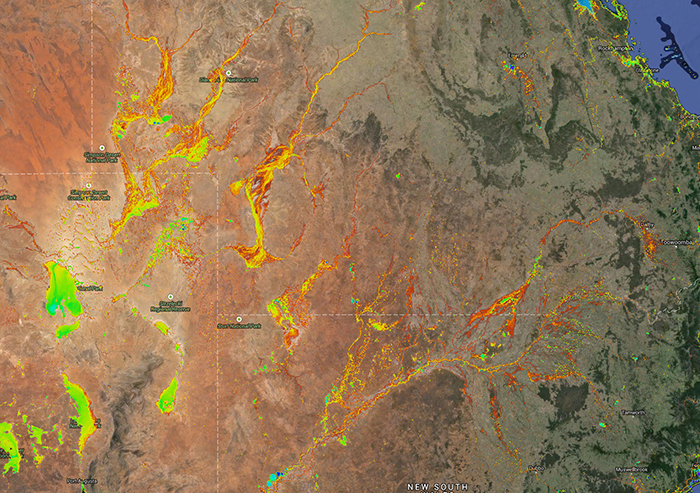
WOfS showing the vast inland flooding that feeds Lake Eyre (bottom left of image) from Cooper Creek, the Diamantina River and the Georgina River. Also shown is the Darling River catchment from its headwaters to Menindee Lakes and the large floodplains of the Darling River system.
Where to from here
The complete WOfS product, from 1987 to present day has recently been released by Geoscience Australia, offering an exciting opportunity for its application to help understand flood, and to other areas of environmental science more broadly.
In addition to flooding, it is only just starting to be discovered how useful the WOfS technology will be. Through the satellite mapping of Australia's surface water over time, Geoscience Australia is able to provide more consistent information to government, industry and the community relevant to issues such as flood management and community safety, as well as wetland management, agricultural innovation and infrastructure development.
The WOfS technology has significant potential for transfer to other regions of the world, particularly countries with similar topography to Australia. As the product is based on a global satellite dataset, technology transfer is relatively simple and it can also be adapted to local conditions with potential for the results to be shared with the international disaster risk reduction community to improve global information on surface water.
Geoscience Australia will continue in its development of WOfS, with future plans including incorporation of data from new satellites to provide an even richer product. Through collaboration with other agencies and research organisations, there is great potential to extend the WOfS product suite to support many water-related projects and national environmental monitoring needs, such as state of environment reporting.
Partnerships
WOfS was made possible by utilising the Australian Geoscience Data Cube, a collaborative development by Geoscience Australia, CSIRO and the National Computational Infrastructure, as a new approach to storage, organisation and analysis of satellite data.
Further information
- Access Water Observations from Space via Geoscience Australia's interactive maps
- About Water Observations from Space
- National Flood Risk Information Project