Pacific sea level and geodetic monitoring
Page last updated:16 April 2024
Introduction
The Australian Aid-funded Pacific Sea Level and Geodetic Monitoring (PSLGM) Project (the Project) is working towards generating an accurate record of the absolute and relative sea level in 13 countries throughout the Pacific. This Project operates under the Climate and Oceans Support Program in the Pacific.
The network of sea-level stations in the Pacific was established in the early 1990s. The Project is focused on determining the long-term variation in sea level through observation and analysis of sea level using tide gauges (managed and operated by the Bureau of Meteorology (BOM)) and changes in the height of the land using Global Navigation Satellite System (GNSS) data (managed by Geoscience Australia (GA)) and levelling data (managed by The Pacific Community (SPC)).
Figure 1: The 13 Pacific Island countries hosting both GNSS and tide gauge infrastructure are the Cook Islands, Federated States of Micronesia, Fiji, Kiribati, Nauru, Niue, Papua New Guinea, Republic of Marshall Islands, Samoa, Solomon Islands, Tonga, Tuvalu and Vanuatu.
Measuring
In most cases, three types of measurement are necessary to assess whether absolute sea level is changing at a given point: tide gauge data, GNSS data and levelling observations.
- Tide gauges (operated by BOM) measure relative sea level variation;
- GNSS (operated by GA) measure absolute land motion; and
- Levelling observations (undertaken by SPC) to measure the height difference between the GNSS site and tide gauge.
Tide gauges do not measure absolute sea level variation as absolute sea level height refers to the height of sea level with respect to the centre of the Earth. Instead, they measure relative sea level variation. Relative sea level refers to the rise or fall of sea level with respect to a local reference point, for example the tide gauge sensor or a line etched into the pylon of a wharf. Relative sea level is what is experienced by people living on the islands and it will vary according to a combination of steric change (e.g. thermal expansion), eustatic change (e.g. ice melt) and changes to land height (e.g. subsidence, earthquake). At locations where the absolute vertical rate of movement of the tide gauge is negative, the impacts of sea level rise experienced may be compounded.
A tide gauge alone cannot differentiate between changes in the steric / eustatic sea level and movement of the land or wharf the tide gauge is attached to. For example, refer to Figure 3. If a tide gauge is observing 5 mm/yr rise in sea level, we are unable to distinguish whether the land to which the tide gauge is connected is subsiding by 5 mm/yr (Figure 2i), the sea level is rising by 5 mm/yr (Figure 2ii), or some combination of both.
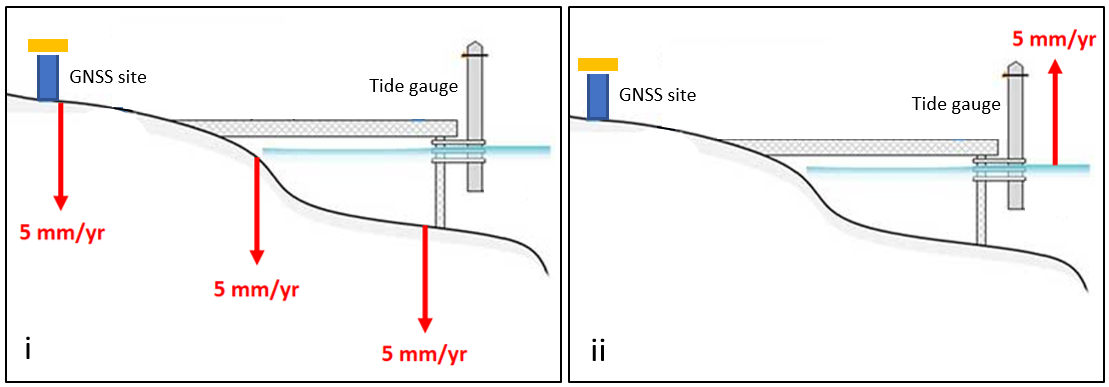
Figure 2: [i] land subsiding at a rate of 5 mm/yr with no change to absolute sea level; [ii] absolute sea level rising by 5 mm/yr and no movement of the land.
To distinguish between relative and absolute sea level variation from tide gauge data, it is necessary to know the movement of the tide gauge in an absolute frame of reference. The absolute frame of reference we use is the centre of the Earth. To measure the absolute movement of the tide gauge data we use a combination of GNSS data and levelling data.
Analysis
GNSS analysis
The GNSS data is captured using infrastructure managed by GA in each of the 13 countries and transmitted back to GA for analysis. GA computes the three dimensional position of the GNSS site every week with respect to the centre of the Earth. The weekly height component of the three dimensional position varies predominantly due to a combination of land motion (e.g. subsidence, earthquake) and atmospheric noise.
Levelling analysis
The differential levelling technique has been used for all surveys to compute the height difference between the GNSS site and tide gauge every 18 months in each country. This technique involves setting up a total station (surveying instrument) midway between two targets and computing the height difference between survey marks in the ground (see blue triangles in Figure 3).
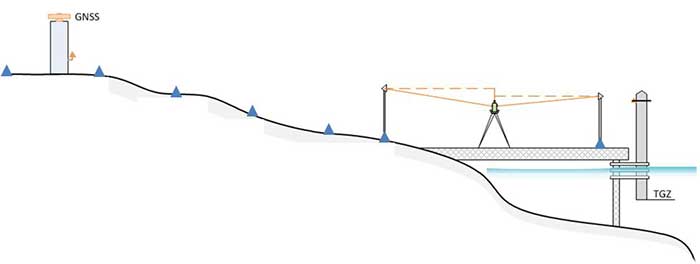
Figure 3: Levelling is undertaken every 18 months to compute the difference in height between the GNSS site and tide gauge. The blue triangles represent stable survey marks in the ground. Observations are made between each of the survey marks and added together to compute the difference in height between the GNSS site and tide gauge.
By summing the height differences between all the survey marks, we are able to compute the height difference between the GNSS site and tide gauge and thereby compute the absolute height of the tide gauge. By observing the height difference in both directions (from tide gauge to GNSS site and then reversed), we can confirm the quality of the results.
Combination analysis
To compute the absolute movement of the tide gauge, the analysis of the GNSS and levelling is combined together. This is done by:
- Taking the smoothed GNSS height on the day the levelling survey is undertaken (e.g. on 2008.41, the height of the Apia GNSS site was 76.864 m);
- Adding the levelled height difference between the GNSS site and tide gauge (-34.759 m) to the smoothed GNSS height (76.864 m) to compute the absolute height of the tide gauge (42.105 m).
- Repeat this analysis for each set of levelling data (e.g. Table 1).
Table 1: Summary of height difference between the GNSS site and tide gauge for Apia. The date is shown in decimal years (e.g. 2012.58 = 1 July 2012).
| Date | GNSS Height (m) | Height Difference (m) | Tide Gauge Height (m) | 95%c CI (m) |
|---|---|---|---|---|
| 2002.90 | 76.9229 | -34.7517 | 42.1712 | 0.010 |
| 2004.65 | 76.9289 | -34.7544 | 42.1745 | 0.010 |
| 2006.76 | 76.9259 | -34.7588 | 42.1671 | 0.010 |
| 2006.77 | 76.9259 | -34.7569 | 42.1690 | 0.010 |
| 2008.41 | 76.9299 | -34.7587 | 42.1712 | 0.010 |
| 2010.39 | 76.8749 | -34.7585 | 42.1164 | 0.010 |
| 2011.85 | 76.8589 | -34.7537 | 42.1052 | 0.010 |
| 2013.40 | 76.8489 | -34.7613 | 42.0876 | 0.010 |
| 2014.87 | 76.8409 | -34.7562 | 42.0847 | 0.010 |
| 2016.42 | 76.8299 | -34.7598 | 42.0701 | 0.010 |
| 2017.75 | 76.8139 | -34.7624 | 42.0515 | 0.010 |
| 2019.60 | 76.8069 | -34.7590 | 42.0479 | 0.010 |
- Compute the 95% Confidence Interval of the combined GNSS and levelling analysis (e.g. Table 1). This means the uncertainty of the GNSS height is combined with the uncertainty of the levelling. In the case of the levelling undertaken on 2008.41, the combined uncertainty is 0.010 m.
- Compute the absolute vertical rate of movement (and uncertainty) of each tide gauge (see Section 4).
NOTE: These results do not include information regarding sea level data. BOM is currently analysing and linking the absolute land motion data with tide gauge data to create an absolute sea level data set for Pacific Island countries to improve their understanding of sea level changes.
Results
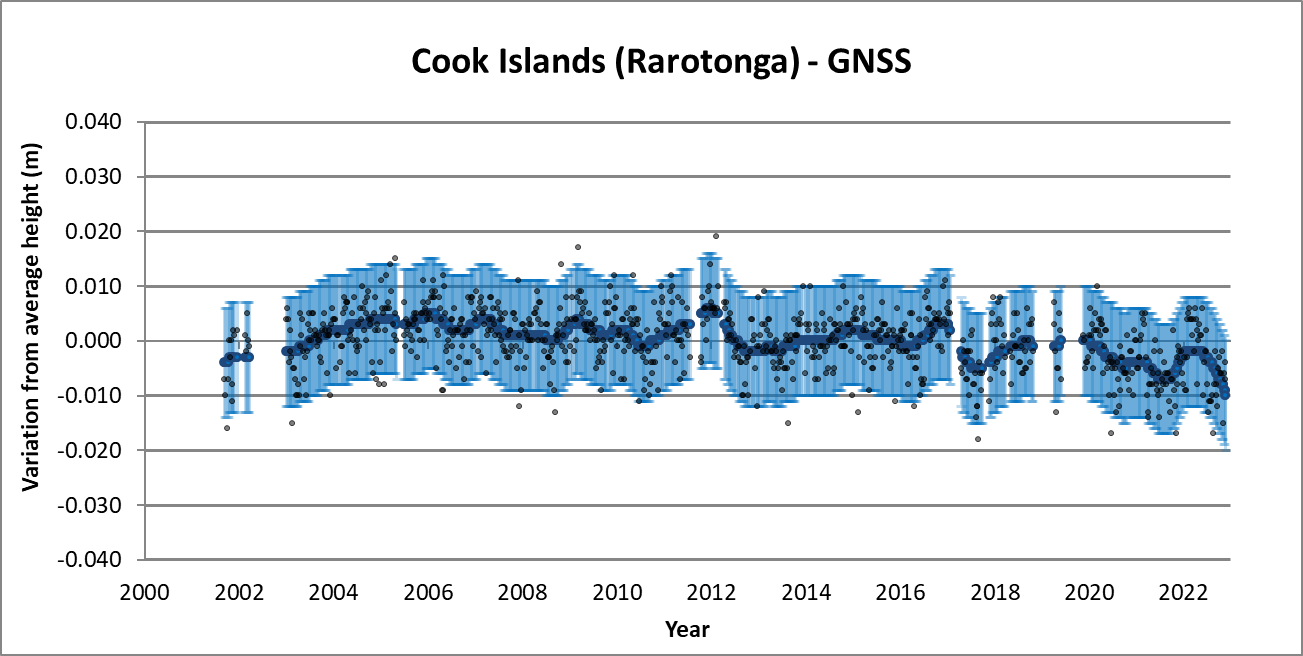
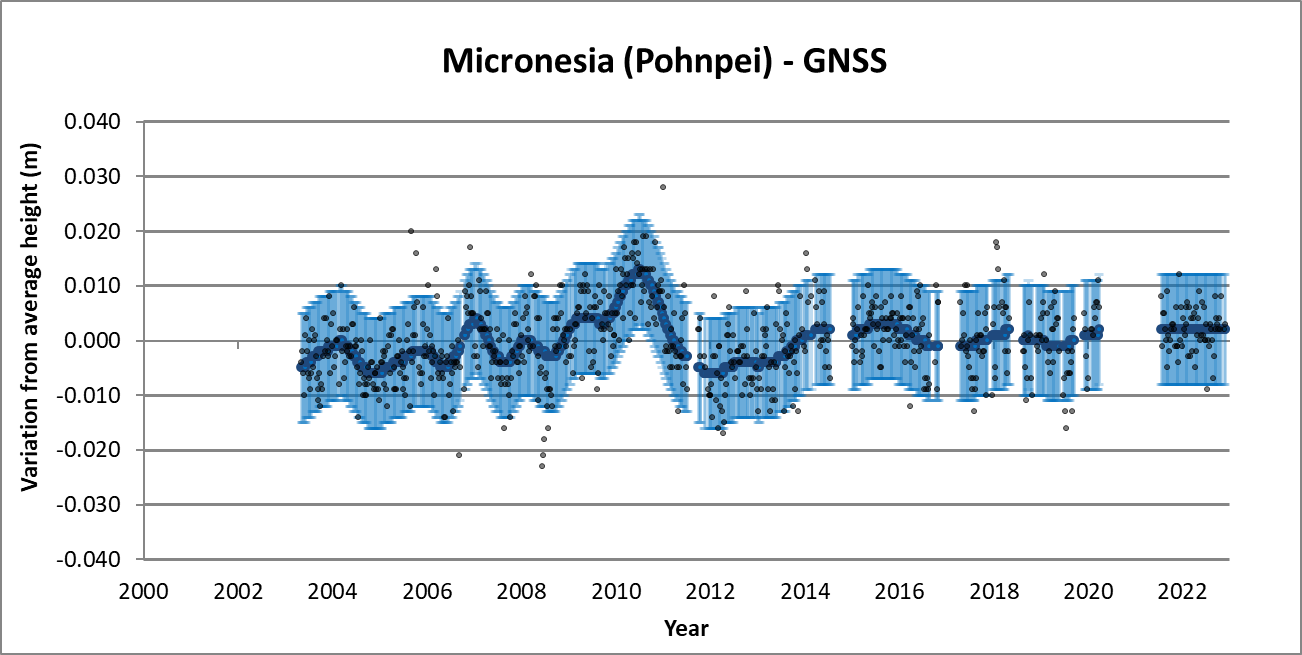
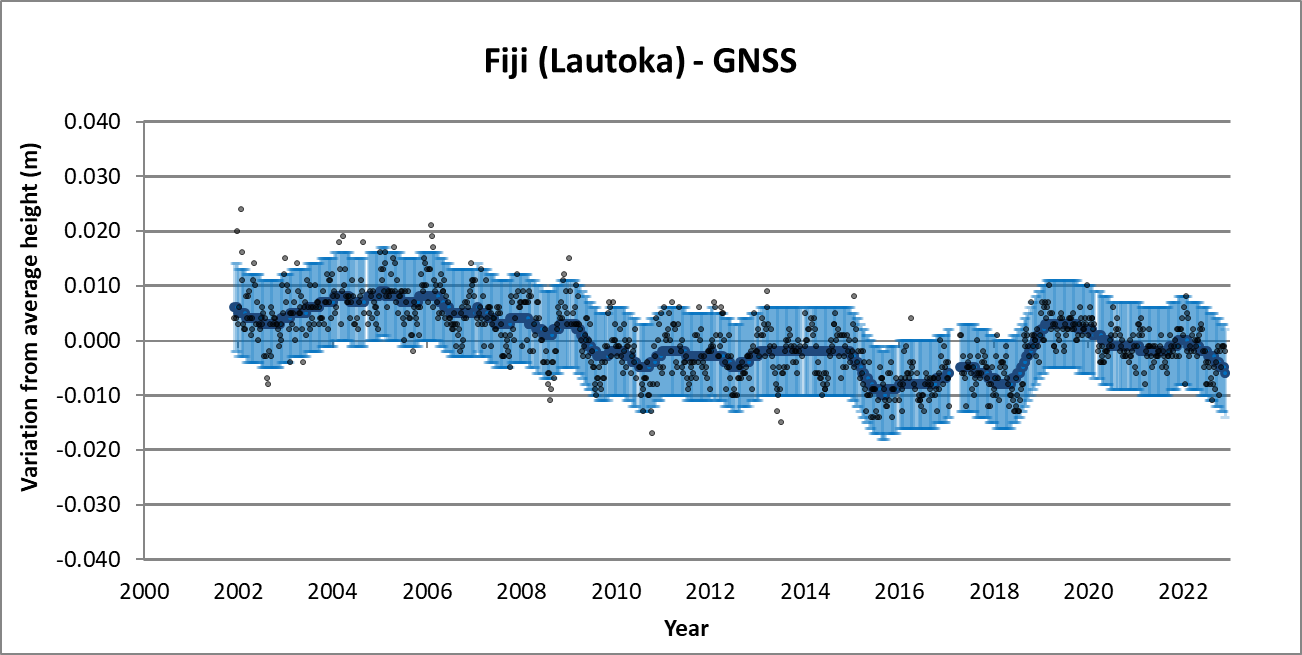
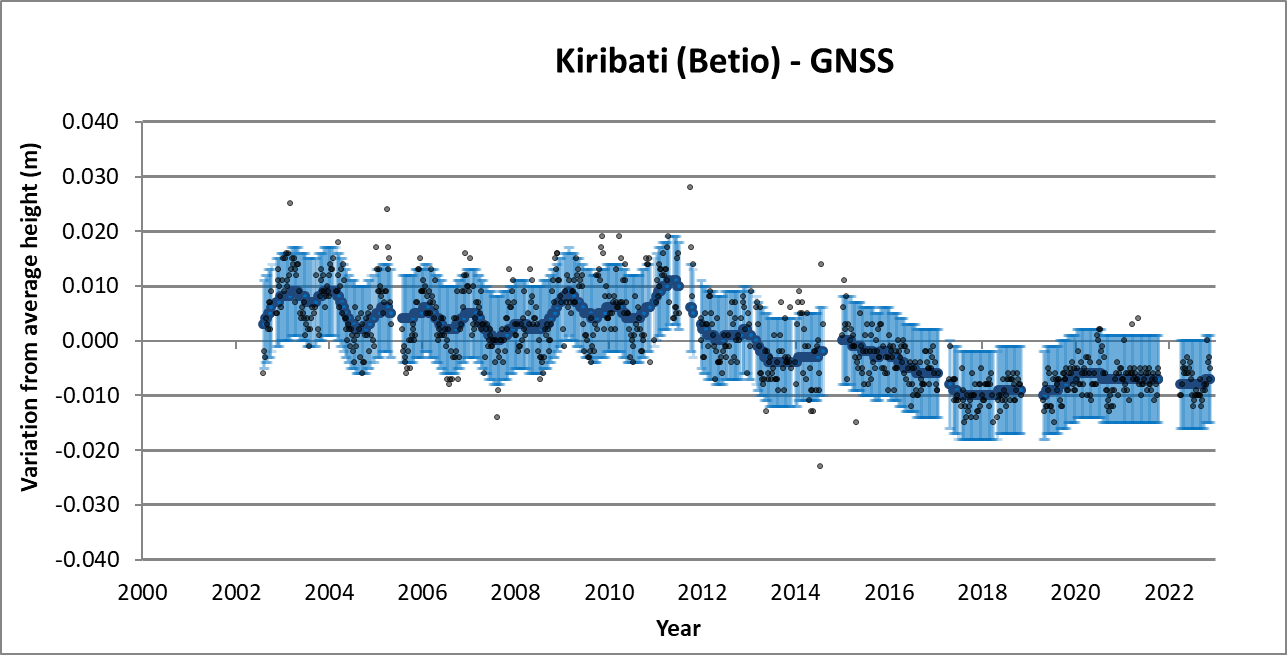
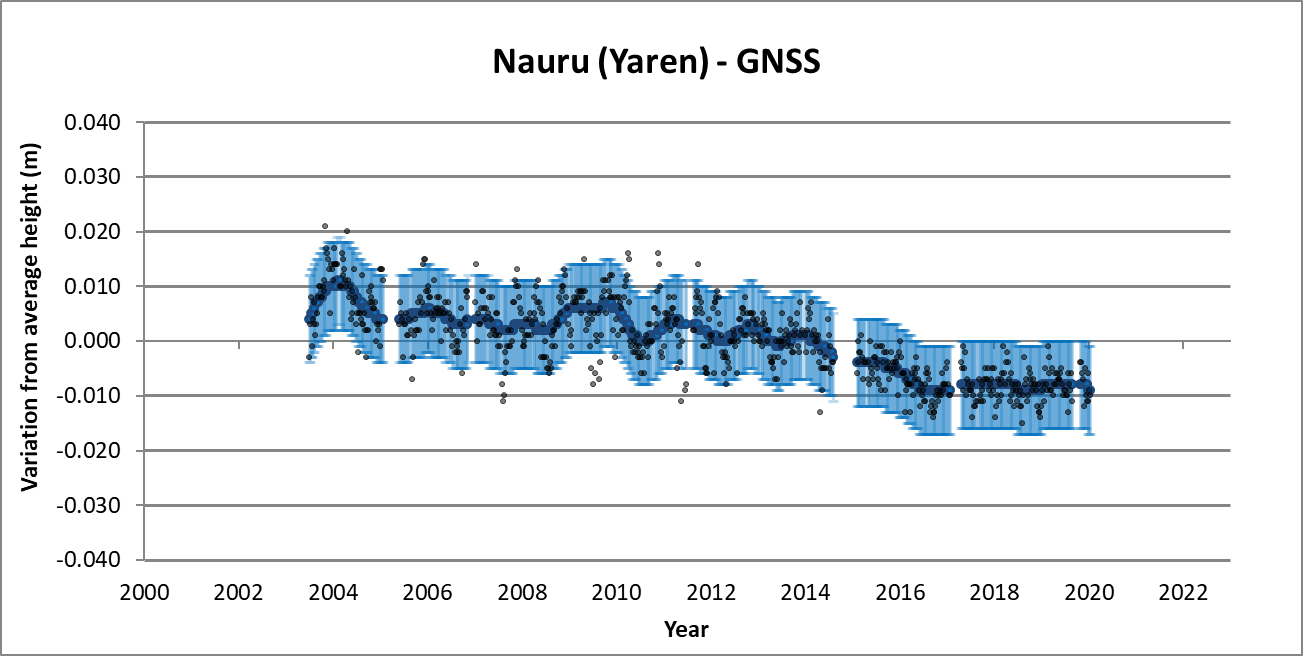
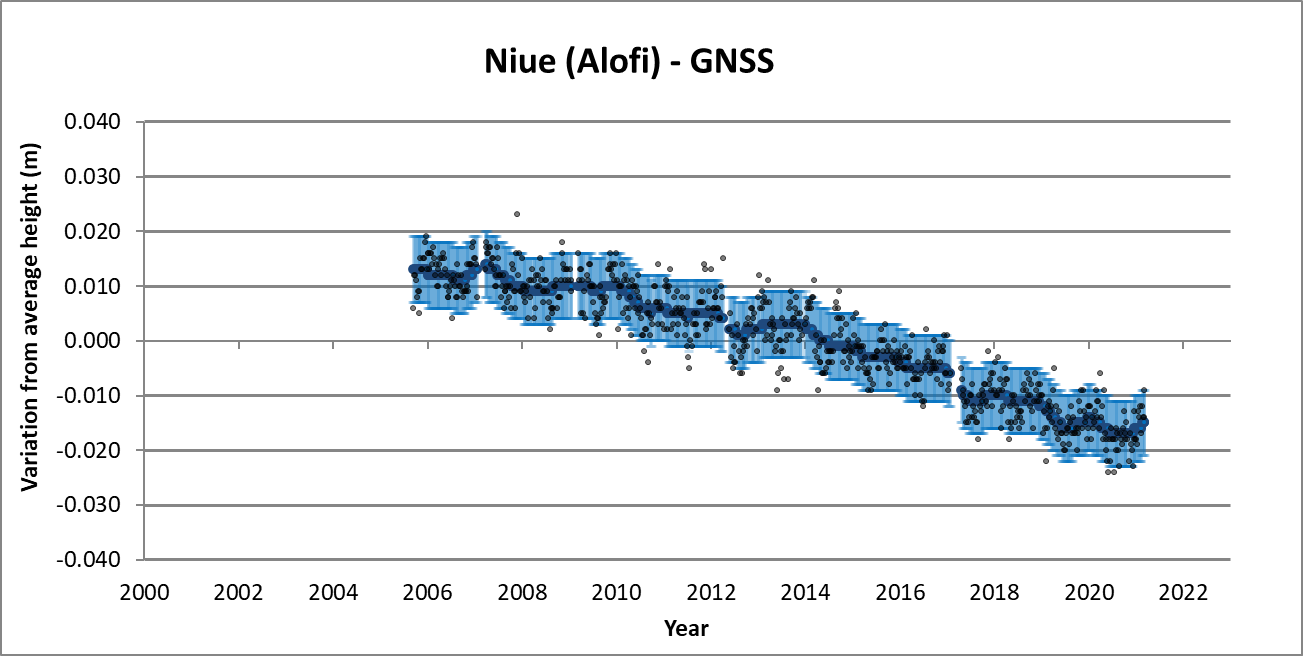
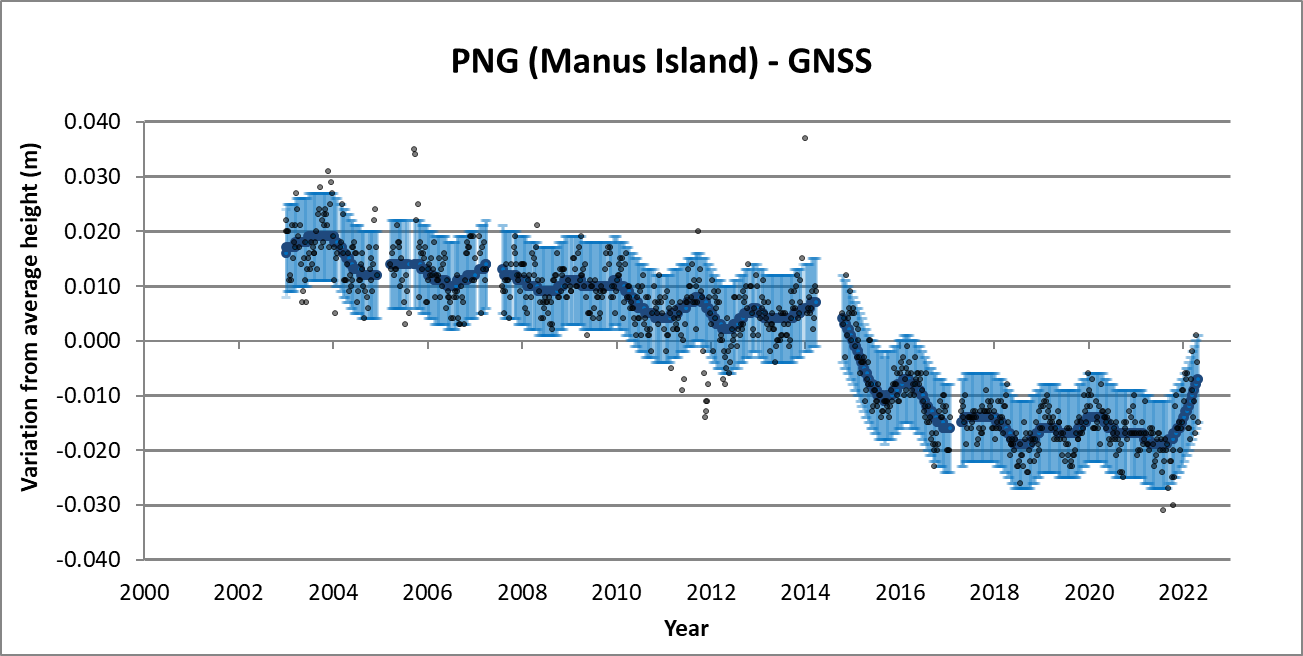
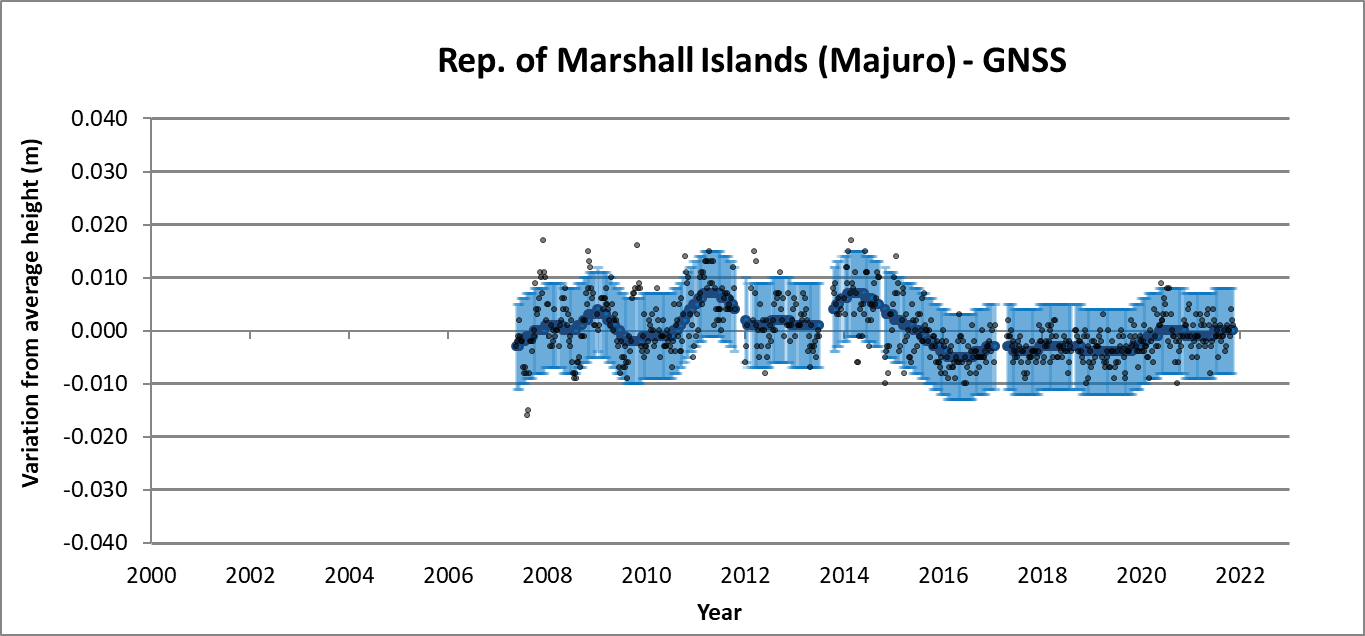
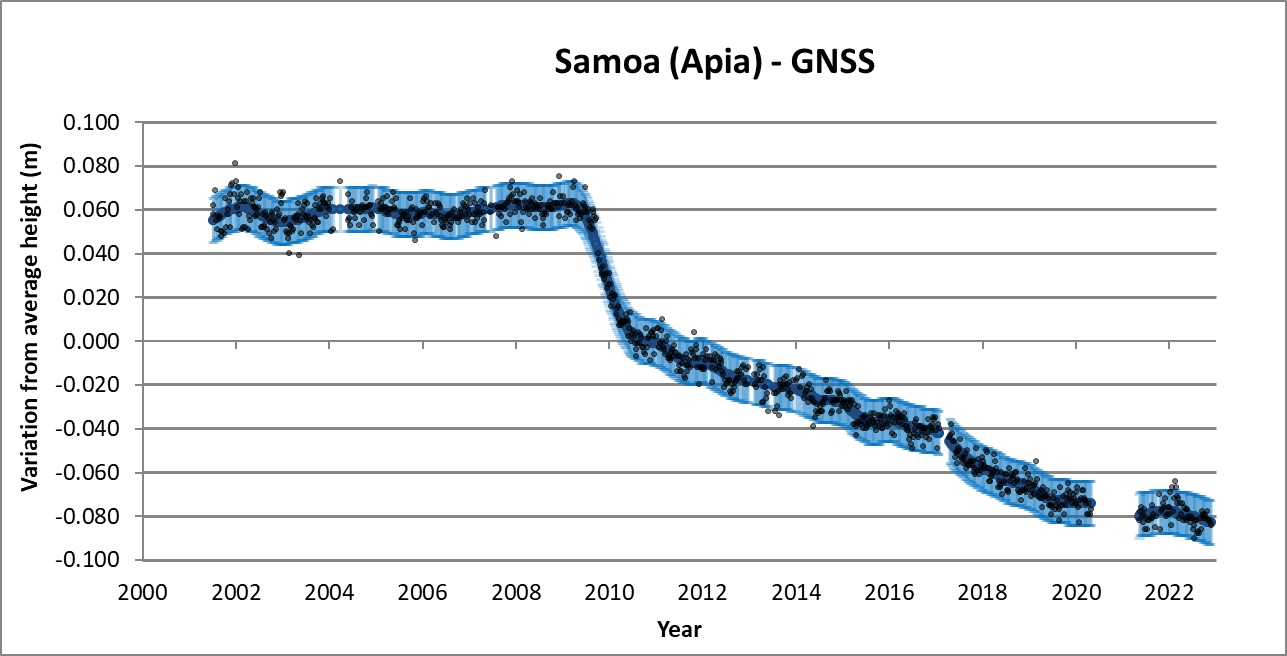
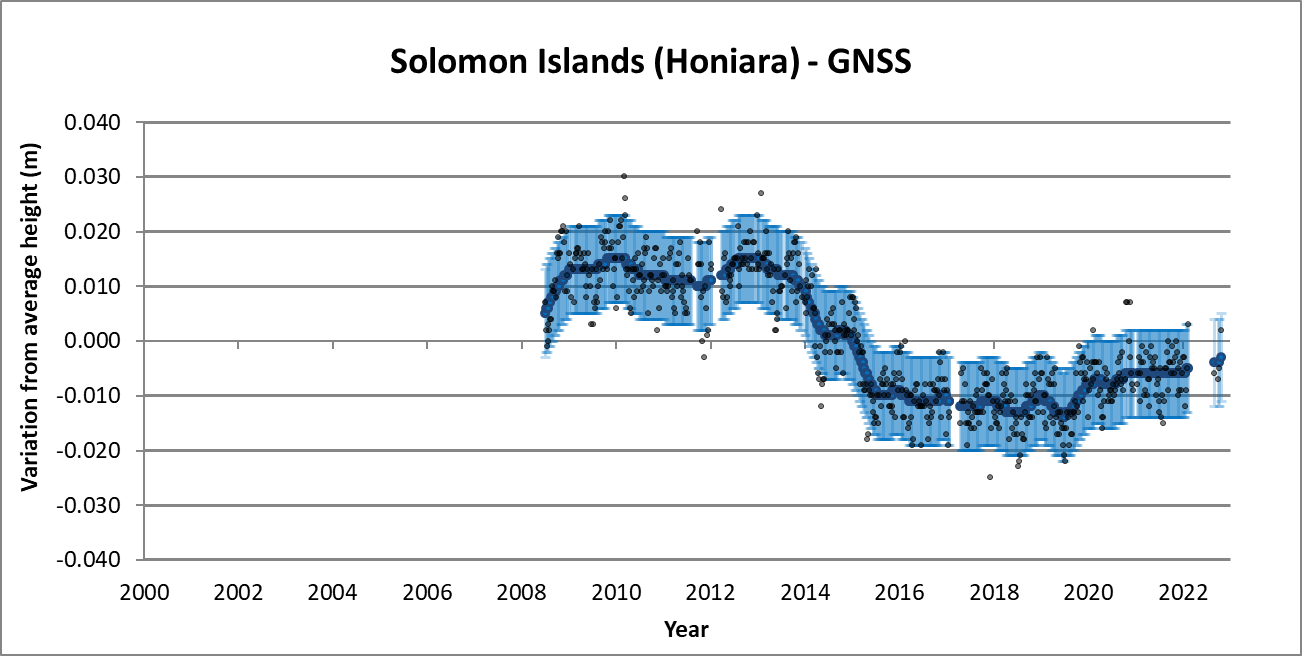
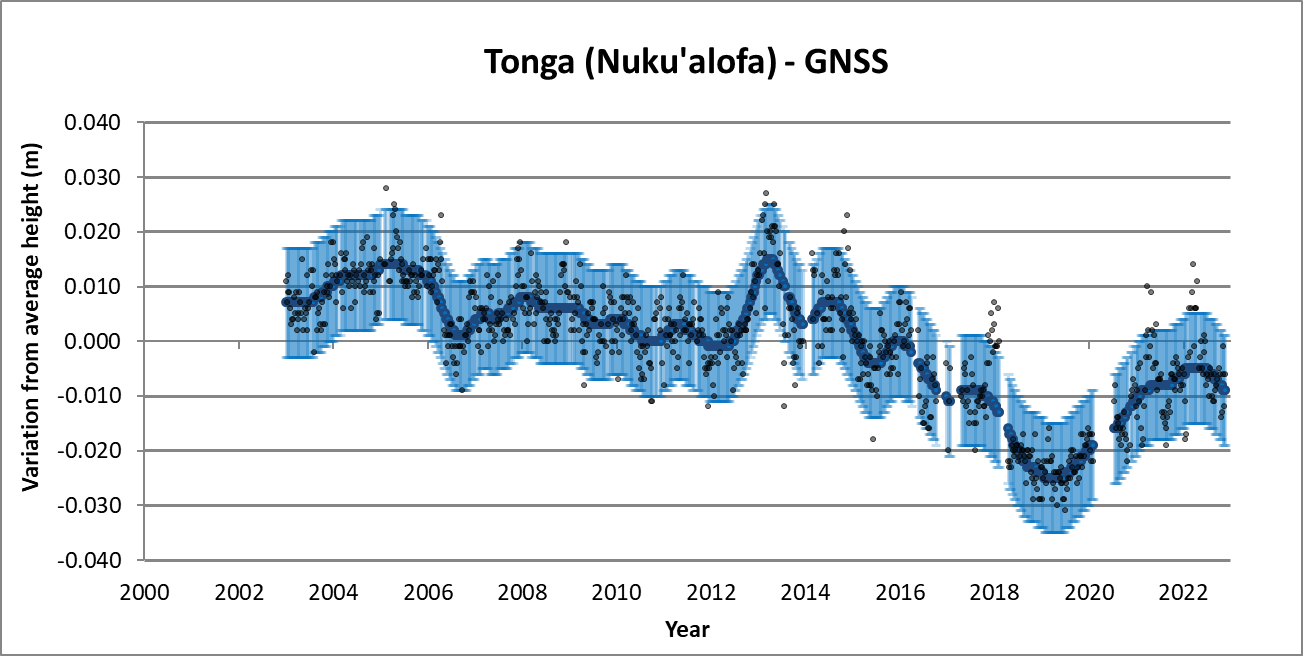
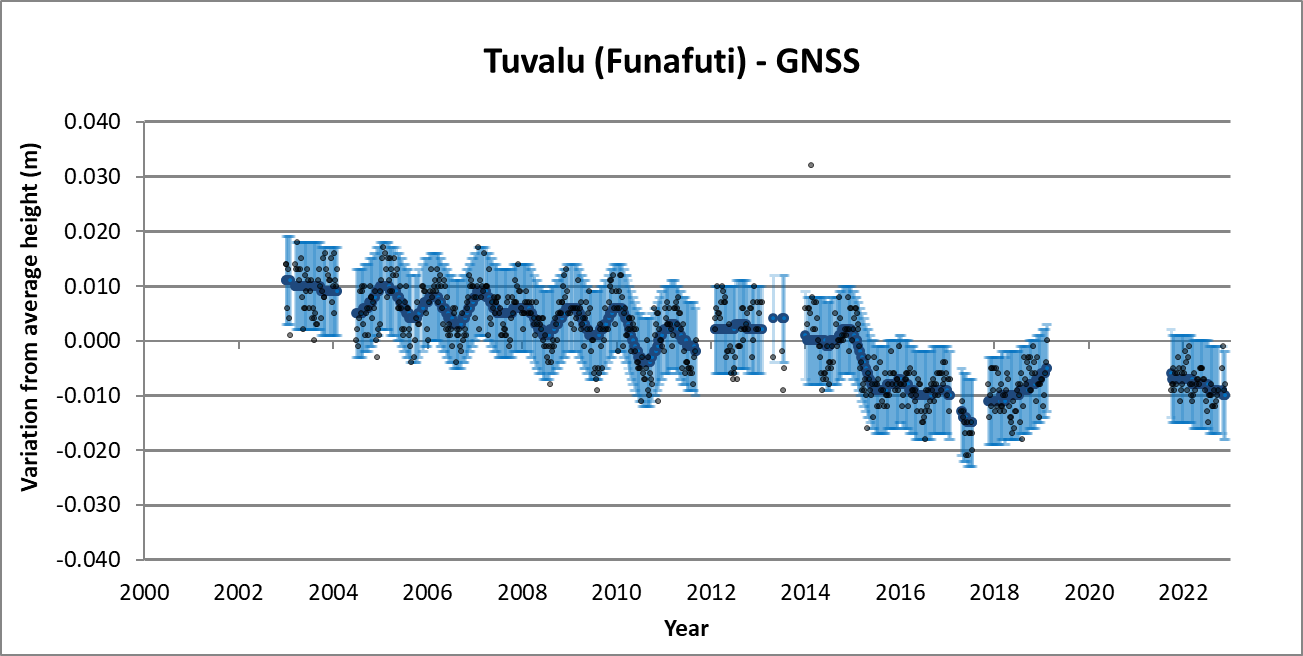
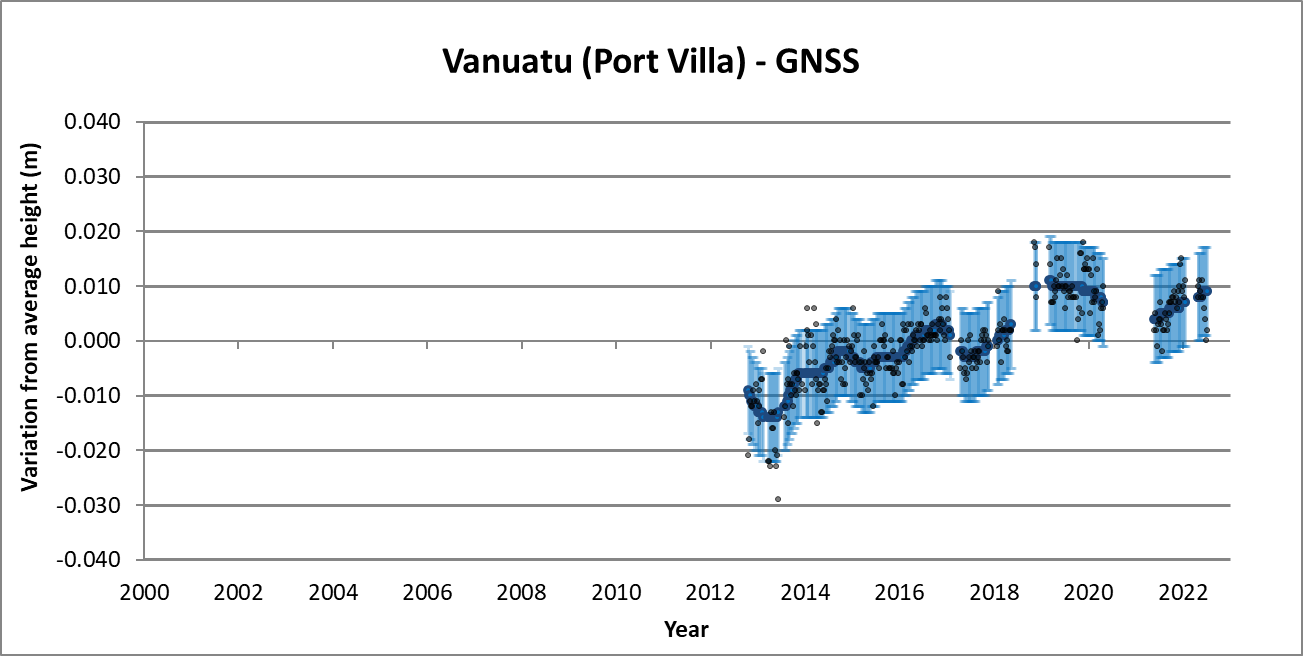
For each of the country tabs below, the top figure (GNSS) shows the change in the height of the GNSS site (1-5 km from the tide gauge). The change in the height of the GNSS site is measured with respect to the centre of the Earth. The grey dots are the height of the GNSS site every week. The dark blue line is a smoothed representation of the weekly data and the light blue error bars show the 95% Confidence Interval.
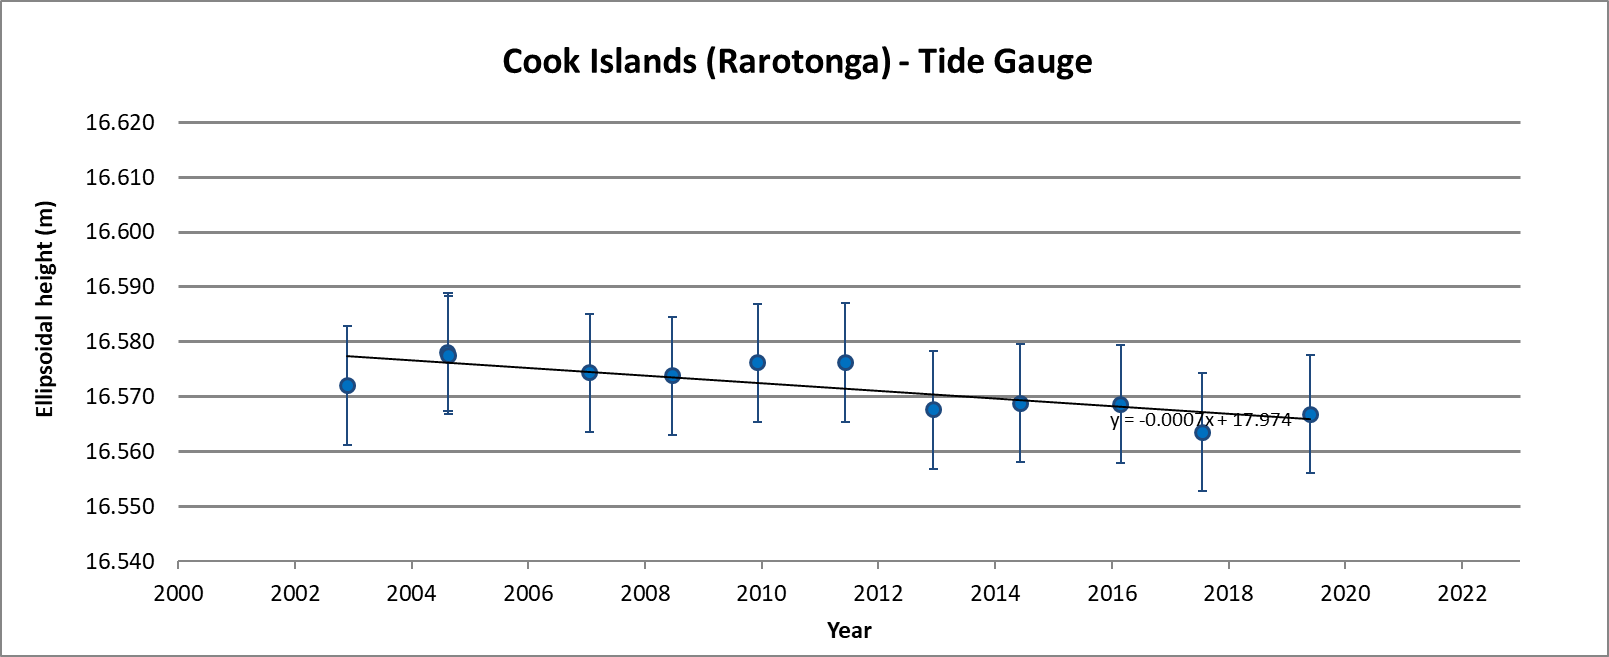
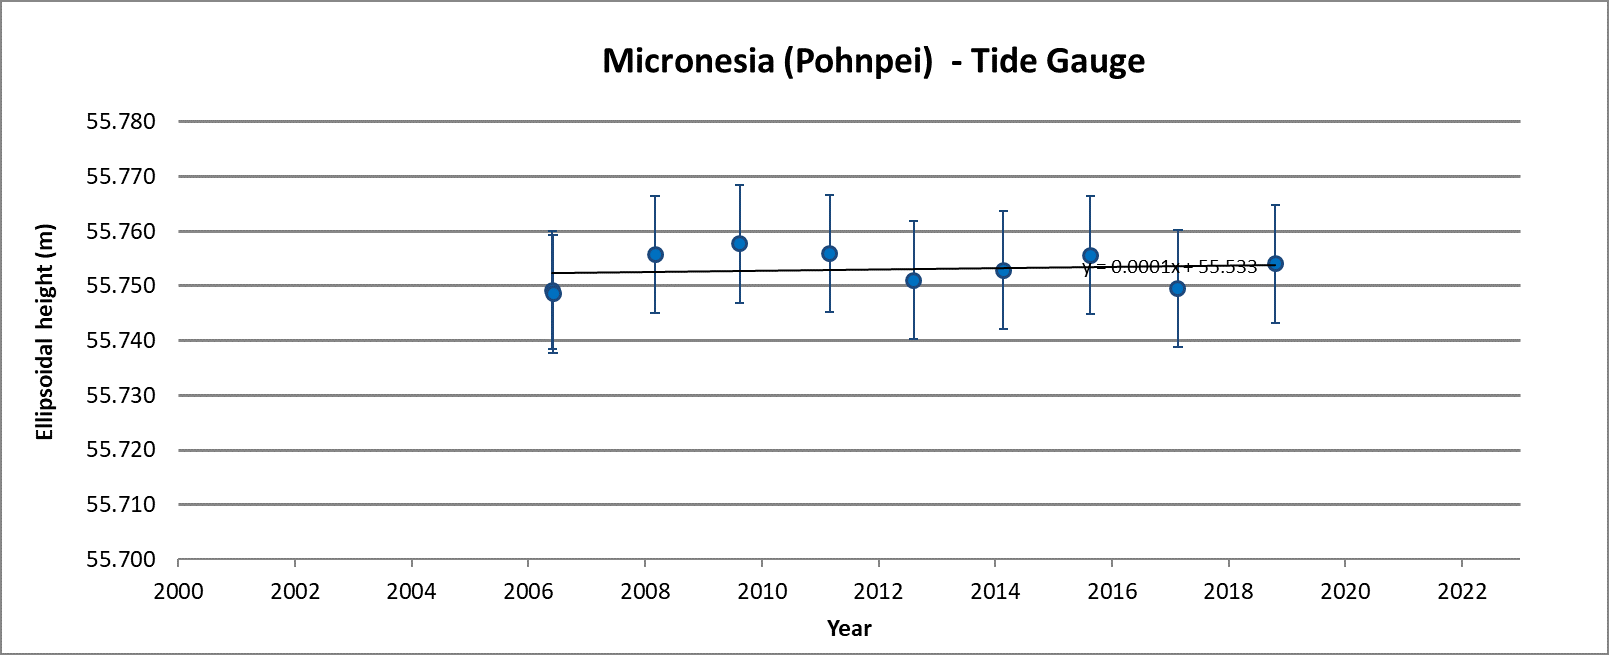
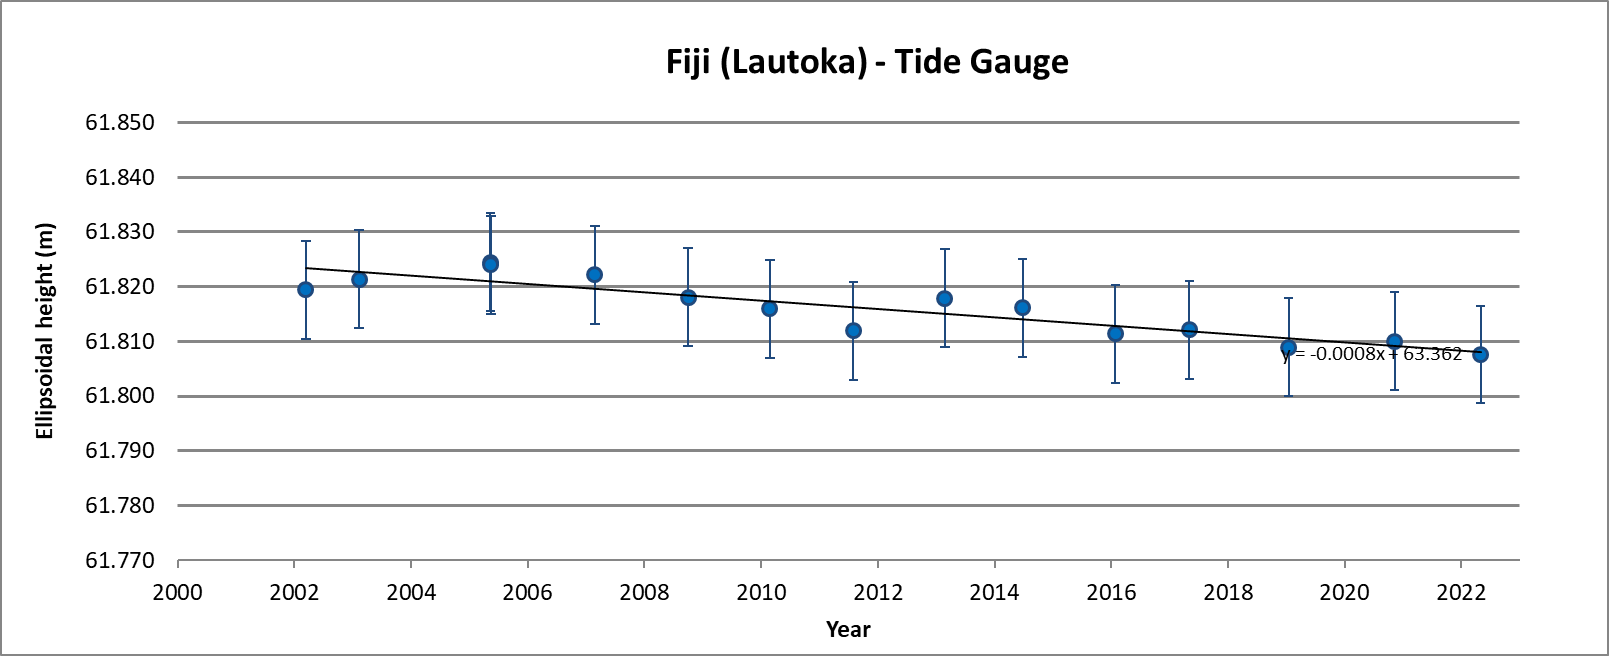
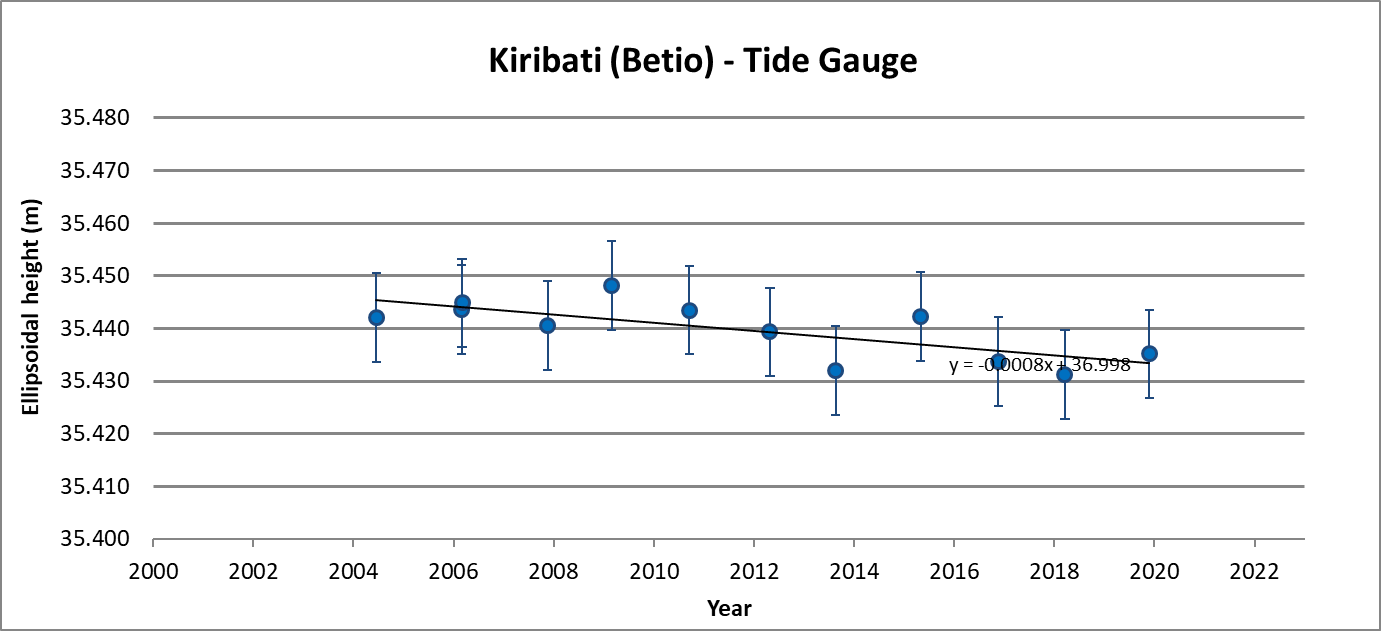
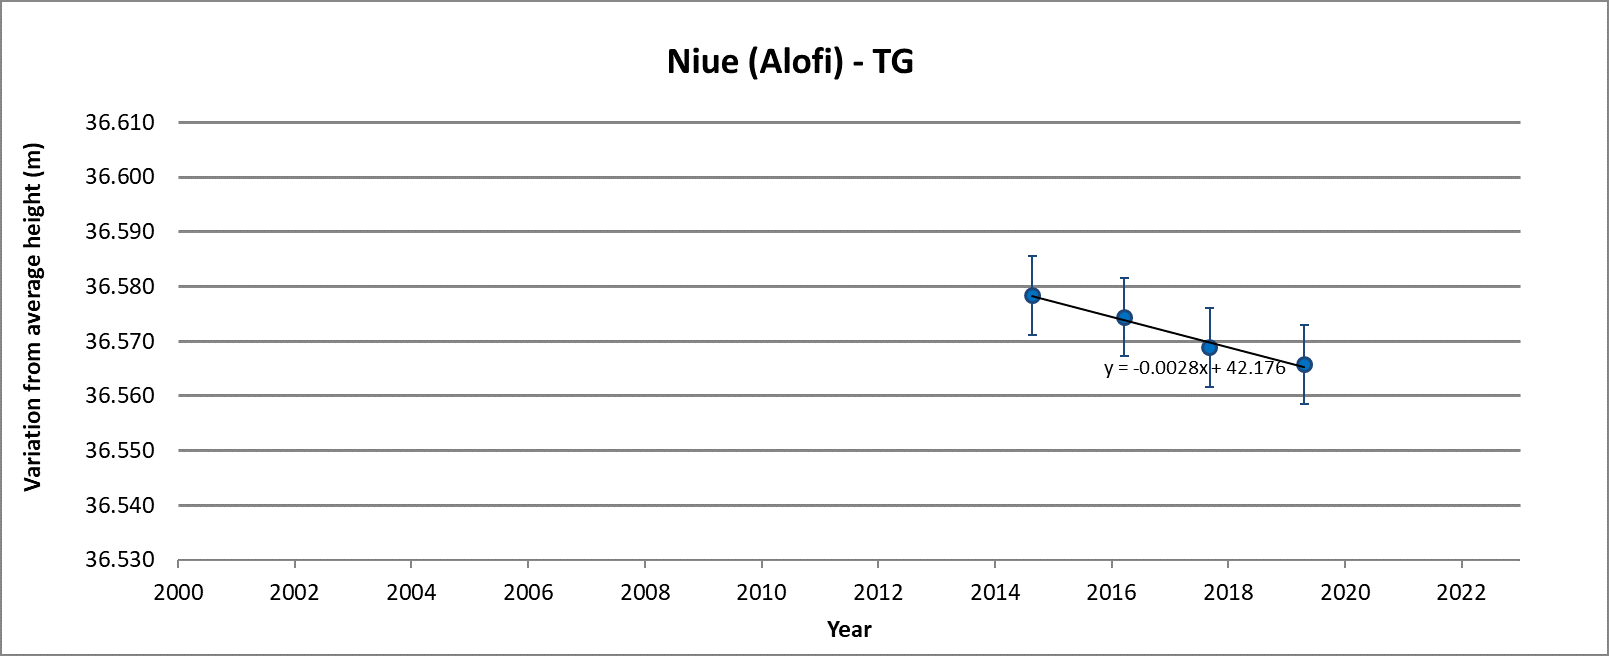
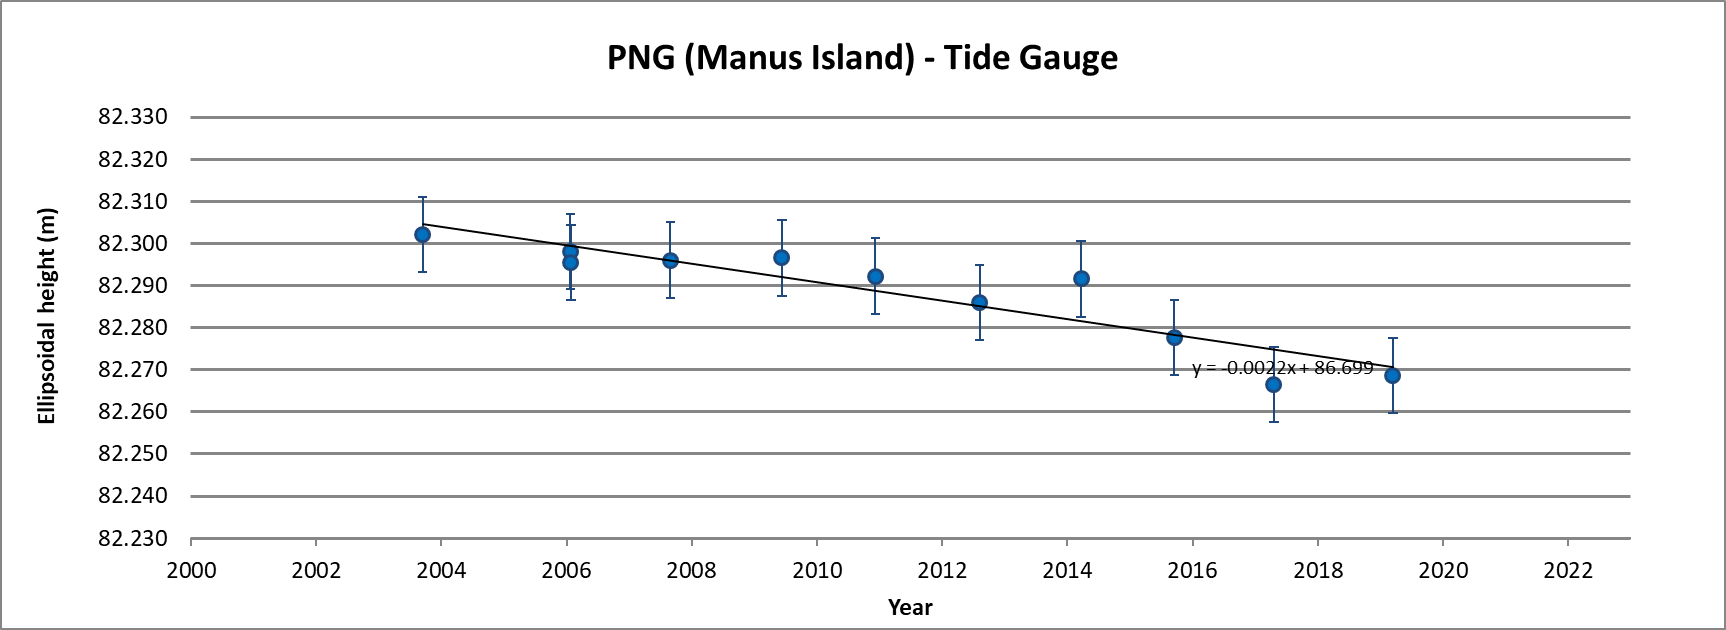
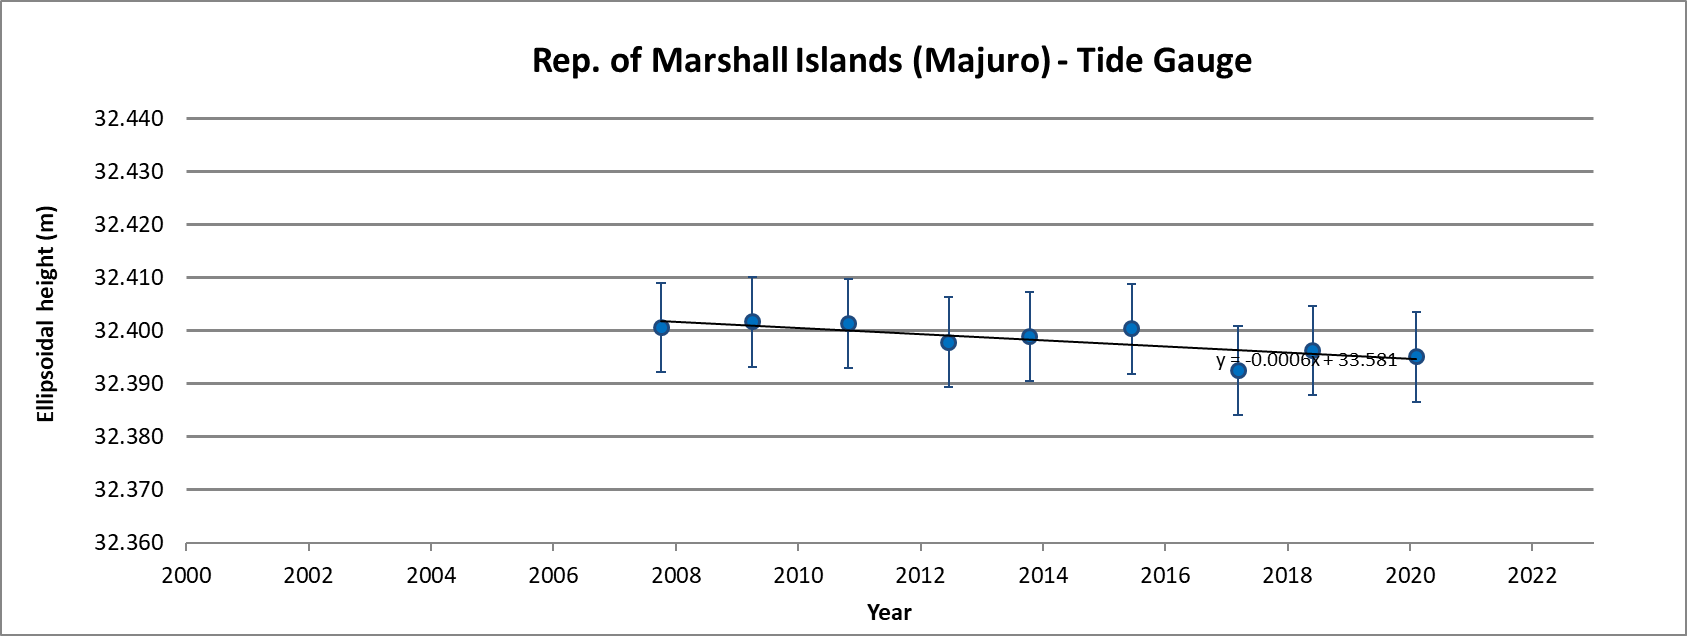
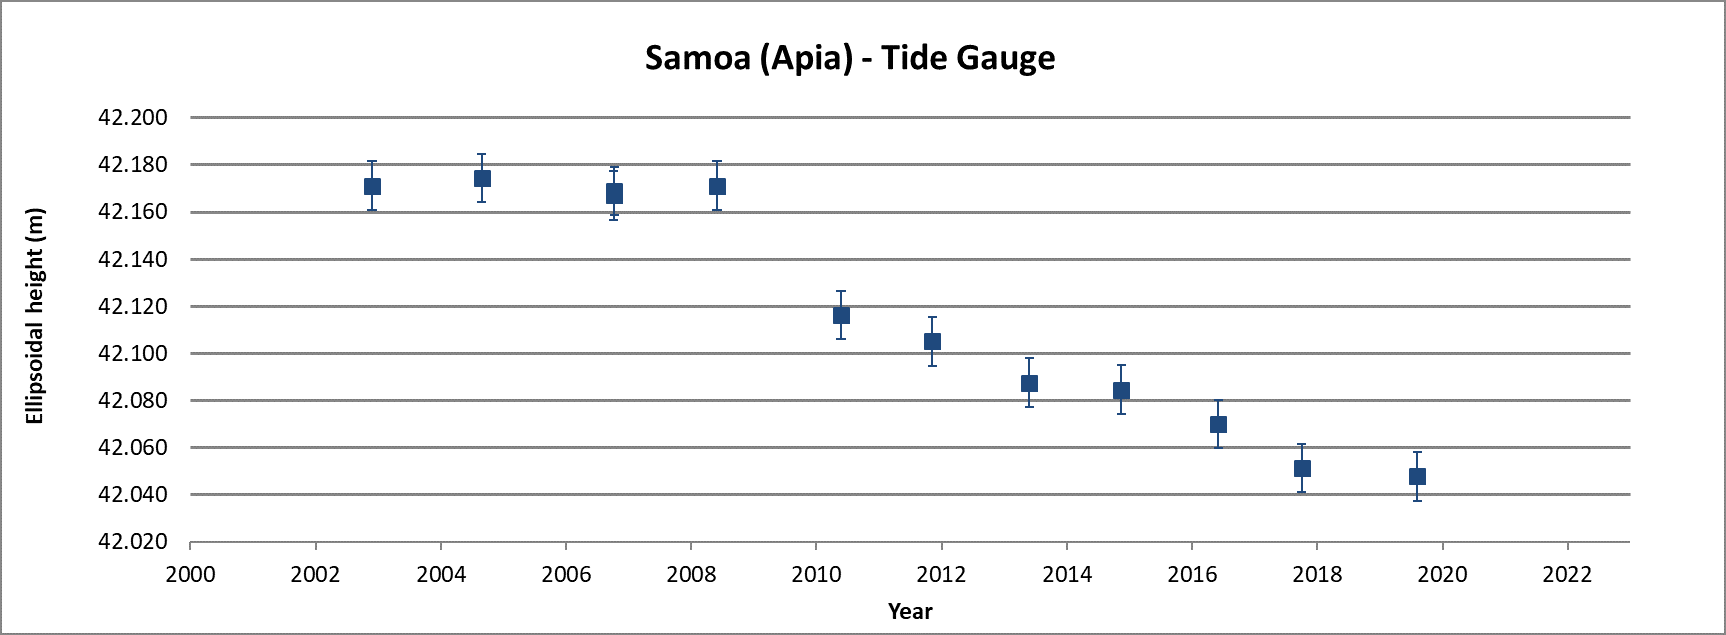
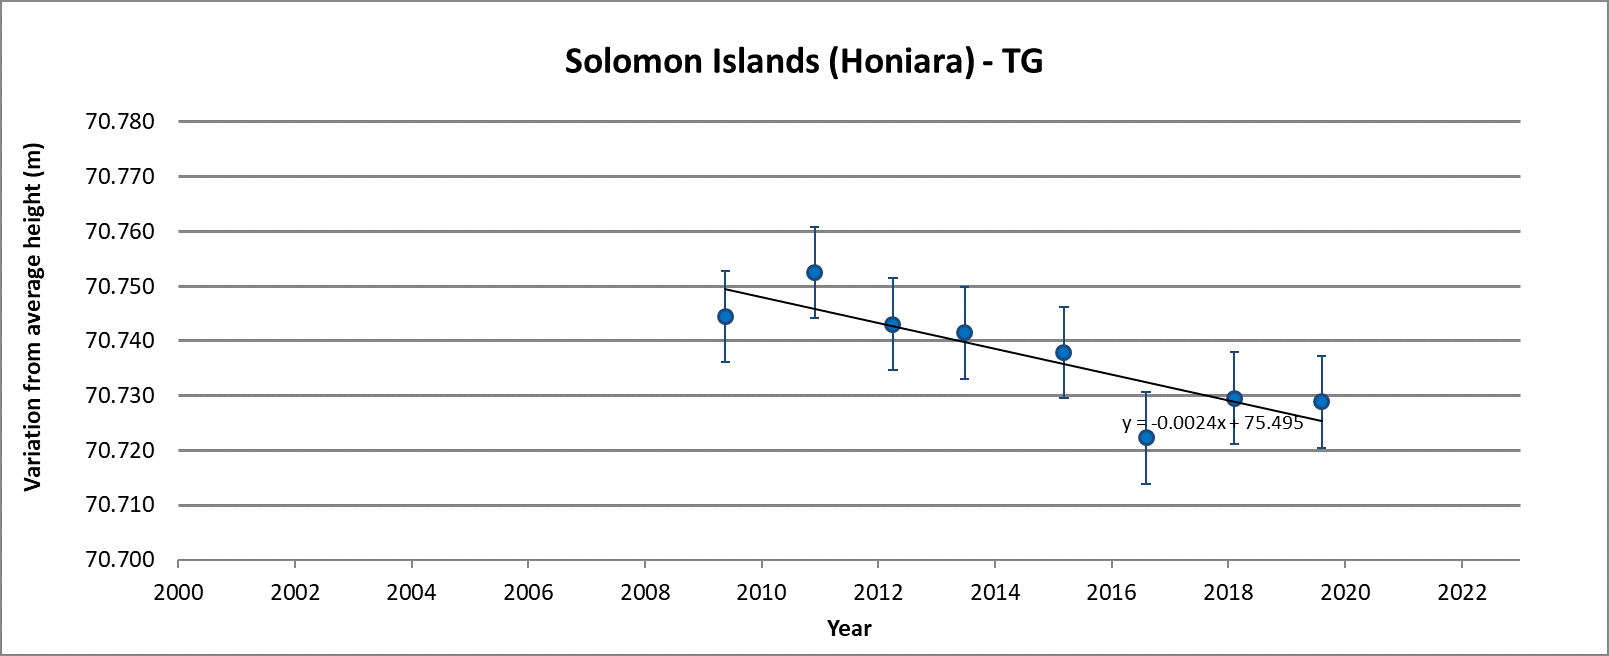
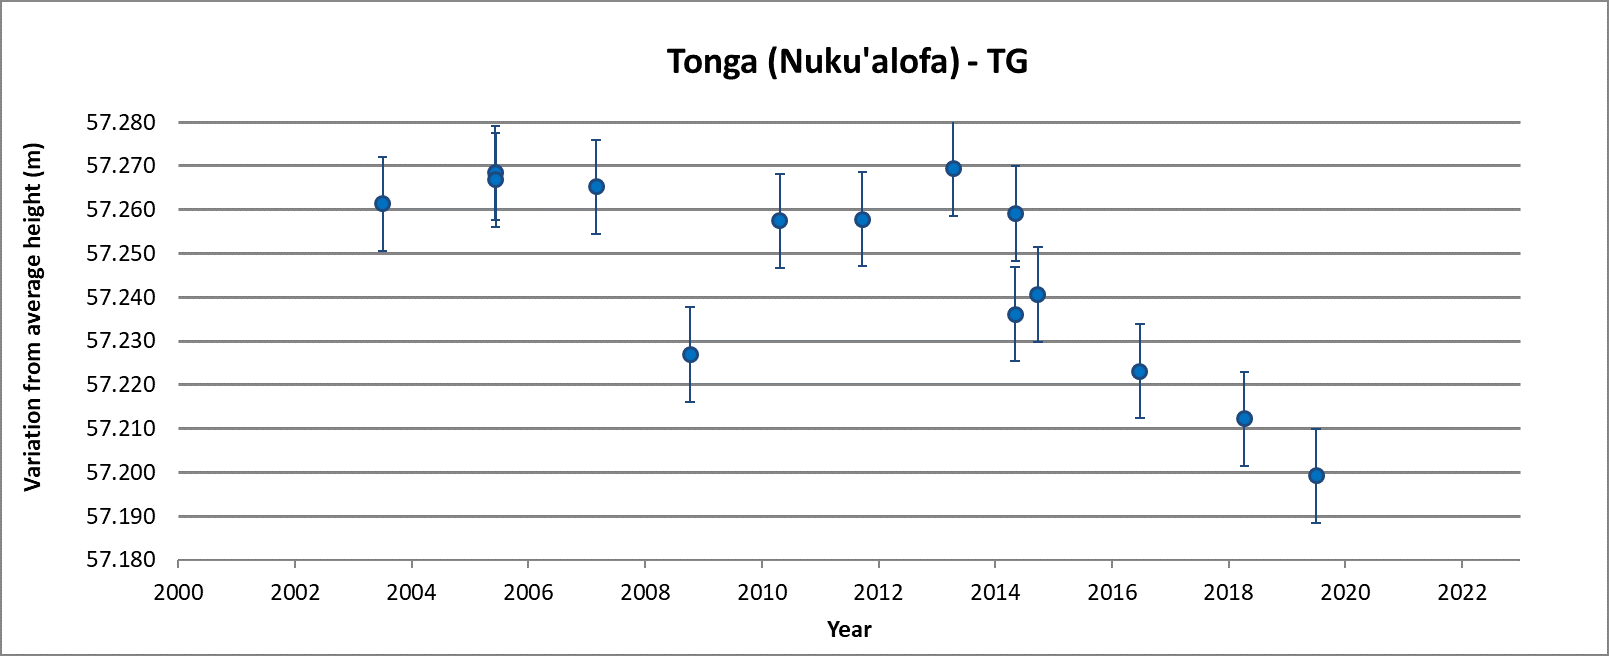
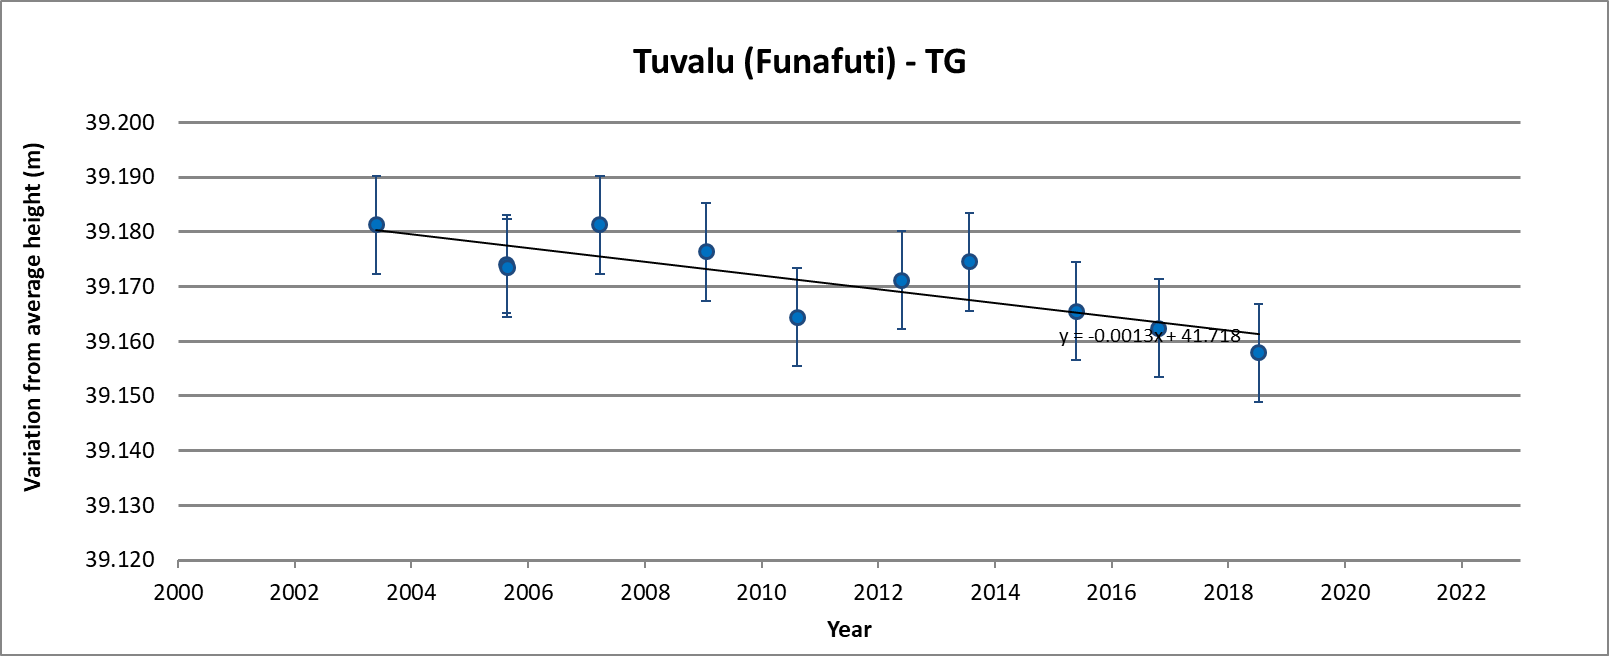
The bottom figure (TG) in each country tab shows the change in the absolute height of the tide gauge. The error bars show the 95% Confidence Interval.
Notes:
- Linear regression of the tide gauge height data indicates the tide gauge movement is -0.7 ± 1.3 mm/yr at 95% Confidence Interval.
- This uncertainty is greater than the trend. This means the tide gauge movement is not certain.
- Tide gauge movement for absolute sea level analysis should be assumed to be 0 mm/yr until the time series is extended, the uncertainty in the GNSS data or levelling data is reduced, or both.
Notes:
- Linear regression of the tide gauge height data indicates the tide gauge movement is 0.1 ± 1.7 mm/yr at 95% Confidence Interval.
- This uncertainty is greater than the trend. This means the tide gauge movement is not certain.
- Tide gauge movement for absolute sea level analysis should be assumed to be 0 mm/yr until the time series is extended, the uncertainty in the GNSS data or levelling data is reduced, or both.
Notes:
- Linear regression of the tide gauge height data indicates the tide gauge movement is -0.8 ± 0.9 mm/yr at 95% Confidence Interval.
- This uncertainty is greater than the trend. This means the tide gauge movement is not certain.
- Tide gauge movement for absolute sea level analysis should be assumed to be 0 mm/yr until the time series is extended, the uncertainty in the GNSS data or levelling data is reduced, or both.
Notes:
- Linear regression of the tide gauge height data indicates the tide gauge movement is -0.8 ± 1.1 mm/yr at 95% Confidence Interval.
- This uncertainty is greater than the trend. This means the tide gauge movement is not certain.
- Tide gauge movement for absolute sea level analysis should be assumed to be 0 mm/yr until the time series is extended, the uncertainty in the GNSS data or levelling data is reduced, or both.
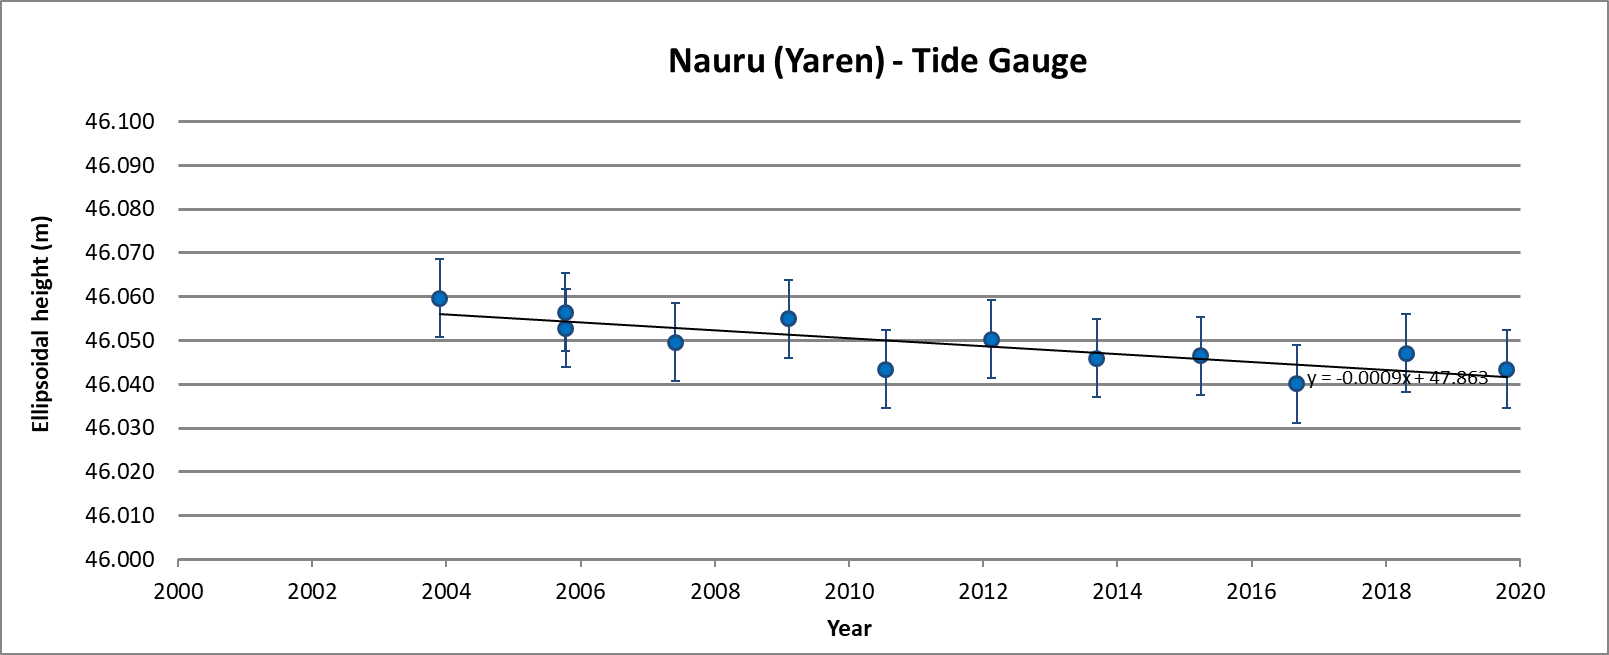
Notes:
- Combined analysis from GNSS and levelling show the tide gauge movement -0.9 ± 1.1 mm/yr at 95% Confidence Interval.
- This uncertainty is greater than the trend. This means the tide gauge movement is not certain.
- Tide gauge movement for absolute sea level analysis should be assumed to be 0 mm/yr until the time series is extended, the uncertainty in the GNSS data or levelling data is reduced, or both.
- In the 2020 Record (Brown et al., 2020), the ellipsoidal height of a benchmark at the base of the tide gauge (NAURU14) was provided instead of the ellipsoidal height of the sensor benchmark on the tide gauge (NAURU15). For this reason, the ellipsoidal heights shown here are approximately 2.1 m different to those shown in the 2020 Record. This does not impact the reported vertical rate of movement of the tide gauge.
Notes:
- Combined analysis from GNSS and levelling show the tide gauge movement -2.8 ± 3.1 mm/yr at 95% Confidence Interval.
- This uncertainty is greater than the trend. This means the tide gauge movement is not certain.
- Tide gauge movement for absolute sea level analysis should be assumed to be 0 mm/yr until the time series is extended, the uncertainty in the GNSS data or levelling data is reduced, or both.
Notes:
- Linear regression of the tide gauge height data indicates the tide gauge movement is -2.2 ± 1.2 mm/yr at 95% Confidence Interval.
Notes:
- Combined analysis from GNSS and levelling show the tide gauge movement -0.6 ± 1.4 mm/yr at 95% Confidence Interval.
- This uncertainty is greater than the trend. This means the tide gauge movement is not certain.
- Tide gauge movement for absolute sea level analysis should be assumed to be 0 mm/yr until the time series is extended, the uncertainty in the GNSS data or levelling data is reduced, or both.
Notes:
- Linear regression of the tide gauge height data indicate the tide gauge movement is -7.8 ± 2.2 mm/yr at 95% Confidence Interval between 2010 and 2019.
Notes:
- Tide gauge movement for absolute sea level analysis is -2.4 ± 1.6 mm/yr at 95% Confidence Interval between 2009 and 2019.
Notes:
- Levelling data observed in 2008.77 was removed from the trend analysis because the tide gauge was in the incorrect position after being hit by a boat.
- Tide gauge movement for absolute sea level analysis since the tide gauge was re-established following the boat strike is -7.2 ± 2.3 mm/yr at 95% Confidence Interval between 2010 and 2019.
- No levelling has been undertaken between 2020 and 2022 in which time the GNSS site has risen by approximately 2 cm.
Notes:
- Tide gauge movement for absolute sea level analysis is -1.3 ± 1.2 mm/yr at 95% Confidence Interval between 2003 and 2018.
- No GNSS data was available at the time the 2019 levelling survey was undertaken.
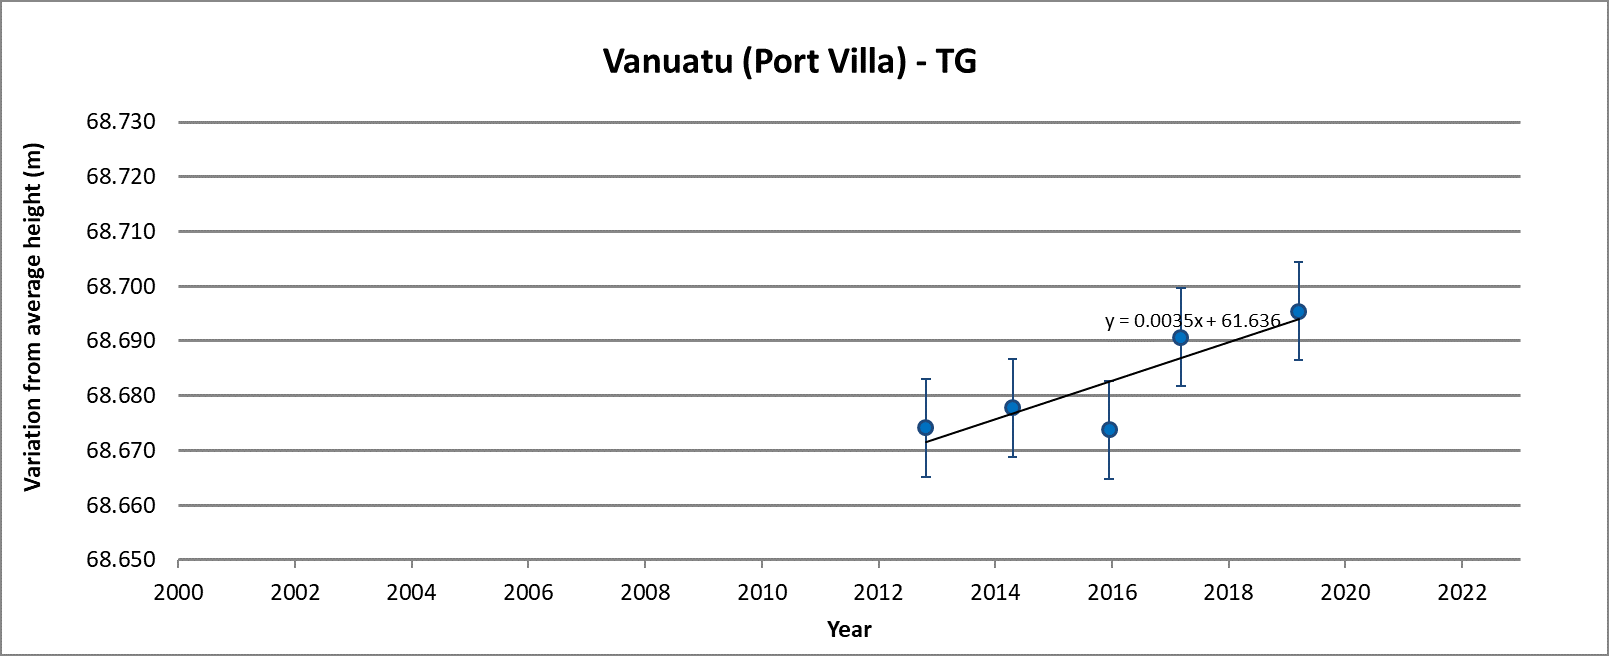
Notes:
- Tide gauge movement for absolute sea level analysis is 3.5 ± 2.8 mm/yr at 95% Confidence Interval between 2009 and 2019.