Australia's Energy Commodity Resources 2026 Gas
Page last updated:10 August 2026
|
TDR 240,366 PJ (2.9%) | |
|
Reserves (2P) 99,124 PJ (6.8%) |
|
Production 6,353 PJ (1.4%) | |
|
Exports 4,420 PJ (0.7%) $67.4 b (9.3%) |
|
Production World Ranking 7 (3.6%) | |
|
Export World Ranking 3 (19.6%) |
Notes
Statistics are for 2024, percentage increases or decreases are relative to 2023. World rankings are followed by percentage share in brackets. TDR – total demonstrated resources (2P reserves plus 2C contingent resources); PJ – petajoules; $b – billion dollars (Australian).
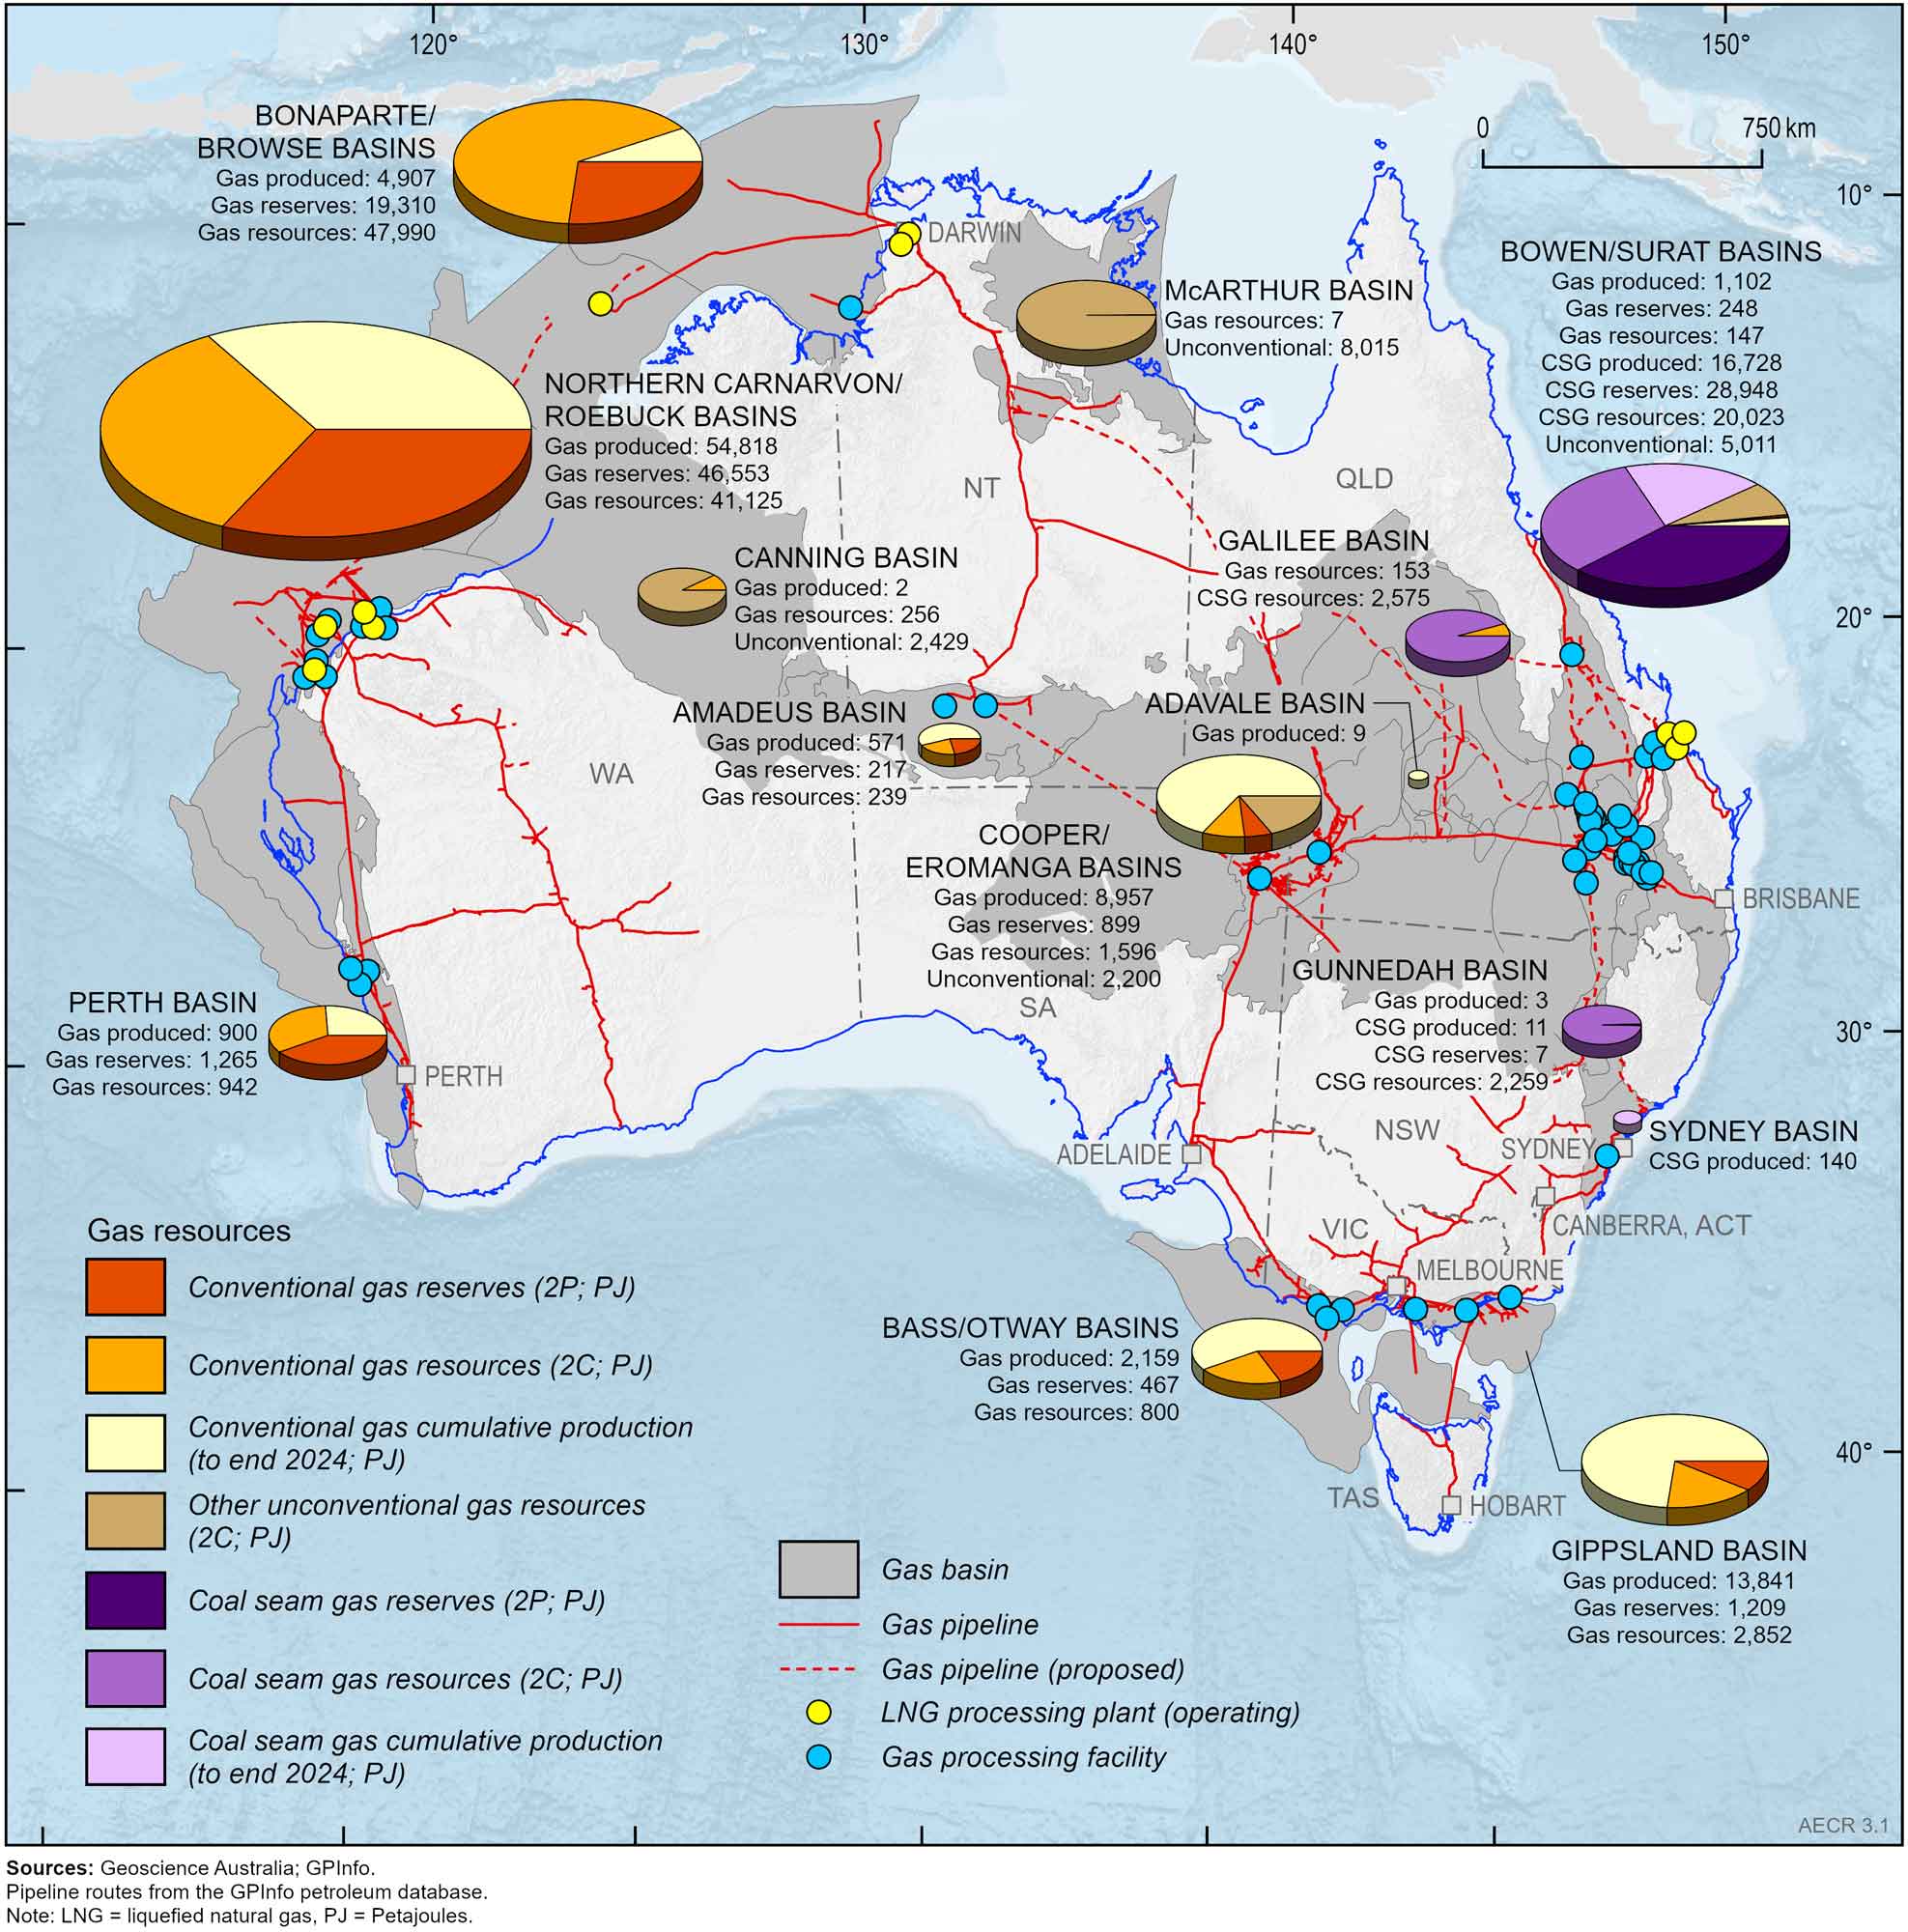
Figure 3.1 Australia’s remaining gas reserves (2P) and contingent resources (2C) during 2024 and cumulative production to the end of 2024 (PJ). For physical units (Tcf) refer to Table 3.1, Table 3.2 and Table 3.3.
Highlights
- Australia has substantial conventional gas resources that are located mostly off the northwest coast of Western Australia, and significant onshore unconventional (coal seam gas, shale gas, and tight gas) resources (Figure 3.1). In 2024, Australia’s TDR for its conventional and unconventional gas is estimated at 240,366 PJ (214 trillion cubic feet [Tcf]), of which 99,124 PJ (88 Tcf) are classified as proven and probable (2P) reserves.
- Conventional gas and coal seam gas (CSG) remain Australia’s most important gas resources for energy generation and export. However, these resources are being depleted at a faster rate than they are being replaced by new discoveries (Figure 3.2).
- Australia’s proven and probable (2P) reserves for conventional gas in 2024 are estimated as 70,169 petajoules (PJ; 62.39 Tcf), a decline of 4,417 PJ (4.5%) from 2023, while for coal seam gas, proven and probable reserves are estimated at 28,955 PJ (25.75 Tcf) in 2024, a decrease of 1,607 PJ (5.4%) from 2023.
- In 2024, Australia’s identified contingent (2C) conventional gas resources are estimated as 96,107 PJ (85.46 Tcf), a decrease of 3,932 PJ (3.9%) from 2023; while coal seam gas contingent resources are estimated at 24,857 PJ (22.10 Tcf), a decrease of 448 PJ (1.8%) from 2023 (Table 3.1 and Table 3.2; Figure 3.1).
- About 93% of conventional gas resources are located on the North West Shelf where gas is produced from the Northern Carnarvon, Browse and Bonaparte basins, providing feedstock to seven LNG projects (Gorgon, Wheatstone, North West Shelf, Pluto, Prelude, Ichthys and Darwin).
- Additional unconventional gas resources in Australia include tight gas, shale gas, basin-centred gas, deep coal gas and in-situ coal gasification resources, which in 2024 totalled 20,278 PJ (18.03 Tcf). Unconventional gas resources grew 20% in 2024, due to increases in identified resources in the Bowen Basin (1,534 PJ) and Beetaloo Sub-basin (1,808 PJ). Currently there is no production of these unconventional gas resources in Australia.
- In 2024, annual gas production was 6,353 PJ, representing a 1.4% increase primarily due to increased output from the Browse/Bonaparte and Bowen/Surat basins. Based on the 2024 production rate, the identified conventional and unconventional gas reserves (2P) may support the equivalent of 16 years of further production.
- About 70% of Australia’s annual natural gas production was exported in 2024.
- During 2024, Australia was the seventh largest gas producer globally and LNG exports remained at unprecedented levels, with 81.2 million tonnes (Mt; 4,420 PJ) of gas exported, making Australia the world’s third largest LNG exporter.
- As of October 2024, Australia had 13 committed major LNG and gas projects valued at A$37.7 billion, representing 58% of value for resource projects at this stage of development (DISR, 2024).
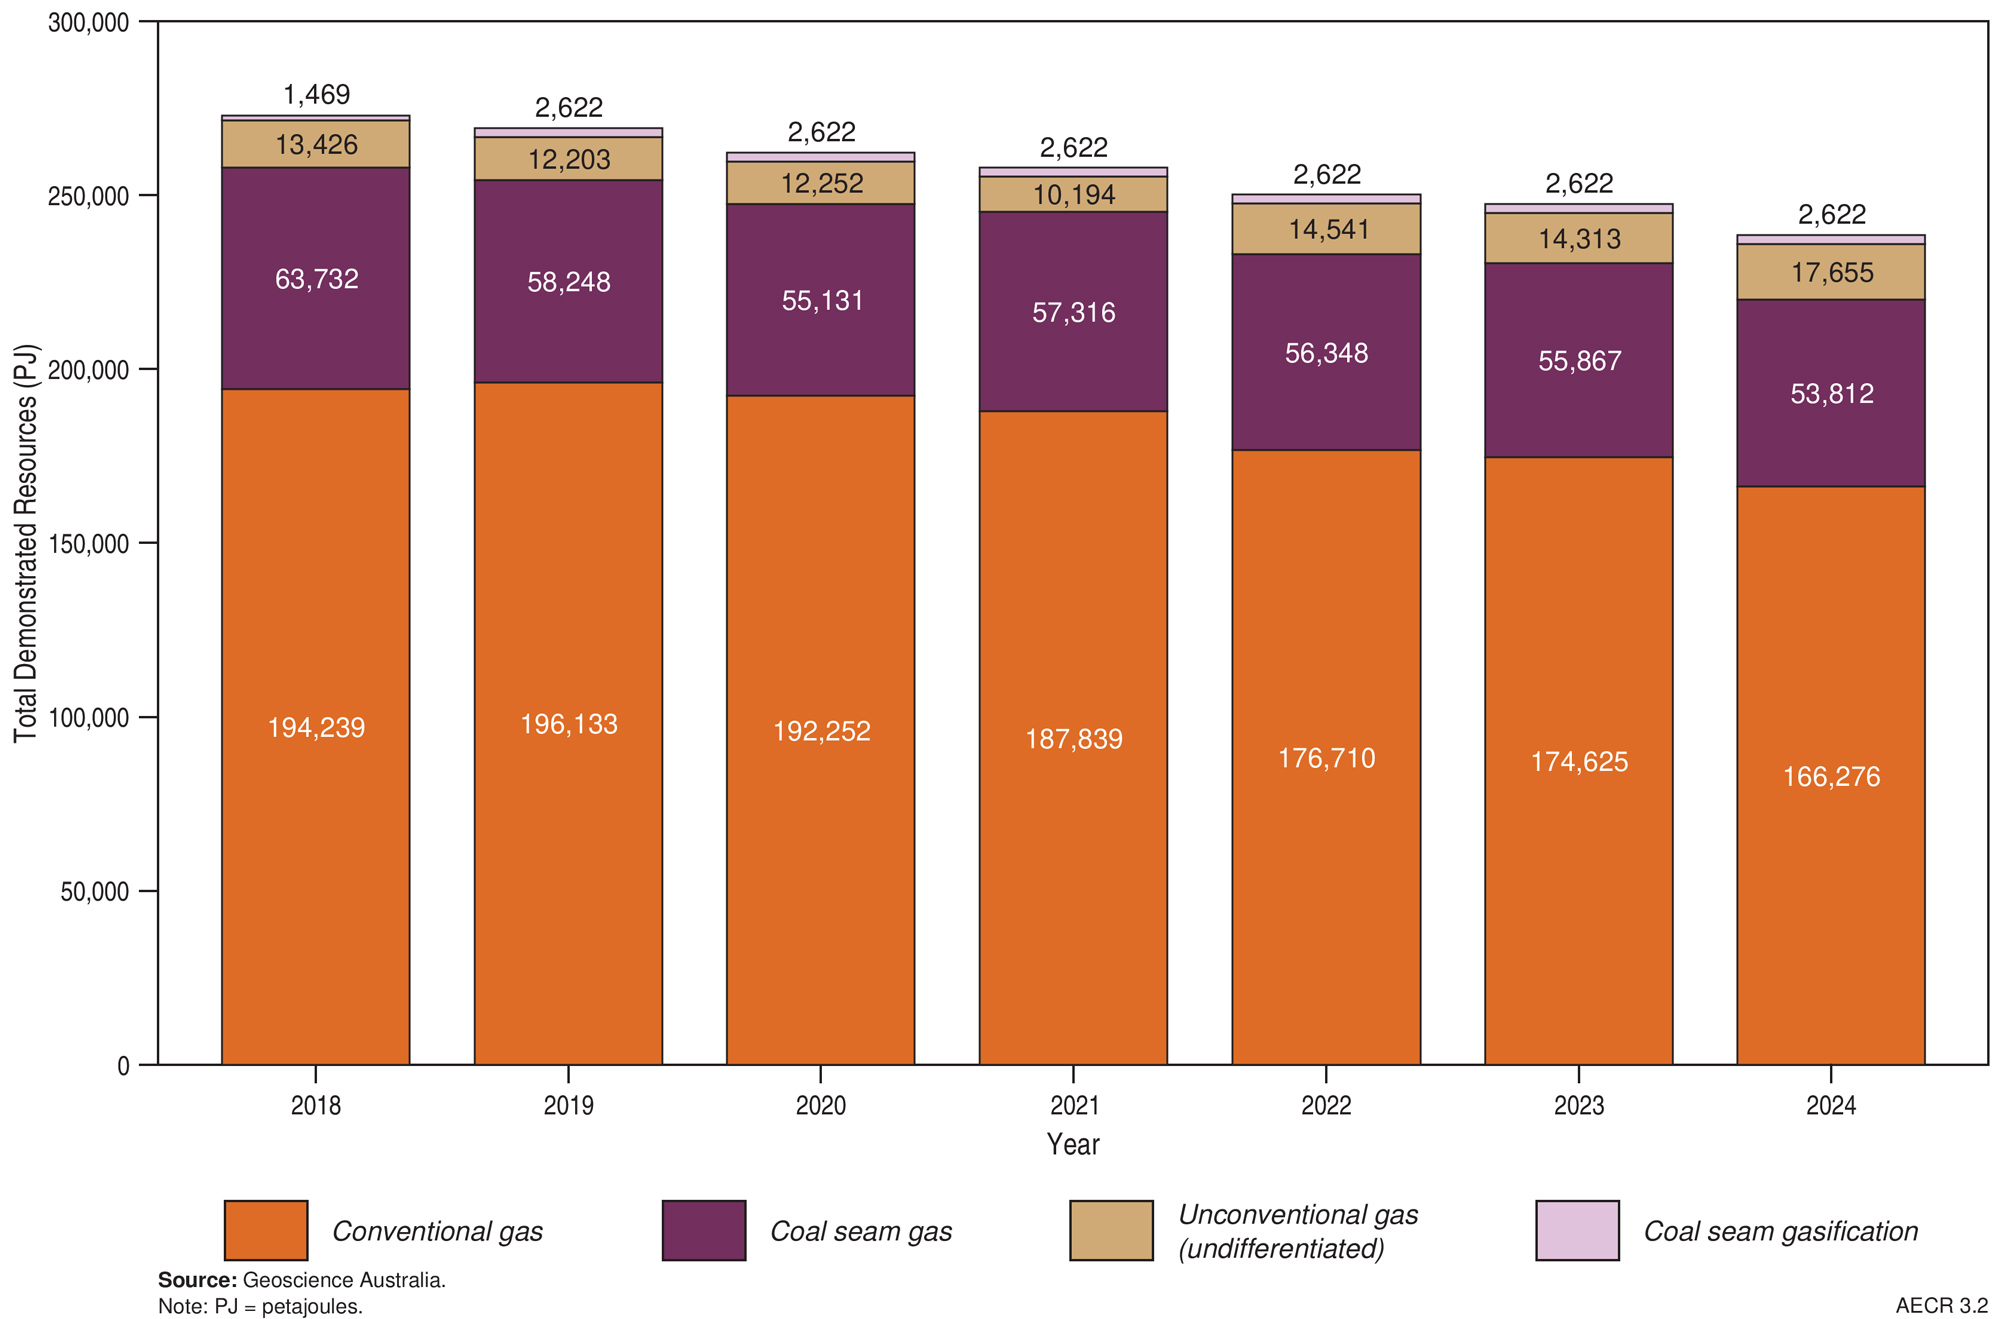
Figure 3.2 Trends in Australia’s total demonstrated gas resources, 2018 to 2024
Identified gas resources
The majority of the remaining identified conventional gas resources occur in basins on Australia’s North West Shelf, while onshore basins in Queensland hold the greatest quantity of identified remaining coal seam gas resources (Figure 3.1, Table 3.1, Table 3.2). Other unconventional gas resources are located in onshore basins in the Northern Territory, Western Australia and Queensland, these include tight gas, shale gas, basin-centred gas, deep coal gas (Table 3.3) and in-situ coal gasification resources.
Australia’s estimated conventional gas resources in 2024 include 70,169 petajoules (PJ; 62.39 Tcf) of 2P reserves, accounting for nearly three-quarters (71%) of Australia’s total remaining 2P gas reserves and 96,107 PJ (85.46 Tcf) of 2C contingent resources. Aggregating Australia’s 2P reserves and 2C contingent resources provides a total of 166,276 PJ (147.85 Tcf) of identified conventional gas resources—a decrease of 8,349 PJ (4.8%) from 2023. About 93% of identified conventional gas resources are located offshore along the North West Shelf of Australia. Additional conventional resources held in the Bass Strait (Gippsland, Bass/Otway) and onshore basins are important for domestic supply. Based on 2024 production rates of 4,688 PJ (4.17 Tcf), the estimated life for Australia’s reported conventional gas reserves is 15 years.
Table 3.1 Australia's remaining conventional gas reserves (2P), contingent resources (2C) and annual production during 2024, and cumulative production to 31 December 2024.
| Basin | Conventional gas | |||||||
|---|---|---|---|---|---|---|---|---|
| Annual Production | Cumulative Production | Reserves (2P) | Resources (2C) | |||||
| PJ | Tcf | PJ | Tcf | PJ | Tcf | PJ | Tcf | |
| Adavale | 0 | 0 | 9 | 0.00 | 0 | 0 | 0 | 0 |
| Amadeus | 13 | 0.01 | 571 | 0.51 | 217 | 0.19 | 239 | 0.21 |
| Bass/Otway | 76 | 0.07 | 2,159 | 1.92 | 467 | 0.42 | 800 | 0.71 |
| Bonaparte/Browse | 819 | 0.73 | 4,907 | 4.36 | 19,310 | 17.17 | 47,990 | 42.67 |
| Bowen/Surat | 13 | 0.01 | 1,102 | 0.98 | 248 | 0.22 | 147 | 0.13 |
| Canning | 0 | 0 | 2 | <0.001 | 0 | 0 | 256 | 0.23 |
| Northern Carnarvon/ Roebuck | 3,392 | 3.02 | 54,818 | 48.74 | 46,553 | 41.39 | 41,125 | 36.57 |
| Cooper/Eromanga | 89 | 0.08 | 8,957 | 7.97 | 899 | 0.80 | 1,596 | 1.42 |
| Galilee | 0 | 0 | 0 | 0 | 0 | 0 | 153 | 0.14 |
| Gippsland | 260 | 0.23 | 13,841 | 12.31 | 1,209 | 1.08 | 2,852 | 2.54 |
| Gunnedah | 0 | 0 | 3 | 0.003 | 0 | 0 | 0 | 0 |
| McArthur | 0 | 0 | 0 | 0 | 0 | 0 | 7 | 0.01 |
| Perth | 28 | 0 | 900 | 0.79 | 1,265 | 1.12 | 942 | 0.84 |
| Total | 4,688 | 4.17 | 87,269 | 77.58 | 70,169 | 62.39 | 96,107 | 85.46 |
| Change from 2023 (PJ/Tcf) | 17 | 0.01 | 5,297 | 4.71 | 4,417 | 3.93 | 3,932 | 3.49 |
| Change from 2023 (%) | 0.4% | 0.4% | 6.5% | 6.5% | 5.9% | 5.9% | 3.9% | 3.9% |
Abbreviations
PJ = petajoules. Tcf = trillion cubic feet.
Notes
Data from the former Joint Petroleum Development Area (JPDA) have been omitted from Bonaparte Basin totals. Refer to Box 1.1 in the Overview and Appendix 4 Resource classification for information on energy resource estimates and terminology.
Data Sources: Offshore data provided by NOPTA to year-end 2024; onshore data are sourced from government statistics and company estimates reported at various dates between June 2024 and June 2025.
Coal seam gas (CSG) is expected to remain Australia’s most important unconventional gas resource in the near term, making up around three-quarters of identified unconventional gas resources. CSG is already a major source for domestic gas and LNG exports in eastern Australia. Almost all reported CSG reserves and contingent resources are located in Queensland; the remainder are in New South Wales (Figure 3.1; Table 3.2).
In 2024, Australia’s estimated proven and probable (2P) reserves for CSG total 28,955 PJ (25.75 Tcf), and 24,857 PJ (22.10 Tcf) of 2C contingent CSG resources. Aggregating Australia’s 2P reserves and 2C contingent resources provides a total estimate of 53,812 PJ (47.85 Tcf) of CSG identified resources, a decline of 3.7% (2,055 PJ). Based on 2024 production rates (1,593 PJ; 1.42 Tcf), Australia’s CSG reserves have an estimated life of 17 years. Identified resources may support further production if all conditions, or contingencies, relating to their development can be satisfied.
Table 3.2 Australia's remaining coal seam gas reserves (2P), contingent resources (2C) and annual production during 2024, and cumulative production to end 2024.
| Basin | Coal seam gas | |||||||
|---|---|---|---|---|---|---|---|---|
| Annual Production | Cumulative Production | Reserves (2P) | Resources (2C) | |||||
| PJ | Tcf | PJ | Tcf | PJ | Tcf | PJ | Tcf | |
| Bowen/Surat | 1,663 | 1.48 | 16,728 | 14.87 | 28,948 | 25.74 | 20,023 | 17.80 |
| Galilee | 0 | 0 | 0 | 0 | 0 | 0 | 2,575 | 2.29 |
| Gunnedah | 2 | 0.001 | 11 | 0.01 | 7 | 0.01 | 2,259 | 2.01 |
| Sydney | 0.0 | 0.000 | 140 | 0.13 | 0 | 0 | 0 | 0 |
| Total | 1,665 | 1.48 | 16,879 | 15.01 | 28,955 | 25.75 | 24,857 | 22.10 |
| Change from 2023 (PJ/Tcf) | 71 | 0.06 | 1,665 | 1.48 | 1,607 | 1.43 | 448 | 0.40 |
| Change from 2023 (%) | 4.5% | 4.5% | 10.9% | 10.9% | 5.3% | 5.3% | 1.8% | 1.8% |
Abbreviations
PJ= Petajoules. Tcf = Trillion cubic feet.
Notes
Refer to Box 1.1 in the Overview and Appendix 4 Resource classification for information on energy resource estimates and terminology.
Sources: Data are sourced from government statistics and company estimates reported at various dates between June 2024 and June 2025.
Other unconventional gas resources in Australia include tight gas, shale gas, basin-centred gas, deep coal gas and in-situ coal gasification resources. Tight gas and shale gas occur in reservoirs with low (i.e., nano-Darcy) permeability and require hydraulic stimulation for gas production. Basin-centred gas occurs in abnormally pressured, gas-saturated, low-permeability stacked reservoirs within thick sedimentary successions. Deep coal gas is natural gas in deeply buried coal seams, usually more than 1500 m beneath the surface, much deeper than typical coal seam gas (CSG) resources. In-situ coal gasification refers to gas being extracted from coal seams by in-situ heating to produce synthesis (syn) gas.
Unconventional gas resources have been identified in the Cooper, Canning, Bowen/Surat, McArthur (Beetaloo Sub-basin) and Telford basins. During 2024, Australia’s 2C contingent resources for unconventional deep coal, basin-centred, tight and shale gas totalled 17,655 PJ (15.70 Tcf; Table 3.3). Shale gas resources in the Beetaloo Sub-basin of the greater McArthur Basin, being appraised by Tamboran Resources, Empire Energy and Santos, accounted for more than 45% of the total and increased by 29% (1,808 PJ) in 2024 to 8,015 PJ (7.13 Tcf). Identified (2C) unconventional tight, deep coal and shale gas resources in the Bowen Basin grew 44% (1,534 PJ) in 2024 to 5,011 PJ (4.46 Tcf), due to a more than doubling of resources reported for the Grandis Gas Project (Elixir Energy) in the Taroom Trough. Currently, there are no published reserves data for shale, tight or basin centred gas, reflecting the early stage of unconventional gas exploration and development in Australia.
Additional unconventional contingent gas resources are reported from an in-situ coal gasification demonstration plant at Leigh Creek in South Australia (NeuRizer Ltd, 2024). The total reported resources of syngas for the Leigh Creek Energy Project in the Telford Basin are 2,622 PJ (2.33 Tcf; Table 3.4). This project has been submitted to obtain regulatory approvals under the Environment Protection and Biodiversity Conservation Act, 1999, and is currently under assessment.
Table 3.3 Australia's other unconventional gas reserves (2P) and contingent resources (2C) during 2024.
| Basin | Type | Unconventional Gas | Data Source | |||
|---|---|---|---|---|---|---|
| Reserves (2P) | Resources (2C) | |||||
| PJ | Tcf | PJ | Tcf | |||
| Beetaloo (Sub-basin) | Shale gas | 0 | 0 | 8,015 | 7.13 |
Empire Energy (2023); Tamboran Resources (2024) |
| Bowen/Surat |
Basin-centred gas; Deep coal gas; Tight gas | 0 | 0 | 5,011 | 4.46 |
Elixir Energy Ltd (2025); Omega Oil & Gas Ltd (2023) |
| Canning |
Basin centred gas; Tight gas | 0 | 0 | 2,429 | 2.16 |
Buru Energy (2018); Black Mountain Energy (2022) |
| Cooper/Eromanga |
Basin centred gas; Tight gas | 0 | 0 | 2,200 | 1.96 |
Pure Hydrogen (2025); Icon Energy (2025); Beach Energy (2025) |
| Total | 0 | 0 | 17,655 | 15.70 | ||
| Change from 2023 (PJ/Tcf) | ̵ ̵ | ̵ ̵ | 3,342 | 2.97 | ||
| Change from 2023 (%) | 23.4% | 23.4% | ||||
Abbreviations
PJ = petajoules; Tcf = trillion cubic feet.
Notes
Refer to Box 1.1 in the Overview and Appendix 4 Resource classification for information on energy resource estimates and terminology.
Table 3.4 Australia's syngas gas resources during 2024.
| Basin | Type | Unconventional Gas | Data Source | |||
|---|---|---|---|---|---|---|
| Reserves (2P) | Resources (2C) | |||||
| PJ | Tcf | PJ | Tcf | |||
| Telford* | Syngas | 0 | 0 | 2,622 | 2.33 | NeuRizer Ltd (2024) |
| Total | 0 | 0 | 2,622 | 2.33 | ||
Abbreviations
PJ = petajoules; Tcf = trillion cubic feet.
Notes
*Syngas reserves and resources in the Telford Basin are associated with the Leigh Creek Energy Project. This project is subject to approvals under the Environment Protection and Biodiversity Conservation Act, 1999, and is currently under assessment. As such all reported reserves and resources are considered contingent.
Exploration
Petroleum exploration activity has been low since 2016, with current spending at only one-third of what it was a decade ago. However, petroleum exploration expenditure continued to recover in 2024, increasing 25% (A$274 million) to A$1,367 million. Onshore expenditure rose by 28% to A$859 million, while offshore exploration increased by 21% to A$507 million (ABS, 2025). The majority of spending is now directed onshore, accounting for nearly two-thirds of total expenditure.
Overall, exploration outcomes in 2024 and 2025 reinforced gas as the central focus of Australia’s upstream petroleum sector. In 2024, a total of 24 exploration and 60 appraisal wells drilled (Slater, 2025), onshore jurisdictions dominated, reflecting ongoing CSG operations and the application of unconventional development models proven overseas. About two-thirds of appraisal drilling (39 wells) assessed CSG resources in Queensland, most other onshore drilling occurred in the Perth and Cooper/Eromanga basins (Slater, 2025). There were no offshore petroleum exploration or appraisal wells drilled in 2024. Two exploration wells were drilled in the offshore Bonaparte Basin to assess suitability for geological carbon storage; all other offshore wells (34) were for development on the North West Shelf (NOPTA, 2026).
Onshore drilling dominated both exploration and appraisal activities again in 2025, accounting for 23 of 28 exploration wells and 24 of 29 appraisal wells (McKerron, 2026). Five offshore exploration wells were spudded in 2025: three in the Otway Basin (Hercules 1, Essington 1 and Charlemont 1) and two in the Northern Carnarvon Basin (Wheatstone Deep 1 and Dino South 1). Of these, Essington 1 and Charlemont 1 were deemed gas discoveries (3D Energi, 2025, 2026), Hercules 1 was dry, and results for Wheatstone Deep 1 and Dino South 1 are yet to be announced. A further 15 offshore development wells were drilled in 2025, mostly on the North West Shelf (NOPTA, 2026). In December 2025, the Australian Government released five new offshore petroleum exploration areas in the Otway Basin, located in Commonwealth waters (Geoscience Australia, 2025).
Production and trade
During 2024, gas production in Australia remained relatively steady at 6,353 PJ (5.65 Tcf), increasing by 1.4% (89 PJ) from 2023. Approximately three-quarters of the total production came from conventional sources, primarily from the North West Shelf (Northern Carnarvon and the Browse/Bonaparte basins) which accounted for 90% (4,210 PJ; 3.74 Tcf) of conventional production to the end of 2024 (Table 3.1; Figure 3.1). The remaining conventional production was sourced from the Bass Strait (Gippsland, Bass/Otway), Perth, Cooper/Eromanga, Bowen/Surat and Amadeus basins, which are key contributors to domestic supply. Coal Seam Gas made up the balance of production, totalling 1,665 PJ (1.48 Tcf) in 2024, with the Bowen/Surat basins in Queensland accounting for nearly all this amount (Table 3.2; Figure 3.1). Figure 3.3 shows the distribution of Australia’s gas fields, pipelines, processing facilities, petroleum permits and ports.
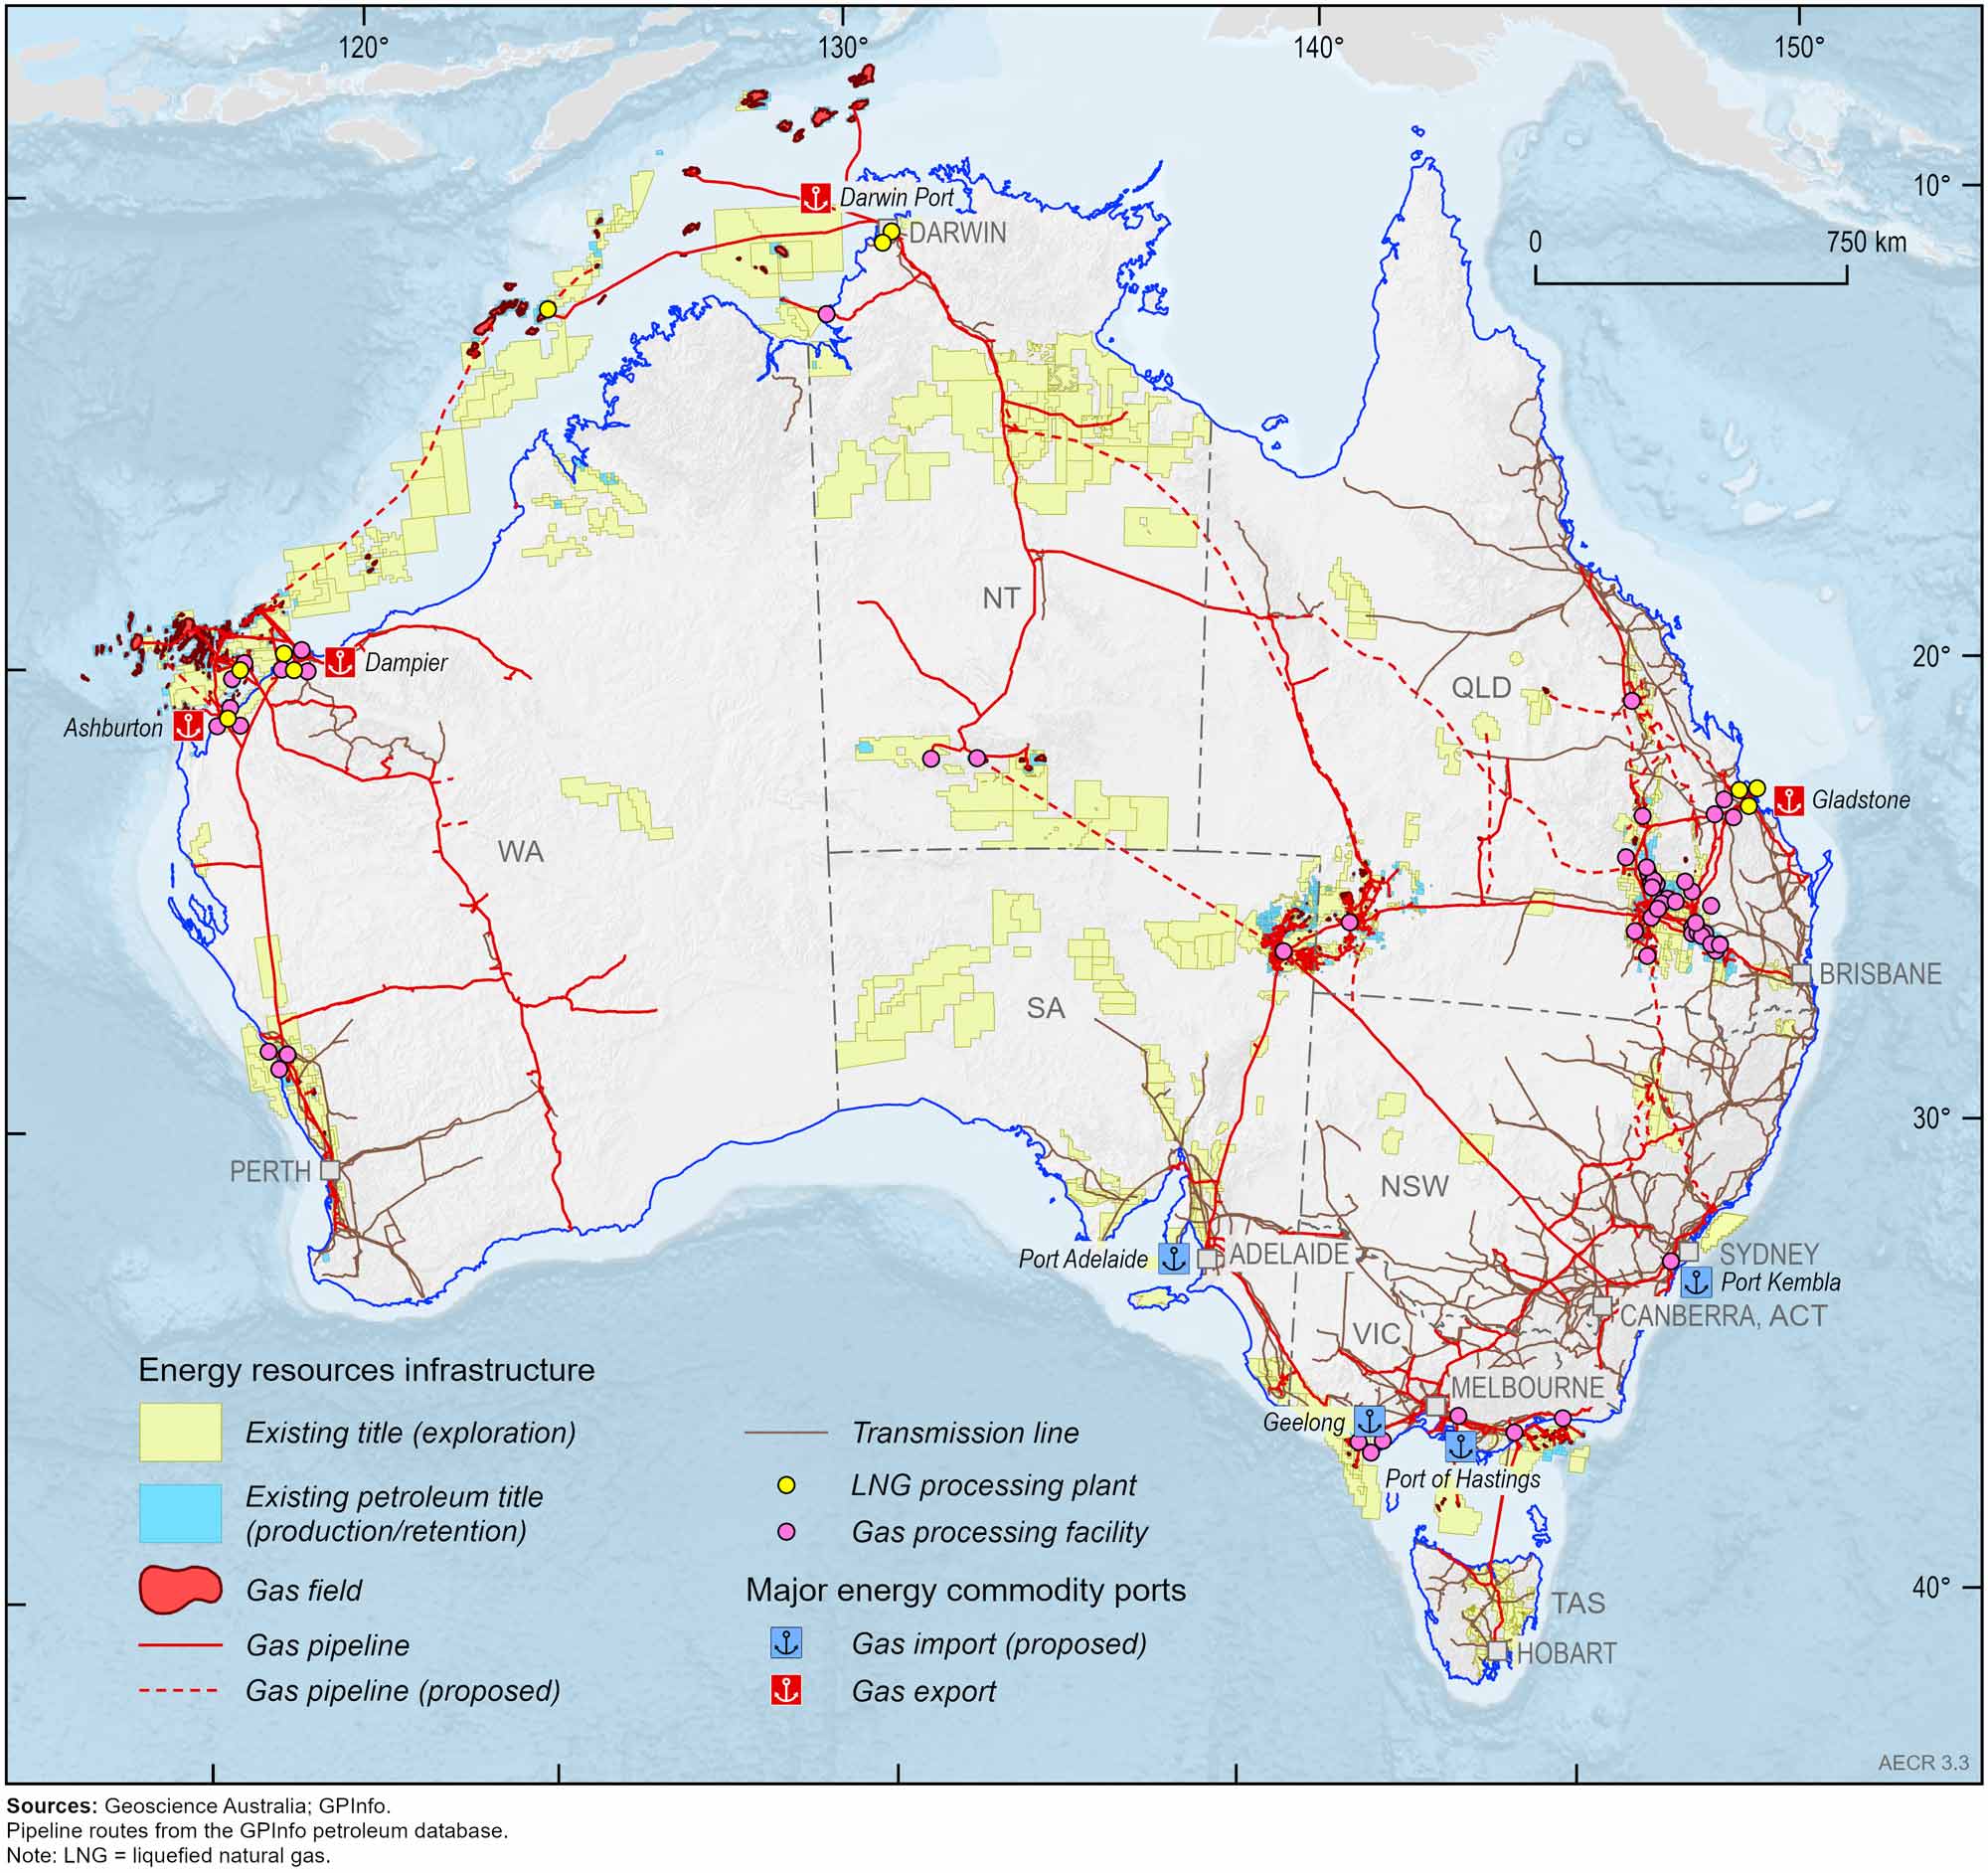
Figure 3.3 Australia’s petroleum permits, gas fields and infrastructure
Australia is a substantial net exporter of natural gas, exporting about 70% of produced volumes as LNG in 2024. Over the past decade, LNG exports from Australia have increased by an average of 13% per year (Figure 3.4), with several new facilities commencing production during this period. Australia is the world’s third largest LNG exporter. After peaking in 2021–22 at 4,637 PJ (83.2 Mt), Australia’s LNG exports have remained high, with 4,420 PJ (81.2 million tonnes, Mt) exported in 2024, slightly up on the 4,388 PJ (80.7 Mt) exported in 2023. In 2024, Australia’s LNG export earnings totalled $67.4 billion (Figure 3.5), down 9% from 2023 (DISR, 2025) as prices normalised following the 2022–23 global energy price surge. Australia did not import gas in 2024. Previously, small volumes were imported from Timor-Leste, produced in the former Joint Petroleum Development Area and liquefied in Darwin for export (DISR, 2025).
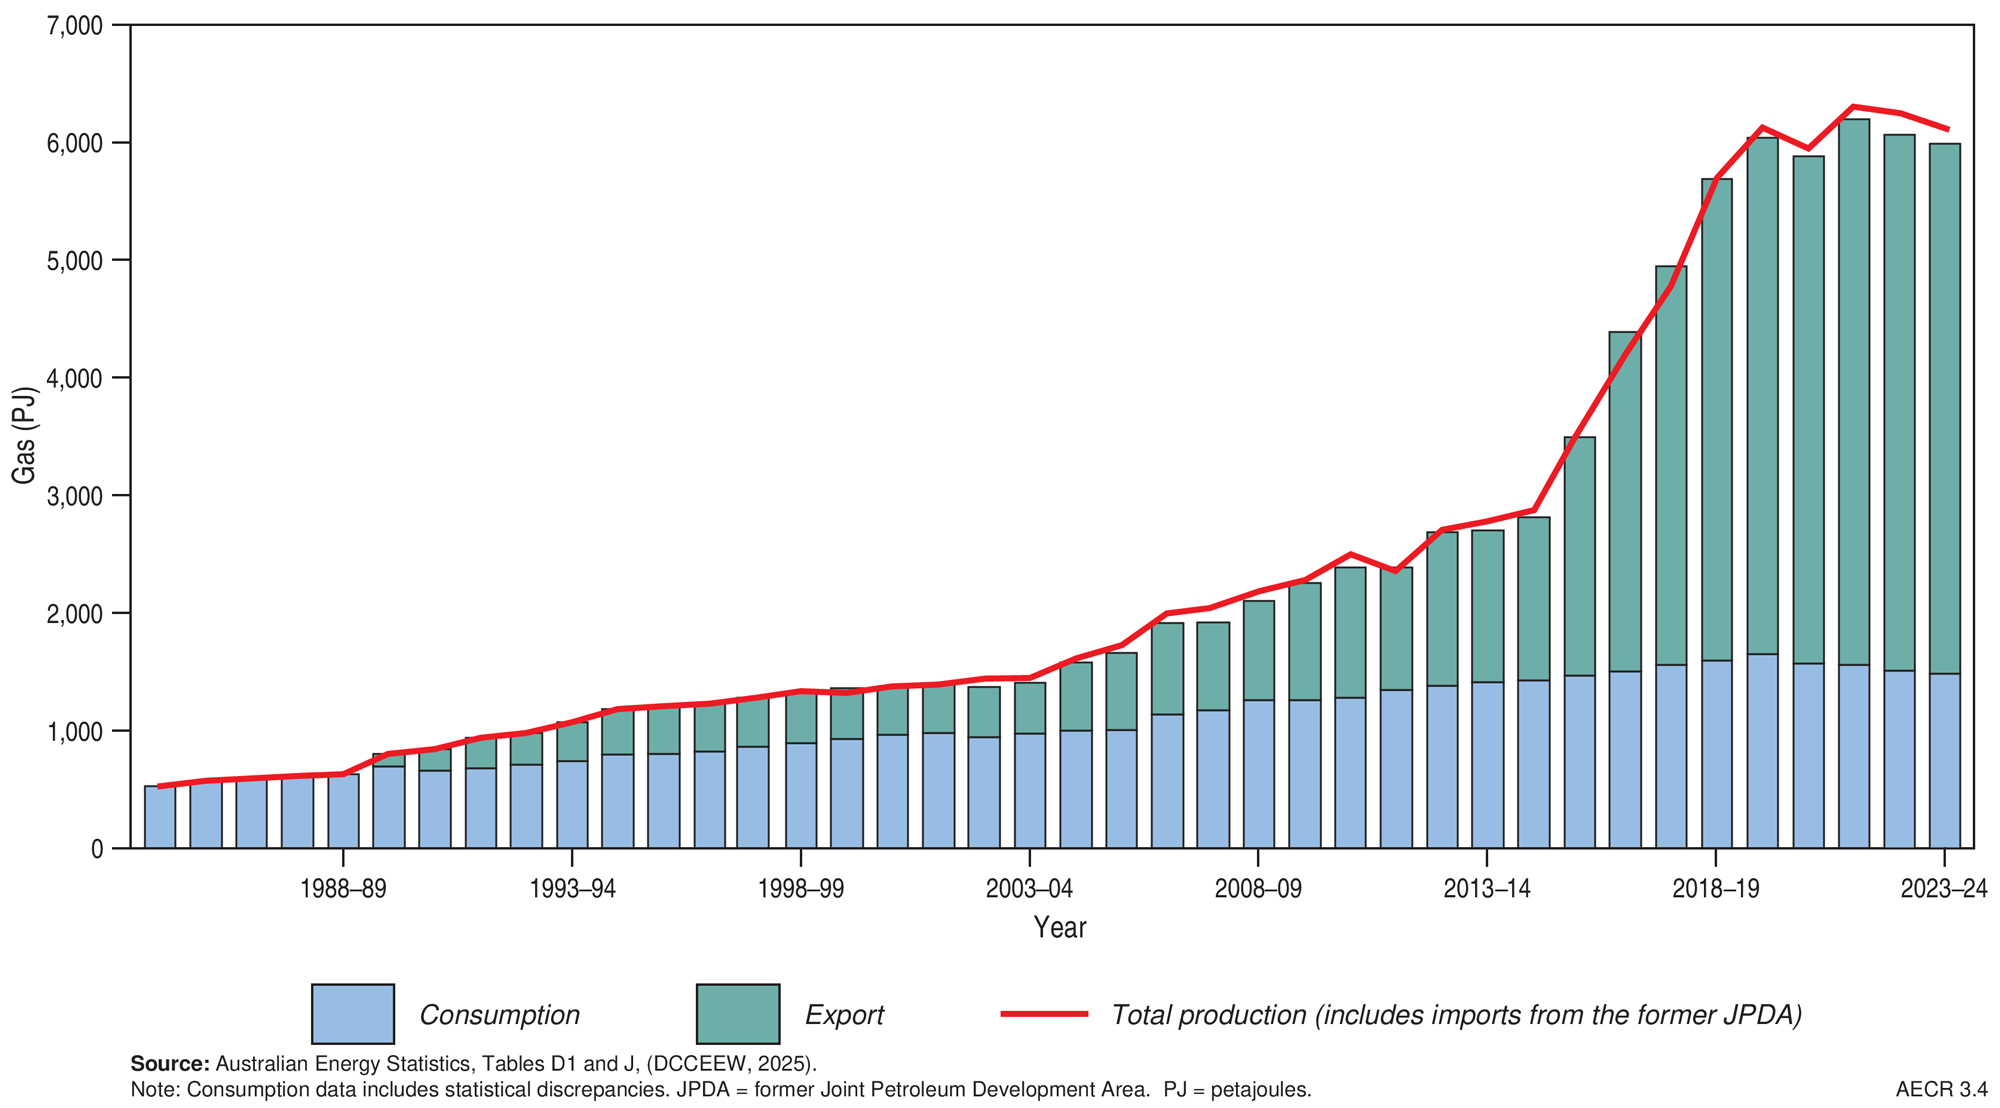
Figure 3.4 Australia’s gas production, consumption and LNG exports, 1984–2024
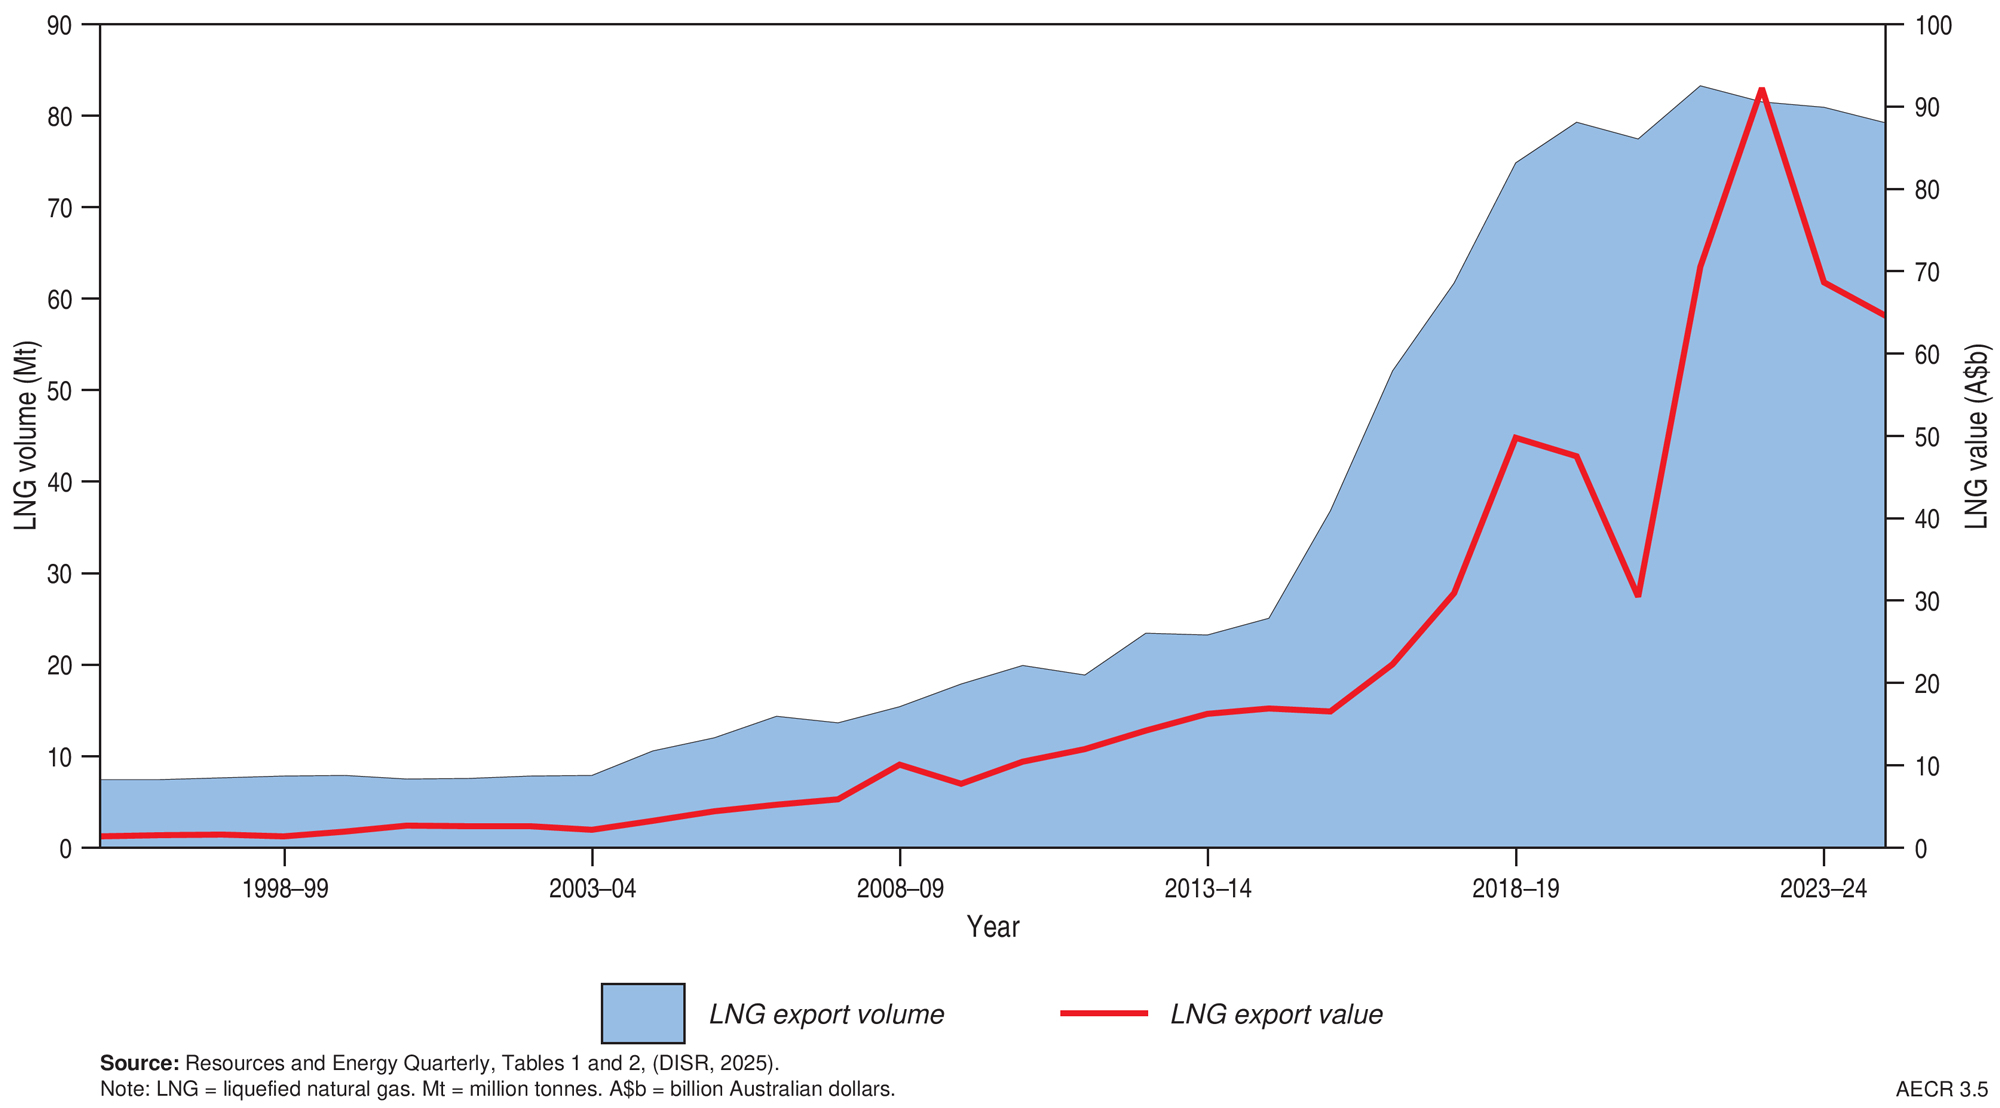
Figure 3.5 Australia’s LNG export volumes and values, 1994–2024
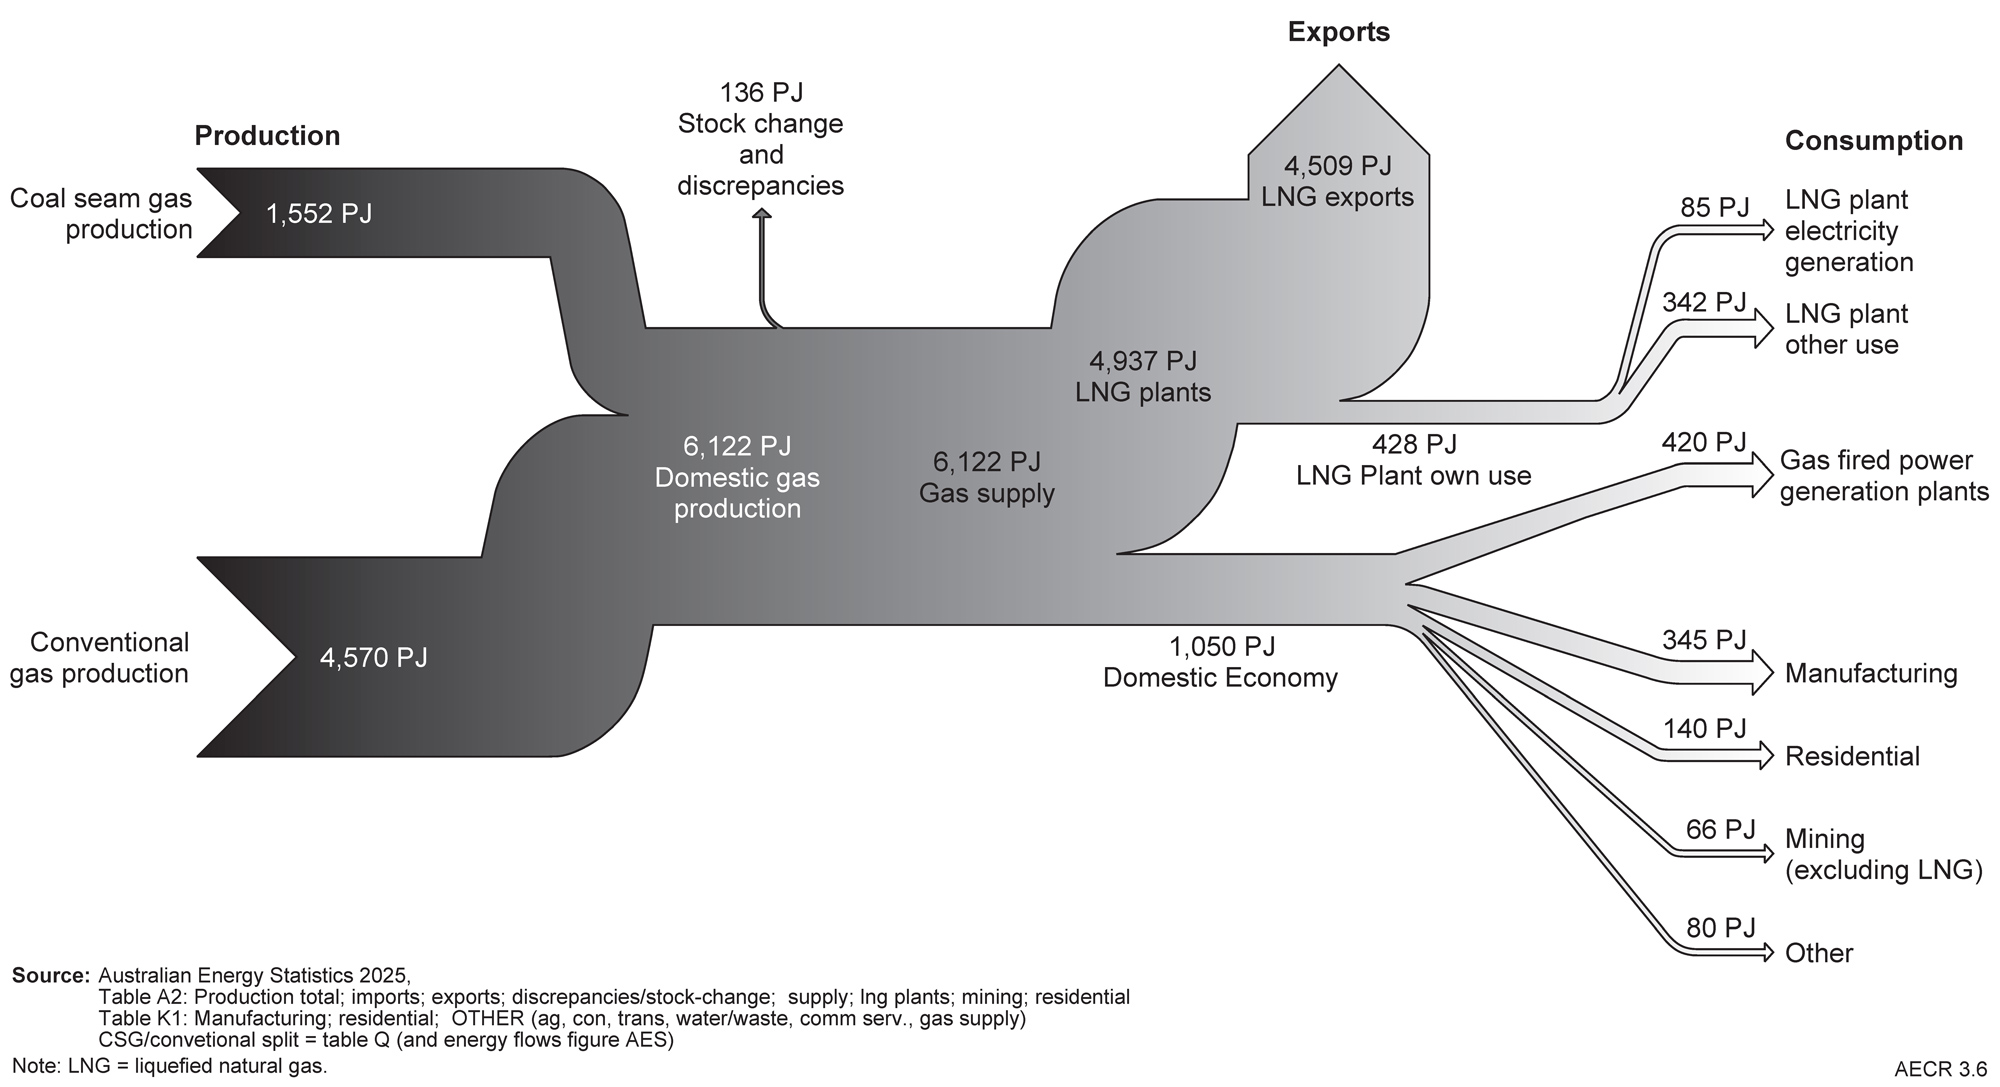
Figure 3.6 Australia’s gas flow from production to consumption, 2023–24
Global natural gas trade rose 3.3% (1.1 Tcf; ~1,111 PJ) in 2024, mainly due to a 7.9% (1.1 Tcf; 1,145 PJ) increase in pipeline trade. Growth in pipeline exports were led by Russia (up 21.5%; 0.7 Tcf; 698 PJ), North America (up 5.2%; 0.3 Tcf; 318PJ) and the Middle East (up 22.6%; 0.1 Tcf; 114 PJ). In 2024, global LNG trade experienced a slight decrease of 0.5%, after ten years of averaging annual growth of 5.1%. Most exporters maintained similar levels of LNG exports compared to 2023, with changes generally within approximately 100 PJ (0.1 Tcf). Russia led export growth, increasing by 5% (0.1 Tcf; 81 PJ), while Egypt saw the most significant drop, down 82% (0.14 Tcf; 144 PJ) (Energy Institute, 2025).
References
3D Energi, 2025. Essington-1 Intersects Two Gas-Bearing Waarre Reservoirs, ASX announcement 17 November 2025. (Last accessed 6 May 2026).
3D Energi, 2026. Charlemont-1 Gas Discovery, ASX announcement 14 January 2026. (Last accessed 6 May 2026).
ABS (Australian Bureau of Statistics), 2025. Mineral and Petroleum Exploration, Australia, Table 5. (last accessed February 2026). (Last accessed 6 May 2026).
DCCEEW (Department of Climate Change, Energy, the Environment and Water), 2025. Australian Energy Statistics, 2025. Tables A2, D1, F, J and Q3. (Last accessed 6 May 2026).
DISR (Department of Industry, Science and Resources), 2024. Resources and Energy Major Projects: 2024. (Last accessed May 2026).
DISR (Department of Industry, Science and Resources), 2025. Resources and Energy Quarterly: September 2025. (Last accessed 6 May 2026).
Energy Institute, 2025. Statistical Review of World Energy. (Last accessed 6 May 2026).
Geoscience Australia, 2025. Acreage Release. (Last accessed 6 May 2026).
McKerron, A., 2026. Exploration year in review: 2025. Australian Energy Producers Journal 66, EP26002.
NeuRizer Ltd, 2024.
NOPTA (National Offshore Petroleum Titles Administrator) 2026. National Offshore Petroleum Information Management System (NOPIMS). (Last accessed 6 May 2026).
Slater, S., 2025. 2024: exploration year in review. Australian Energy Producers Journal 65, EP25023.
Note: refer to Appendix 5 for references regarding onshore gas reserves, contingent resources and production data
Data download
Data tables and full report are downloadable from the Geoscience Australia website.