Australia's Energy Commodity Resources 2026 Australia's energy production and trade
Page last updated:10 August 2026
The outlook for Australian energy production from gas, oil, coal and uranium is tied to global trends in demand, supply and pricing. This section provides an overview of Australia’s energy production and trade during the 2023–24 financial year. It draws on the data and information published in the Australian Energy Update (DCCEEW, 2025a), together with Resources and Energy Quarterly data published by the Office of the Chief Economist (DISR, 2025).
Highlights for 2023–24:
- Australia continued to be a net exporter of energy commodities, with total exports nearly eight times total imports (Table 2.1).
- Australia ranked as the eighth highest primary energy producer across the globe, accounting for around 3.7% of global energy commodity production in 2024.
- After record earnings in 2021–22 and 2022–23, Australia’s energy commodity export earnings in 2023–24 declined 24.5% to A$180.2 billion, due to significant decreases in earnings from LNG and coal (Table 2.2).
- Australia maintained its position as one of the world’s largest LNG exporters, ranking third behind Qatar and the US. Approximately 74% of natural gas produced in Australia was exported and LNG exports remained near record levels, decreasing slightly (0.7%) to 4,509 PJ.
- Australia mainly exports light, sweet oils (oil with a low [≤0.5%] sulfur content) from the North West Shelf to Asian refineries. In 2023–24, 96% of crude oil and condensate was exported, dropping 6% to 566 PJ due to reduced output, notably from the Northern Carnarvon Basin (DISR, 2025). LPG exports grew, rising 7% to 128 PJ. Export earnings for crude oil and condensate contracted to A$12.6 billion (down 7%); however, LPG earnings grew strongly to A$2.2 billion (up 39.5%).
- Australia relies heavily on imports for crude oil and refined petroleum products. In the 2023–24 period, total imports reached 2,285 PJ, reflecting a 5% rise in refined product imports and steady crude oil imports.
- Black coal (metallurgical and thermal) is Australia’s largest energy product and export, in 2023–24 both production and exports grew, up 5.7% and 4.7% respectively, recovering from decreases in 2022–23. Despite this, black coal export values contracted 28% to A$91.4 billion, as both metallurgical and thermal coal prices eased.
- Australia is a significant exporter of uranium oxide for use in nuclear power plants. Uranium production and exports both increased in 2023–24, with production up 7.2% to 2,725 PJ, and exports up 4.9% to 2,699 PJ. Export earnings grew strongly (up 47.9%) to A$1.2 billion due to higher prices and export volumes (DISR, 2025).
Table 2.1 Australian energy production, exports and imports by fuel type during the 2023–24 financial year.
| Energy source | Production | Exports | Imports | |||||||
|---|---|---|---|---|---|---|---|---|---|---|
| Petajoules | Share (%) | Growth 2023–24 (%) | Petajoules | Share (%) | Growth 2023–24 (%) | Petajoules | Share (%) | Growth 2023–24 (%) | ||
| Black coal | 11,398 | 52 | 5.7 | 10,057 | 56 | 4.7 | 2 | 0.0 | -58.8 | |
| Brown coal | 416 | 2 | 3.9 | -- | -- | -- | -- | -- | -- | |
| Coal by-products | -- | -- | -- | 17 | 0.1 | -11.9 | 15 | 0.01 | 29.4 | |
| Natural gas/LNG | 6,122 | 28 | -1.3 | 4,509 | 25 | -0.7 | 0 | 0 | -100 | |
| Crude Oil and NGL | 590 | 3 | -5.7 | 566 | 3 | -6.4 | 362 | 15.6 | 0.0 | |
| LPG | 148 | 1 | 1.9 | 128 | 1 | 7.0 | 18 | 0.8 | -10.4 | |
| Refined Products | -- | -- | -- | 15 | 0.1 | -9.7 | 1923 | 82.9 | 5.3 | |
| Uranium | 2,725 | 12 | 7.2 | 2,699 | 15 | 4.7 | -- | -- | -- | |
| Total Energy Commodities | 21,400 | 97 | 0.8 | |||||||
| Renewable Energy | 557 | 3 | 0.6 | -- | -- | -- | -- | -- | -- | |
| Total | 21,957 | 100 | 2.3 | 17,991 | 100 | 2.9 | 2,320 | 100 | 2.1 | |
Notes
Note: Growth 2023–24 (%) relative to 2022–23. The share of production by fuel types differs from that published in the Australian Energy Statistics due to inclusion of uranium in this table.
Source: DCCEEW, 2025a (Table J and S2, 2025).
Australia’s total energy resources production increased by 2.3% to 21,957 PJ in 2023–24 (Table 2.1; Figure 2.1; Figure 2.2), largely due to a 630 PJ (5.6%) increase in total coal production. Uranium energy production continued to grow, up 7.2% to 2,725 PJ. Renewable energy production grew slightly, up 0.6%. Natural gas production fell 1.3% and oil production decreased by 5.7%, while LPG grew slightly (up 1.9%). Australia continued to be a net exporter of energy commodities, with exports totalling nearly eight times imports (Table 2.1; Figure 2.3; Figure 2.5).
In 2023–24 Australia’s overall energy commodity exports grew by 2.9% to 17,991 PJ (Table 2.1), reversing the trend of recent years; the rise in 2023–24 was mostly due to increases in black coal and uranium exports. Energy commodity imports also grew during 2022–23 to 2,320 PJ, up 2.1%, largely driven by a 5.3% increase in imports of refined products such as diesel and gasoline (Figure 2.4). Conversely, imports of natural gas ceased, while crude oil and natural gas liquids (NGL) remained steady.
As at 31 October 2024, there were 24 committed major energy projects with a combined value of about $42.2 billion, dominated by gas projects ($37.7 billion across 13 projects; DISR, 2024). The committed energy pipeline also includes 7 coal projects ($3.7 billion), 4 infrastructure projects ($0.8 billion) and no committed uranium projects. More than 100 additional less mature projects, at the publicly announced and advanced feasibility stages in 2024, indicate potential future investment though these remain subject to higher uncertainty (DISR, 2024).
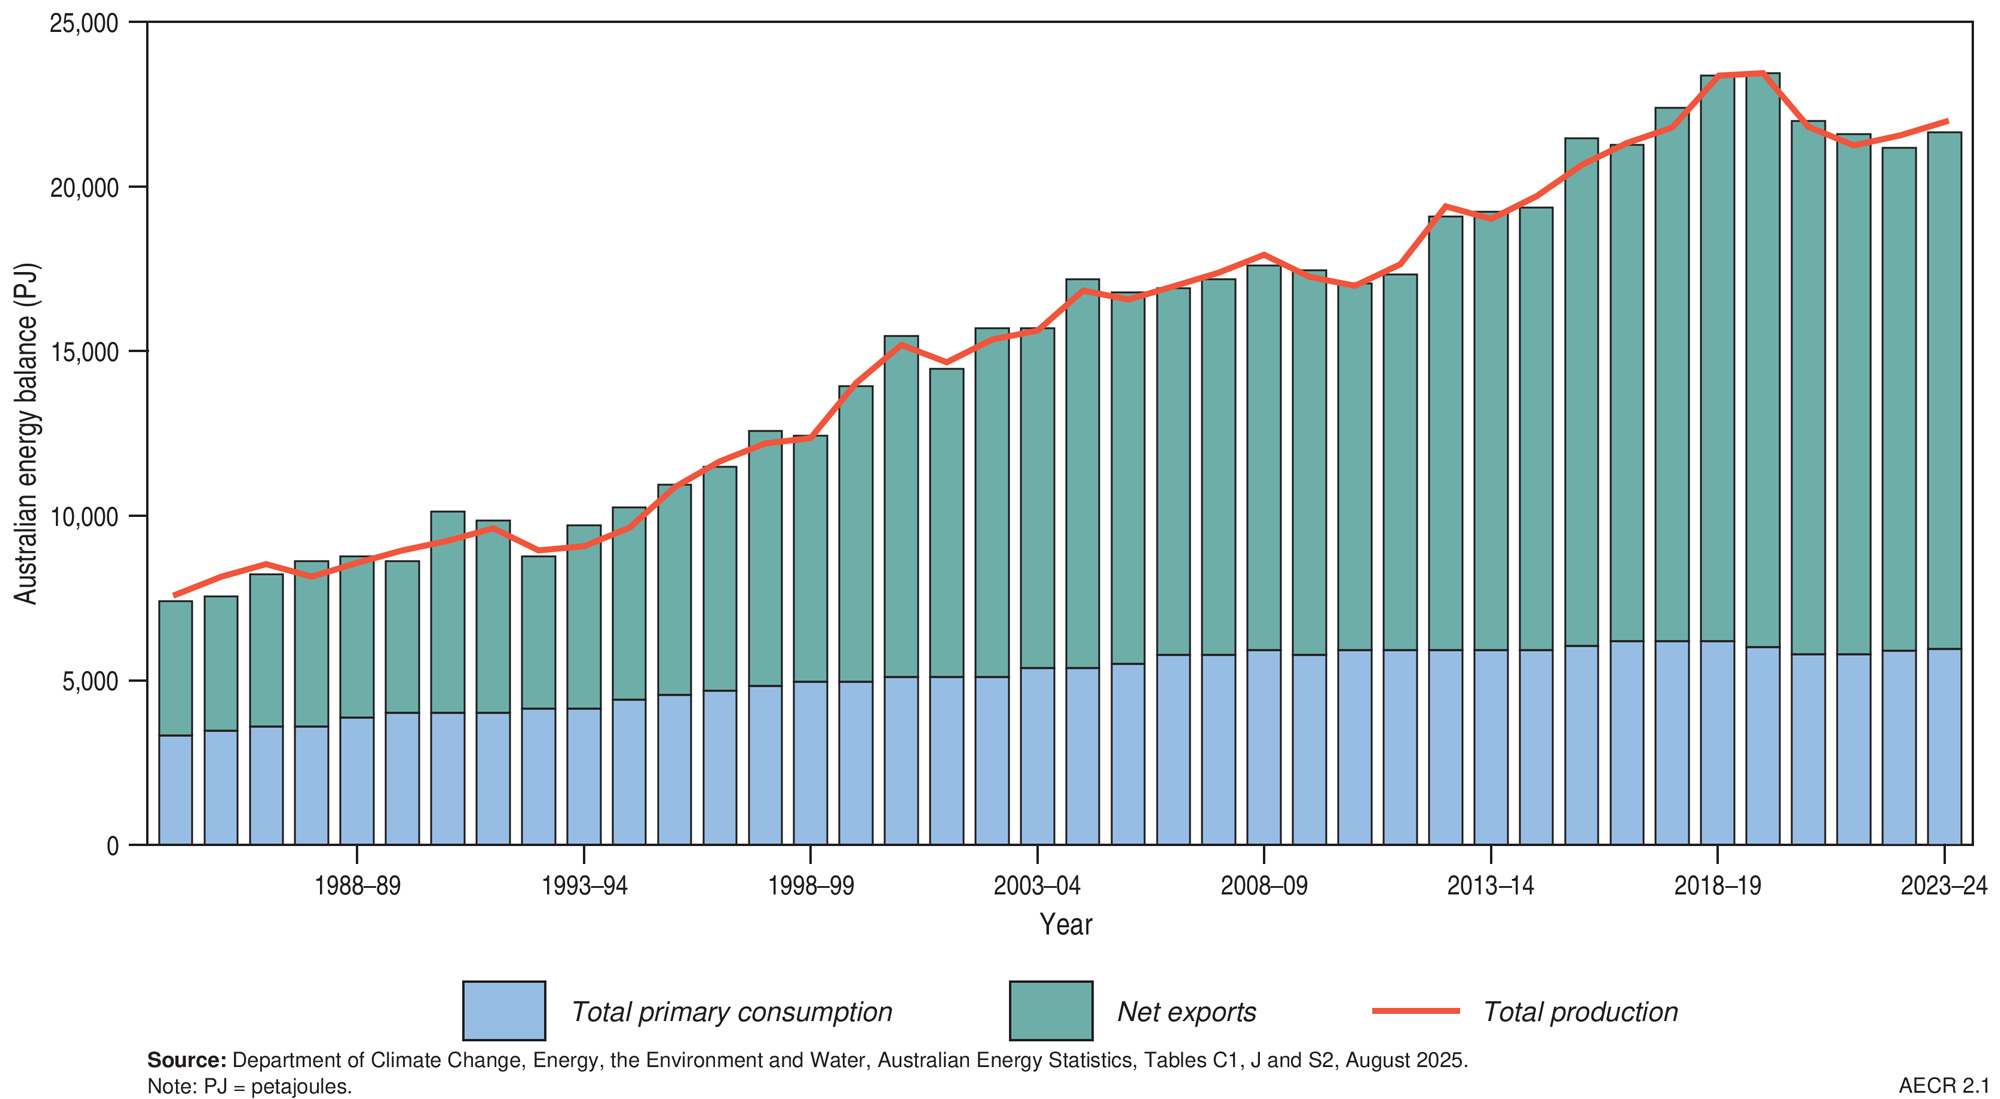
Figure 2.1 Historical trends in Australia’s energy balance, 1983 to 2024
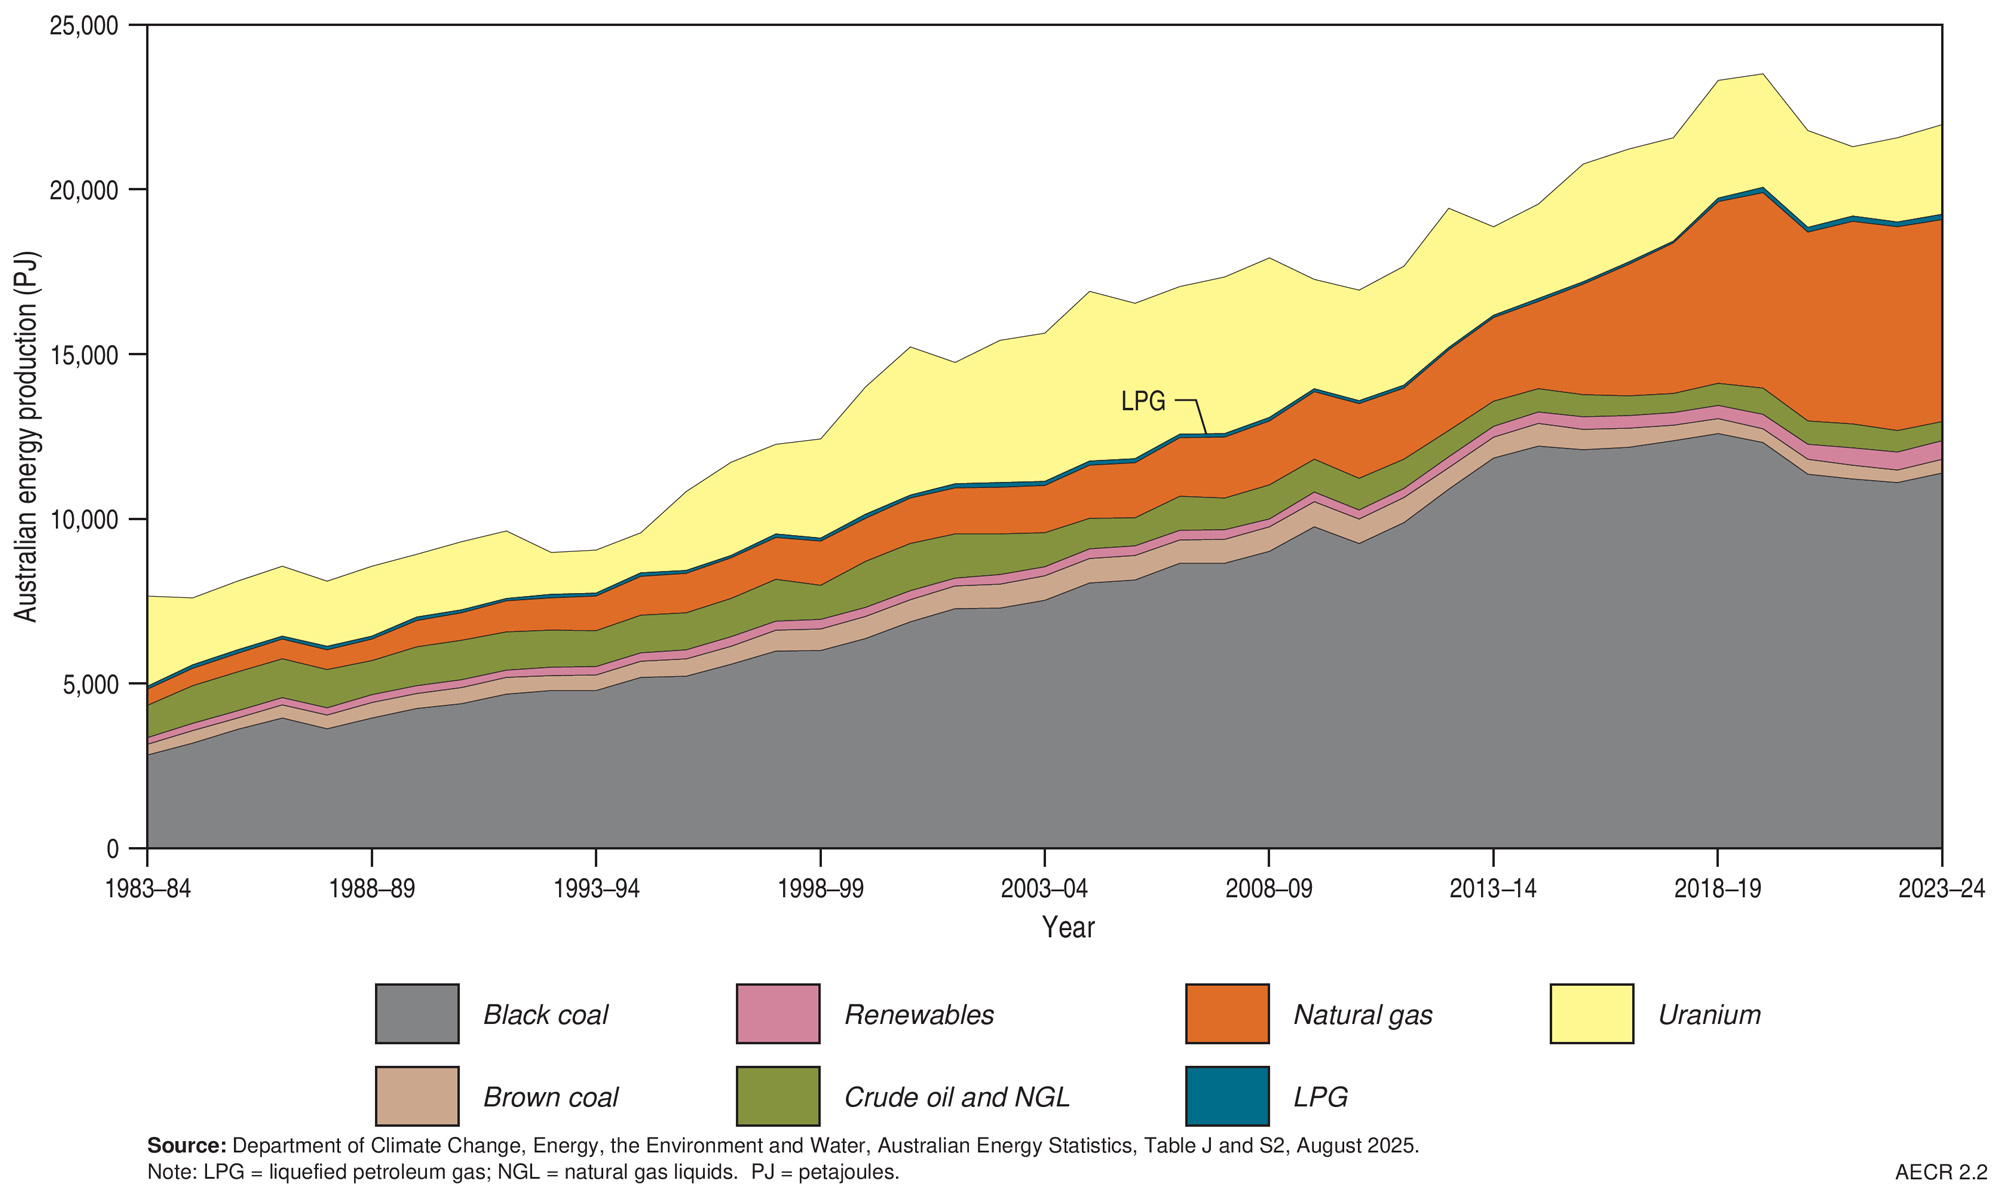
Figure 2.2 Australia’s energy commodity production, by fuel type, 1983 to 2024
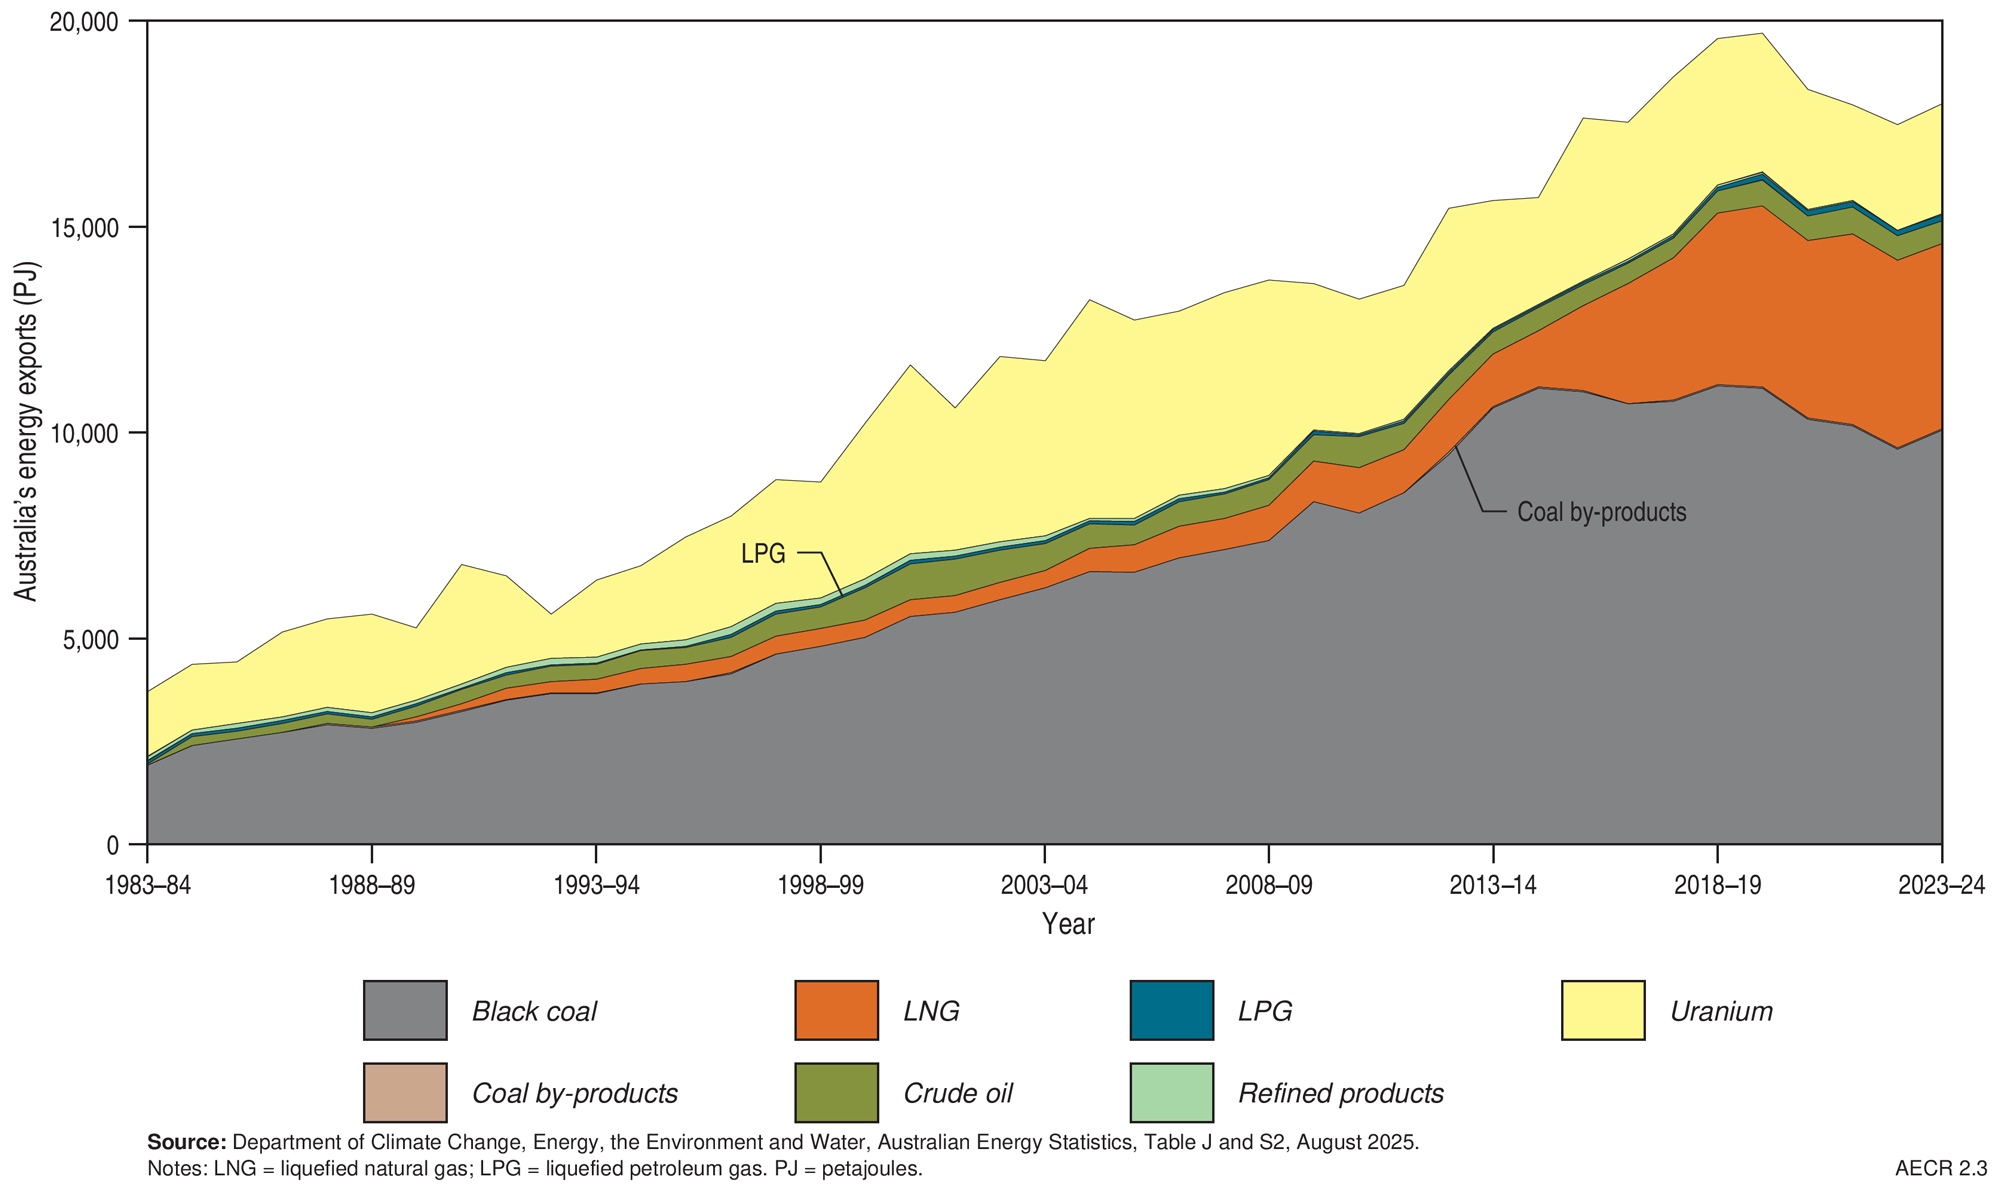
Figure 2.3 Australia’s energy commodity exports, by fuel type, 1983 to 2024
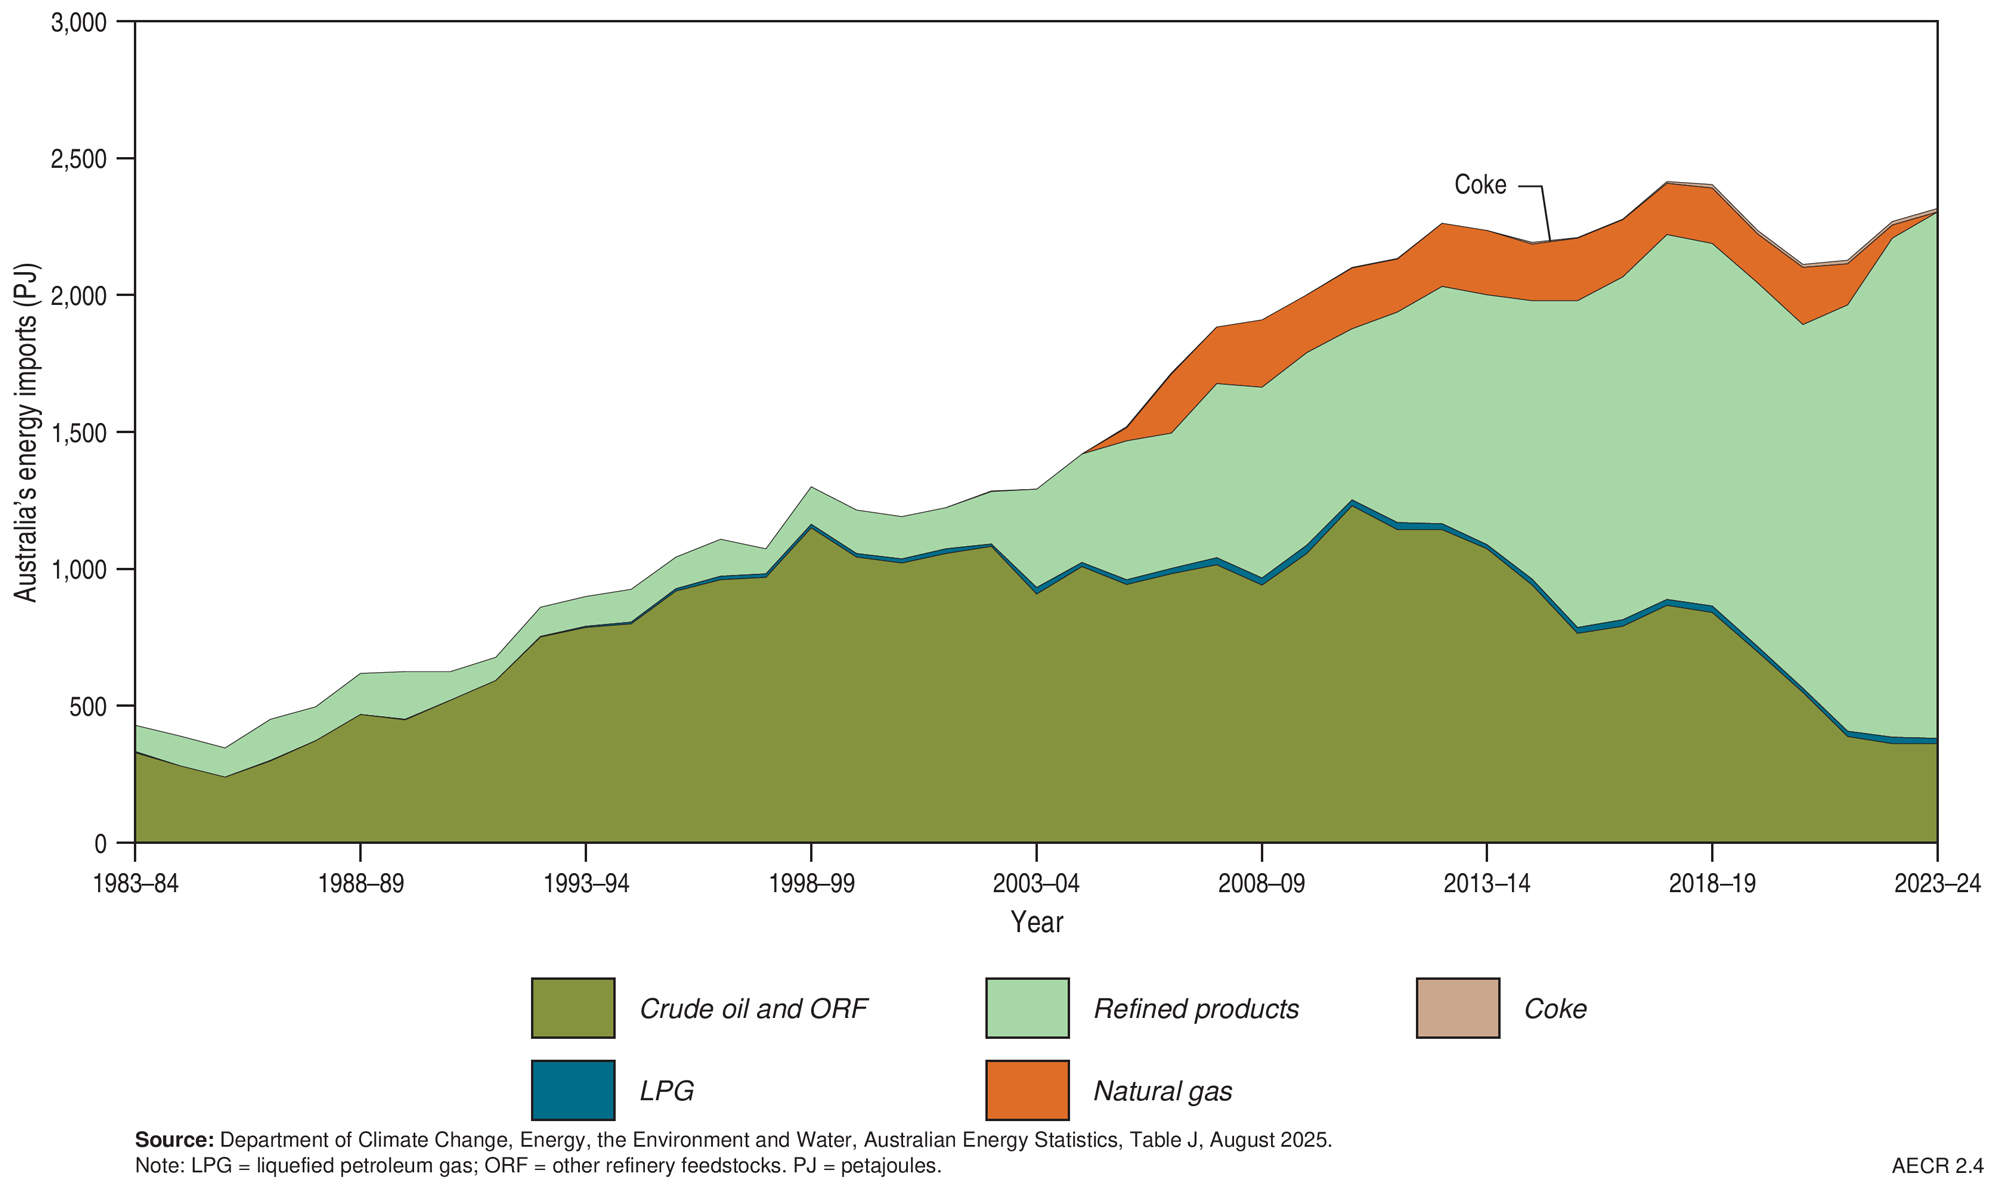
Figure 2.4 Australia’s energy commodity imports, by fuel type, 1983 to 2024
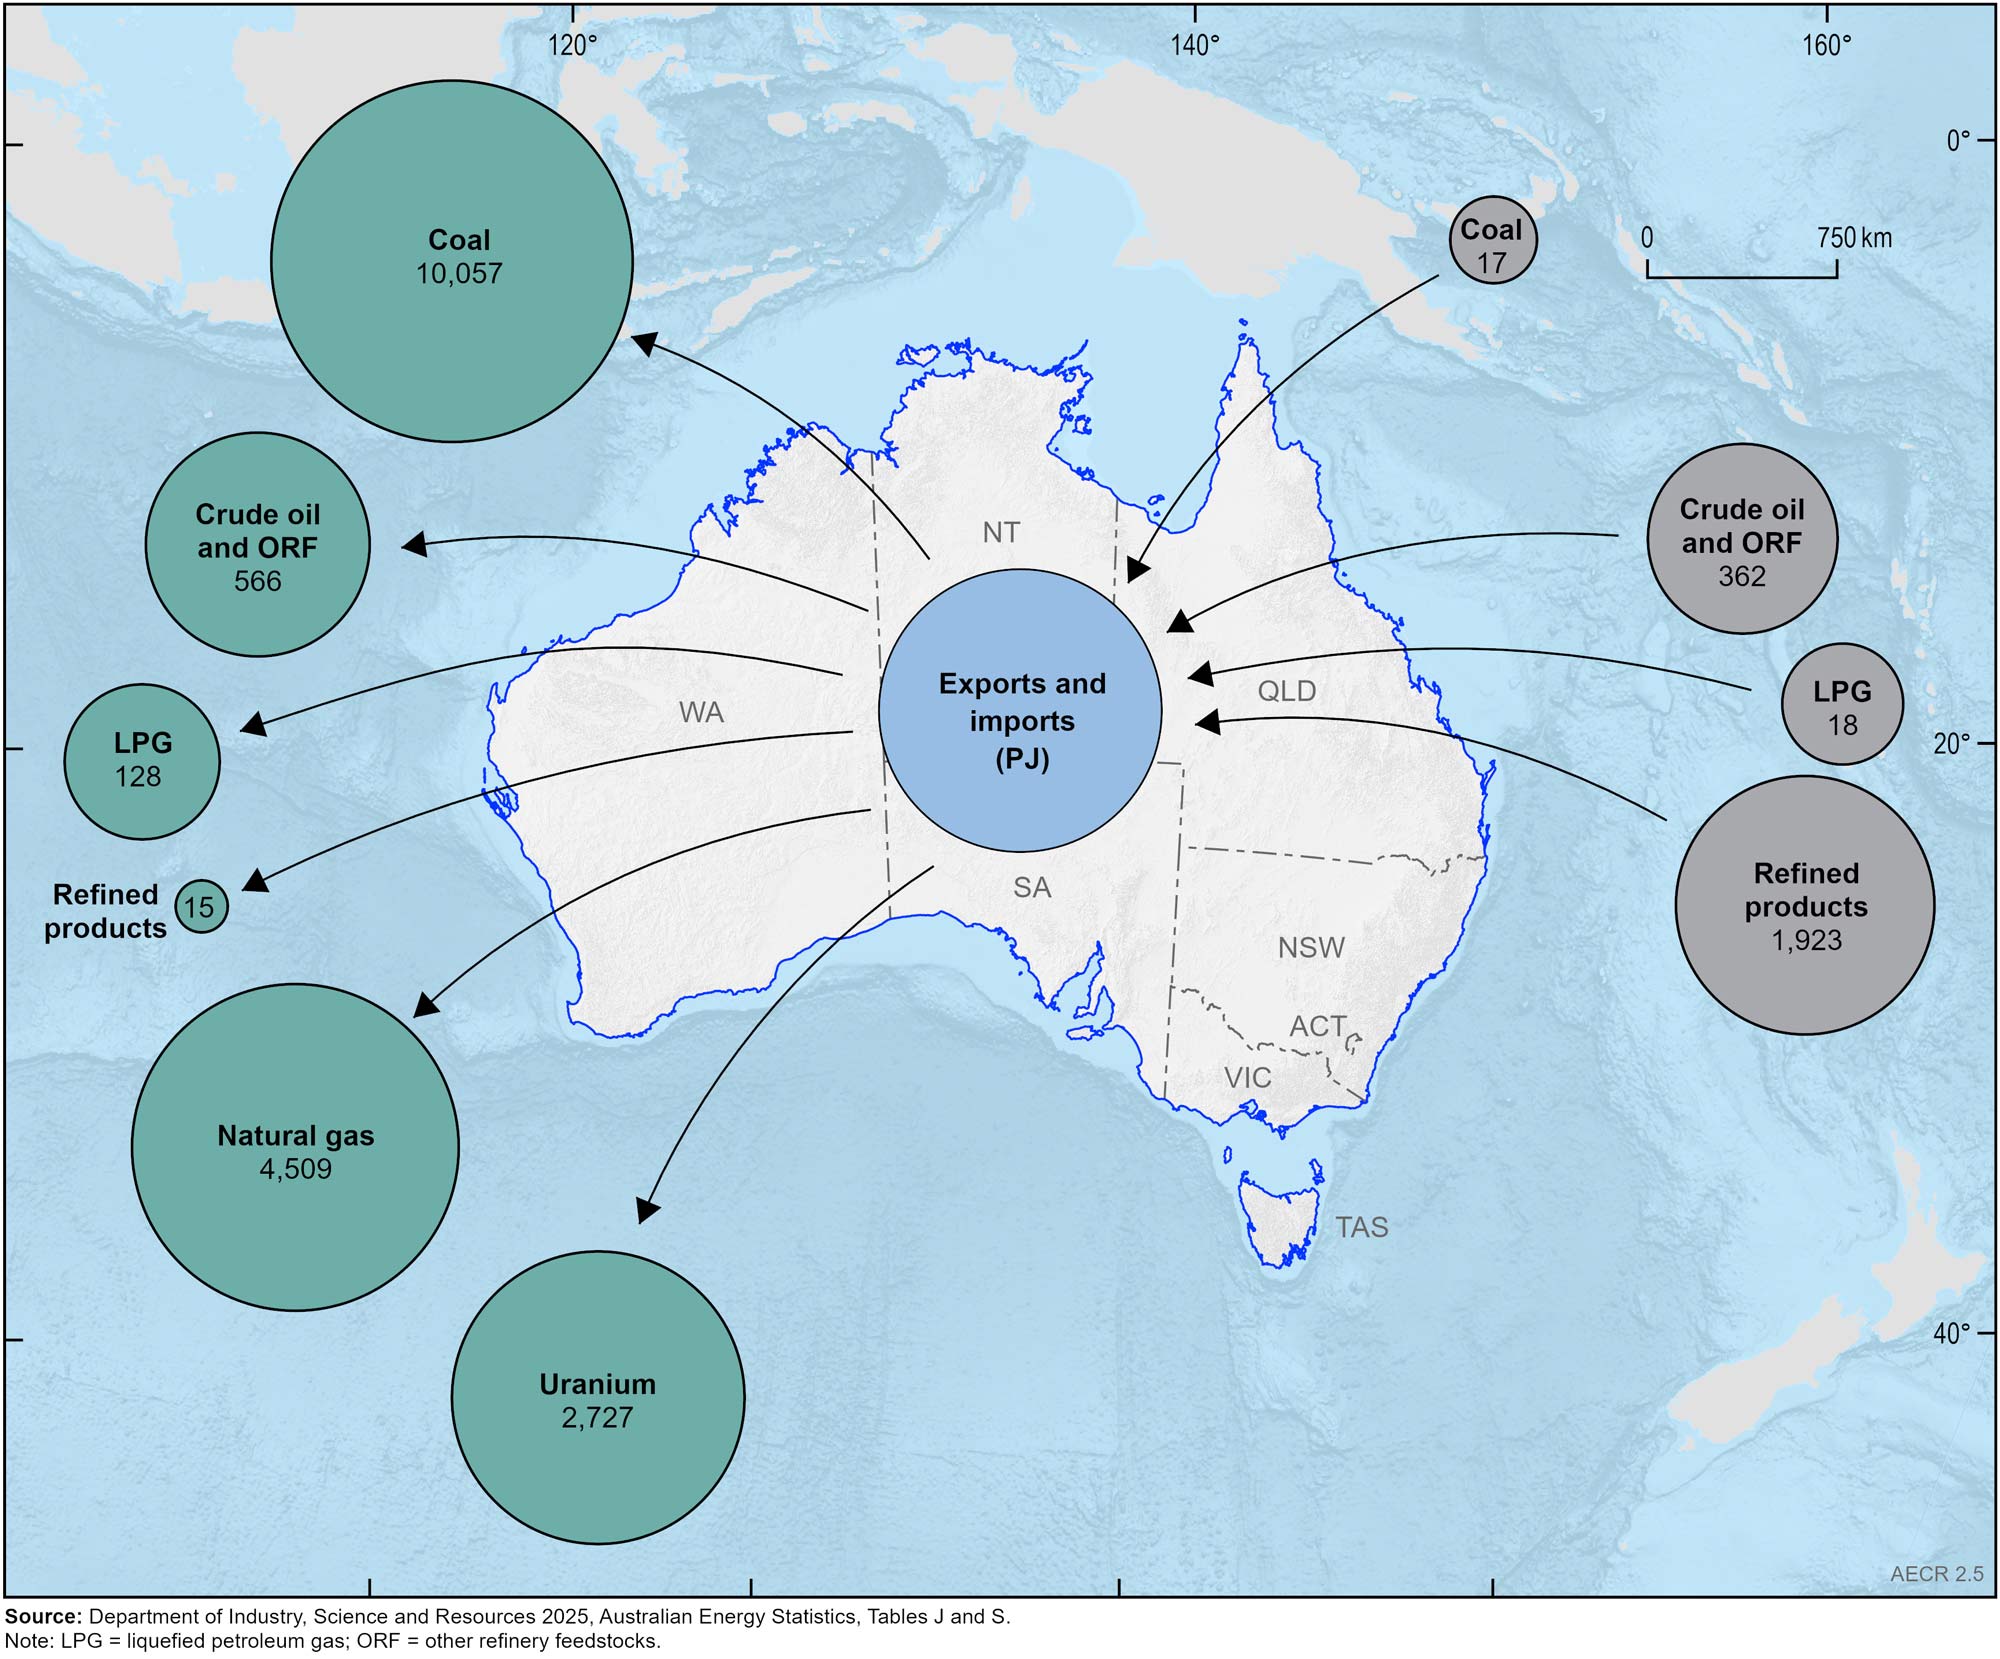
Figure 2.5 Australia’s energy commodity trade in energy units for 2024
Australia’s energy resources contribute substantially to the nation’s gross domestic product and export earnings. Energy productivity (i.e., gross domestic product ‘GDP’ divided by energy consumption) improved by 1.0% in 2023–24, and by 24% over the past ten years (DCCEEW, 2025a). Australia now creates $436 million in GDP for every petajoule of energy consumed (DCCEEW, 2025a). Australia is a net exporter of energy commodities but, notwithstanding this, remains a net importer of oil products. Approximately 82% of Australian produced energy (including uranium) was exported in 2023–24. Exports of LNG have been one of the main contributors to recent growth in our energy exports.
Black coal (metallurgical and thermal) and natural gas (LNG) account for most of Australia’s energy resource export value (Table 2.2). In 2023–24 Australia’s energy commodity export earnings contracted to A$180.2 billion, down A$58.6 billion (17%) from the record A$238.7 billion the previous year. Export values of thermal coal (A$37.2 billion), metallurgical coal (A$54.2 billion), and LNG (A$68.6 billion) all contracted significantly, down 43.2%, 12.5% and 25.6% respectively from 2022–23, mostly due to falls in commodity export prices. Export earnings from uranium grew strongly (up 47.9%) to A$1.2 billion due to higher prices and export volumes.
Table 2.2 Annual value of Australian energy commodity exports by fuel type, 2023–24 financial year.
| Energy source | Value (A$ billion) | Share (%) | Annual growth 2023–24 | Compound growth 2013–14 to 2023–24 |
|---|---|---|---|---|
| Crude oil and ORF | 12.6 | 7.0 | -4.7 | 1.2 |
| LPG | 2.2 | 1.2 | 39.5 | 5.8 |
| Bunker fuel | 3.5 | 1.9 | 13.5 | 7.8 |
| Other petroleum products | 0.4 | 0.2 | 10.4 | -2.7 |
| Natural gas (LNG) | 68.6 | 38.1 | -25.6 | 15.4 |
| Metallurgical coal | 54.2 | 30.1 | -12.5 | 8.8 |
| Thermal coal | 37.2 | 20.7 | -43.2 | 8.3 |
| Uranium | 1.2 | 0.7 | 47.9 | 6.9 |
| Total | 180.2 | 99.9 | -24.5 | 9.7 |
Notes
Source: DISR (2025), Resources and Energy Quarterly September 2025, Table 2(2).
Share (%) does not total to 100% due to 'Other' energy exports.
Australia in the world energy market
In 2024, global energy demand continued its long-term growth, with primary energy consumption increasing by 2%. Fossil fuel consumption accounted for the nearly two-thirds of this increase (64%), growing by more than 1.5%. Renewable energy consumption continued to grow rapidly, up 7.3% from 2023, accounting for 29% of growth in 2024 (Energy Institute, 2025). Nuclear energy consumption also increased by 2.6% globally.
Primary energy production totalled 642,947 PJ in 2023, with China, the US and Russia accounting for 46% of all energy production. Australia was ranked the eighth highest primary energy producer in 2023, accounting for 2.7% (17,676 PJ) of world primary energy production (IEA, 2025a). Most global primary energy production was from oil (30%), coal (28%), and natural gas resources (23%), with renewables (14%) and nuclear (5%) making up the remainder (Figure 2.6).
Highlights for 2024 calendar year:
- Australia was the 7th largest global gas producer and the world’s third largest LNG exporter.
- Australia was the world’s fourth largest producer of coal (black and brown), accounting for 6.5% of global production. It remained the second largest exporter of coal (black and brown), after Indonesia, holding the leading position in metallurgical coal exports and the second position for thermal coal exports (DISR, 2025).
- Australia was the world’s fourth largest producer of uranium, accounting for 8% of global production.
Table 2.3 Summary statistics for Australia's energy commodity reserves, production and exports and their world rankings, 2024 calendar year. Data has been compiled by calendar year to enable international comparison.
| Resource | Sub-category | Reserves (PJ) | Reserves world ranking (share) | Production (PJ) | Production world ranking (share) | Exports (PJ) | Export world ranking (share) | Export value (A$b) |
|---|---|---|---|---|---|---|---|---|
| Gas | All | 99,124 | na | 6,353 | 7 (3.6%) | 4,420 | 3 (20%) | 67.4 |
| Conventional | 70,169 | 4,688 | ||||||
| Coal Seam Gas | 28,955 | 1,665 | ||||||
| Oil | All | 6,895 | na | 595 | 32 (0.4%) | 678 | na | 13.9 |
| Crude | 1,255 | 162 | ||||||
| Condensate | 5,288 | 397 | ||||||
| LPG | 353 | 35 | ||||||
| Coal | All | 2,608,365 | 11,815 | 4 (6.5%) | 10,057 | 2 (25%) | 85.2 | |
| Black | 1,877,705 | 4 (9%) | 11,398 | 5 (5%) | ||||
| Brown | 730,660 | 2 (23%) | 416 | 8 (3%) | ||||
| Uranium | 184,240 | 1 (32%) | 2,607 | 4 (8%) | 2,600 | 1.3 |
Abbreviations
PJ = petajoules; na = not available.
Notes
Statistics are for the 2024 calendar year except coal production and exports (PJ) which are for financial year 2023–24.
Source: DCCEEW (2025) Australian Energy Update 2025; DISR (2025) Resources and Energy Quarterly, September 2025; Energy Institute (2025) Statistical Review of World Energy; Geoscience Australia (this work); OECD and NEA (2025) Uranium 2024: Resources, Production and Demand.
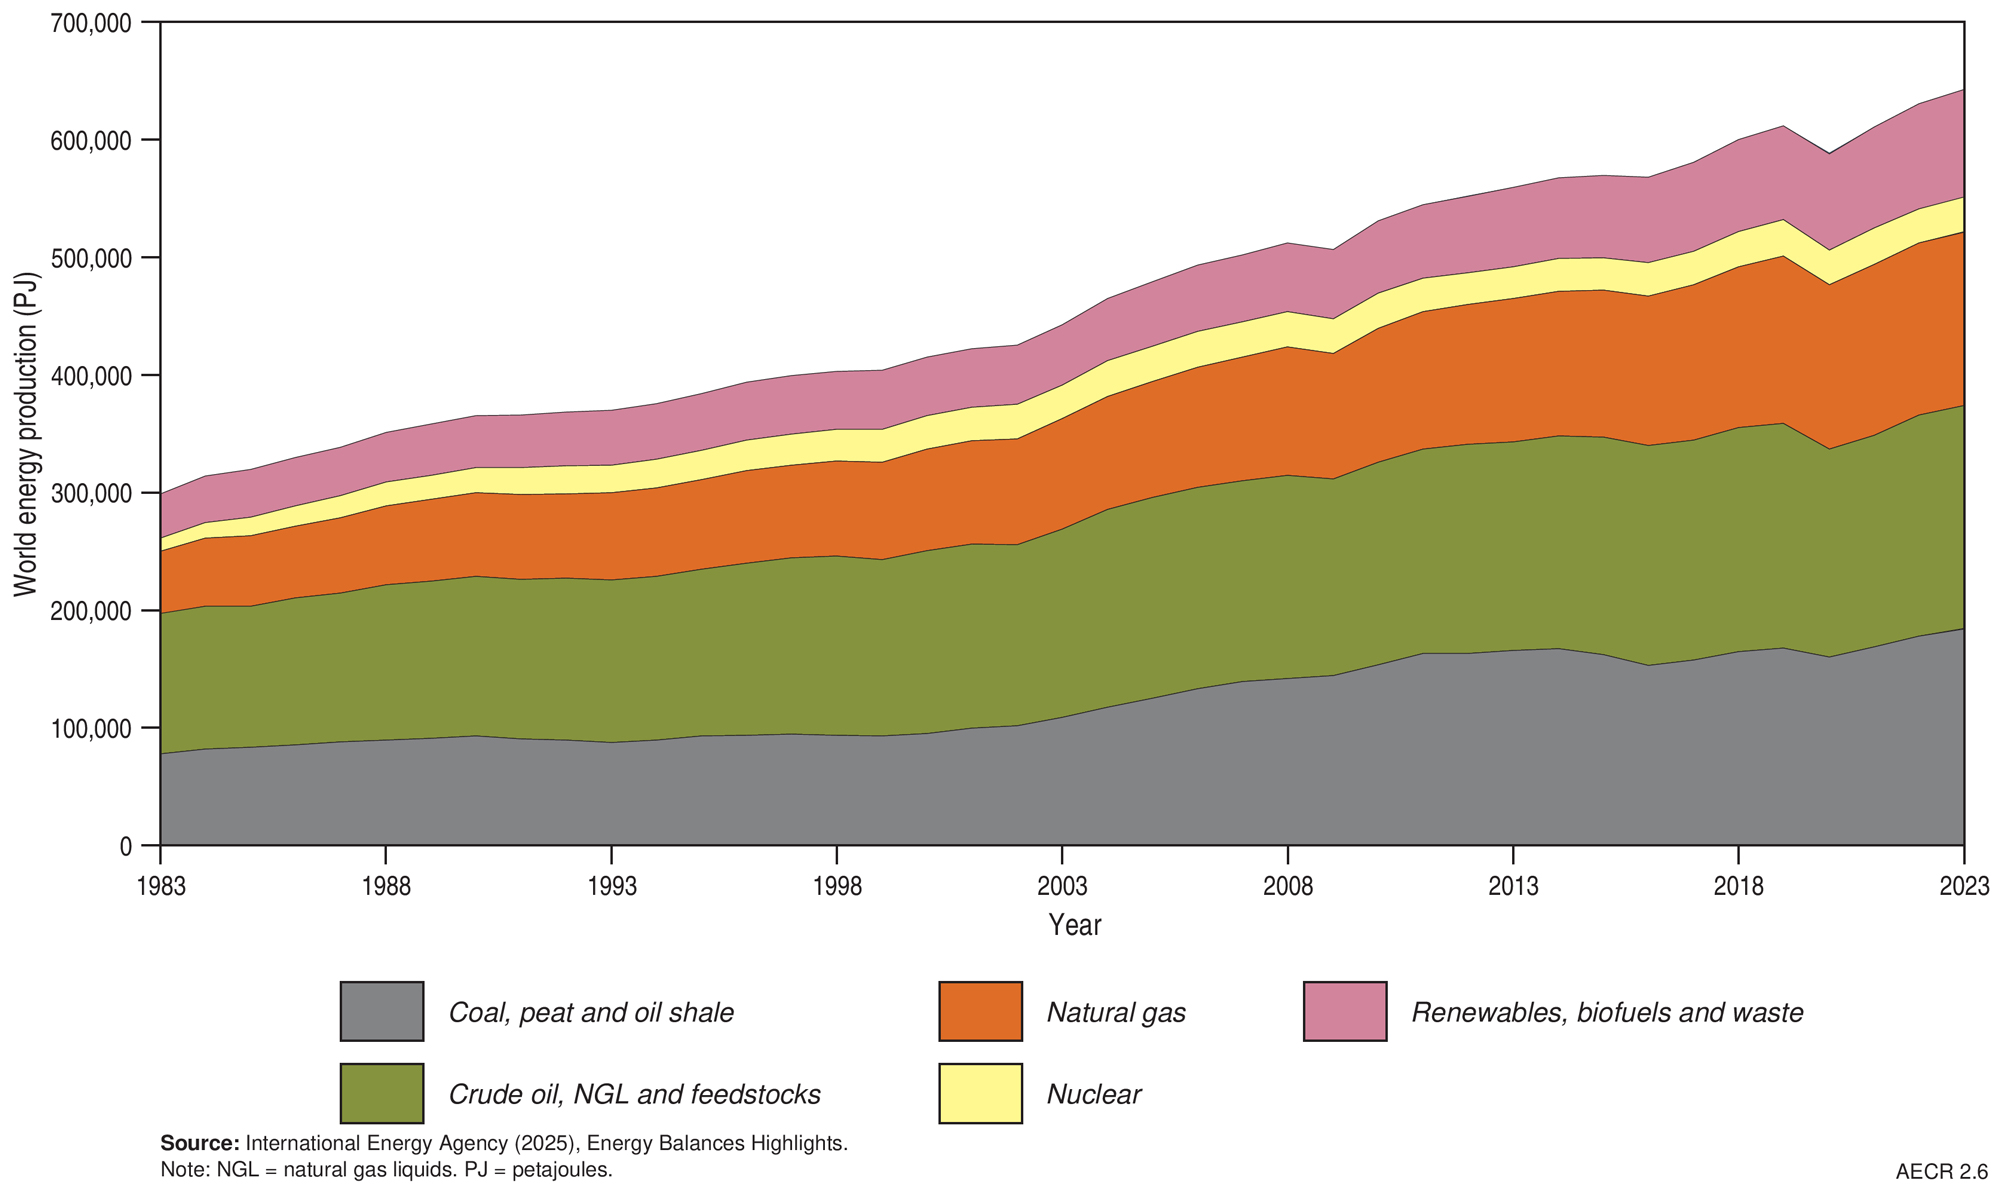
Figure 2.6 Historical trends in world primary energy commodity production, by resource type, 1983 to 2023
World trade
The IEA reports on the global trade of energy resources in its World Energy Balances publication, the most recent available data is for 2022 (one year behind the 2023 reporting period for this edition of AECR). In 2023 global exports of fossil fuels totalled 236,824 PJ (Figure 2.7) including 97,958 PJ of oil resources (41% share), 58,713 PJ of oil products (25% share), 43,163 PJ of natural gas (18% share), and 36,991 PJ of coal (16% share; IEA, 2025a). Australia was the 3rd largest exporter of energy commodities in 2023, being amongst the top exporters of both coal and LNG. Approximately 48% of fossil fuel exports during this period originated from six countries—the United States (12.4%), the Russian Federation (10.5%), Saudi Arabia (7.7%), Australia (5.9%), Canada (5.8%) and Indonesia (5.4%; IEA, 2025a; Energy Institute, 2025; Table 2.4).
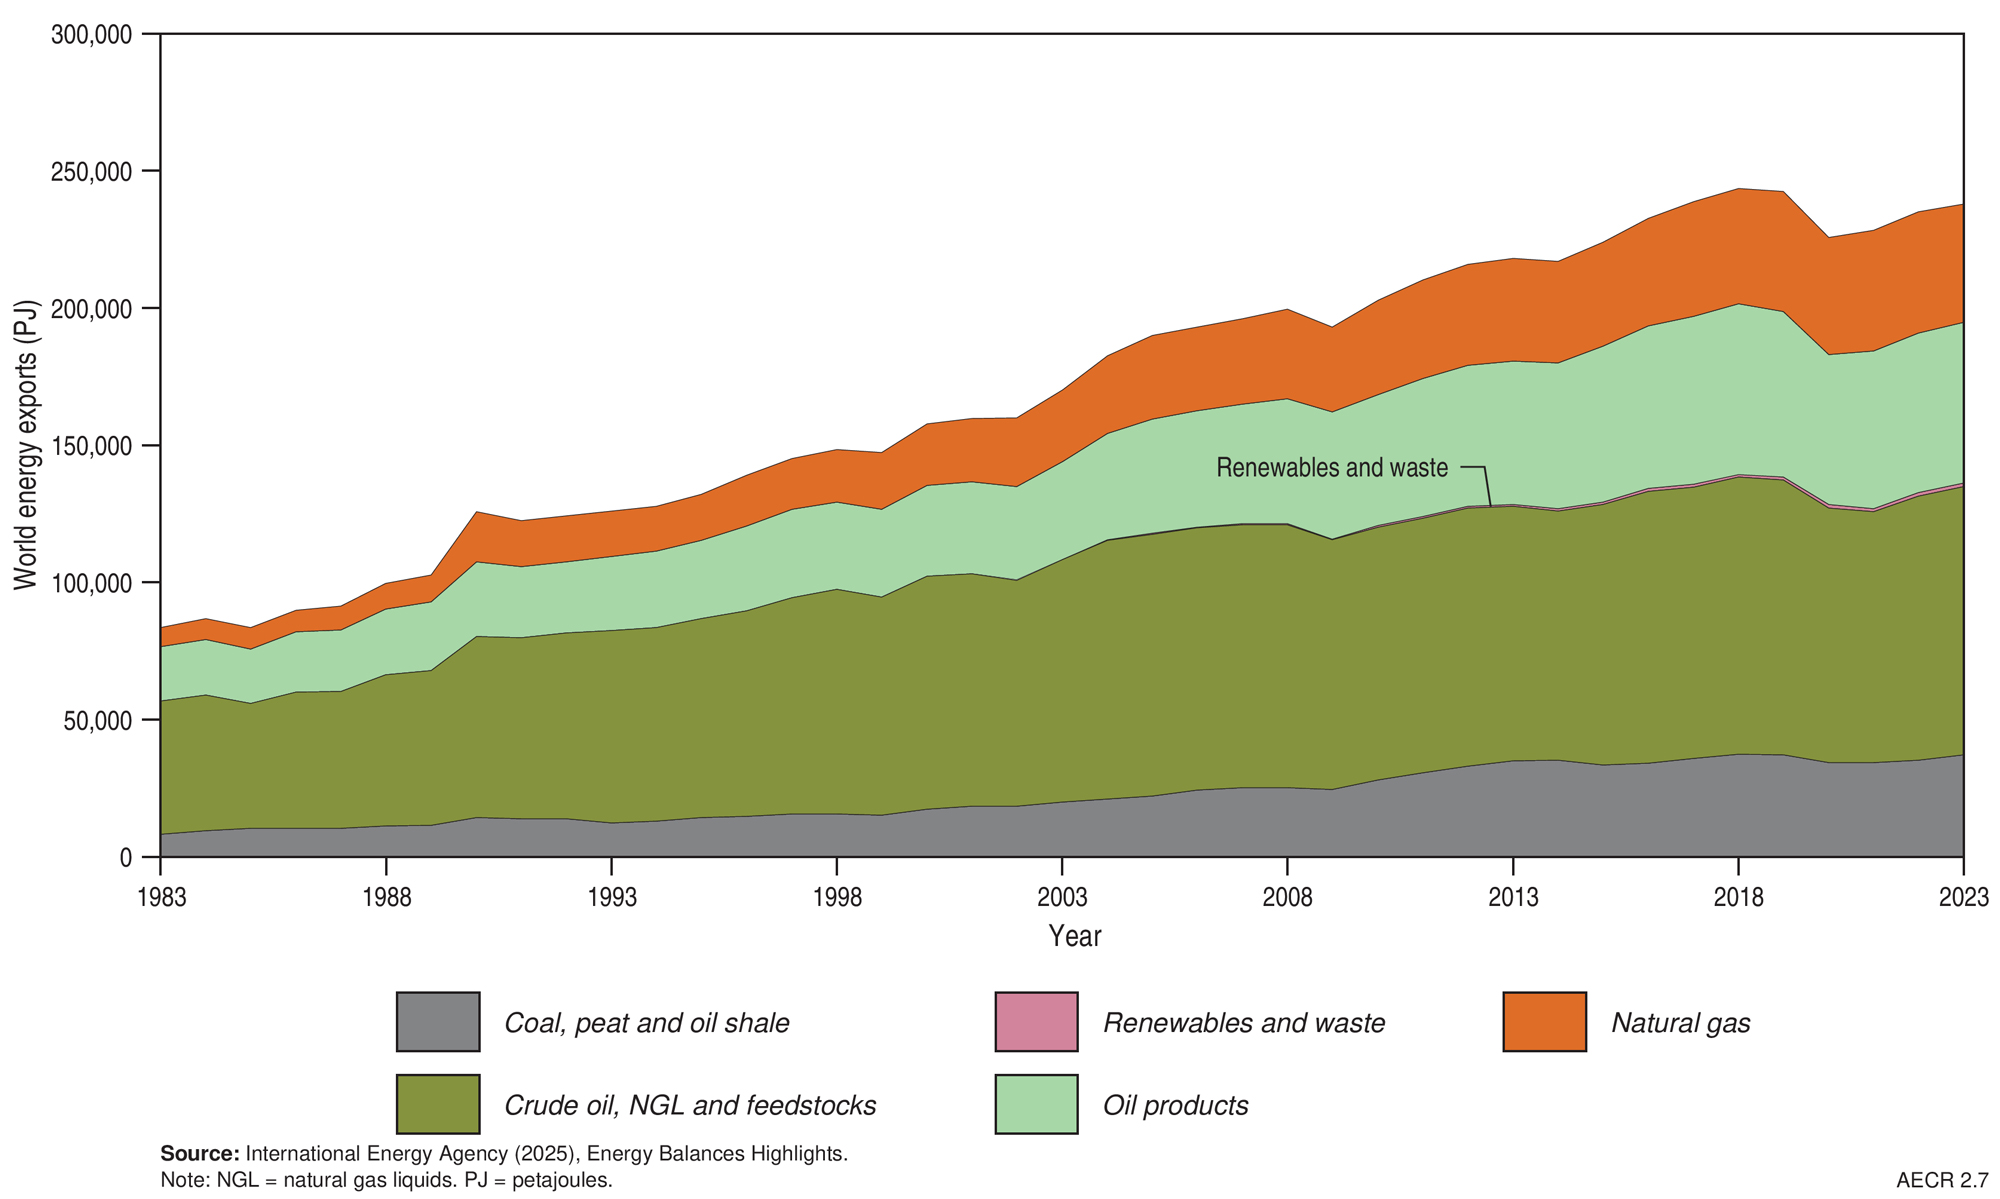
Figure 2.7 World energy exports, 1983–2023
Table 2.4 World energy commodity exports by country in 2023.
| Country | Energy exports (PJ) | World share (%) | Rank | Major energy exports |
|---|---|---|---|---|
| United States | 29,318 | 12.4 | 1 | Major exporter of oil and natural gas |
| Russian Federationa | 24,947 | 10.5 | 2 | Largest natural gas exporter (pipeline & LNG) and major exporter of oil and coal |
| Saudi Arabiaa | 18,327 | 7.7 | 3 | Largest oil and NGL exporter |
| Australia | 13,936 | 5.9 | 4 | Largest exporter of coal, major exporter of LNG |
| Canada | 13,821 | 5.8 | 5 | Major exporter of oil and natural gas |
| Indonesia | 12,831 | 5.4 | 6 | Second largest coal exporter |
| World Total | 236,824 |
Notes
Includes coal, natural gas, crude oil and natural gas liquids (NGL), and oil products.
Sources: IEA (2025) Countries and regions; a Energy Institute (2025)
References
DCCEEW (Department of Climate Change, Energy, the Environment and Water), 2025. Australian Energy Update 2025. (Last accessed 6 May 2026).
DISR (Department of Industry, Science and Resources), 2024. Resources and Energy Major Projects: 2024. (Last accessed May 2026).
DISR (Department of Industry, Science and Resources), 2025. Resources and Energy Quarterly, September 2025. (Last accessed 6 May 2026).
Energy Institute, 2025. Statistical Review of World Energy. (Last accessed 6 May 2026).
Geoscience Australia, 2025. Australia’s Energy Commodity Resources, 2025 Edition. Geoscience Australia, Canberra. (Last accessed 6 May 2026).
Hughes, A., Britt, A., Pheeney, J., Kucka, C., Morfiadakis, A., Munns, C., Boyd, J., Senior, A., Cross, A. and Thorne, J. 2026. Australia’s Identified Mineral Resources 2025. Geoscience Australia, Canberra.
IEA (International Energy Agency), 2025. World Energy Balances highlights, data download. (Last accessed 6 May 2026).
Organisation for Economic Co-operation and Development, Nuclear Energy Agency, and International Atomic Energy Agency (OECD, NEA and IAEA), 2025. Uranium 2024: Resources, Production and Demand. (Last accessed 6 May 2026).
Data download
Data tables and full report are downloadable from the Geoscience Australia website.