Australia's Energy Commodity Resources 2026 Overview
Page last updated:10 August 2026
Welcome to the sixth edition of Geoscience Australia’s assessment of Australia’s Energy Commodity Resources 2026 (AECR 2026). AECR 2026 provides resource estimates of the nation’s non-renewable energy commodity resources as well as an overview of projects and policy developments related to clean energy technologies. Resource estimates of the non-renewable energy commodities—oil, gas, coal, uranium and thorium—are reported for the end of 2024. The estimates are grouped by commodity type, reserves and annual production. Clean energy technologies are rapidly being developed in Australia to meet emission reduction targets. These technologies include carbon capture and storage (CCS), zero and low emissions hydrogen production, as well as geothermal energy resources.
Australia’s Energy Commodity Resources
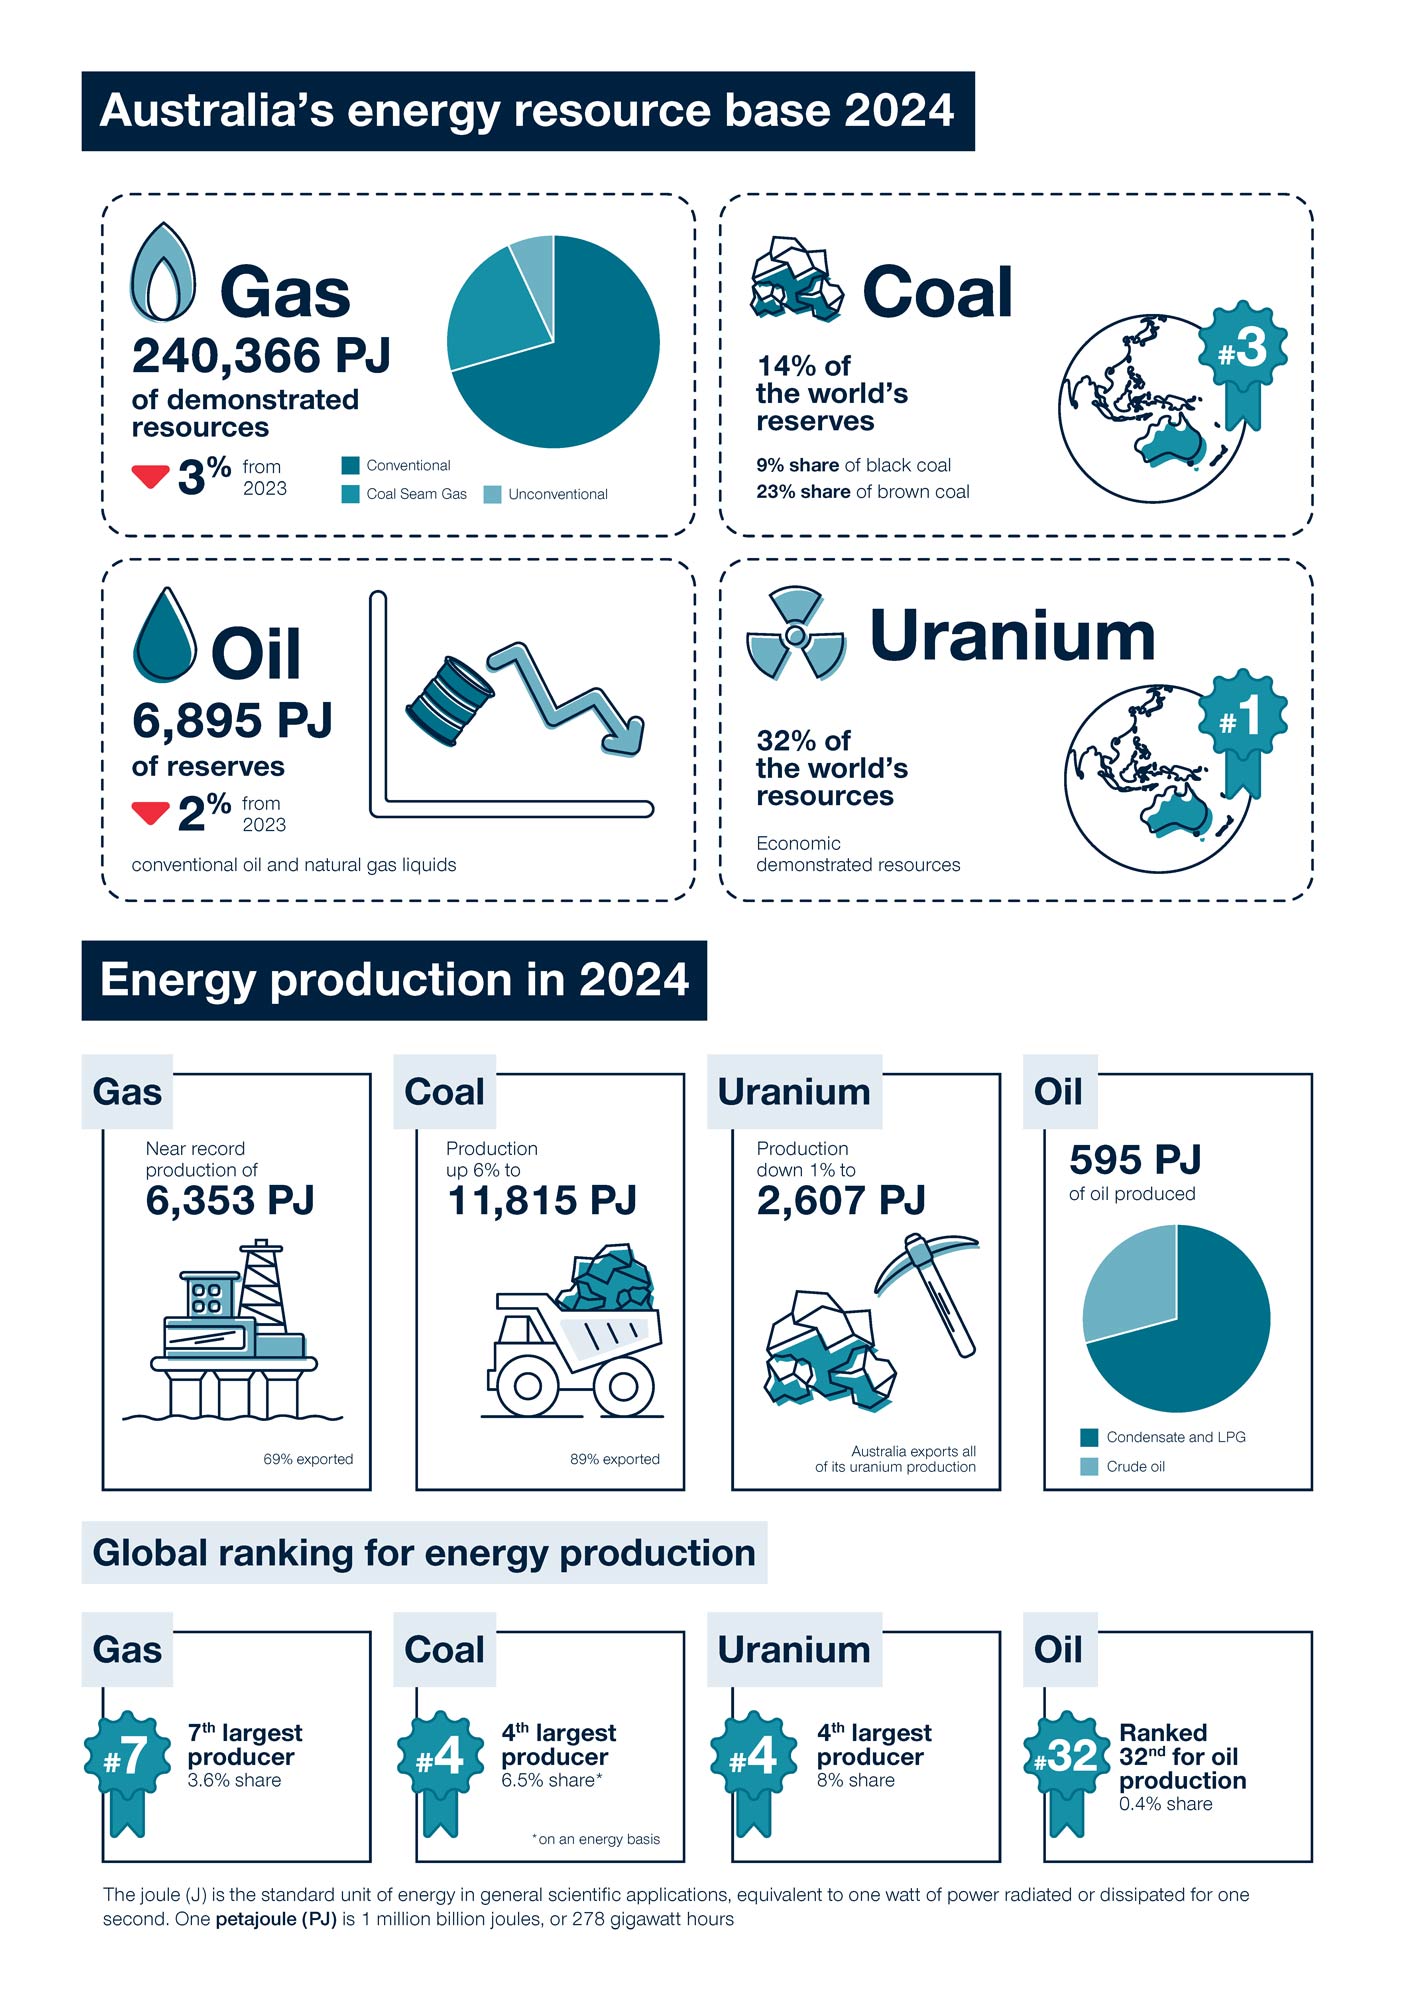
Throughout 2024, Australia continued to be a key global net energy exporter with a strong and diverse mix of energy resources across the continent, contributing 8% of uranium, 7% of coal and 4% of gas to global energy production (Figure 1.1).
Total demonstrated resources (TDR) include both reserves and contingent resources1 and, in 2024, Australia’s TDR for energy commodities were 6,331,706 petajoules (PJ; see Table 1.1), up 26,845 PJ (0.4%) from 2023. The overall modest increase is primarily due to rises in black coal TDR by 22,449 PJ (1.1%), uranium TDR by 13,160 PJ (1.8%), and unconventional gas TDR by 3,342 PJ (23.4%). These gains outweighed declines in conventional gas TDR, which fell by 8,349 PJ (4.8%), coal seam gas TDR, down 2,055 PJ (3.7%), and conventional oil TDR (crude, condensate, and liquefied petroleum gas [LPG]), which decreased by a combined 1,732 PJ (8.5%).
Since 2021, Geoscience Australia has published annual reports on Australia's energy commodity resources, enabling a medium-term overview of trends in the nation’s energy resource base (see Figure 1.2). Relative to the commencement of energy commodity resource records in 2018, there has been a 3.2% (211,660 PJ) decline in Australia’s total non–renewable energy resources in 2024. Observations for individual resources since 2018 include:
- A 9.5% decrease in total oil resources (including shale oil), comprising 23% (5,505 PJ) decline in conventional oil resources (crude, condensate, LPG)—led by a 40.5% (2,625 PJ) decline in crude oil resources as many offshore fields near end of life and cease production—and a 175% (587 PJ) increase in Australia’s emerging unconventional oil resources.
- An overall decrease in gas resources of 11.9% (32,500 PJ), including a 14.4% (27,963 PJ) decrease in conventional gas resources, a 15.6% (9,920 PJ) decrease in coal seam gas resources, and a 31.5% (4,229 PJ) increase in unconventional gas resources.
- TDR of black coal and brown coal have decreased by 4.1% (84,723 PJ) and 1.4% (45,761 PJ), respectively, with these reductions exceeding those attributed solely to production.
- A 4.8% (38,287 PJ) decrease in uranium resources, although Australia still accounts for approximately one-third of the world’s known resources.
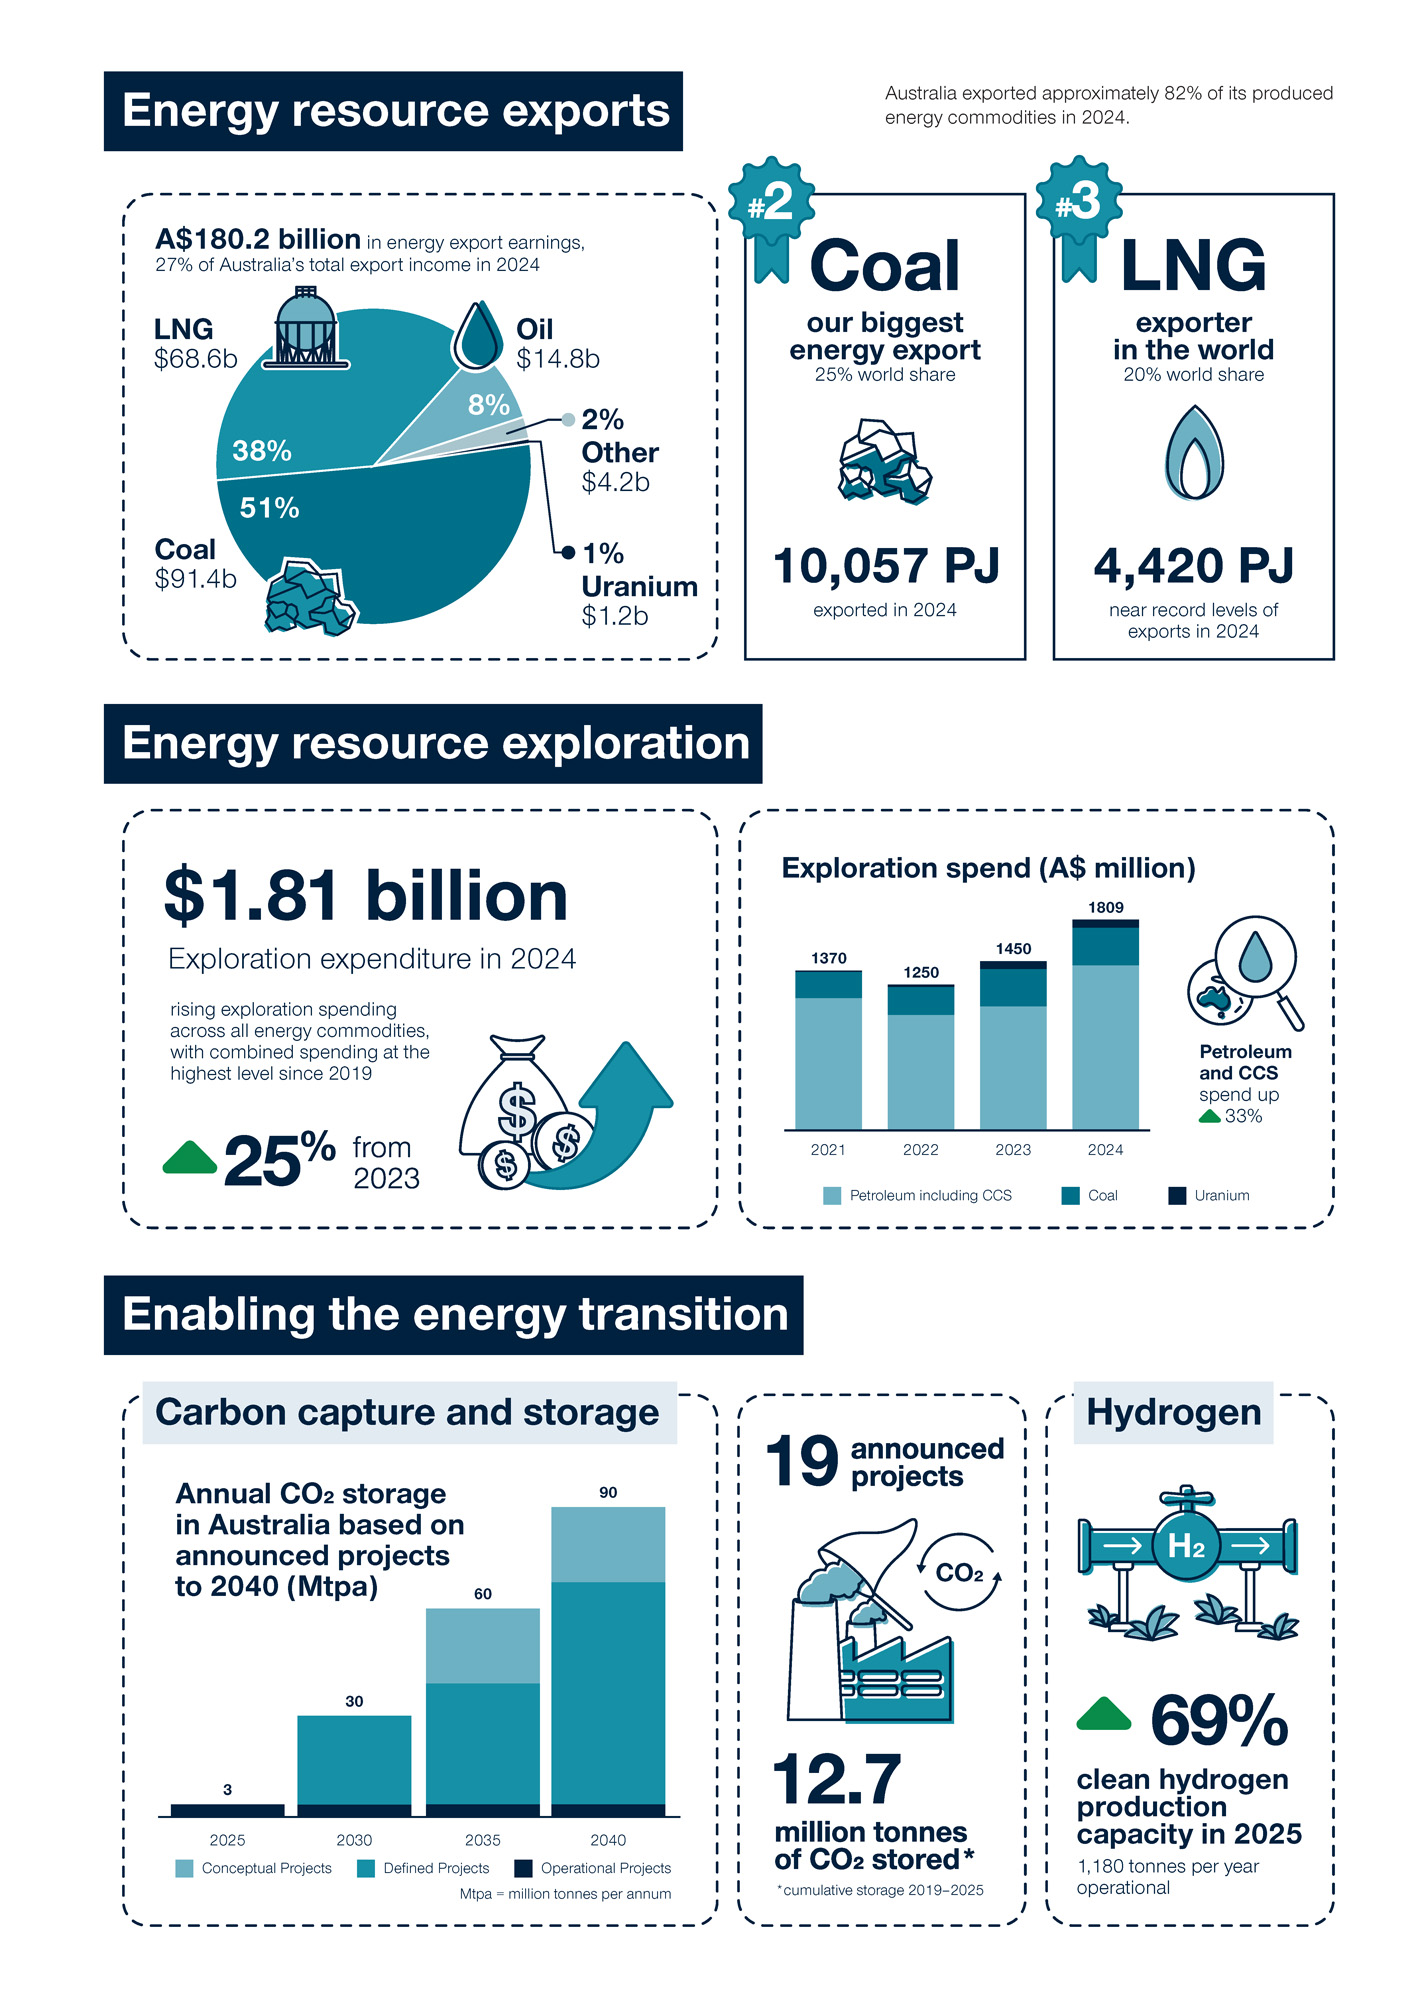
Private sector investment in Australia’s energy resources sector in 2024 included exploration expenditure totalling $1.81 billion, an increase of 25% on 2023 ($1.45 billion; ABS, 2025), and 24 major energy projects worth more than $42 billion at the committed stage (DISR, 2024).
Australia’s energy consumption increased by 0.5% in 2023–24, following a 2% increase in 2022–23, as activity continued to recover in the post-pandemic period (DCCEEW, 2025a). This trend is broadly consistent with the 2% increase in global primary energy demand in 2024 (Energy Institute, 2025). However, in 2024 Australia’s total production of energy commodities decreased by 3.2%, with decreases in conventional oil and gas production and increases in coal seam gas and coal production (Table 1.1).
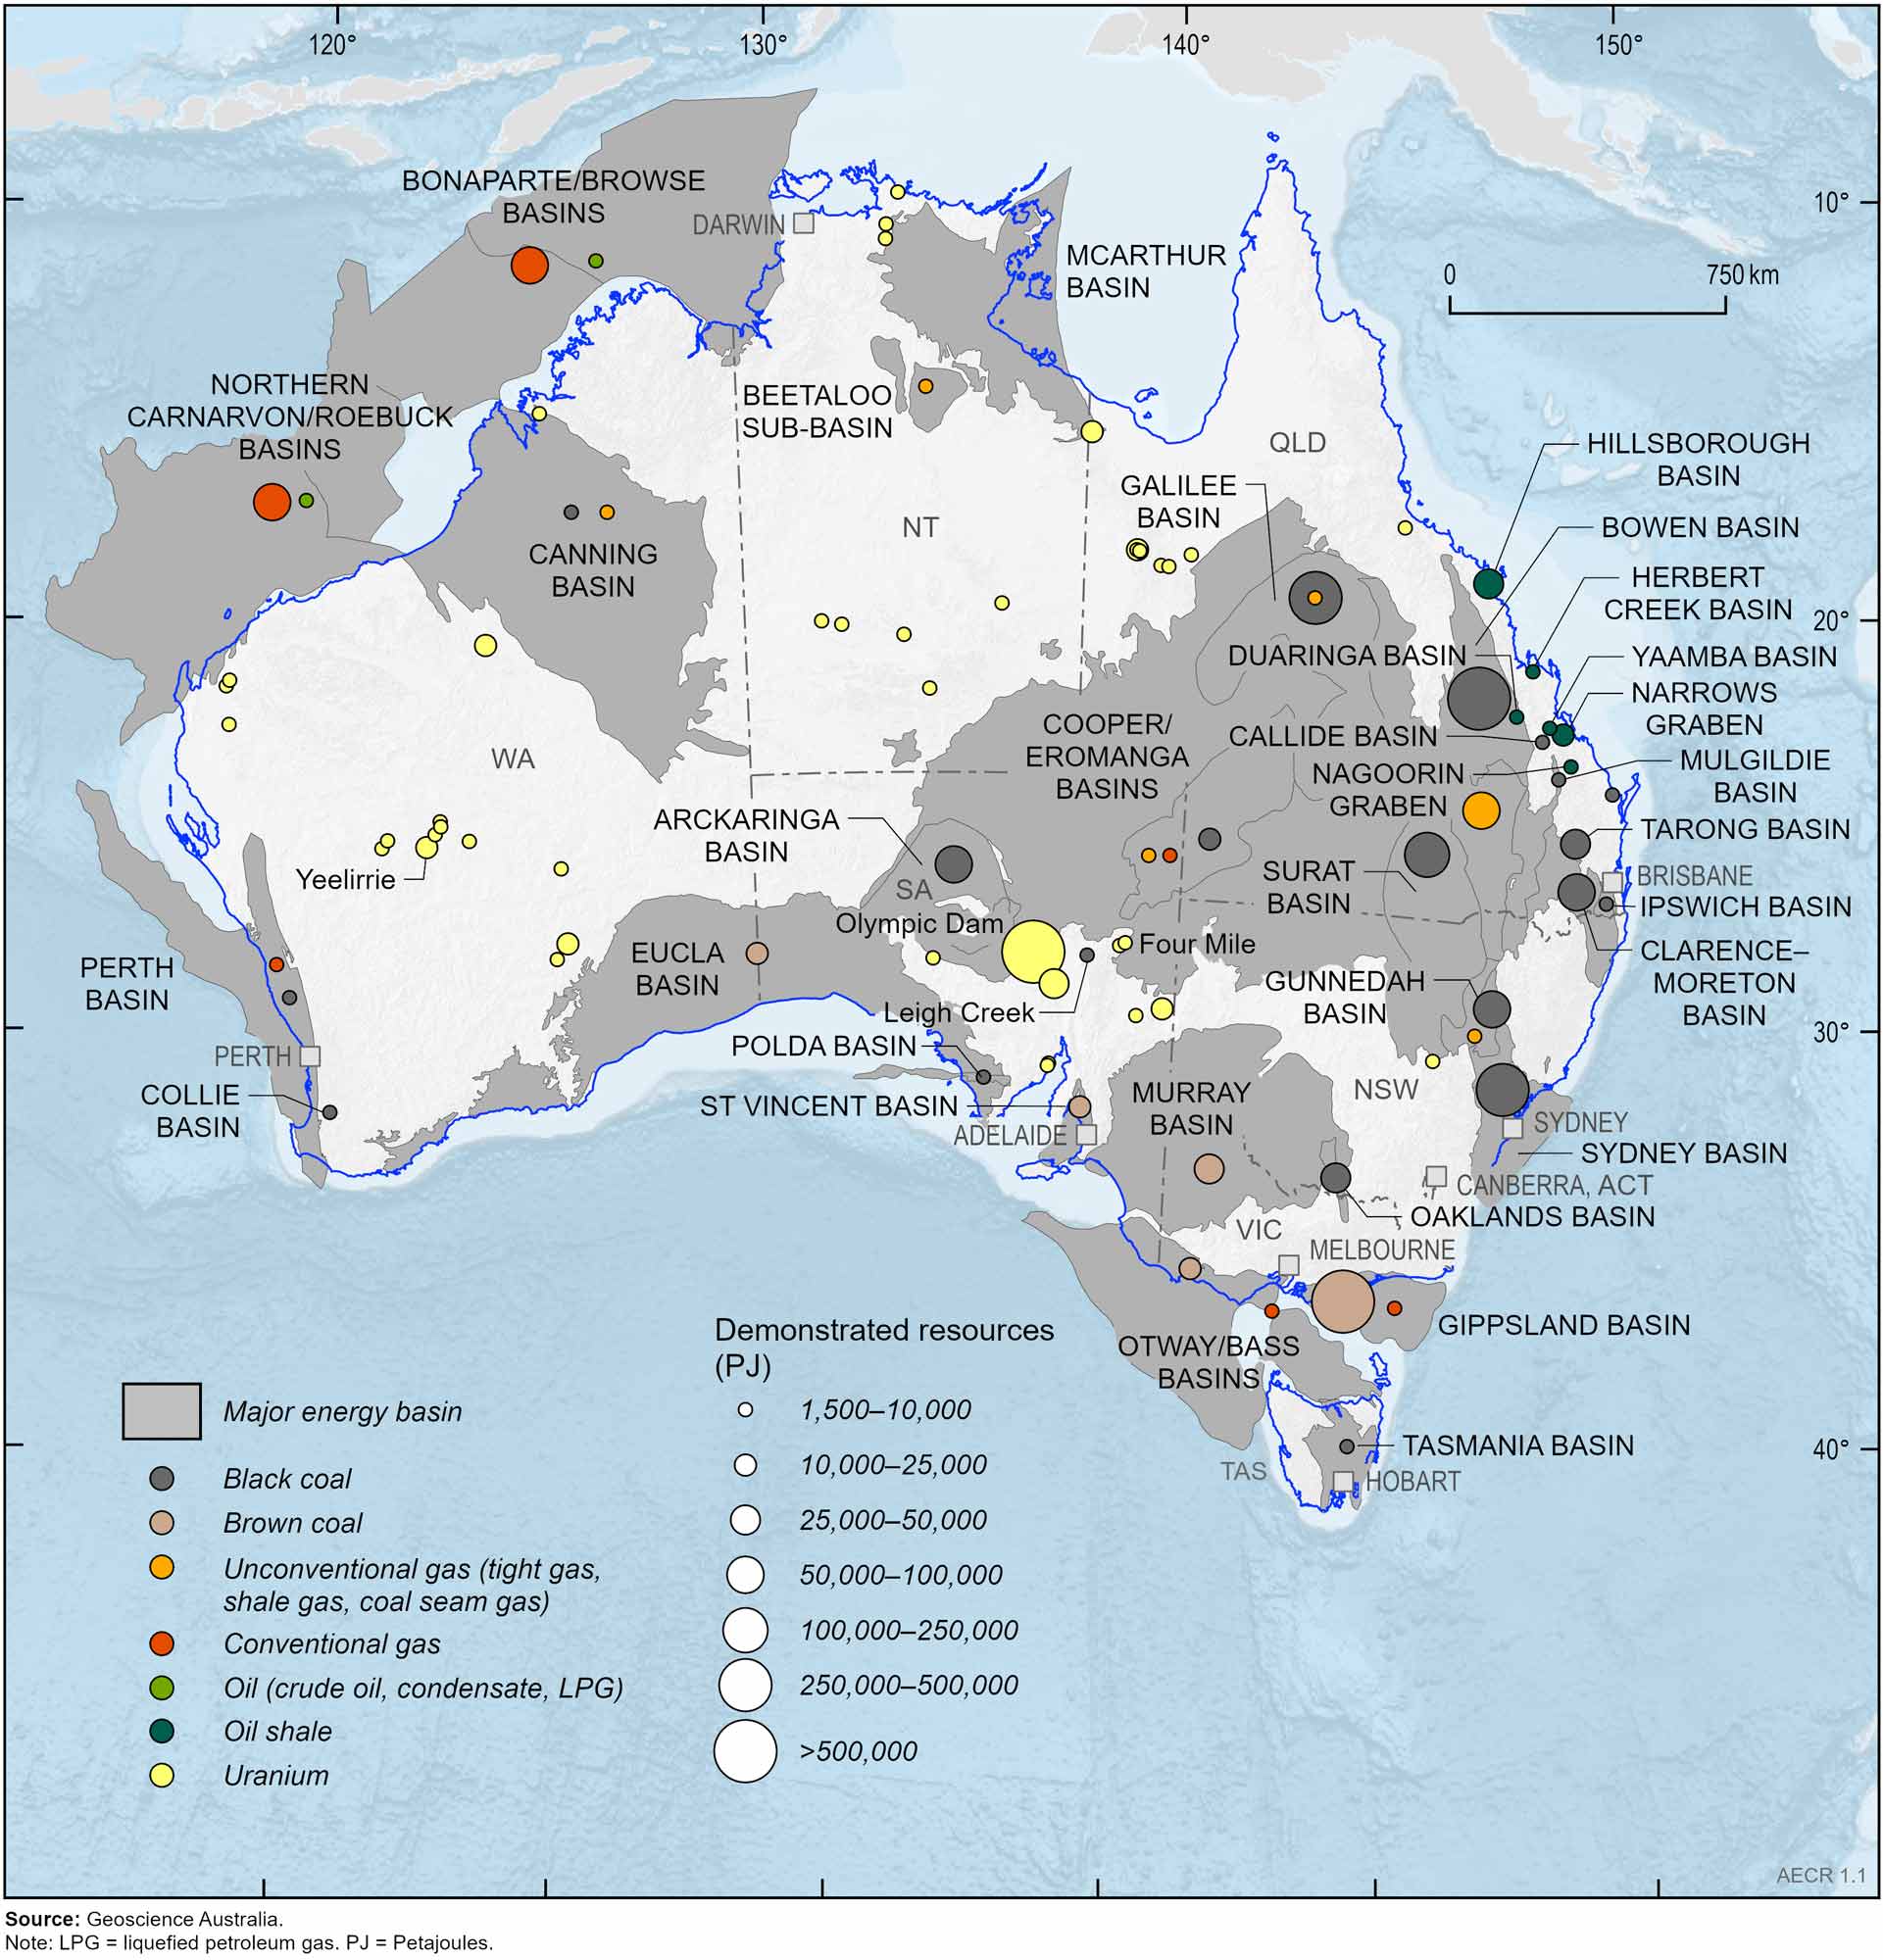
Figure 1.1 Distribution of Australia’s major non-renewable energy commodity resources in 2024 (by basin or deposit), which contain total demonstrated resources greater than 1,500 PJ.
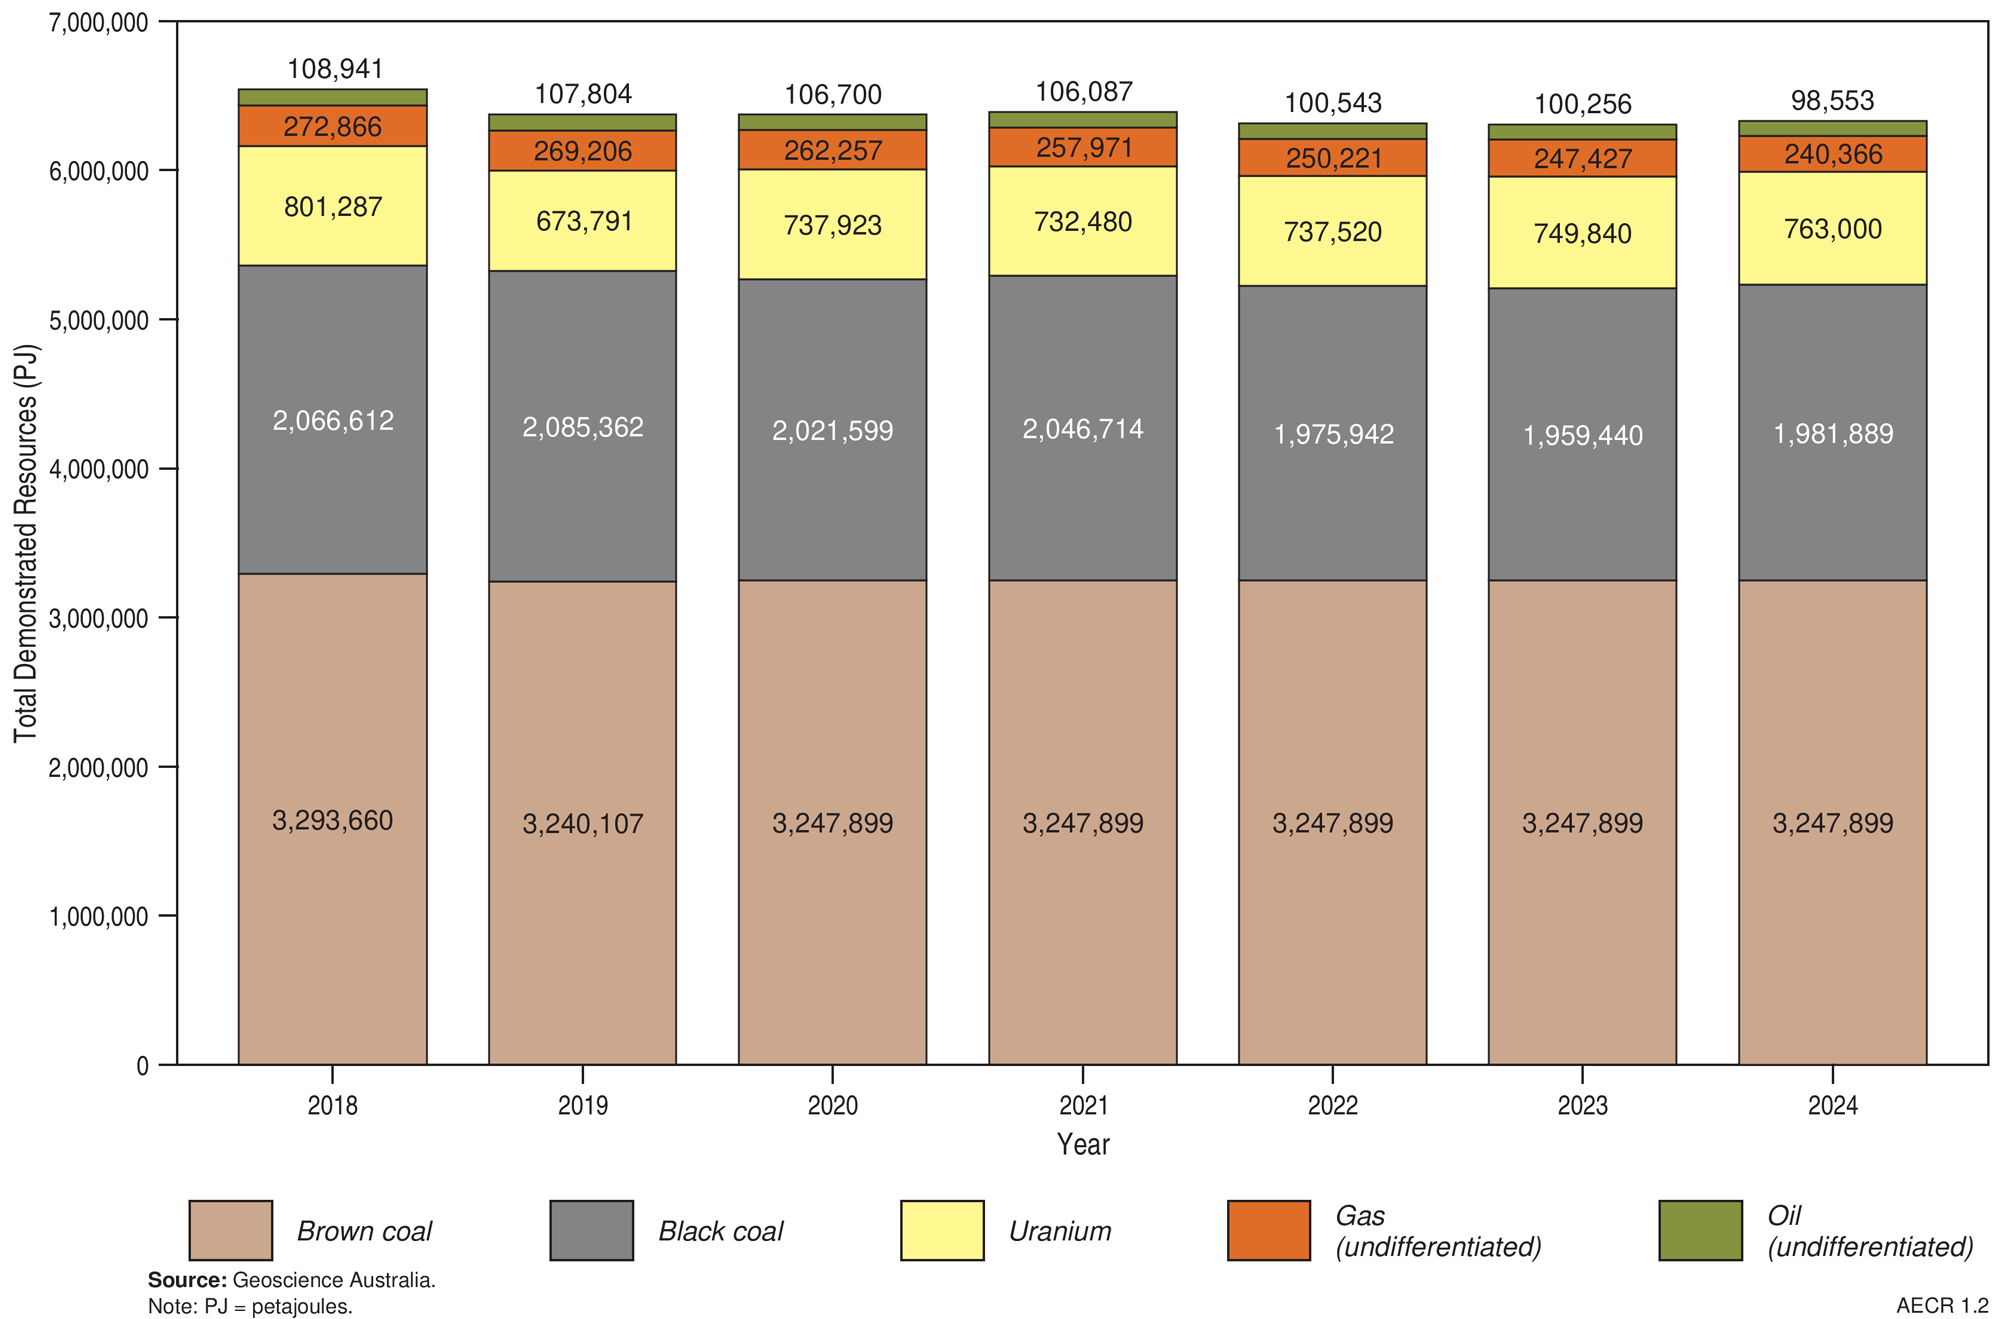
Figure 1.2 Trends in Australia’s total demonstrated non-renewable energy commodity resources for 2018–24.
Table 1.1 Australia's total demonstrated non-renewable energy resources, reserves, production and estimated reserves life in 2024.
| Resource | Unit | Note | TDR 2024 | TDR % change 2023–2024 | Producing basins /deposits4 | Production 2024 | Production % change 2023–2024 | Reserves 2024 | Reserves % change 2023–2024 | Reserve Life 2024 |
|---|---|---|---|---|---|---|---|---|---|---|
| Crude oil | PJ | 1, 2 | 3,849 | -15 | 9 | 162 | -10.7 | 1,255 | -6.8 | 8 |
| Condensate | PJ | 1, 2 | 13,732 | -6 | 11 | 397 | 0.2 | 5,288 | -8.6 | 13 |
| LPG | PJ | 1, 2 | 1,083 | -17 | 6 | 35 | -12.5 | 353 | -15.7 | 10 |
| Oil shale | PJ | 1 | 78,966 | 0 | - | - | 0.0 | - | - | - |
| Unconventional oil (undifferentiated) | PJ | 1 | 922 | 3 | - | - | 0.0 | - | - | - |
| Conventional gas | PJ | 1, 2 | 166,276 | -5 | 12 | 4,671 | 0.0 | 70,169 | -5.9 | 15 |
| Coal seam gas | PJ | 1, 2 | 53,812 | -4 | 3 | 1,665 | 4.5 | 28,955 | -5.3 | 17 |
| Coal seam gasification | PJ | 1 | 2,622 | 0 | - | - | 0.0 | 0 | -100.0 | - |
| Unconventional gas (undifferentiated) | PJ | 1 | 17,655 | 23 | - | - | 0.0 | - | - | - |
| Black coal | PJ | 2, 3, 4 | 1,981,889 | 1 | 96 | 11,398 | 5.7 | 1,877,705 | 1.2 | 165 |
| Brown coal | PJ | 2, 3, 4 | 3,247,899 | 0 | 3 | 416 | 3.8 | 730,660 | 0.0 | 1,756 |
| Uranium | PJ | 2, 4, 5 | 763,000 | 2 | 2 | 2,607 | -0.6 | 184,240 | -0.6 | 71 |
| Thorium | kt | 6 | 788 | -1 | - | - | 0.0 | - | - | - |
| Total resources | PJ | 7 | 6,331,706 | 0.4 | 21,352 | 3.2 | 2,898,624 | 0.5 | 136 |
Abbreviations
kt = thousand tonne; LPG = liquefied petroleum gas; PJ = petajoule; TDR = total demonstrated resources.
Notes
1. Total demonstrated resources (TDR) = 2P reserves plus 2C contingent resources from the PRMS classification system. 2. Producing basins relates to oil and gas, producing deposits relates to black coal, brown coal and uranium. 3. TDR = demonstrated recoverable coal resources. Reserves = economic demonstrated resources. 4. Coal production data for 2024 is based on 2023–24 data published in the Australian Energy Statistics Update 2025. 5. Uranium TDR equates to the NEA-IAEA category 'Reasonably assured recoverable resources at <US$260/kg'. 6. A conversion into energy content equivalent for thorium was not available at the time of publication. 7. Excludes thorium resources.
Source: Geoscience Australia (2025); Hughes et al. (2026); DCCEEW (2025a).
Table 1.2 Australia's total demonstrated non-renewable energy resources 2014* to 2024.
| Resource | Unit | Note | TDR 20142,4 | TDR 2018 | TDR 2019 | TDR 2020 | TDR 2021 | TDR 2022 | TDR 2023 | TDR 2024 | TDR % change 2018–2024 |
|---|---|---|---|---|---|---|---|---|---|---|---|
| Crude oil | PJ | 1, 2 | 7,066 | 6,474 | 5,661 | 5,205 | 4,546 | 4,791 | 4,555 | 3,849 | -29.6% |
| Condensate | PJ | 1, 2 | 16,463 | 16,213 | 15,951 | 15,448 | 15,581 | 14,787 | 14,534 | 13,732 | -10.4% |
| LPG | PJ | 1, 2 | 5,957 | 1,483 | 1,421 | 1,207 | 1,155 | 1,294 | 1,307 | 1,083 | -11.9% |
| Oil shale | PJ | 1, 2 | 0 | 84,436 | 84,436 | 84,436 | 84,436 | 78,830 | 78,966 | 78,966 | -6.5% |
| Unconventional oil (undifferentiated) | PJ | 1, 2 | 0 | 335 | 335 | 404 | 369 | 841 | 893 | 922 | 166.6% |
| Conventional gas | PJ | 1, 2 | 186,235 | 194,239 | 196,133 | 192,252 | 187,839 | 176,710 | 174,625 | 166,276 | -10.1% |
| Coal seam gas | PJ | 1, 2 | 79,450 | 63,732 | 58,248 | 55,131 | 57,316 | 56,348 | 55,867 | 53,812 | -12.3% |
| Coal seam gasification | PJ | 1 | na | 1,469 | 2,622 | 2,622 | 2,622 | 2,622 | 2,622 | 2,622 | 78.5% |
| Unconventional gas (undifferentiated) | PJ | 1, 2 | 14,000 | 13,426 | 12,203 | 12,252 | 10,194 | 14,541 | 14,313 | 17,655 | 31.5% |
| Black coal | PJ | 3, 4 | 1,999,669 | 2,066,612 | 2,085,362 | 2,021,599 | 2,046,714 | 1,975,942 | 1,959,440 | 1,981,889 | -5.2% |
| Brown coal | PJ | 3, 4 | 3,250,352 | 3,293,660 | 3,240,107 | 3,247,899 | 3,247,899 | 3,247,899 | 3,247,899 | 3,247,899 | -1.4% |
| Uranium | PJ | 4, 5 | 718,083 | 801,287 | 673,791 | 737,923 | 732,480 | 737,520 | 749,840 | 763,000 | -6.4% |
| Thorium | kt | 4, 6 | 130 | 130 | 560 | 635 | 604 | 795 | 796 | 788 | 512.3% |
| Total resources | PJ | 7 | 6,277,275 | 6,543,366 | 6,376,270 | 6,376,378 | 6,391,151 | 6,312,125 | 6,304,862 | 6,331,706 | -3.2% |
Abbreviations
kt = thousand tonne; LPG = liquefied petroleum gas; PJ = petajoule; TDR = total demonstrated resources; na = not available.
Notes
1. TDR = total demonstrated resources = 2P reserves plus 2C contingent resources from the PRMS classification system. 2. Oil and gas data for the end 2014 are as reported by Geoscience Australia (2018). 3. Demonstrated recoverable coal resources. 4. Coal, uranium and thorium data for the end of 2016 are as reported by Geoscience Australia (2018). 5 Uranium TDR equates to the NEA-IAEA category 'Reasonably assured recoverable resources at <US$260/kg'. 6. A conversion into energy content equivalent for thorium was not available at the time of publication. 7. Excludes thorium resources.
Source: Geoscience Australia (2025); Hughes et al. (2026).
Box 1.1 Energy resource estimates and terminology
Estimating energy resource volumes requires a consistent approach to describing commodity reserves and resources to ensure results are reliable and easily comparable. Appendix 4 outlines the various resource classification systems used in AECR to describe the commerciality of energy resources. These systems use levels of geological knowledge and confidence to distinguish between identified and potential resources.
For the purposes of the AECR publication the following terminologies are used to describe the various energy resource classifications:
Identified resources are those for which measurements have been made to quantify their extent and grade or quality. A measurement may be, for example, a well drilled into an oil reservoir to provide a sample. The process of ‘proving’ that a resource is suitable for development is one of reducing uncertainty through the measurement of the nature of the resource, and its commercial and social viability.
‘Reserves’ and ‘economic demonstrated resources (EDR)’ are terms used to describe non-renewable energy resources that are known to exist in sufficient quantity and grade confirming their commercial and social viability. ‘Contingent resources’ or ‘sub economic resources’ are the terms used to describe resources that have been confirmed to exist and are potentially recoverable but are either not yet considered mature enough for commercial development or are not currently viable and/or economic to extract. Total demonstrated resources (TDR) is the sum of these two resource classes.
‘Potential resources’ are identified by indirect evidence with a high degree of uncertainty around their existence and viability. The potential resource base is often described by the terms ‘prospective’, ‘undiscovered’ or ‘inferred’. These potential resources require further exploration programs to demonstrate if a resource is present, followed by appraisal programs to determine the economic and technical viability of extracting any identified resources.
Furthermore, the resource base cannot be considered in isolation from energy conversion technologies. For example, global energy security increased when advances in hydraulic fracturing technologies enabled non viable shale oil and shale gas resources in the United States to be commercially exploited. Estimating the resource base requires setting a cut-off grade—for example, either a minimum estimated ultimate recovery of gas in a reservoir for conventional hydrocarbons or a well drainage area for unconventional hydrocarbons. An energy conversion technology is implicit in this process; therefore, the minimum viable resource is determined not only by the inherent nature of the resource, but also by the technology available to produce it.
Due to their risk and uncertain nature, only a limited set of prospective resource estimates are published each year by energy companies. Consequently, it is not possible to provide a complete aggregation of all prospective resources in Australia using published prospective resource estimates.
Mineral and petroleum energy resource estimates are often documented as industry standard measurements of volume or mass. Coal and uranium are generally measured by weight (tonnes), while oil and gas are generally measured by volume (barrels/cubic feet). However, the energy content of different energy commodities varies significantly. In this assessment, energy resource estimates have been converted to a common energy unit—petajoules (PJ)—to allow direct comparisons of different energy commodities. Appendix 3 provides measurement units, average energy contents and conversion factors for the various energy commodities.
Changes in resources estimates can usually be attributed to one, or a combination, of the following factors:
- Increases in resources resulting from discoveries of new accumulations or deposits and delineation of extensions of known resources.
- Depletion of resources as a result of production.
- Advances in extraction techniques and technologies, enabling economic extraction of resources previously deemed uneconomic.
- Significant changes in energy commodity prices, driven largely by global trends in the supply and demand of energy resources.
Estimating energy reserve life
- future production rates remain the same as the 2024 production rates used in the calculation.
- accumulations and deposits deemed as identified reserves in 2024 will remain so in the future and not be reclassified as identified, prospective or contingent resources; and
- depleted reserves are not replaced by new discoveries or conversion of contingent resources to reserves.
Gas resources
Australia has substantial conventional gas resources that are located mostly off the northwest coast of Western Australia, and significant onshore unconventional resources (coal seam gas, shale gas, and tight gas). In 2024, Australia’s TDR for its conventional and unconventional gas is estimated at 240,366 PJ (214 trillion cubic feet [Tcf]), of which 99,124 PJ (88.1 Tcf) are classified as proven and probable (2P) reserves.
In 2024, Australia’s TDR for conventional gas is estimated to be 166,276 PJ (147.8 Tcf), a decrease of 4.8% from 2023. This decrease continues the trend of natural field decline seen since 2019 as conventional gas production exceeds the discovery rate for new resources. At 2024 production rates, the estimated life for Australia’s conventional gas reserves (70,169 PJ; 62.4 Tcf) is 15 years. Most of the remaining identified conventional gas resources occur in basins on Australia’s North West Shelf.
Coal seam gas (CSG) resources are located in Australia’s east in the Bowen/Surat, Galilee and Gunnedah basins. In 2024, TDR for Australia’s CSG are estimated at 53,812 PJ (47.8 Tcf), a decrease of 3.7% from 2023. At 2024 production rates, Australia’s 28,955 PJ (25.7 Tcf) of CSG reserves has an estimated life of 17 years.
Prospective shale gas, tight gas, deep coal gas and basin centred gas resources are held in low permeability reservoirs across Australia. Most of these resources are located in the Bowen/Surat, Canning, and Cooper basins and the Beetaloo Sub-basin, McArthur Basin. In 2024, TDR for unconventional gas (excluding CSG and in-situ coal seam gasification) totalled 17,655 PJ (15.7 Tcf), representing a 23.4% increase from 2023. There were no identified unconventional gas reserves in 2024 and due to the lack of production there is no resource life estimation for these unconventional gas resources.
Oil resources
Australia’s conventional liquid hydrocarbon resources include crude oil and the condensate plus liquefied petroleum gas (LPG) resources associated with gas accumulations (as phases of natural gas liquids). Australia also has significant unconventional oil resources, although these are currently undeveloped. In 2024 Australia’s TDR for all oil resources are estimated at 98,553 PJ (16,835 million barrels [MMbbl]), of which 6,895 PJ (1196.5 MMbbl) are classified as proven and probable (2P) reserves. Approximately 80% of these resources are associated with unconventional oil shale deposits. Australia is reliant on crude oil and refined petroleum imports to meet its energy requirements, importing about 95% of our crude oil and refined oil products. Imports accounted for 79% of total refined product consumption, while imported crude accounted for 60% of total refinery inputs (DCCEEW, 2025a)
Australia’s crude oil resources are small by world standards and are being depleted at a faster rate than they are being replenished by new discoveries. In 2024, TDR for Australia’s crude oil is estimated to be 3,849 PJ (655 MMbbl), a decrease of 15% from 2023, with declines in the most oil producing basins. Based on 2024 production rates, the estimated life for Australia’s crude oil reserves is 8 years.
Australia’s liquefied petroleum gas (LPG) resources are relatively small with an estimated TDR of 1,083 PJ (257 MMbbl) in 2024, a decrease of 17% from 2023. Based on 2024 production rates, the remaining life for Australia’s LPG reserves is about 10 years. Australia has significantly more condensate than crude oil and LPG resources, with an estimated TDR of 13,732 PJ (2,335 MMbbl) in 2024, a decrease of 6% from 2023. Most condensate resources are associated with LNG projects in the Northern Carnarvon and Browse basins on the North West Shelf. Based on 2024 production rates, these condensate reserves have an estimated life of about 13 years.
Unconventional oil resources in onshore basins are undeveloped and comprise oil shale (TDR of 78,966 PJ; 13,430 MMbbl), together with minor condensate (905 PJ; 154 MMbbl) and LPG (17 PJ; 4 MMbbl) associated with unconventional gas resources. Australia does not have any unconventional oil reserves or production.
Coal resources
Australia’s coal resources are world class in terms of volume and quality. As of December 2024, TDR for Australia’s recoverable black and brown coal are estimated to be 5,229,788 PJ (409,672 million tonnes [Mt]). In addition to having a large TDR of coal, Australia also has significant Inferred coal resources.
TDR for black coal is estimated to be 1,981,889 PJ (78,248 Mt). Black coal resources are found in most states, with the largest TDR in the Bowen/Surat basins in Queensland and the Sydney Basin in New South Wales. In 2024, Australia’s black coal TDR increased by 1.1% and EDR for black coal grew by 1.2% (Hughes et al., 2026).
Australia has vast brown coal resources; however, these have a much lower energy content than black coal. Brown coal TDR are estimated to be 3,247,899 PJ (331,424 Mt) and are located mainly in Victoria’s Gippsland Basin. Australia’s brown coal reserves remain unchanged since 2021.
At 2024 production rates, Australia’s coal resources are sufficient to support many decades of production, well beyond the targeted phase out of coal as a major source of energy in Australia (DCCEEW, 2025a).
Uranium and thorium resources
Australia hosts the largest uranium resources in the world with more than one-third of the world’s known uranium resources. As of December 2024, TDR for Australia’s uranium resources are estimated to be 763,000 PJ (1,362 thousand tonnes [kt]). Although most Australian jurisdictions host uranium deposits, the largest known resources are concentrated in South Australia, the Northern Territory and Western Australia. Australia’s TDR for uranium resources showed a minor increase of 1.8% in 2024.
Australia also has a major share of the world’s thorium resources, which while not currently in use as an energy resource, could play a role as a nuclear energy source in the future. In 2024, Australia’s total identified in situ thorium resources were approximately 1,391 kt, most of these resources are associated with heavy mineral sand deposits.
Enabling Clean Energy Technologies
Clean energy technologies are rapidly being developed in Australia to meet emission reduction targets, including renewable energy, carbon capture and storage (CCS), as well as renewable and low emissions hydrogen production.
The Australian Government is committed to reaching net zero emissions by 2050, and in September 2025, released Australia’s Net Zero Plan that sets a national target to reduce emissions by 62–70% below 2005 levels by 2035 (DCCEEW, 2025b). The Net Zero Plan identifies 5 priority decarbonisation actions to reduce key emissions sources across the economy and is supported by six detailed sector plans that aim to ensure a fair and orderly transition to net zero.
The Net Zero Plan and 2035 emissions reduction target builds on the strong foundations laid in the past three years—including the legislated target of a 43% reduction in emissions on 2005 levels by 2030 (DISR, 2022) and the Safeguard Mechanism reforms that set reduced emissions limits for large emitters, including for energy commodity projects (DCCEEW, 2023)—to accelerate progress toward net zero emissions by 2050.
Geological energy resources are increasingly considered through the lens of subsurface utilisation, reflecting both resource extraction and pore space uses. Beyond conventional extraction (e.g. oil and gas), emerging opportunities include the recovery of natural (geogenic) hydrogen and the use of geothermal energy, alongside the use of subsurface pore space to store energy carriers and emissions. This includes temporary storage of hydrogen and compressed air, as well as the permanent geological storage of carbon dioxide. These applications highlight the expanding role of subsurface resources in supporting energy system flexibility, storage and decarbonisation.
Hydrogen
Hydrogen remains a strategically important emerging industry for Australia’s decarbonisation and industrial transformation, with potential applications in green metals, chemicals, low-carbon fuels and selected transport uses. Progress in 2025 was significant but uneven. By the end of 2025, more than 50 companies were advancing around 76 hydrogen projects. This included 17 operating projects, 11 under construction and 48 under development (Rees and Grubnik, 2025). Major policy measures—including the Hydrogen Production Tax Incentive, Hydrogen Headstart and the Guarantee of Origin scheme—have strengthened the foundations for industry growth (CSIRO, 2025). However, high production costs, slow demand growth and project delays continue to weigh on near-term deployment, even as Australia retains strong long-term potential as a renewable hydrogen producer.
Australia has extensive world-class renewable and non-renewable energy resources that can support the development of a new clean hydrogen industry. In 2025, total clean hydrogen production increased by 69% from the previous year to 1,180 tonnes per year as projects progressed from pilot to demonstration scale. In addition to hydrogen production, Australia is prospective for naturally occurring hydrogen resources. Although the geological controls for the occurrence of this resource are not yet completely understood, exploration for hydrogen is expanding, as evidenced by the recent uptake of exploration permits targeting natural hydrogen. In 2025, Australia had an estimated 8 PJ of contingent resources for naturally occurring hydrogen.
Carbon capture and storage
Carbon Capture and Storage (CCS) and/or carbon capture, utilisation and storage (CCUS) is a decarbonisation tool that can be applied to prevent the release of CO2 from stationary greenhouse gas emission sources and to remove CO2 emissions directly from the atmosphere. The CCS value chain includes capturing, transporting, compressing, and injecting CO2 into deep underground geological formations where it is permanently trapped. Together with a range of other decarbonisation solutions, the large-scale implementation of CCS in Australia is widely regarded as necessary for meeting Australian emissions reduction targets.
The CCS landscape in Australia is rapidly evolving. Since 2022, there has been considerable activity with respect to the legislative and regulatory frameworks that govern and enable CCS in Australia. There are now frameworks enabling greenhouse gas storage in place in South Australia, Victoria, Queensland, Western Australia as well as in the offshore Commonwealth jurisdiction.
As of December 2025, there are 19 commercial CO2 storage projects across Australia, plus several research facilities and programs. Two of these are operational, commercial-scale CCS facilities: the Gorgon CCS Project and the Moomba CCS Project. The Gorgon CCS Project has been operating since 2019 and as of December 2025 had stored more than 11 million tonnes (Mt) of CO2.The Moomba CCS became operational in late September 2024, and by December 2025 had stored 1.57 Mt of CO2-equivalent. There are 17 Commonwealth Offshore Greenhouse Gas Storage assessment permits located in the Bonaparte, Browse, Northern Carnarvon, Perth, Otway, Bass and Gippsland basins. Collectively these represent work program commitments of approximately A$1 billion. In 2025, Australia’s reported demonstrated CO2 storage resources (2P capacity and 2C contingent resources) were 988 Mt CO2, an increase of 47% year on year, with a further estimated 31 gigatonnes (Gt) of sub-commercial (theoretical) CO2 storage resources.
Geoscience Australia, together with other commonwealth, state and territory agencies, is undertaking a detailed assessment of Australia’s geological CO2 storage resource potential under the Australian Government’s Resourcing Australia’s Prosperity Initiative.
Geothermal energy
Geothermal energy is a form of renewable energy that comes from the natural heat stored beneath the Earth's surface. It is not variable and does not require energy storage to provide a constant supply of electricity or heat. In Australia, geothermal installations include many ground-source heat pumps, mostly installed in the colder regions, as well as numerous direct-use installations, largely located in the Perth, Otway, Gippsland and Great Artesian basins.
Australia’s geothermal sector remains in the early stages of development, characterised by growing exploration activity and limited deployment. The number of exploration permits remains high, but most projects remain at the early stages. Direct-use applications, such as heating and cooling, are the most mature segment of the sector. In 2025, direct geothermal and ground source heat pump capacity in Australia reached 134 MWth, increasing by 25% since 2023.
Globally, geothermal remains a small contributor to overall energy supply, but provides reliable clean power. Technological advances are expanding its potential beyond traditional regions and may enable the future expansion in geothermal energy development in Australia.
References
CSIRO (Commonwealth Scientific and Industrial Research Organisation), 2025. HyResource - Funding. (Last accessed 6 May 2026).
DCCEEW (Department of Climate Change, Energy, the Environment and Water), 2023. Safeguard Mechanism. (Last accessed 6 May 2026).
DCCEEW (Department of Climate Change, Energy, the Environment and Water), 2024b. National Hydrogen Strategy 2024. (Last accessed 6 May 2026).
DCCEEW (Department of Climate Change, Energy, the Environment and Water), 2025a. Australian Energy Update 2025. (Last accessed 6 May 2026).
DCCEEW (Department of Climate Change, Energy, the Environment and Water), 2025b. Australia’s Net Zero Plan, 2025.
DISR (Department of Industry, Science and Resources), 2022. Australia’s Nationally Determined Contribution: Communication 2022. (Last accessed 6 May 2026).
DISR (Department of Industry, Science and Resources), 2024. Resources and Energy Major Projects: 2024. (Last accessed May 2026).
Energy Institute, 2025. Statistical Review of World Energy. (Last accessed 6 May 2026).
Geoscience Australia, 2025. Australia's Energy Commodity Resources (AECR), 2025 Edition. Commonwealth of Australia (Geoscience Australia). (Last accessed 6 May 2026).
Hughes, A., Britt, A., Pheeney, J., Kucka, C., Morfiadakis, A., Munns, C., Boyd, J., Senior, A., Cross, A. and Thorne, J., 2026. Australia's Identified Mineral Resources 2025. Commonwealth of Australia (Geoscience Australia).
Rees, S. and Grubnik, P., (2025) Australian Hydrogen Projects Dataset (December, 2025), Geoscience Australia: Canberra.
Data download
Data tables and full report are downloadable from the Geoscience Australia website.
1 Refer to Box 1.1 and Appendix 4 for resource estimates and terminology.