

Key messages
- Coal is a sediment that is largely composed of dead plant matter. It is formed when the accumulated plant matter is buried under anoxic conditions and exposed to increased temperatures and pressures over a long period of time (millions of years). The degree of plant matter alteration is expressed by coal ranks, ranging from peat, lignite, sub-bituminous, bituminous and anthracite. The latter three ranks are commonly referred to as “black coal” while lignite is commonly called “brown coal”.
- Coal is Australia’s largest energy resource. At the end of 2020, Australia’s recoverable Economic Demonstrated Resources were 74,147 million tonnes (Mt) of black coal and 74,039 Mt of brown coal.
- Australia is the fifth largest producer, the second largest exporter and has the third largest reserves of coal in the world.
Summary
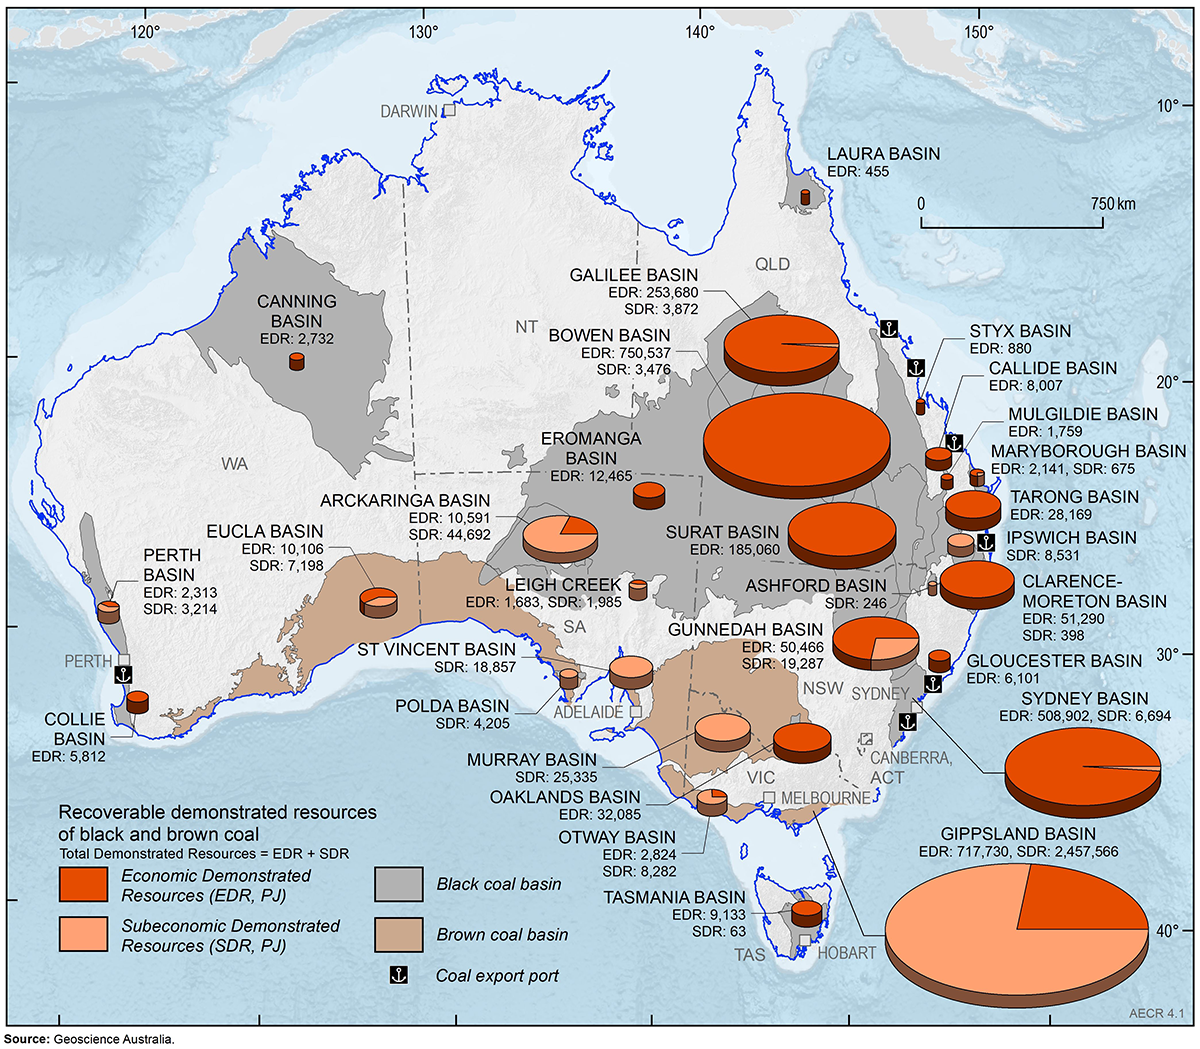
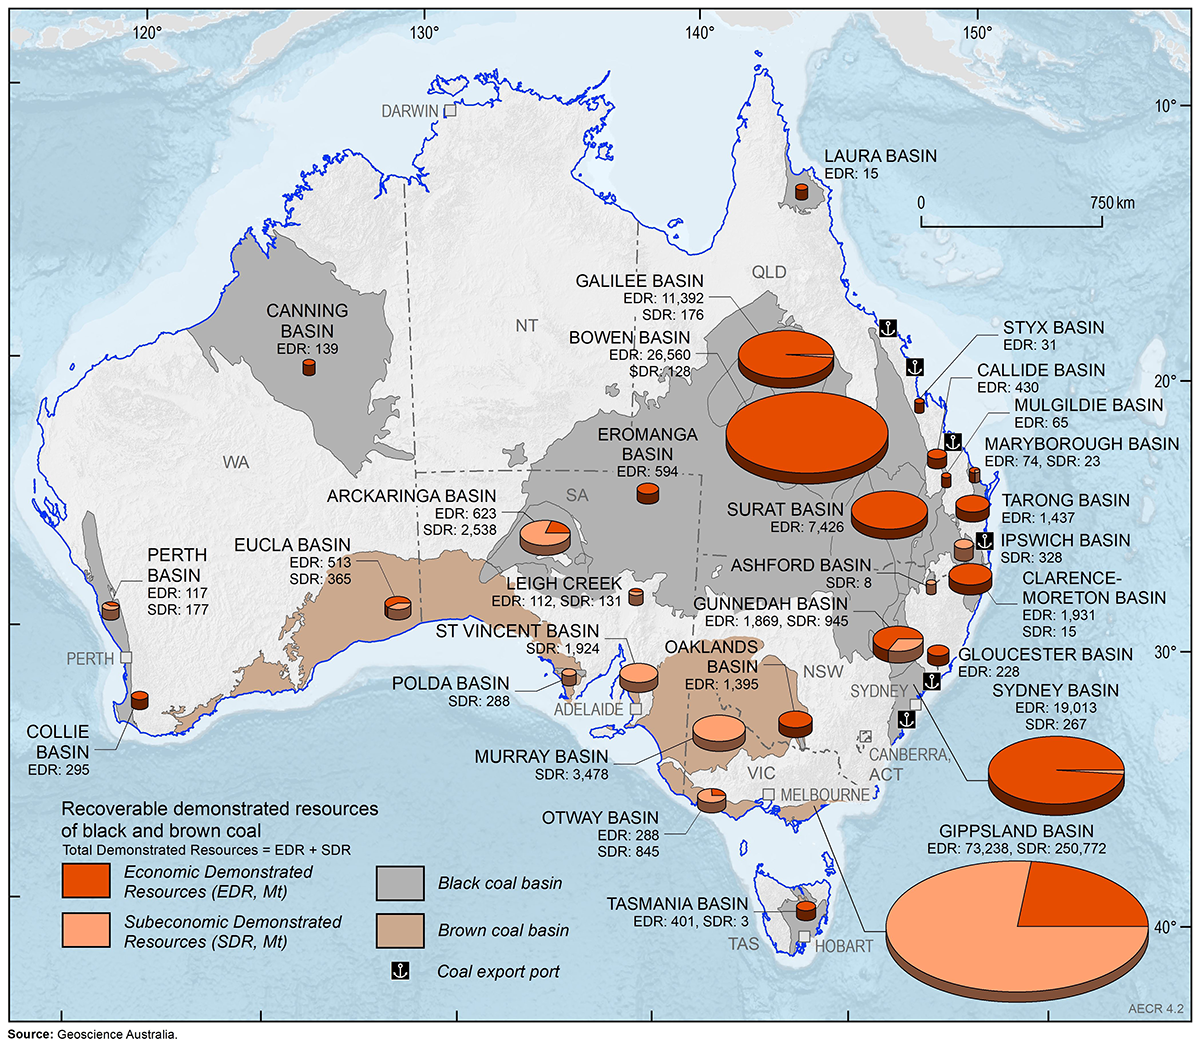
Australia’s coal resources are among the largest in the world (Figure 1; Figure 2). In 2020, in situ Economic Demonstrated Resources (EDR) of black coal was 87,645 million tonnes (Mt) and brown coal amounted to 81,234 Mt (Figure 2).
Recoverable resources, however, provide a more accurate assessment of coal endowment as it includes losses that occur during mining and processing. As at December 2020, Australia’s total recoverable Identified Resources of black coal were estimated at 163,330 Mt, of which recoverable EDR were 74,147 Mt (Figure 2). Australia is ranked fourth, globally, for economically demonstrated black coal resources after the United States, China and India.
At December 2020, the total recoverable Identified Resource of brown coal was estimated at 436,652 Mt, of which recoverable EDR were 74,039 Mt (Figure 2). Australia is ranked second, globally, for economic demonstrated brown coal resources, behind Russia and followed by Germany and USA.
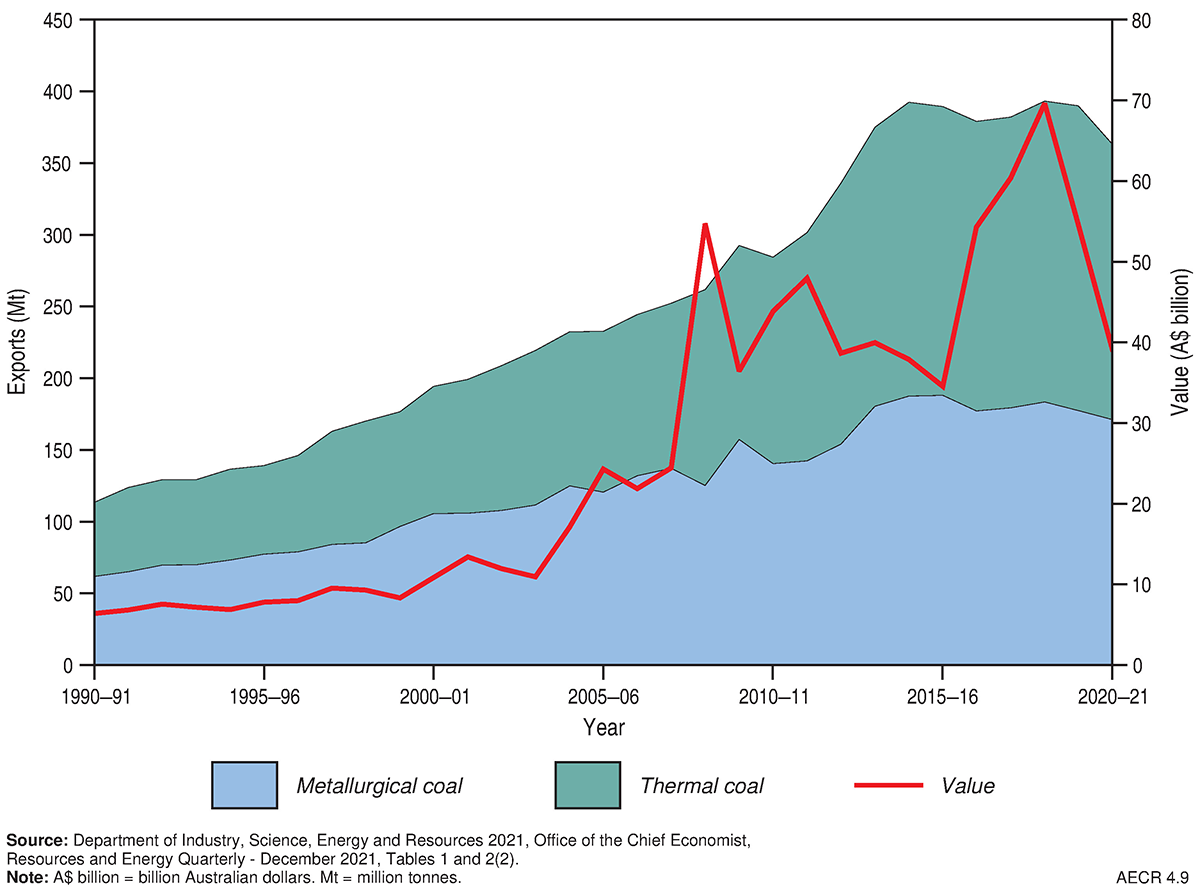
In Australia, black coal is produced in Queensland, New South Wales, Western Australia and Tasmania with the majority exported to overseas markets. By the end of 2020, export earnings from black coal totalled $43.37 billion, down from $63.94 billion at the end of 2019 (Department of Industry, Science, Energy and Resources, 2022). Japan and other Asian countries are prime destinations for Australian coal.
In 2020, coal exploration expenditure was $291.6 million, an increase of 27.2 per cent on 2019 ($229.3 million). Much of the expenditure occurred in Queensland, and coal exploration was approximately 10 per cent of the 2020 total exploration spend (Australian Bureau of Statistics, 2022).
Australia's identified resources
Australia’s coal resources are expressed as Economic Demonstrated Resources (EDR), Subeconomic Demonstrated Resources and Inferred Resources as defined below:
- EDR combines proved reserves, probable reserves, and economic measured resources and indicated resources, as defined by the Australasian Code for Reporting of Exploration Results, Mineral Resources and Ore Reserves also called the 'JORC Code' (Joint Ore Reserves Committee [JORC], 2012);
- Subeconomic Demonstrated Resources are resources that are currently deemed unsuitable for economic extraction but could potentially be used in the future; and
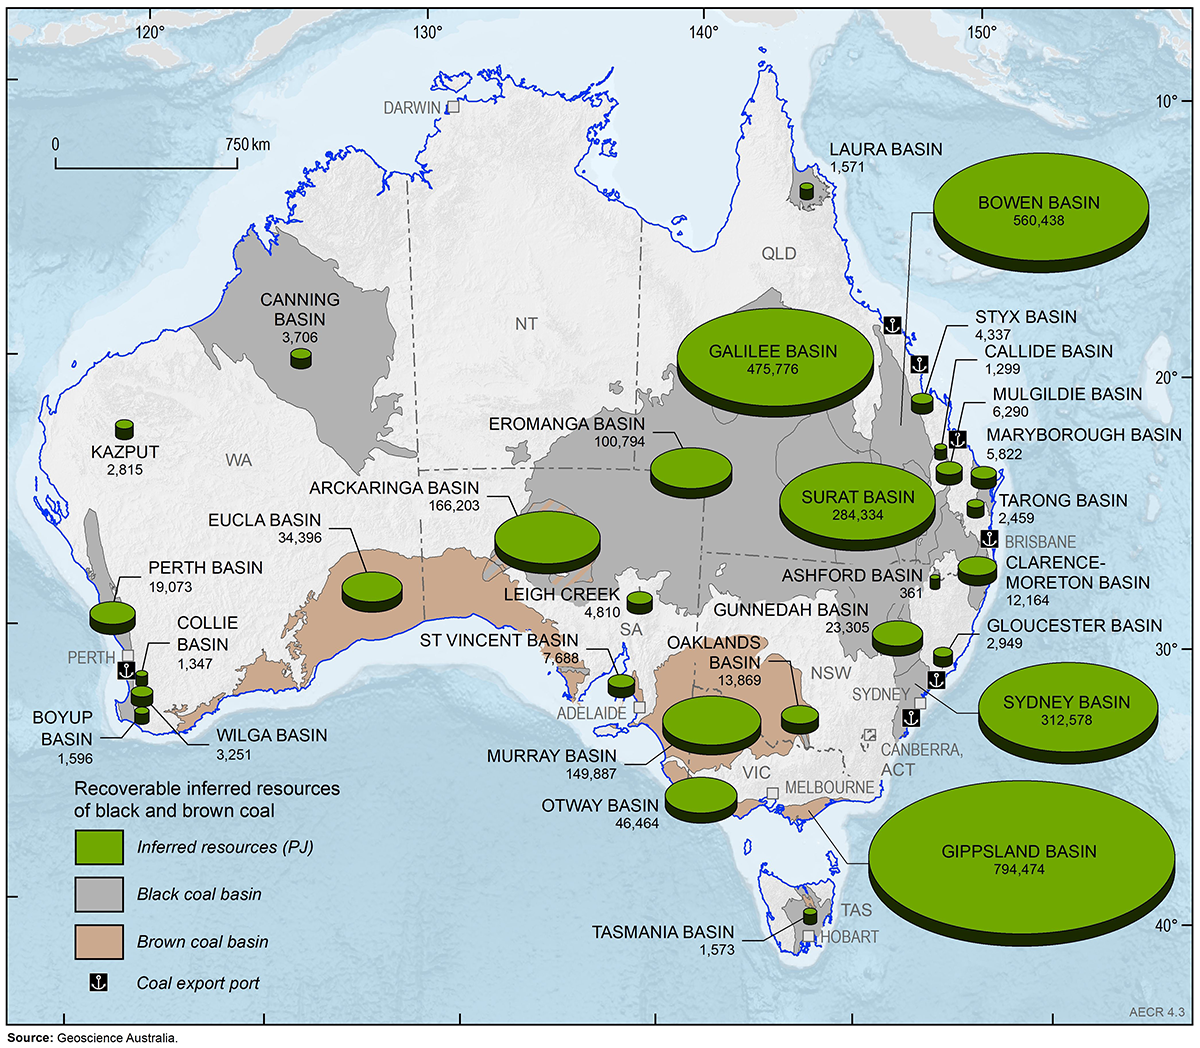
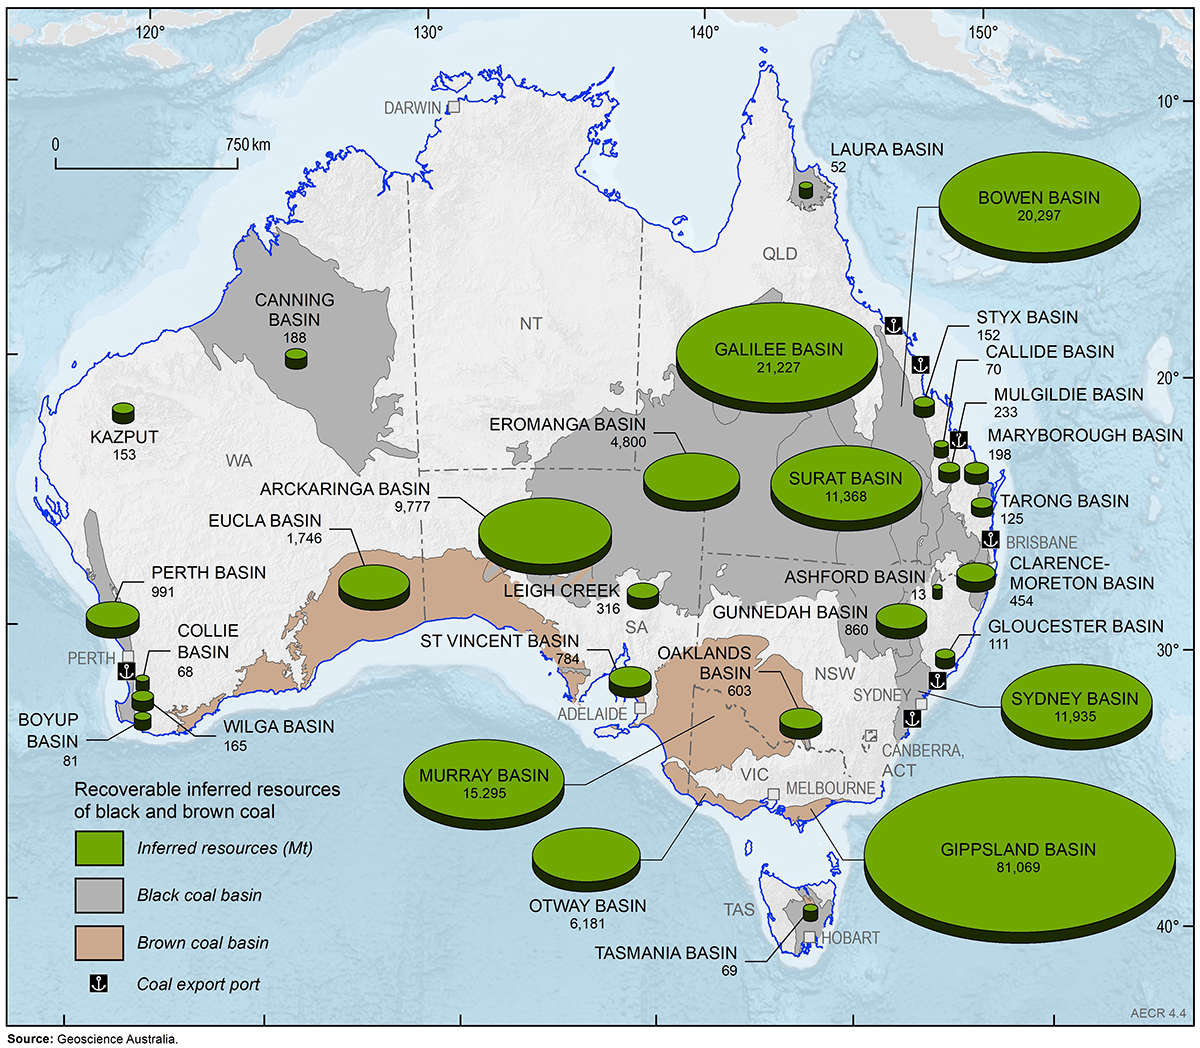
- Inferred Resources are a less accurate estimate of a resource. They are those parts of a resource accumulation that are estimated at the lowest level of confidence; they are not differentiated as either economic or subeconomic because there is not enough information to make this determination.
A range of coal quality specifications are preferred for different markets. The specific energy of the coal is the amount of coal required to produce a given heat output—an important parameter for the thermal coal market. Ash is the non-combustible portion that remains when coal is heated at a high temperature, and coal naturally has a certain moisture content. Both ash and moisture dilute the amount of energy that a coal can produce. Coal ash creates extra costs due to the requirement for its capture and disposal, whereas moisture content increases the relative freight cost per unit of energy. Other important coal quality parameters include sulphur, volatile matter and carbon levels (Coalfield Geology Council of New South Wales, 2011).
At 31 December 2020, Australia had substantial EDR (Table 1 and Table 2; Figure 1 and Figure 2) and Inferred Resources (Table 1 and Table 2; Figure 3 and Figure 4) of black and brown coal.
Black coal
Most of Australia’s black coal EDR is in Queensland and New South Wales, followed by South Australia, Western Australia and Tasmania. There are two main types of black coal products: metallurgical coal and thermal coal. Metallurgical coal (also called met coal or coking coal) is mostly used for steel making and other industrial processes. Thermal coal (also called steaming coal) is used for electricity generation.
Total in-situ resources of black coal in Australia (EDR plus Subeconomic Demonstrated Resources plus Inferred Resources) are estimated at 201,506 Mt, comprising 87,645 Mt of EDR, 6,789 Mt of Subeconomic Demonstrated Resources and 107,072 Mt of Inferred Resources. Australia’s total recoverable Identified Resources of black coal are estimated to be 163,331 Mt, comprising 74,147 Mt of EDR, 5,027 Mt of Subeconomic Demonstrated Resources and 84,157 Mt of Inferred Resources (Table 1).
In 2020, the estimate of Australia’s recoverable EDR of black coal was revised downwards from 75,428 Mt to 74,147, a decrease of 1,281 Mt, or 1.7 per cent, from the previous year. Despite the overall decrease, additions to EDR came from Queensland’s Bowen Basin at Peak Downs (BHP Mitsubishi Alliance) and Winchester South (Whitehaven Coal). Additional Inferred Resources came from Queensland’s Bowen Basin at Curragh (Coronado Resources).
Brown coal
Total in situ resources (all categories) of brown coal, are estimated to be 488,664 Mt, of which in situ EDR are 81,234 Mt, Subeconomic Demonstrated Resources are 284,921 Mt and Inferred Resources are 122,509 Mt. Total recoverable Identified resources of brown coal are estimated at 436,651 Mt, of which recoverable EDR are 74,039 Mt, Subeconomic Demonstrated Resources are 257,384 Mt and Inferred Resources are 105,228 Mt. Nearly all of Australia’s recoverable brown coal EDR is in Victoria, with more than 90 per cent in the Latrobe Valley.
Table 1. Australia's remaining black coal resources by basin area to year end 2020 (Mt and PJ)
| Province | Black Coal | |||||
|---|---|---|---|---|---|---|
| EDR (Mt) | SDR (Mt) | Inferred (Mt) | EDR (PJ) | SDR (PJ) | Inferred (PJ) | |
| Arckaringa Basin | 623 | 2,538 | 9,777 | 10,591 | 44,692 | 166,203 |
| Ashford Basin | 0 | 8 | 13 | 0 | 246 | 361 |
| Bowen Basin | 26,560 | 128 | 20,297 | 750,537 | 3,476 | 560,438 |
| Boyup Basin | 0 | 0 | 81 | 0 | 0 | 1,596 |
| Callide Basin | 430 | 0 | 70 | 8,007 | 0 | 1,299 |
| Canning Basin | 139 | 0 | 188 | 2,732 | 0 | 3,706 |
| Clarence-Moreton Basin | 1,931 | 15 | 454 | 51,290 | 398 | 12,164 |
| Collie Basin | 295 | 0 | 68 | 5,812 | 0 | 1,347 |
| Eromanga Basin | 594 | 0 | 4,800 | 12,465 | 0 | 100,794 |
| Galilee Basin | 11,392 | 176 | 21,227 | 253,680 | 3,872 | 475,776 |
| Gloucester Basin | 228 | 0 | 111 | 6,101 | 0 | 2,949 |
| Gunnedah Basin | 1,869 | 945 | 863 | 50,466 | 19,287 | 23,305 |
| Ipswich Basin | 0 | 328 | 0 | 0 | 8,531 | 0 |
| Laura Basin | 15 | 0 | 52 | 455 | 0 | 1,571 |
| Leigh Creek | 112 | 131 | 316 | 1,683 | 1,985 | 4,810 |
| Maryborough Basin | 74 | 23 | 198 | 2,141 | 675 | 5,822 |
| Mulgildie Basin | 65 | 0 | 233 | 1,759 | 0 | 6,290 |
| Oaklands Basin | 1,395 | 0 | 603 | 32,085 | 0 | 13,869 |
| Pedirka Basin | 0 | 0 | 0 | 0 | 0 | 0 |
| Perth Basin | 117 | 177 | 991 | 2,313 | 3,214 | 19,073 |
| Polda Basin | 0 | 288 | 0 | 0 | 4,205 | 0 |
| Styx Basin | 31 | 0 | 152 | 880 | 0 | 4,337 |
| Surat Basin | 7,426 | 0 | 11,368 | 185,060 | 0 | 284,334 |
| Sydney Basin | 19,013 | 267 | 11,935 | 508,902 | 6,694 | 312,578 |
| Tarong Basin | 1,437 | 0 | 125 | 28,169 | 0 | 2,459 |
| Tasmania Basin | 401 | 3 | 69 | 9,133 | 63 | 1,573 |
| Wilga Basin | 0 | 0 | 165 | 0 | 0 | 3,251 |
| Total | 74,147 | 5,027 | 84,157 | 1,924,261 | 97,338 | 2,009,903 |
Notes: Additional coal resources are also present outside of these basin areas, which are included in the totals documented in AECR. The data shown have been rounded. EDR = economic demonstrated resources. SDR = sub-economic demonstrated resources. Mt = million tonnes. PJ = petajoules. Source: Geoscience Australia OZMIN database, accessed 11th October 2021.
Table 2. Australia's remaining brown coal resources by basin area to year end 2020 (Mt and PJ)
| Basin | Brown Coal | |||||
|---|---|---|---|---|---|---|
| EDR (Mt) | SDR (Mt) | Inferred (Mt) | EDR (PJ) | SDR (PJ) | Inferred (PJ) | |
| Eucla | 513 | 365 | 1,746 | 10,106 | 7,198 | 34,396 |
| Gippsland | 73,238 | 250,772 | 81,069 | 717,730 | 2,457,566 | 794,474 |
| Kazput* | 0 | 0 | 153 | 0 | 0 | 2,815 |
| Murray | 0 | 3,478 | 15,295 | 0 | 25,335 | 149,887 |
| Otway | 288 | 845 | 6,181 | 2,824 | 8,282 | 46,464 |
| St Vincent | 0 | 1,924 | 784 | 0 | 18,857 | 7,688 |
| Total | 74,039 | 257,384 | 105,228 | 730,660 | 2,517,239 | 1,035,724 |
Notes: Additional coal resources are also present outside of these basin areas, which are included in the totals documented in AECR. The data shown have been rounded. EDR = economic demonstrated resources. SDR = sub-economic demonstrated resources. Mt = million tonnes. PJ = petajoules. *Kazput is a deposit. Source: Geoscience Australia OZMIN database, accessed 11th October 2021.
Production
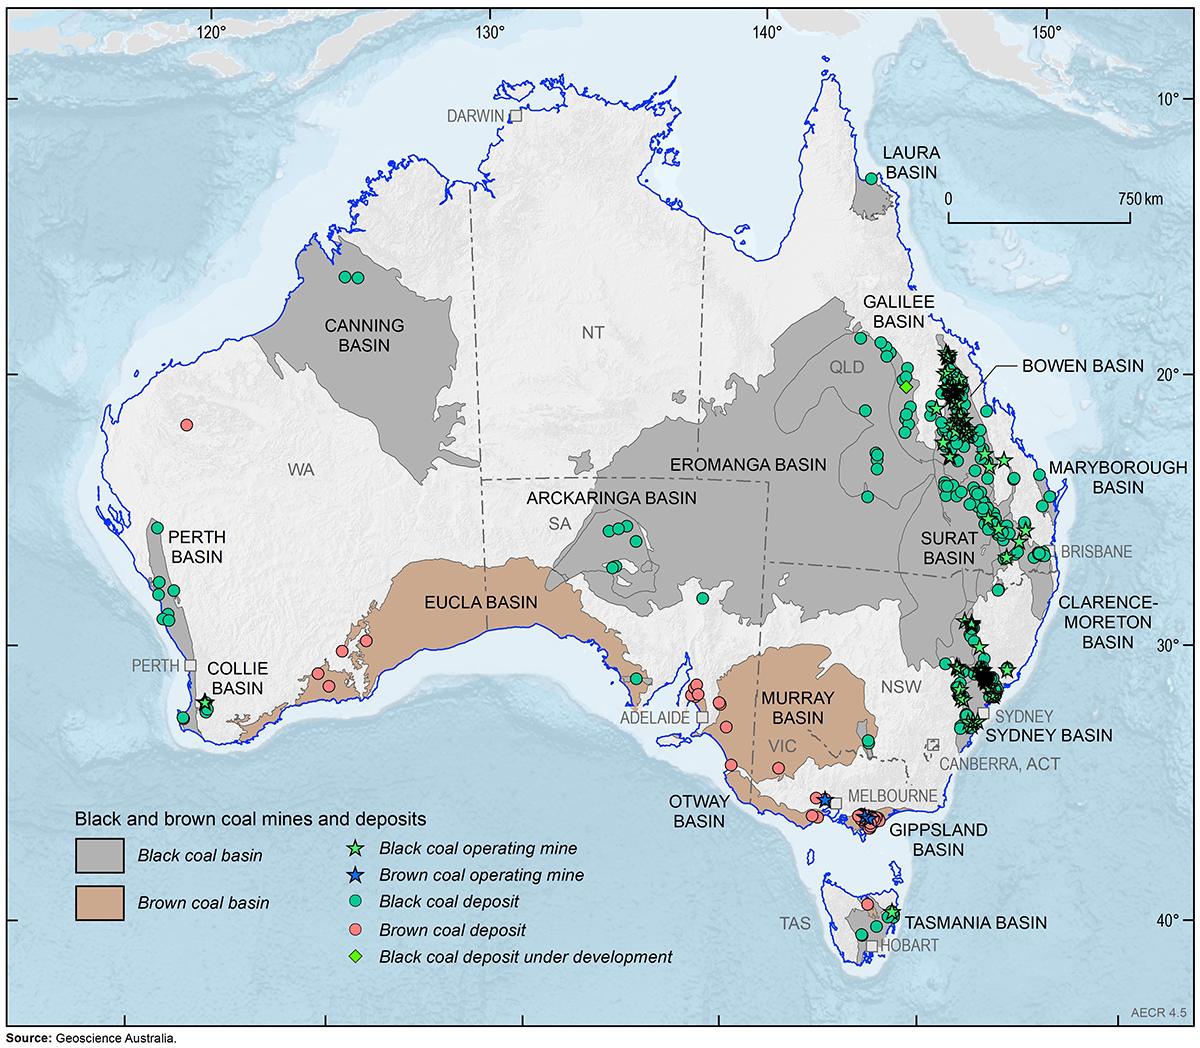
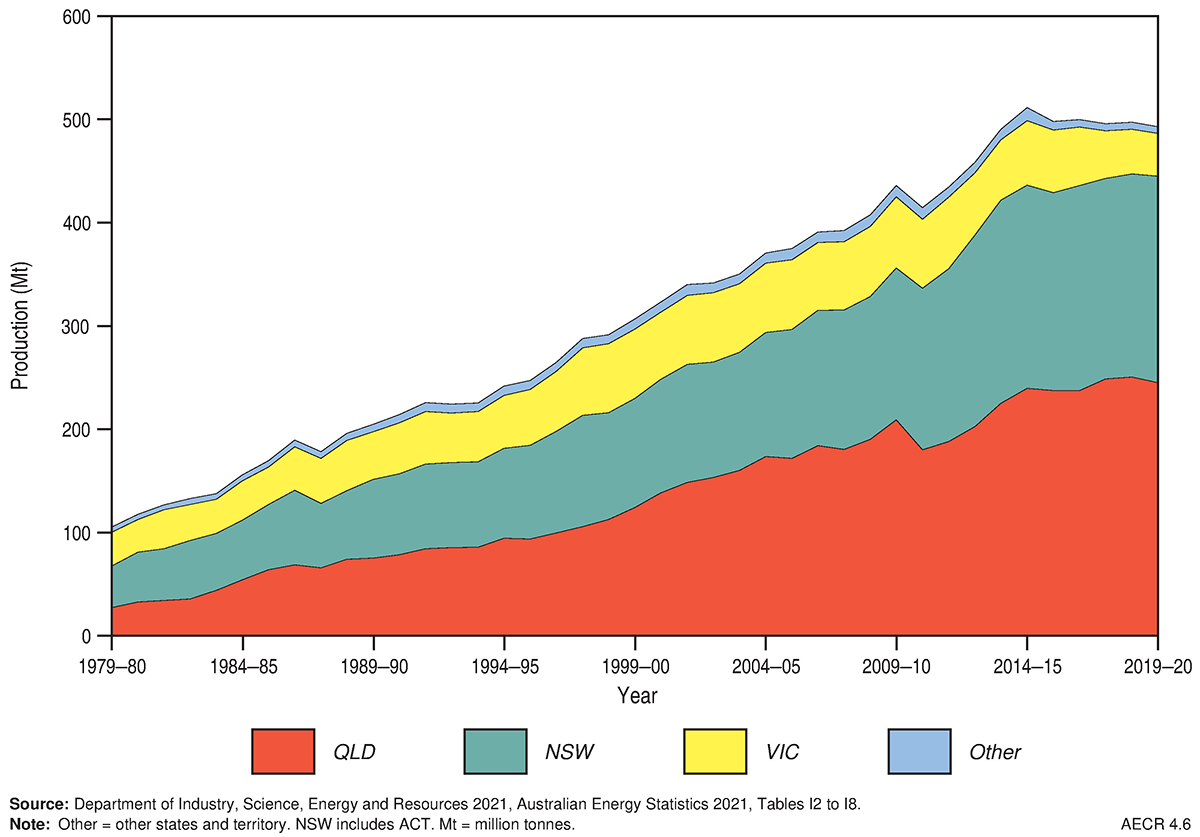
During 2020, Australia had 91 operating black coal mines, 3 operating brown coal mines (Figure 5), and more than 200 known coal deposits. Most of Australia’s black coal mines are in Queensland and New South Wales, which accounted for approximately 50 per cent and 40 per cent, respectively, of Australia’s 2019–20 coal production (Figure 6). Brown coal produced in Victoria, mainly from the Gippsland Basin, contributed 8 per cent of total coal production in 2019–20.
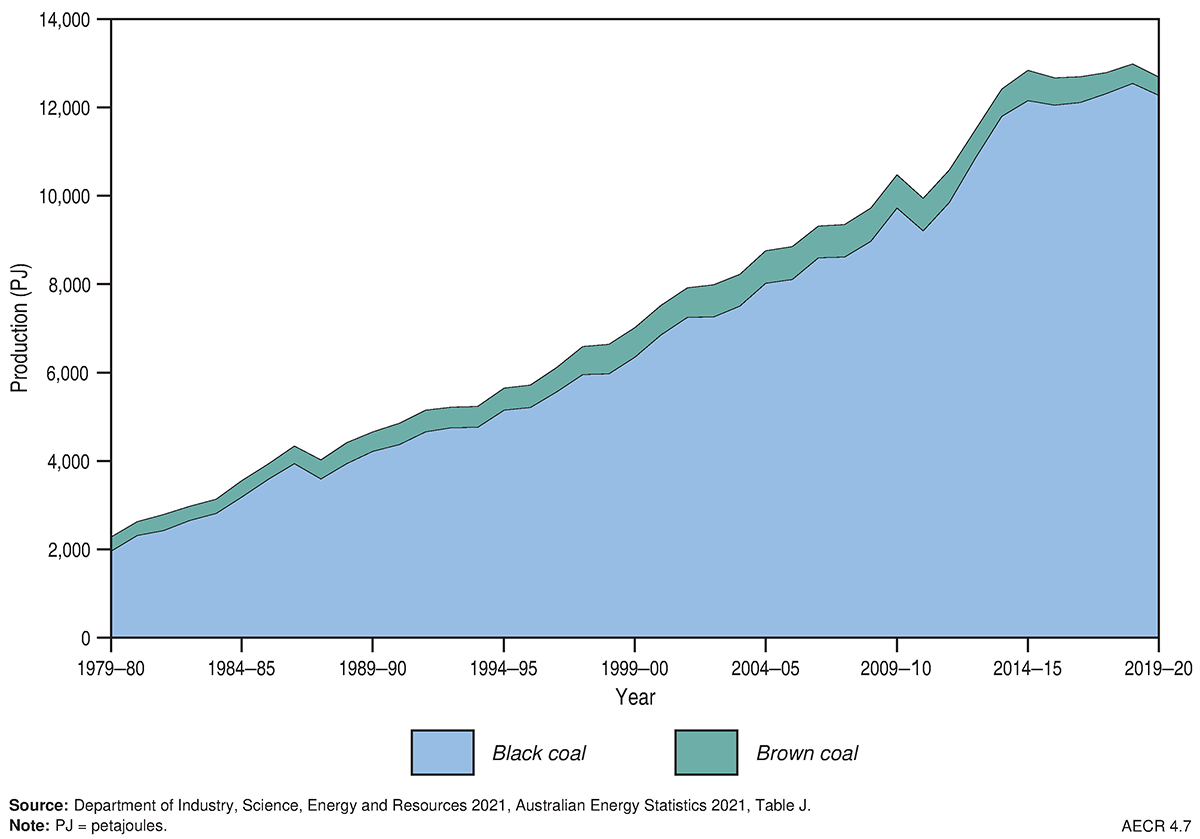
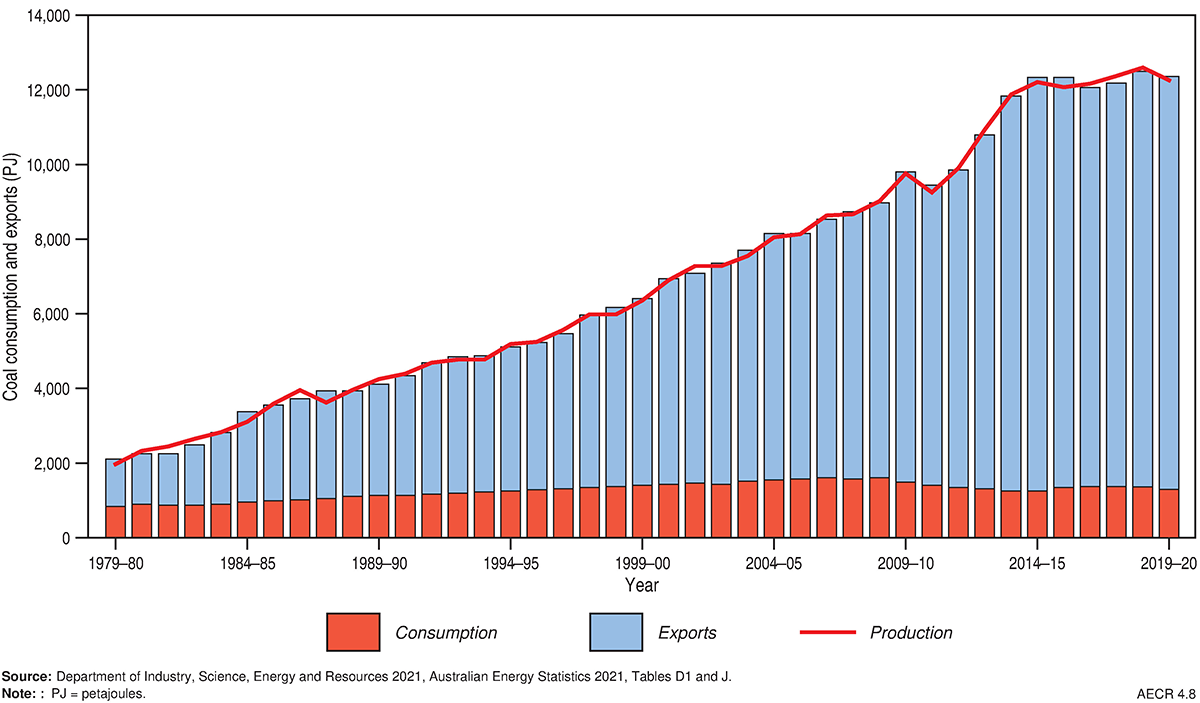
In 2019–20, Australia’s production of saleable black and brown coal was 12,742 PJ, which accounted for 54 per cent of total energy production (including uranium production; Department of Industry, Science, Energy and Resources, 2021a). Over the past decade, coal production has grown by an average annual rate of 2 per cent, moderated by a fall in production in 2010–11 due to flooding in Queensland and again in 2019–20 due to the impact of COVID-19 on global demand (Figure 7). In 2019–20, 90 per cent of Australia’s black coal energy production was exported (Figure 8).
Trade
Australia exports the majority of its coal, capitalising on its abundant coal resources and strong ongoing coal demand from Asia. Australia exported 11,062 PJ of coal and coal products in 2019–20, which was about 56 per cent of Australia’s total energy exports (including uranium exports; Department of Industry, Science, Energy and Resources, 2021a). The total value of coal exports declined by an average growth rate of 1.1 per cent per year from $43.8 billion in 2010–11 to $39.2 billion in 2020–21 (Figure 9).
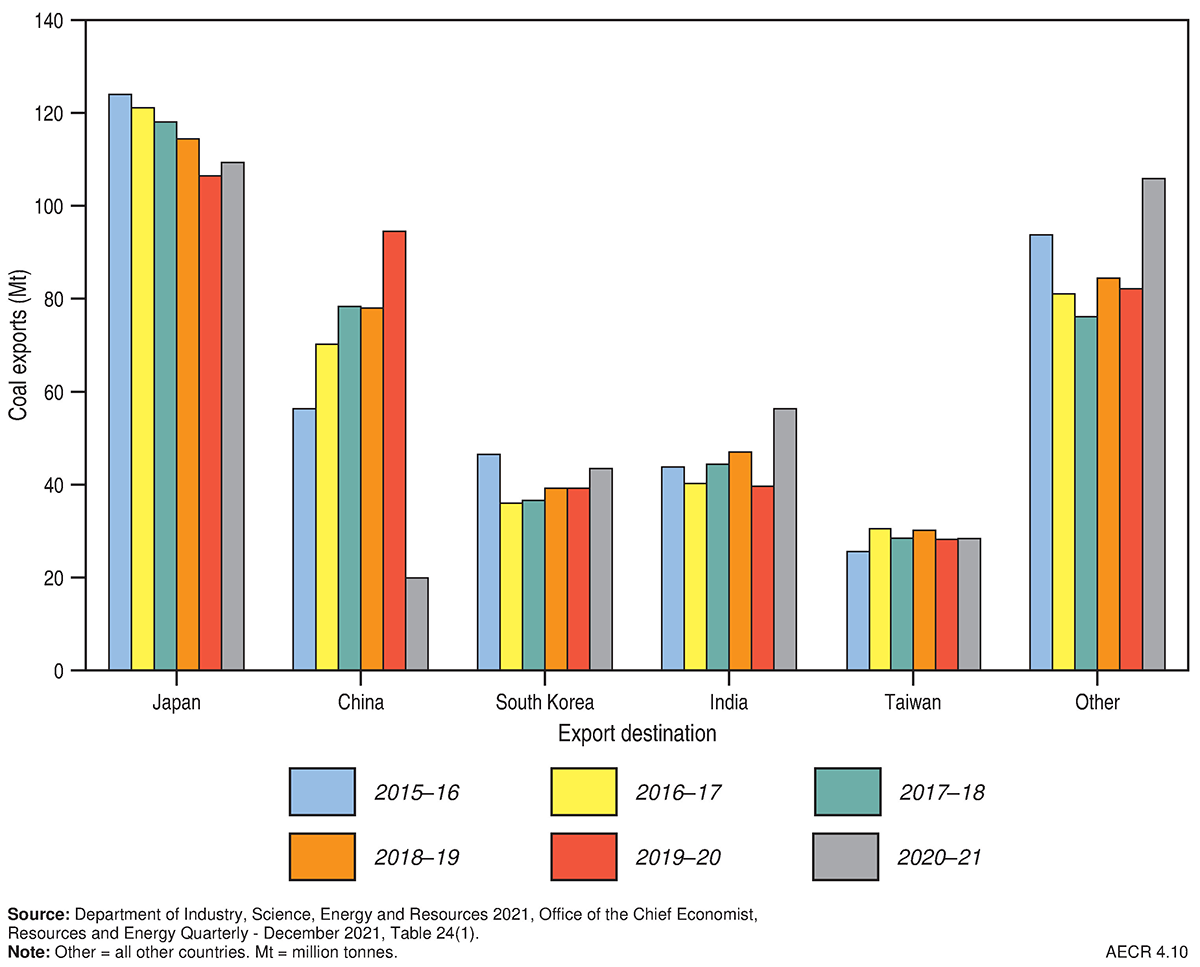
In 2020, the Newcastle thermal coal spot price averaged US$58/t, compared to US$74/t in 2019, and the Australian east coast premium hard coking coal spot price averaged US$125/t, compared to US$179/t in 2019 (Department of Industry, Science, Energy and Resources, 2020 and 2021b). Whilst export volumes to China have declined, exports to Japan remained high and volumes to India, South Korea and other destinations have continued to increase (Figure 10). Coal export volumes have grown at an average annual rate of 2.5 per cent from 285 Mt in 2010–11 to 363 Mt in 2020–21. However, Australia’s total coal exports decreased by about 4.3 per cent in 2020 (bp, 2021) in response to a global decline in steel production due to COVID-19 restrictions. Some of this loss has been offset by increasing exports to India, Bangladesh, Pakistan and the Middle East. Coal exports are projected to rise as global supply chains adjust and energy markets prioritise access to high-quality coal (Department of Industry, Science, Energy and Resources, 2021b).
World rankings
Reserves
In 2020, Australia held 14 per cent of the world’s coal reserves (black and brown), ranking third behind the United States (23 per cent) and Russia (15 per cent) (bp 2021; Figure 11; Table 3 and Table 4).
Regarding black coal, Australia is thought to hold about 10 per cent of world economic resources and ranks fourth behind the United States (29 per cent), China (18 per cent) and India (14 per cent), while for brown coal our share of the world’s economic resources is 23 per cent, ranking Australia second in the world behind Russia (28 per cent) (Senior et al., 2022).
Production
In 2020, Australia accounted for:
- 7 per cent of global black coal production and was the world’s fifth largest producer of black coal after China, India, the United States and Indonesia; and
- 7 per cent of the world's brown coal production and was the sixth largest producer after Germany, Russia, Turkey, Poland, and the United States (International Energy Agency, 2021).
Export
In 2019–20 Australia was the world’s largest exporter of metallurgical coal and the second largest exporter of thermal coal (Table 4; Department of Industry, Science, Energy and Resources, 2022).
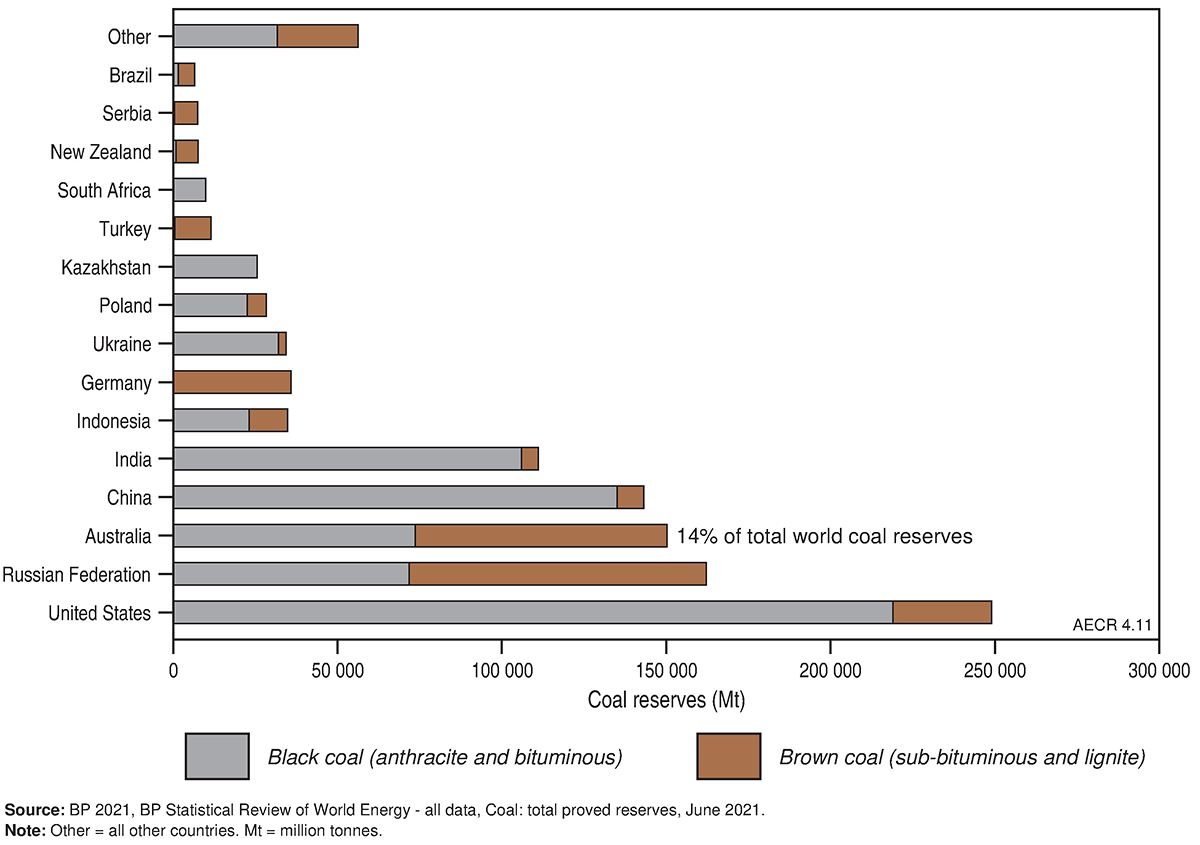
Table 3. Key coal statistics (physical units)
| Australia 2020 | OECD 2020 | World 2020 | ||
|---|---|---|---|---|
| Resources | ||||
| Proved reserves (at end of year) | Mt | 148,186a | 508,433b | 1,074,108b |
| of which: Black coal (anthracite and bituminous) | Mt | 74,147b | 331,303b | 753,639b |
| of which: Brown coal (sub-bituminous1 and lignite) | Mt | 74,039a | 177,130b | 320,469b |
| Share of world coal reserves | % | 14.0b | 47.3b | 100b |
| World ranking | no. | 3b | na | na |
| Production | ||||
| Annual production | Mt | 477b | 1,422b | 7,742b |
| Share of world annual coal production | % | 6.2b | 18.4b | 100b |
| CAGR from 2010 | % | 1.5b | -4.1b | 0.4b |
| World ranking | no. | 5b | na | na |
Notes: 1Sub-bituminous coal has properties that range from those of brown coal to those of black coal—there is therefore some variation in this terminology across countries. aRecoverable economic demonstrated resource (EDR). bproved reserves of coal as defined by BP. OECD = Organisation for Economic Co-operation and Development countries. CAGR = compound annual growth rate. Mt = million tonnes. na = not available. Source: aGeoscience Australia; bBP (2021) BP Statistical Review of World Energy.
Table 4. Key coal statistics (energy units)
| Australia 2019-20 | OECD 2020 | World 2020 | ||
|---|---|---|---|---|
| Production | PJ | 12,742 | 29,934 | 159,607 |
| Share of world coal production | % | 7.8 | 18.8 | 100 |
| CAGR from 2010 | % | 1.7 | -3.8 | 0.6 |
| Coal exports | PJ | 11,062 | na | 31,784 |
| CAGR from 2010 | % | 2.2 | na | 2.3 |
| Coal export value | A$b | 39.17 | na | na |
| of which: Metallurgical coal and coke | A$b | 23.17 | na | na |
| of which: Thermal coal | A$b | 16.00 | na | na |
| World ranking | no. | 1a | na | na |
Notes: aAustralia is ranked as the world’s largest exporter of metallurgical coal and second largest exporter of thermal coal. Definitions vary between data sourced from the International Energy Agency (IEA) and the Australian Energy Statistics (AES). For example, the IEA data are reported as net energy content, whereas AES data are reported as gross energy content. OECD = Organisation for Economic Co-operation and Development countries. CAGR = compound annual growth rate. na = not available. PJ = petajoules. A$b = billion Australian dollars. Source: Australian Energy Statistics 2021, Tables A2, J, N published by Industry, Science, Energy and Resources (2021a); Resources and Energy Quarterly - June 2020, Tables 24(1) and 24(2), published by Department of Industry, Science, Energy and Resources (2021b); BP (2021) BP Statistical Review of World Energy.
References
Australian Bureau of Statistics 2022. 8412.0 Mineral and Petroleum Exploration, Australia, Table 5. Released 28 February 2022 (last accessed 29 April 2022).
bp 2021. Statistical Review of World Energy (last accessed 30 June 2022).
Coalfield Geology Council of New South Wales 2011. Coal quality assessment for geology and mining, short course notes, Coalfield Geology Council of New South Wales, Hunter Region, NSW.
Department of Industry, Science, Energy and Resources 2021a. Australian Energy Statistics, Table J (last accessed 26 May 2022).
Department of Industry, Science, Energy and Resources 2020. Resources and Energy Quarterly: March 2020 (last accessed 26 May 2022).
Department of Industry, Science, Energy and Resources 2021b. Resources and Energy Quarterly: March 2021 (last accessed 26 May 2022).
Department of Industry, Science, Energy and Resources 2022. Resources and Energy Quarterly: March 2022 (last accessed 26 May 2022).
International Energy Agency 2020. Statistics Report, Coal Information Overview (last accessed 13 December 2021).
Joint Ore Reserves Committee 2012. Australasian Code for Reporting of Exploration Results, Mineral Resources and Ore Reserves. The JORC Code (last accessed 25 May 2022).
Senior, A, Britt, A., Pheeney, J., Summerfield, D., Hughes, A., Hitchman, A., Cross, A., Sexton, M. and Teh, M. 2022. Australia's Identified Mineral Resources. Geoscience Australia, Canberra (last accessed 25 May 2022).
Upcoming data releases
- This preliminary release of AECR 2022 includes coal commodity resource maps and a download of data tables for the 2020 reporting period.
- A final report documenting Australia’s identified coal resources, production, trade and world ranking will be available in late June 2022.
- Contact the Energy Resources Advice and Promotion team for more information.
Data download
Australia’s Energy Commodity Resources Data Tables – 2020 Reporting Period