

Introduction
This is the second edition of Geoscience Australia’s assessment of Australia’s Energy Commodity Resources (AECR 2022). AECR 2022 provides estimates of the nation’s energy commodity resources as at the end of 2020. Resource estimates are grouped according to commodity type, reserves and annual production.
The COVID-19 pandemic had a dramatic impact on global energy markets during 2020, with major declines in demand for oil, natural gas, coal and uranium as COVID-19 related lockdowns changed the levels of energy consumption. Production of Australia’s energy commodities in 2020 reflects these global declines in energy demand, with a 2.4 per cent (563 petajoules [PJ]) fall in total annual production from 23,739 PJ in 2019 to 23,176 PJ in 2020 (Table 1). There were also significant falls in annual production in most energy commodities, with the exception of crude oil which showed an increase of 15.1 per cent (39 PJ). This increase in Australia’s crude oil production, while in contrast with the record 9.3 per cent fall in world oil consumption documented by BP (2021a), needs to be taken in the context of Australia’s small contribution (0.5 per cent) to global oil supply. The 4.4 per cent fall in Australia’s brown coal production during this period is also consistent with the pre-COVID-19 trend of decreasing domestic demand for brown coal-fired electricity generation and is not related to global energy demand. However, even though it is a reflection of the reduced domestic and global energy demand during the COVID-19 pandemic, the declines in the annual production of natural gas, black coal, and uranium resources during 2020 are a reversal to the positive average annual growth these energy commodity resources have shown over the past decade (Department of Industry, Science, Energy and Resources, 2021a).
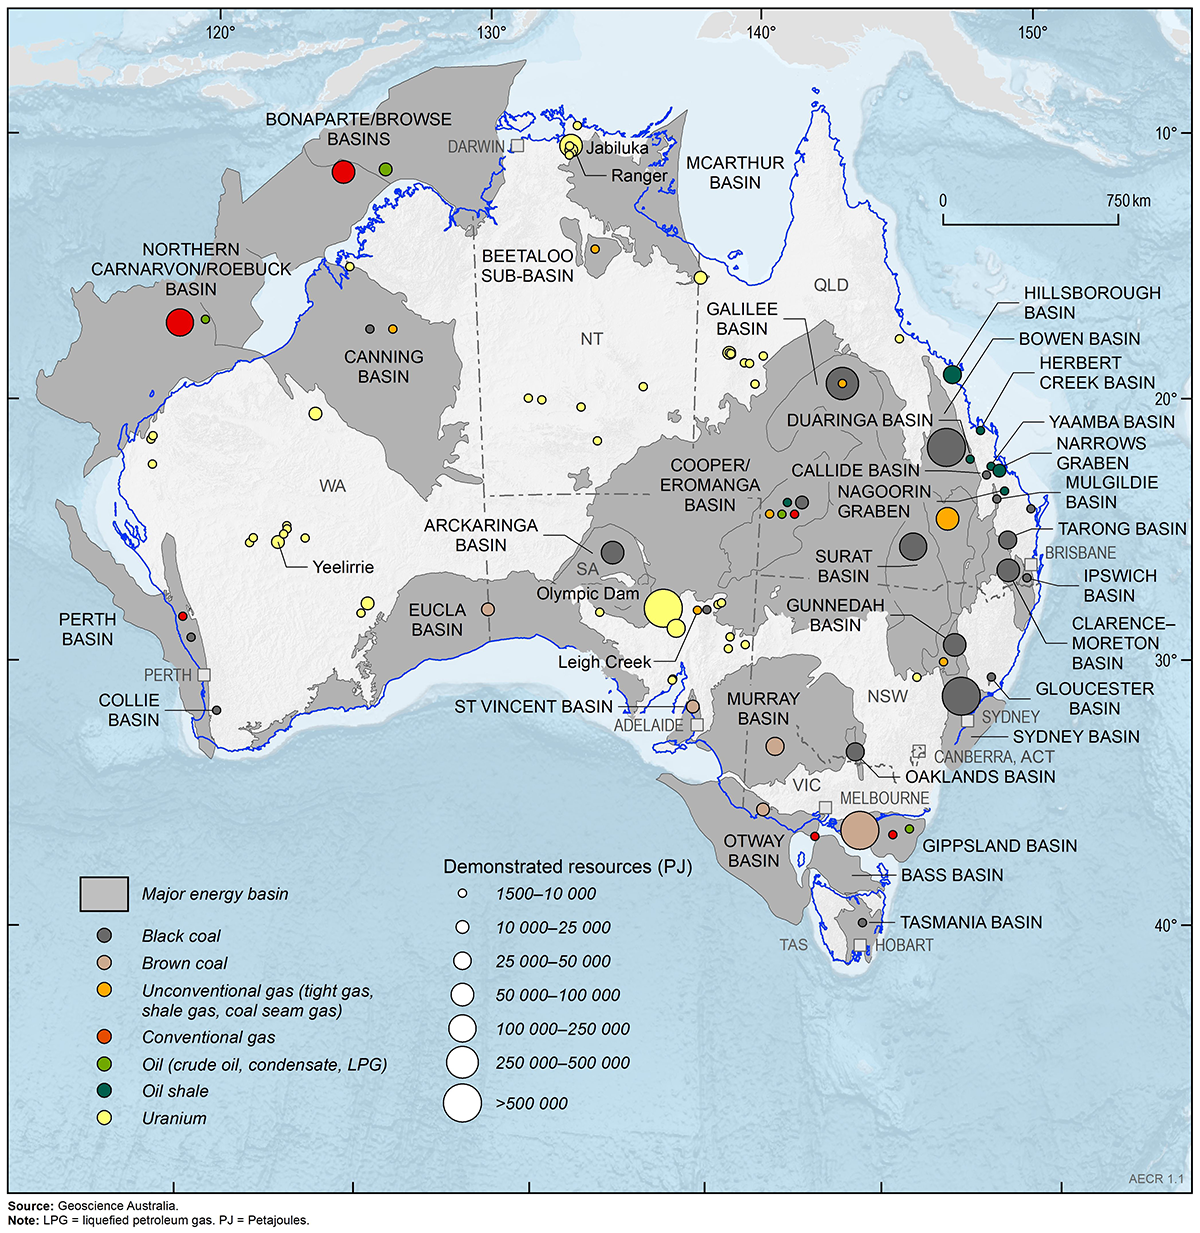
Australia’s total demonstrated energy commodity resources showed no significant change from 2019 (6,376,270 PJ) to 2020 (6,376,378 PJ; Table 1) and with vast, widely distributed energy resources across the country (Figure 1), Australia remains well placed to continue its role as a leading supplier of black coal, natural gas and uranium resources as world energy markets recover from the COVID-19 pandemic. However, Australia’s total demonstrated resources for oil, gas and black coal energy commodities all declined during 2020, despite falls in annual production. The decline in conventional natural gas and coal seam gas resources is particularly notable given the importance of these energy commodity resources for both domestic and global energy security, and reflects diminishing exploration investment for new gas resources in recent years. Only 38 per cent of conventional gas resources and 52 per cent of coal seam gas resources are classified as proven and possible reserves, the remainder representing contingent resources with economic or technical barriers to their development. Contingent gas resources are not being converted to reserves at the same rate that our gas reserves are being produced. Unlocking these contingent gas resources is important to ensuring Australia’s future energy security.
Australia’s future energy production will increasingly be focussed on developing clean energy technologies to meet the net zero greenhouse gas emissions target by 2050. Australia’s first shipment of blue hydrogen to Japan in January 2022 was an important first step in developing our clean energy future. AECR 2022 also includes a summary of the current status of Australia’s potential and planned hydrogen production projects, together with the current status of carbon capture and storage projects.
Table 1. Australia's total demonstrated non-renewable energy resources (2014/16, 2018, 2019, 2020) and estimated resources life in 2020
| Resource | Unit | Note | TDR 2014/2016 | TDR 2018 | TDR 2019 | TDR 2020 | %Change 2019–20 | Production 2020 | % production growth 2019–20 | Resource Life 2020 |
|---|---|---|---|---|---|---|---|---|---|---|
| Crude oil | PJ | 1, 2 | 7,066 | 6,474 | 5,661 | 5,205 | -8.1 | 300 | 15.1 | 17 |
| Condensate | PJ | 1, 2 | 16,463 | 16,213 | 15,951 | 15,448 | -3.2 | 439 | -2.4 | 35 |
| LPG | PJ | 1, 2 | 5,957 | 1,483 | 1,421 | 1,207 | -15.1 | 47 | 5.8 | 26 |
| Oil shale | PJ | 1, 2 | 0 | 84,436 | 84,436 | 84,436 | 0 | 0 | 0.0 | na |
| Unconventional oil (undifferentiated) | PJ | 1, 2 | 0 | 335 | 335 | 404 | 20.6 | 0 | 0.0 | na |
| Conventional gas | PJ | 1, 2 | 186,235 | 194,239 | 196,133 | 192,252 | -2.0 | 4,594 | -1.0 | 42 |
| Coal seam gas | PJ | 1, 2 | 79,450 | 63,732 | 58,248 | 55,131 | -5.4 | 1,585 | -1.2 | 35 |
| Coal seam gasification | PJ | 1 | na | 1,469 | 2,622 | 2,622 | 0.0 | 0 | 0.0 | na |
| Unconventional gas (undifferentiated) | PJ | 1, 2 | 14,000 | 13,426 | 12,203 | 12,252 | 0.4 | 0 | 0.0 | na |
| Black coal | PJ | 3, 4, 5 | 1,999,669 | 2,066,612 | 2,085,362 | 2,021,599 | -3.1 | 12,317 | -2.2 | 164 |
| Brown coal | PJ | 3, 4, 5 | 3,250,352 | 3,293,660 | 3,240,107 | 3,247,899 | 0.2 | 425 | -4.4 | 7,642 |
| Uranium | PJ | 4, 6 | 718,083 | 801,287 | 673,791 | 737,923 | 9.5 | 3,469 | -6.3 | 213 |
| Thorium | ktd | 4, 7 | 130 | 130 | 560 | 635 | 13.4 | 0 | 0.0 | na |
| Total resources | PJ | 8 | 6,277,275 | 6,543,366 | 6,376,270 | 6,376,378 | 23,176 | -2.4 |
Notes: 1. 2P reserves plus 2C contingent resources from the PRMS classification system. 2. Oil and gas data for the end 2014 are as reported by Geoscience Australia (2018). 3. Demonstrated recoverable coal resources. 4. Coal, uranium and thorium data for the end of 2016 are as reported by Geoscience Australia (2018). 5. Coal production data for 2020 is based on 2019-20 data published in the 2021 Australian Energy Statistics Report. 6. Recoverable resources at kt = thousand tonne; LPG = liquefied petroleum gas; PJ = petajoule; TDR = total demonstrated resources. Source: Geoscience Australia (2018); Australian Energy Statistics 2021, published by the Department of Industry, Science, Energy and Resources (2021a)
Total demonstrated energy resources
Estimating energy resource volumes requires a consistent approach to describing commodity reserves and resources to ensure results are reliable and easily comparable. The resource classification appendix (Appendix 2) outlines the various resource classification systems used in AECR to describe the commerciality of energy resources. These systems use levels of geological knowledge and confidence to distinguish between identified and potential resources.
For the purposes of the AECR publication the following terminologies are used to describe the various energy resource classifications:
Identified resources are those for which measurements have been made to quantify their extent and grade or quality. A measurement may be, for example, a well drilled into an oil reservoir to provide a sample. The process of ‘proving’ that a resource is suitable for development is one of reducing uncertainty through the measurement of the nature of the resource, and its commercial and social viability.
‘Reserves’ and ‘economic demonstrated resources (EDR)’ are terms given to non-renewable energy resources that are known to exist in sufficient quantity and grade confirming their commercial and social viability. ‘Contingent resources’ or ‘sub‑economic resources’ are the terms given to resources that have been confirmed to exist but are not currently viable and/or economic to extract. Total demonstrated resources (TDR) is the sum of these two resource classes.
‘Potential resources’ are identified by indirect evidence with a high degree of uncertainty around their existence and viability. The potential resource base is often described by the terms ‘prospective’, ‘undiscovered’ or ‘inferred’. These potential resources require further exploration programs to demonstrate if a resource is actually present, followed by appraisal programs to determine the economic and technical viability of extracting any identified resources.
Furthermore, the resource base cannot be considered in isolation from energy conversion technologies. For example, energy security increased globally when the advancement of hydraulic fracturing technologies enabled once non‑viable shale oil and shale gas resources in the US to be commercially exploited.
Estimating the resource base requires setting a cut-off grade—for example, a minimum estimated ultimate recovery of gas in a reservoir for conventional hydrocarbons or well drainage area for unconventional hydrocarbons. An energy conversion technology is implicit in this—hence, the minimum viable resource is determined not only by the inherent nature of the resource, but also by the technology available to produce it.
Mineral and petroleum energy resource estimates are often documented as industry standard measurements of volume or mass. Coal and uranium are generally measured by weight (tonnes), while oil and gas are generally measured by volume (barrels/cubic feet). However, the energy content of different energy commodities varies significantly. In this assessment, energy resource estimates have been converted to a common energy unit—petajoules (PJ)—to allow direct comparisons of different energy commodities. The Measurement and Conversion appendix (Appendix 3) provides average energy contents and conversion factors for the various energy commodities.
Estimating energy resource life
Australia has high quality energy resources that are widely distributed across the country. These resources are expected to last for many more decades, even as production increases.
The potential life of Australia’s non-renewable energy resources is derived through dividing the estimated total remaining identified resources by 2020 annual production rates (Table 1). Such estimates provide a snapshot in time that can only be used for general impressions as they are averages based on the assumption that:
- future production rates remain the same as the 2020 production rates used in the calculation;
- accumulations and deposits deemed in 2020 as identified resources will remain so in the future; and
- depleted resources are not replaced by new discoveries.
Gas resources
Australia has substantial conventional gas resources that are located mostly off the north‑west coast of Western Australia, and significant onshore unconventional (coal seam gas, shale gas, and tight gas) resources. Australia’s total demonstrated resources for all conventional and unconventional gas in 2020 are estimated at 262,258 PJ (234 Tcf trillion cubic feet [Tcf]). As such, based on 2020 rates of production and assuming all uncertainties associated with the development of the resources are addressed, this is sufficient to supply the demand for gas, domestic and overseas, for over 40 years.
As of December 2020, the TDR for conventional gas are estimated to be 192,252 PJ (172 Tcf). Between 2019 and 2020, Australia’s total demonstrated conventional gas resources decreased by 2.0 per cent. This decrease is attributed to natural field decline as conventional gas production exceeded the discovery rate for new resources.
- Based on 2020 production rates, the estimated life for Australia’s conventional gas resources is 42 years.
Coal seam gas (CSG) resources are located primarily in east coast basins (Bowen, Surat, Galilee, Gunnedah, Sydney and Clarence-Moreton basins). As of December 2020, TDR for Australia’s CSG are estimated at 55,131 PJ (49 Tcf). Between 2019 and 2020, total identified CSG resources declined by 5.4 per cent, with gas production supplying LNG exports from Gladstone exceeding the discovery of new resources.
- Despite the trend of declining CSG resources, based on 2020 production rates, Australia still has sufficient identified resources to last 35 years.
Australia’s gas resource base includes one in-situ coal seam gasification project, the Leigh Creek Energy Project. In-situ coal gasification refers to gas being extracted from coal seams by underground heating to produce synthesis gas (‘syngas’). The Leigh Creek Energy Project has an estimated TDR of 2,622 PJ (2 Tcf). There has been no change to this resource estimate from the 2019 version in AECR 2021.
Prospective shale gas, tight gas and basin centred gas resources are held in low permeability reservoirs across Australia. In 2020, TDR for unconventional gas (excluding CSG and in-situ coal seam gasification) totalled 12,252 PJ (11 Tcf). There were no identified unconventional gas reserves in 2020. Most of these unconventional gas resources are located in the Cooper Basin, Canning Basin and Beetaloo Sub-basin. Between 2019 and 2020 Australia’s TDR for unconventional gas increased slightly by 0.4 per cent due to small upgrades to contingent resource estimates in the Beetaloo Sub-basin and Cooper Basin. There is no resource life estimate for these unconventional gas resources due to the lack of production and a limited understanding of reserves.
Oil resources
Australia’s conventional liquid hydrocarbon resources include crude oil, and the condensate and liquefied petroleum gas (LPG) resources associated with gas accumulations (as phases of natural gas liquids).
As at December 2020, TDR for Australia’s crude oil is estimated to be 5,205 petajoules (PJ) or 878 million barrels (MMbbl). Australia’s crude oil resources are small by world standards and are being depleted at a faster rate than they are being replenished by new discoveries. Total identified crude oil resources decreased by 8.1 per cent from 2019 to 2020.
- Based on 2020 production rates, the estimated life for Australia’s crude oil resources is 17 years.
Australia is increasingly reliant on crude oil and refined petroleum imports to meet its energy requirements, importing over 90 per cent of our crude oil and refined oil products. However, the crude oil potential of Australia’s frontier basins is yet to be adequately assessed, and further exploration may identify additional resources.
Australia’s liquefied petroleum gas (LPG) resources are also relatively small. In 2020, Australia had an estimated TDR of 1,207 PJ (287 MMbbl). LPG resources showed a decrease of about 15.1 per cent between 2019 and 2020.
- Based on 2020 production rates, the remaining life for Australia’s LPG resources is about 26 years.
Australia has significantly more condensate than crude oil and LPG resources, with an estimated TDR of 15,448 PJ (2,627 MMbbl) in 2020. Most condensate resources are associated with LNG projects in the Northern Carnarvon and Browse basins on the North West Shelf. TDR for Australia’s condensate showed only a small decline of 3.2 per cent between 2019 and 2020.
- Based on 2020 production rates, condensate resources have an estimated life of about 35 years.
Unconventional oil resources are currently undeveloped but include significant oil shale occurrences (TDR of 84,436 PJ; 14,360 MMbbl) and minor condensate and LPG associated with unconventional gas resources (TDR of 404 PJ; 71 MMbbl). Oil shale resources are exclusively located in Queensland, and require mining and industrial processing to extract oil. Although minor amounts of oil shale resources were produced in the past, there are currently no identified reserves or operating projects.
Coal resources
Australia’s coal resources are world class in volume and quality. In December 2020, TDR for Australia’s recoverable black and brown coal are estimated to be 5,269,498 PJ (410,597 million tonnes [Mt]). In addition to these large TDR of coal, Australia also has significant inferred coal resources.
TDR for black coal are estimated to be 2,021,599 PJ (79,174 Mt). Black coal resources are found in most states, with the largest TDR in the Bowen–Surat Basin in Queensland and the Sydney Basin in New South Wales. In 2020, Australia’s black coal TDR decreased by 3.1 per cent. This is consistent with the 2 per cent fall seen in the economic demonstrated resources for black coal (Senior et al., 2021).
- Based on 2020 production rates, the estimated resource life for black coal is 164 years.
Australia has vast brown coal resources, although these have a much lower energy content than black coal. Brown coal TDR are estimated to be 3,247,899 PJ (331,423 Mt) and are located mainly in Victoria’s Gippsland Basin. Australia’s brown coal TDR showed a modest increase of less than 1 per cent between 2019 and 2020, and will support over 7,000 years of production based on the very low rates that are currently extracted.
Uranium and thorium resources
More than one-third of the world’s known uranium resources are located in Australia. In December 2020, TDR for Australia’s uranium are estimated to be 737,923 PJ (1,318 thousand tonnes [kt]). Although most Australian states have uranium deposits, EDR are concentrated in South Australia, the Northern Territory and Western Australia. Australia’s TDR for uranium resources showed an increase of 9.5 per cent in 2020.
- Based on 2020 production rates, uranium resources have an estimated life of 213 years.
Australia also has a major share of the world’s thorium resources. Although not currently in use as an energy resource, thorium could play a role as a nuclear energy source in the future.
Australia's energy production and trade
The outlook for Australian energy production from gas, oil, coal and uranium is tied to global trends in demand, supply and pricing. This section provides an overview of Australia’s energy production and trade during the 2019–20 financial year as published in the Australian Energy Update (Department of Industry, Science, Energy and Resources, 2021a), together with Resources and Energy Quarterly data published by the Office of the Chief Economist. Statistics from the Australian Energy Update 2021 reflect the status of Australia’s energy supply and trade both immediately before COVID-19 and during the early impacts of the pandemic.
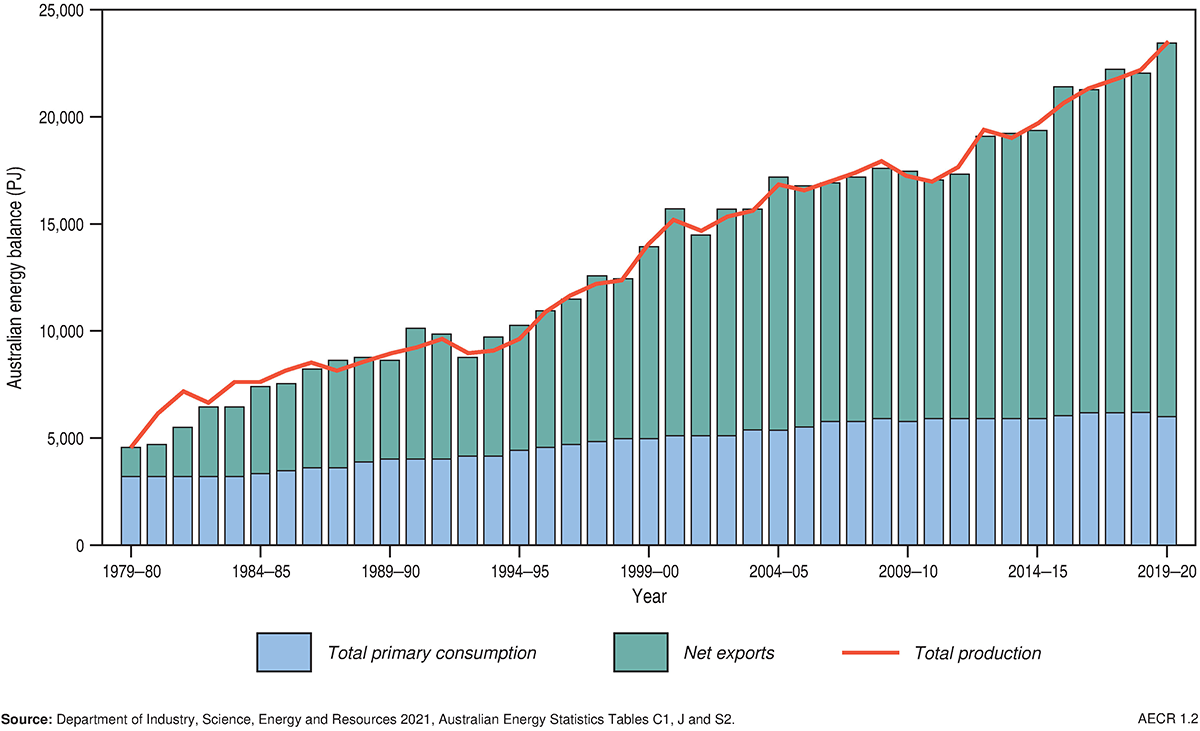
Australia’s energy resources contribute substantially to the nation’s gross domestic product and export earnings. Energy productivity (gross domestic product ‘GDP’ divided by energy consumption) improved by 2.7 per cent in 2019–20, and by 21 per cent over the past ten years (Department of Industry, Science, Energy and Resources, 2021a). Australia now creates $324 million in GDP for every petajoule of energy consumed, almost $56 million more than a decade ago (Department of Industry, Science, Energy and Resources, 2021a). Approximately 85 per cent of Australian produced energy (including uranium) was exported in 2019–20. Exports of LNG have been one of the main contributors to recent growth in our energy exports. Australia is a net exporter of energy commodities but, notwithstanding this, it remains a net importer of oil products.
Primary energy production in Australia
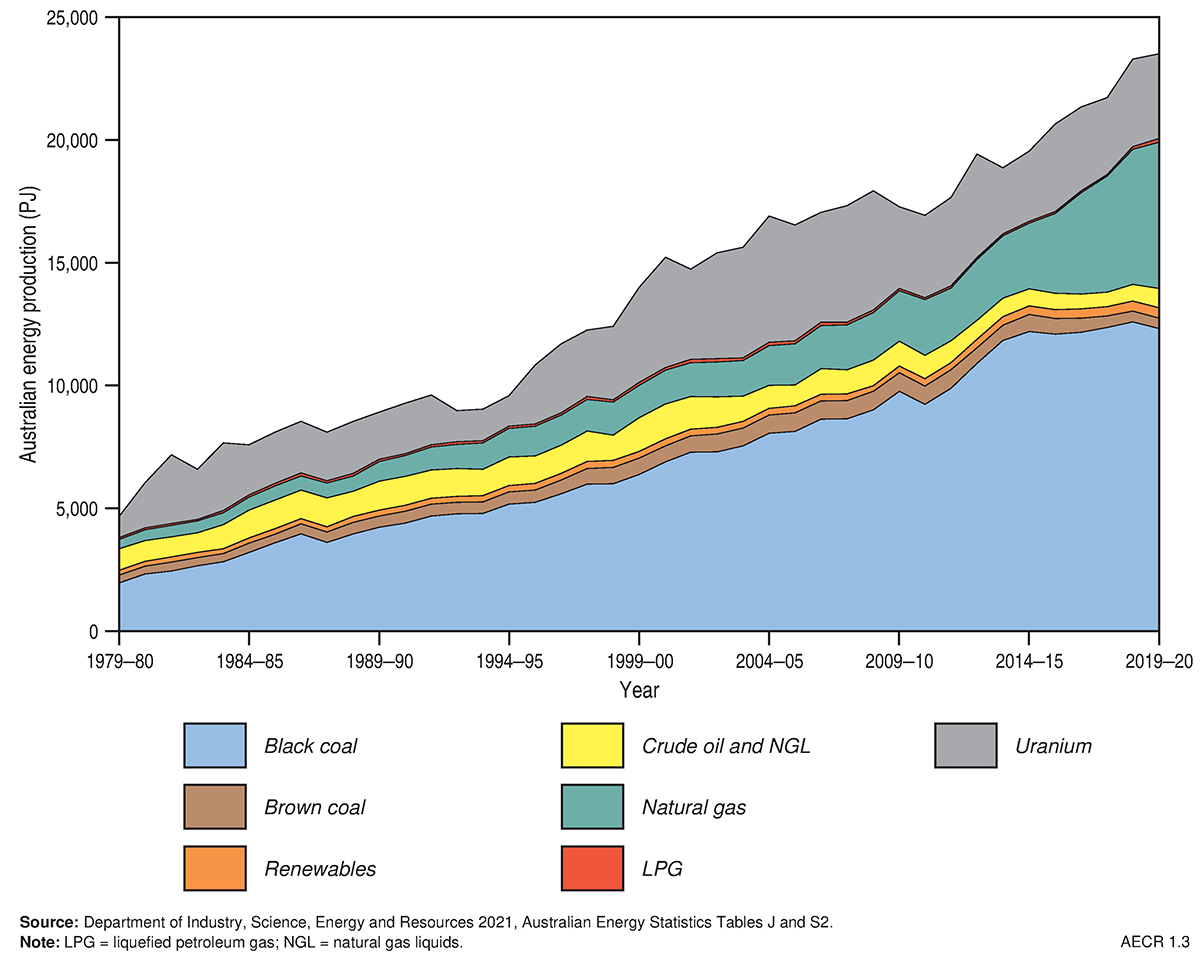
Australia’s total energy production increased by 0.9 per cent in 2019–20 to a historical high of 23,509 PJ (Figure 2; Table 2). Energy commodity resources showed only minor growth in total production, increasing by 0.8 per cent to 23,090 PJ. Increases in production of natural gas and oil were offset by reductions in production of black coal, brown coal and uranium. Renewable energy production continued to show steady growth increasing by 4.6 per cent to 419 PJ.
Table 2. Australian primary energy production by fuel type (2019–20)
| Energy source | Production (PJ) | Share (%) | Average annual growth 2019–20 (%) | Average annual growth 2009-10 to 2019–20 (%) |
|---|---|---|---|---|
| Energy Commodities | ||||
| Black coal | 12,317 | 52.4 | -2.2 | 2.4 |
| Brown coal | 425 | 1.8 | -4.3 | -5.6 |
| Natural gas | 5,945 | 25.3 | 7.9 | 11.2 |
| Oil, NGL | 798 | 3.4 | 18.0 | -2.2 |
| LPG | 151 | 0.6 | 47.8 | 4.7 |
| Uranium | 3,454 | 14.7 | -3.5 | 0.4 |
| Total Energy Commodities | 23,090 | 98.2 | 0.8 | 3.1 |
| Renewables | 419 | 1.8 | 4.6 | 4.0 |
| Total | 23,509 | 100.0 | 0.9 | 3.1 |
Notes: The share of production by fuel types differs from that published in the Australian Energy Statistics due to inclusion of uranium in this table. Source: Department of Industry, Science, Energy and Resources, 2021, Australian Energy Statistics Tables J, I1 and S2
Black coal production fell by 2.2 per cent in 2019–20 to 12,317 PJ, but still remained the principal source of energy production in Australia (Figure 3). This fall was associated with early reductions in overseas demand, driven by COVID-19 related declines in global power consumption and steel production (Department of Industry, Science, Energy and Resources, 2020a). Brown coal production continued to decline as domestic demand for brown coal-fired power generation diminished, falling by 4.3 per cent to 425 PJ.
Natural gas production increased by 7.9 per cent to 5,945 PJ in 2019–20 as demand grew for additional LNG exports. About 63 per cent of production was from conventional gas resources in Western Australia. Coal seam gas accounted for about 25 per cent of Australia’s annual gas production, which was almost entirely from fields in the Bowen and Surat basins (Queensland).
Crude oil and condensate production grew by 18 per cent in 2019–20 to 798 PJ. This growth continued the trend from 2018–19 as crude oil production rose from Woodside’s Greater Enfield project (Department of Industry, Science, Energy and Resources, 2020a). LPG showed a significant increase in production of 47.8 per cent to 151 PJ associated with ramp-up in production of the Ichthys LNG project.
Australia accounts for 12 per cent of world uranium production. Uranium contributed 14.7 per cent of Australia’s total primary energy production in 2019–20 at 3,454 PJ. Uranium production decreased by 3.5 per cent in 2019–20 in the lead-up to the closure of the Ranger mine in January 2021.
Trade of Australia’s energy resources
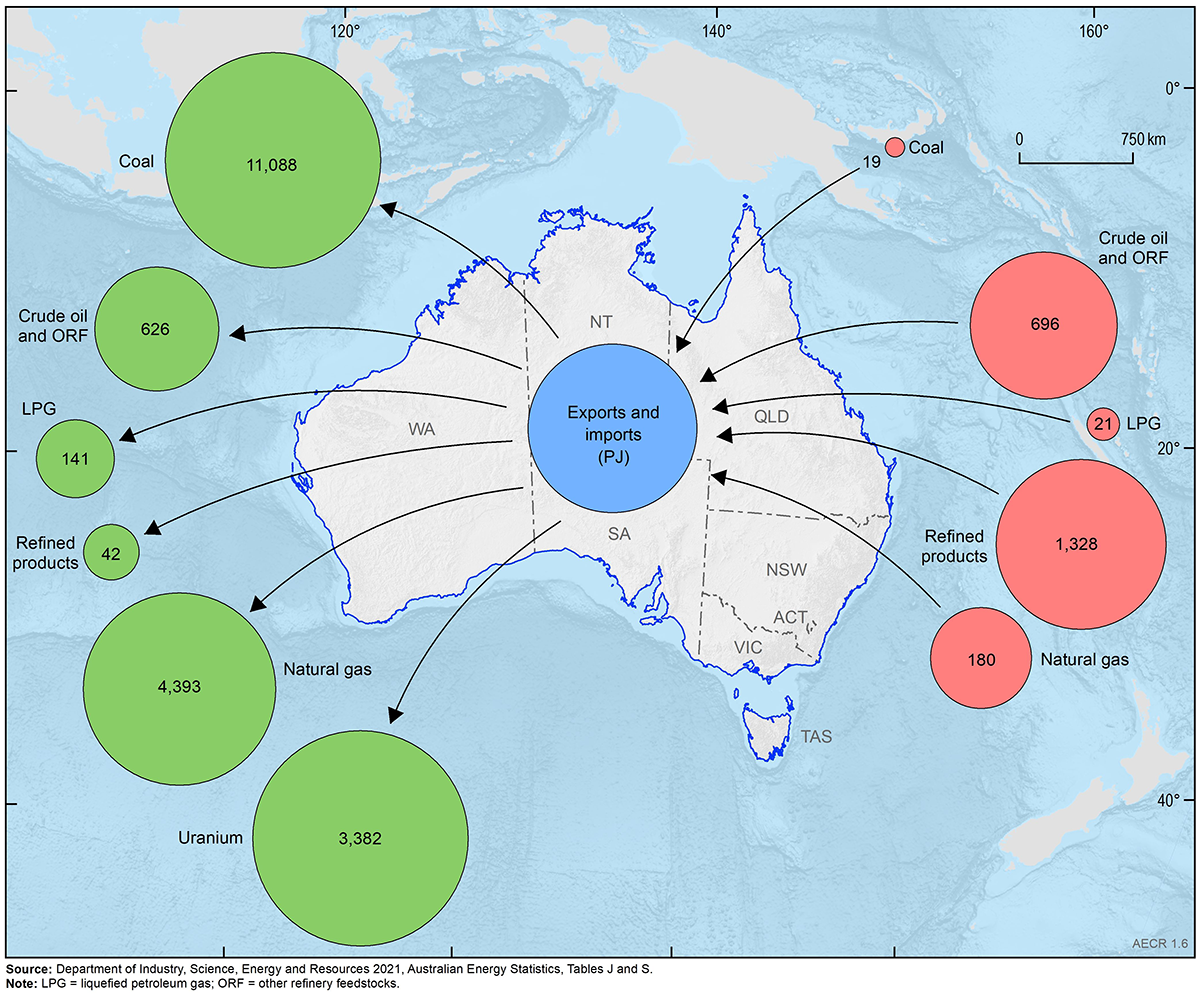
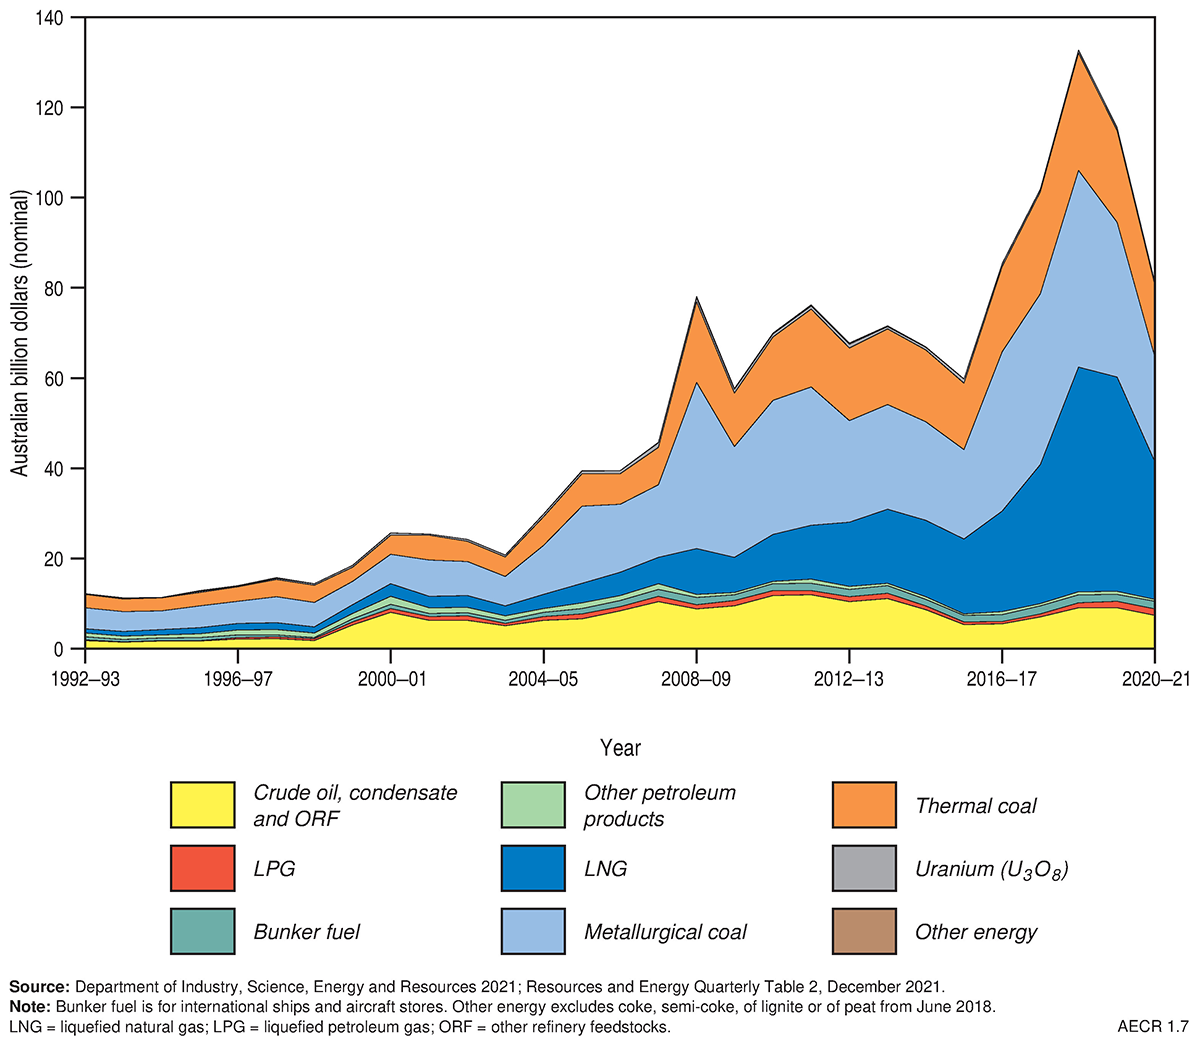
Australia’s trade of energy commodity resources in 2019–20 reflects the early impacts of COVID-19 related declines in global energy demand in 2020. During this period, Australia continued to be a net exporter of energy, with energy commodity exports exceeding imports by almost nine times (Figure 4, Figure 5, Figure 6, Table 3, Table 4). While our energy commodity exports grew in 2019–20 by 0.7 per cent to 19,672 PJ, this growth is significantly lower than the average annual growth rate over the past decade of 3.7 per cent (Figure 4, Figure 6, Table 3). Decreases in exports of black coal, refined petroleum products and uranium were slightly offset by increased demand for LNG exports, crude oil and LPG. During 2019–20, Australia’s energy commodity export earnings dropped by 12.9 per cent, to AUD$115.5 billion, from a historic high of AUD$133 billion in 2018–19 (Figure 7, Table 5 ), and there was also a 6.9 per cent decline in imports of energy commodities to 2,244 PJ.
Black coal remained the dominant energy commodity exported despite a 0.6 per cent decline in volumes from 11,131 PJ in 2018–19 to 11,062 PJ in 2019–20. This reduction related to a global decline in steel production due to COVID-19 restrictions (Department of Industry, Science, Energy and Resources, 2021a). Associated export earnings also dropped from AUD$70 billion in 2018–19 to $AUD55 billion in 2019–20.
- About 90 per cent of black coal produced in Australia was exported in 2019–20.
Table 3. Australian energy exports by fuel type (2019–20)
| Energy source | Exports (PJ) | Share (%) | Average annual growth 2019–20 (%) | Average annual growth 2009–10 to 2019–20 (%) |
|---|---|---|---|---|
| Black coal | 11,062 | 56.2 | -0.6 | 2.9 |
| Coal by-products | 26 | 0.1 | 16.0 | na |
| Natural gas (LNG) | 4,393 | 22.3 | 6.4 | 16.1 |
| Crude Oil and ORF | 626 | 3.2 | 14.7 | -0.7 |
| LPG | 141 | 0.7 | 47.8 | 6.5 |
| Refined Products | 42 | 0.2 | -10.9 | 2.9 |
| Uranium | 3,382 | 17.2 | -5.0 | -0.5 |
| Total | 19,672 | 100.0 | 0.7 | 3.7 |
Notes: The share of production by fuel types differs from that published in the Australian Energy Statistics due to inclusion of uranium in this table; na = not available. Source: Department of Industry, Science, Energy and Resources, 2021, Australian Energy Statistics Tables J, I1 and S2
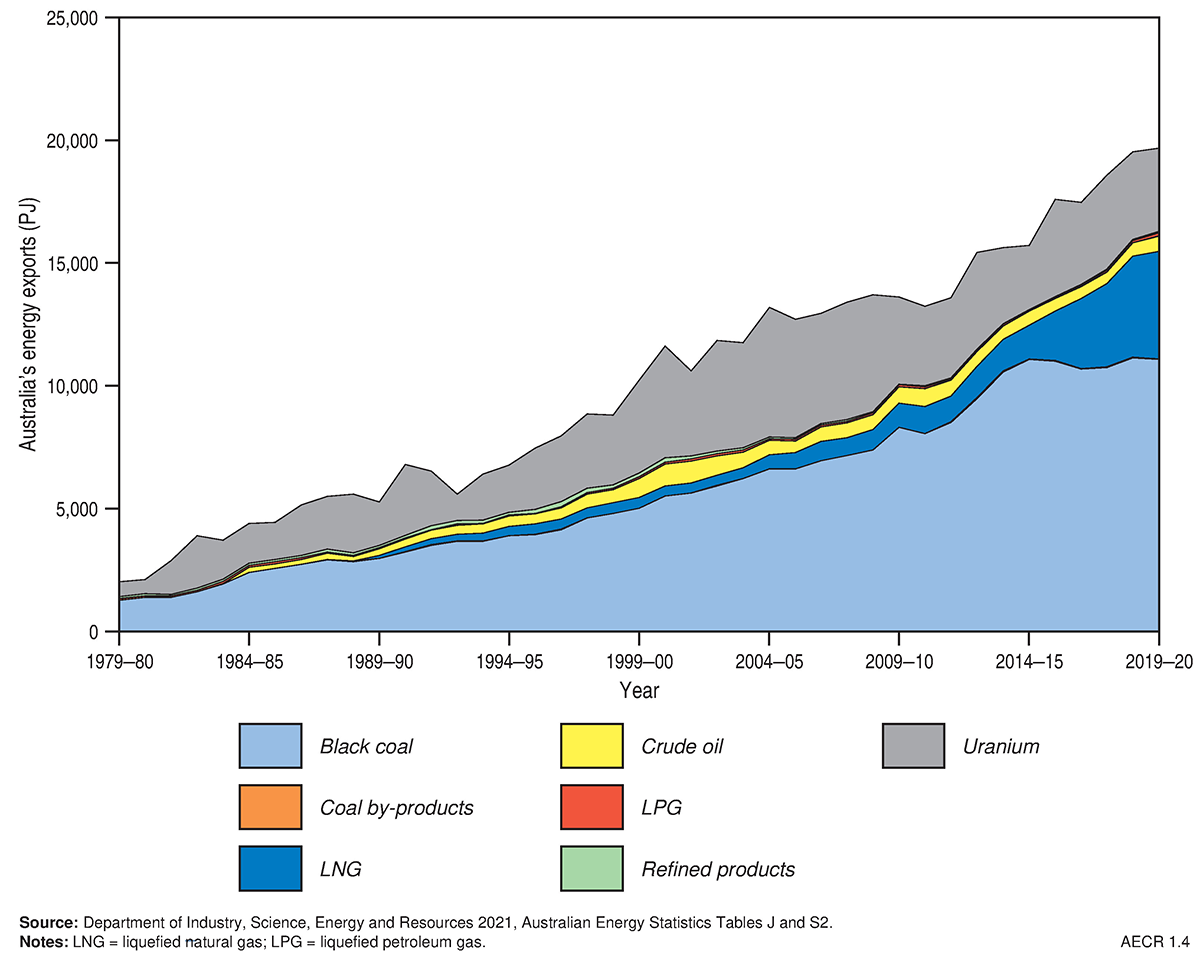
Australia’s LNG exports grew by 6.4 per cent in 2019–20 to 4,393 PJ, making Australia the largest global LNG exporter during this period. Most of the growth in LNG export is associated with the first full year of production from the Ichthys gas/condensate field. However, compared to the average annual growth of 16.1 per cent over the previous decade this growth represents a significant reduction, highlighting an end to the rapid expansion of Australia’s LNG capacity. About 75 per cent of all natural gas produced in Australia was exported in 2019–20. LNG export earnings fell by 4.4 per cent in 2019–20 to AUD$47.5 billion, with higher export volumes offset by low contract and Asian LNG spot prices (Department of Industry, Science, Energy and Resources, 2020a). The only gas Australia imported in 2019–20 was sourced from the former Joint Petroleum Development Area in the Timor Sea, which was transported and liquefied in Darwin for export.
- During 2019–20 Australia was the world’s largest LNG exporter.
Crude oil and condensate exports continued the growth trend that started in 2017–18, increasing by 14.7 per cent to 626 PJ in 2019–20. This growth has been underpinned by rising crude oil production from the Greater Enfield project in the Northern Carnarvon Basin, and increased condensate production from LNG projects on the North West Shelf. LPG exports also increased in 2019–20 by 47.8 per cent to 141 PJ in association with increased LNG production. Export earnings from crude oil and condensate decreased slightly by 0.7 per cent to AUD$9.0 billion in 2019–20, while export earnings for LPG increased by 54.7 per cent to AUD$1.6 billion. Australia continued to import the majority of its crude oil and refined petroleum products, which totalled 2,045 PJ in 2019–20. Crude oil imports declined significantly by 17.3 per cent in response to reduced demand for refined petroleum products in the transport sector during COVID-19 related travel restrictions. Australia also continued to export the majority of our relatively light and sweet oils produced from fields on the North West Shelf to large Asian refineries, and import the majority of our refined petroleum products.
- In 2019–20 about 80 per cent of all crude oil and condensate produced in Australia was exported.
Australia is also a significant exporter of uranium oxide for use in nuclear power plants. However, in 2019–20 uranium exports decreased by 5.0 per cent to 3,382 PJ reflecting the trend of declining growth in uranium exports over the past decade. On average uranium exports decreased by about 0.5 per cent per annum over the past decade. Export earnings for uranium also decreased in 2019–20 by 6.3 per cent to AUD$0.7 billion (Department of Industry, Science, Energy and Resources, 2020a).
Table 4. Australian energy imports by fuel type (2019–20)
| Energy source | Imports (PJ) | Share (%) | Average annual growth 2019–20 (%) | Average annual growth 2009–10 to 2019–20 (%) |
|---|---|---|---|---|
| Coal and coal by-products | 19 | 0.9 | 11.5 | 27.4 |
| Crude Oil and ORF | 696 | 31.0 | -17.3 | -4.1 |
| LPG | 21 | 0.9 | -3.8 | -3.2 |
| Refined Products | 1,328 | 59.2 | 0.1 | 6.6 |
| Natural Gas | 180 | 8.0 | -11.0 | -1.6 |
| Total | 2,244 | 100.0 | -6.9 | 1.1 |
Source: Department of Industry, Science, Energy and Resources, 2021, Australian Energy Statistics Tables J, I1 and S2
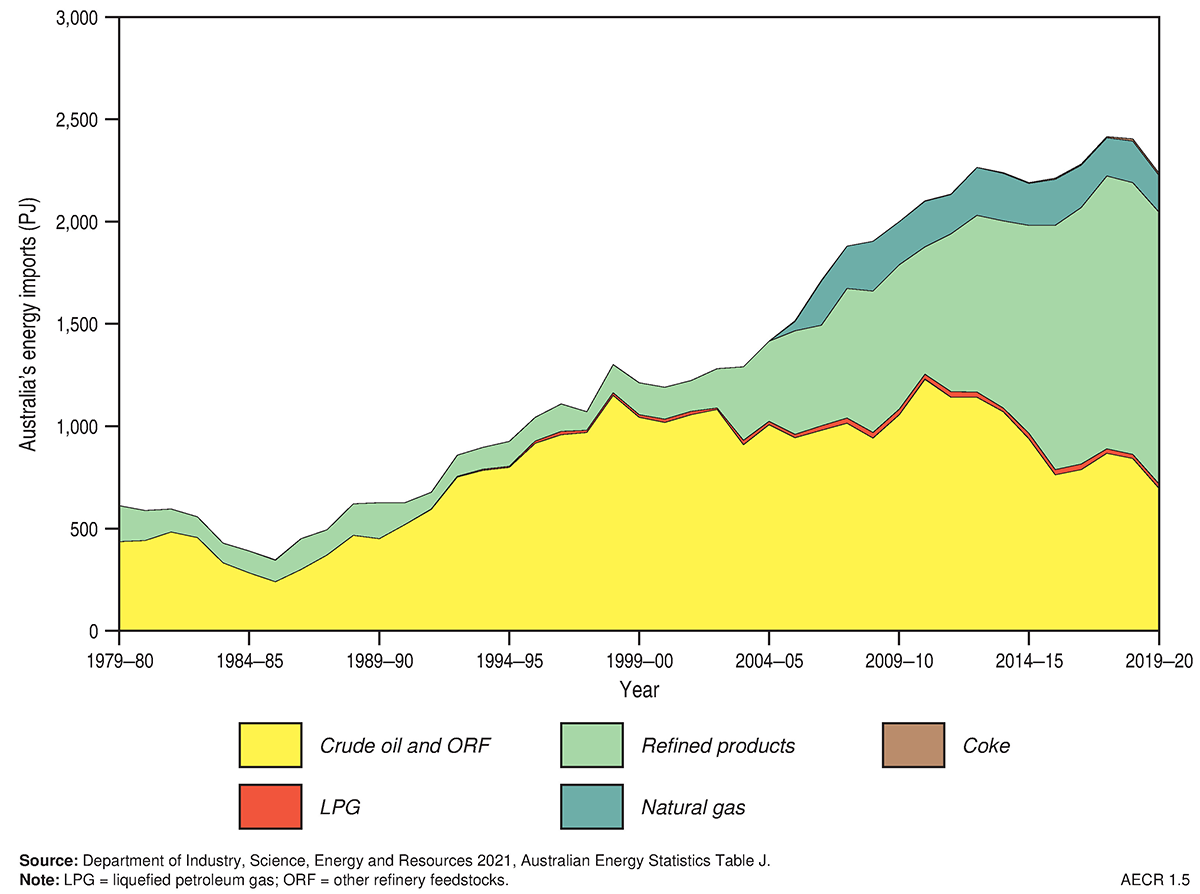
Table 5. Annual value of Australian energy commodity exports by fuel type (2019–20)
| Energy source | Vaue (AUD$billion) | Share (%) | Average annual growth 2019–20 (%) | Average annual growth 2009–10 to 2019–20 (%) |
|---|---|---|---|---|
| Crude oil and ORF | 9.0 | 7.8 | -0.7 | -0.6 |
| LPG | 1.6 | 1.4 | 54.7 | 3.9 |
| Bunker fuel | 1.5 | 1.3 | -19.1 | 1.1 |
| Other petroleum products | 0.6 | 0.5 | -17.3 | 0.5 |
| Natural gas (LNG) | 47.5 | 41.1 | -4.4 | 19.8 |
| Metallurgical coal | 34.2 | 29.6 | -21.5 | 3.4 |
| Thermal coal | 20.4 | 17.6 | -21.5 | 5.5 |
| Uranium | 0.7 | 0.6 | -6.3 | -1.0 |
| Total | 115.5 | 100.0 | -12.9 | 7.2 |
Source: Department of Industry, Science, Energy and Resources (2021) Resource Energy Quarterly, December 2021, Table 2(2)
Australia in the world energy market
Data published by the International Energy Agency (IEA), the World Nuclear Association and by BP are examined in this section to understand the role of Australia’s energy commodity resources production and trade in the context of world energy market in 2019 and 2020. The IEA provides data in their World Energy Balances Highlights (2021) publication on primary energy production and trade for the world and selected countries during 2019. Additional historical data for countries and regions are also provided on the IEA website. Statistics on reserves, production and trade of fossil fuel resources (oil, gas and coal) for key countries and regions during 2020 are available in the BP (2021b) Energy Outlook and BP Statistical Review of World Energy (2021a). Uranium production data for 2020 is published by the World Nuclear Association.
The COVID-19 pandemic had a dramatic impact on global energy demand in 2020, with primary energy consumption falling by 4.5 per cent. About three-quarters of this decline was linked to reduced demand for oil in the transport sector associated with COVID-19 lockdowns. However, global renewable energy production recorded its largest ever growth driven by strong increases in wind and solar generation. The growth in renewable energy in 2020 continues the trend seen over the past five years where wind and solar power generation have more than doubled, while coal-fired generation continues to decline at record rates (4.4 per cent decline in 2020).
- During 2019–20 Australia’s energy consumption decreased by 2.9 per cent to 6,014 PJ, with the largest reduction in consumption occurring in the transport sector due to COVID-19 restrictions on aviation and passenger road transport (Department of Industry, Science, Energy and Resources, 2021a).
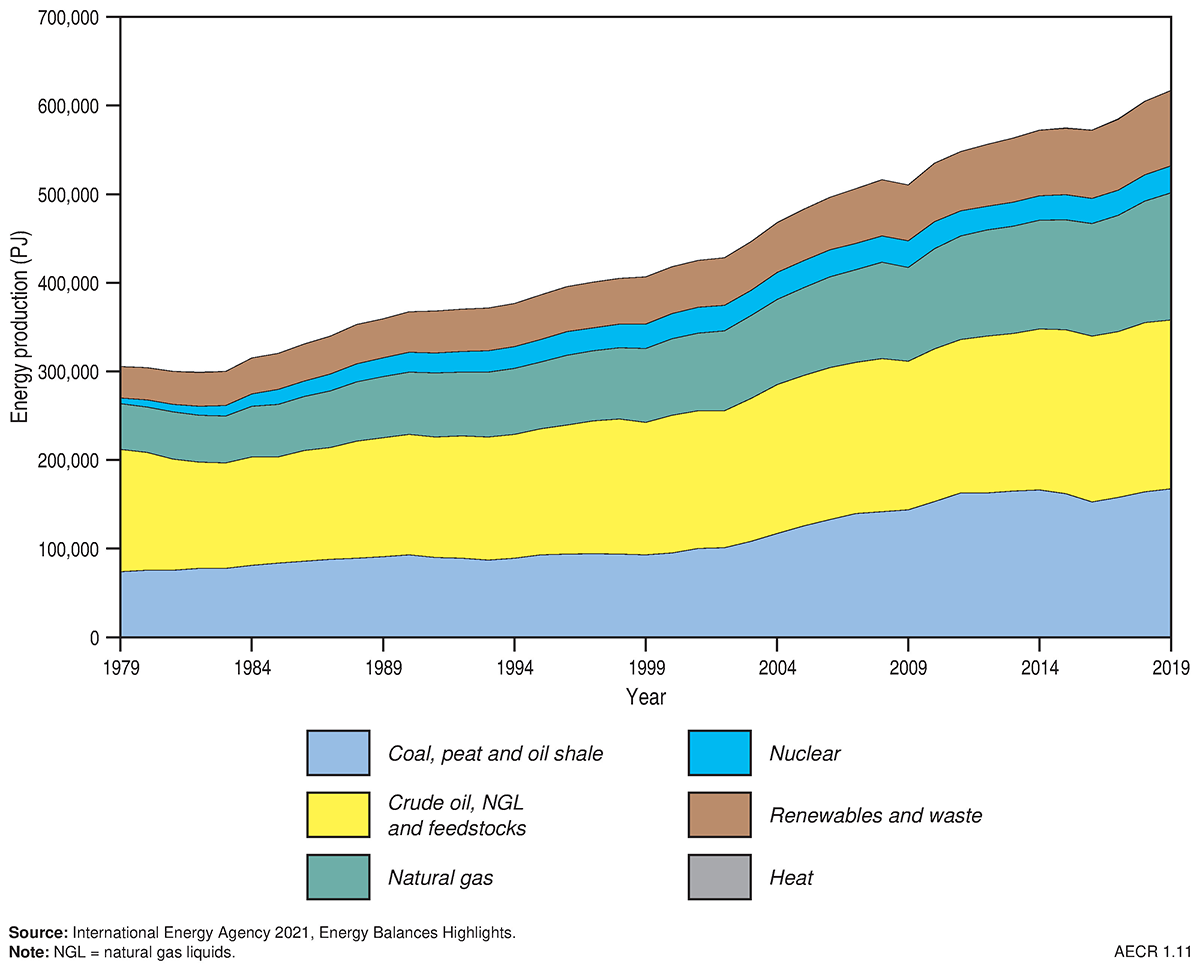
World primary energy production
Primary energy production totalled 617,338 PJ in 2019, with about 45 per cent of all production originating in China, the US and Russia (Table 6). Australia was ranked the eighth highest primary energy producer in 2019 accounting for about 3 per cent (18,623 PJ) of all world energy production. Most global primary energy production was from oil (30 per cent), coal (27 per cent), and natural gas resources (23 per cent; Figure 8). The subsequent fall in global energy demand during the COVID-19 pandemic resulted in a significant decline of 5.0 per cent in fossil fuel production from 501,628 PJ in 2019 to 476,906 PJ in 2020.
Global natural gas production fell in 2020 by 3.3 per cent (4.7 Tcf; 5,286 PJ) in response to reduced gas demand, particularly in Russia and the US. Despite this, the share of gas in primary energy consumption continued to rise reaching a record high of 24.7 per cent. Gas production in Australia declined slightly by 1.0 per cent (0.06 Tcf; 65 PJ) during 2020—a reversal to the 16.2 per cent (0.7 Tcf; 841 PJ) growth seen in 2019.
- At the end of 2020 Australia was the seventh largest natural gas producer, contributing about 3.7 per cent of global gas production.
Table 6. World energy production by country 2019
| Country | Energy production (PJ) | World share (%) | Rank | Major energy resources |
|---|---|---|---|---|
| People's Republic of China | 113,848 | 18.4% | 1 | Coal, renewables |
| United States | 96,706 | 15.7% | 2 | Natural gas, crude oil/NGL/feedstock, coal |
| Russian Federation | 64,056 | 10.4% | 3 | Natural gas, crude oil/NGL/feedstock |
| Saudi Arabia | 26,796 | 4.3% | 4 | Natural gas, crude oil/NGL/feedstock |
| India | 24,290 | 3.9% | 5 | Coal, renewables |
| Australia | 18,623 | 3.0% | 8 | Coal, natural gas, uranium |
| World total | 617,338 |
Notes: The IEA defines nuclear energy as the electricity produced from nuclear power plants and therefore does not include extraction of uranium resources in their energy production data. See Table 2 for Australia's total energy production in 2019–20 including uranium extraction. Source: International Energy Agency (2021), World Energy Balances: Overview
Global oil production fell by 6.6 MMbbl (41 PJ) per day in 2020—the largest fall since the end of World War II. Significant production declines occurred in Russia (1 MMbbl/d; 6.2 PJ/d), Libya (0.9 MMbbl/d; 5.7 PJ/d), Saudi Arabia (0.8 MMbbl/d; 4.9 PJ/d) and the US (0.6 MMbbl/d; 3.7 PJ/d). Oil production in Australia remained relatively resilient showing a 4.1 per cent increase of 0.02 MMbbl/d (0.08 PJ/d).
- At the end of 2020 Australia was ranked 29th in the world for oil production, contributing only 0.5 per cent to global oil production.
Global production of black and brown coal showed a decline of 5.2 per cent (8,300 PJ) in 2020, a significant reversal to the growth in production seen in 2018 and 2019. This fall in global coal production was associated with reduced demand for coal-fired power generation and increasing deployment of renewable energy resources. Several major coal producing countries saw sharp declines, including the US (25.2 per cent; 3,600 PJ), Russia (9.6 per cent; 860 PJ), Indonesia (9.0 per cent; 1,320 PJ) and Australia (6.2 per cent; 790 PJ).
- In 2020 Australia was the world’s fourth largest producer of black and brown coal, contributing about 7.8 per cent of global coal production.
In 2020, global uranium production from mines decreased by 12.8 per cent to 47,731 tonnes U (26,729 PJ). Major falls in uranium production occurred in Canada (44 per cent; 3,053 tonnes; 1,710 PJ) and Kazakhstan (14.6 per cent; 3,331 tonnes; 1865 PJ), while a significant production decline also occurred in Australia (6.2 per cent; 410 tonnes; 230 PJ).
- At the end of 2020, Australia was the world’s second largest producer of uranium.
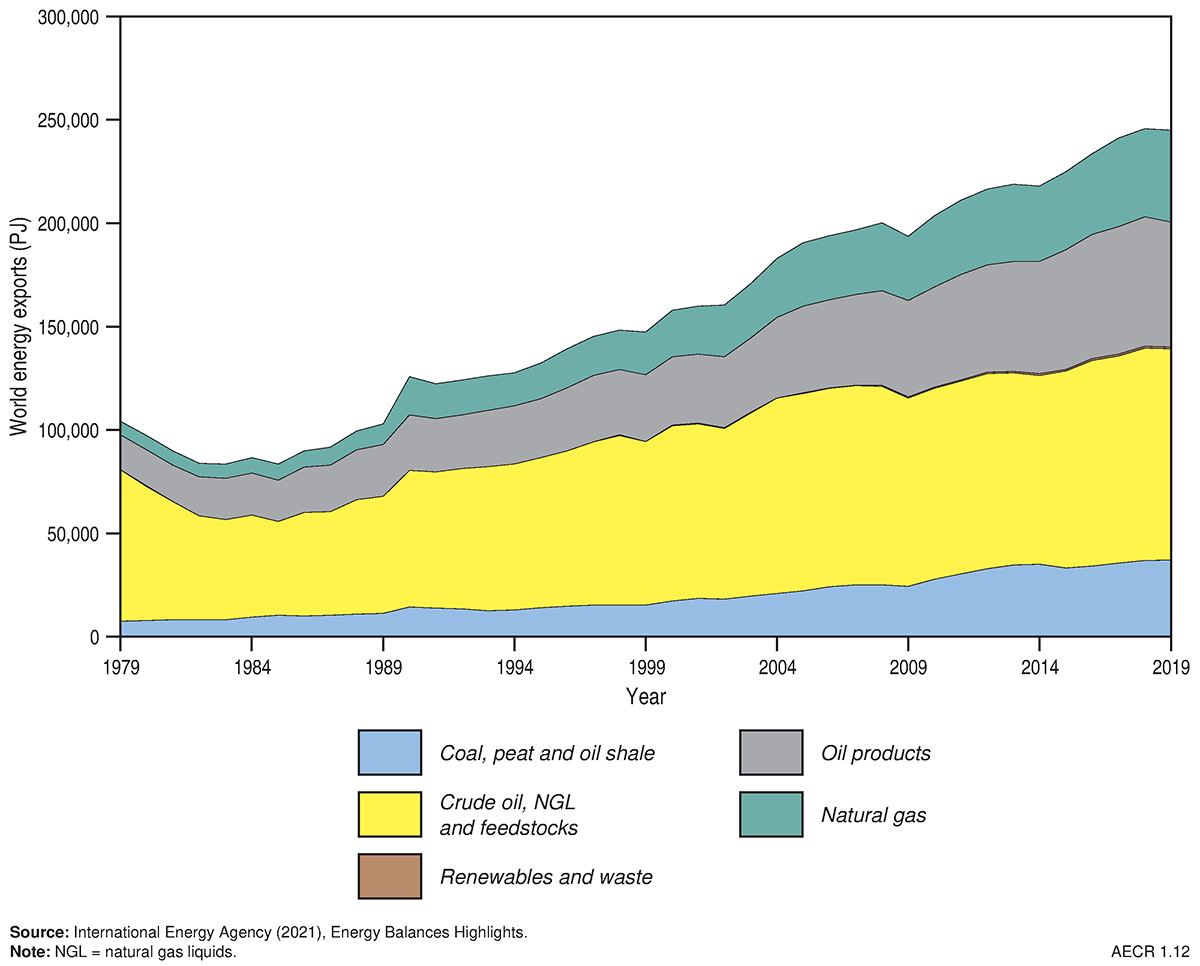
World trade
Fossil fuel exports in 2019 totalled 243,665 PJ, and included 102,077 PJ of oil resources (42 per cent share), 60,177 PJ of oil products (25 per cent share), 44,313 PJ of natural gas (18 per cent share), and 37,098 PJ of coal (15 per cent share; Figure 9). About 46.6 per cent of fossil fuel exports during this period originated from six countries—the Russian Federation (13.3 per cent), the United States (9.3 per cent), Saudi Arabia (7.5 per cent), Australia (6.3 per cent), Canada (5.4 per cent) and Indonesia (4.8 per cent; Table 7).
- In 2019 Australia was the world’s fourth largest exporter of fossil fuel resources.
During 2020 there was a significant fall of 7.6 per cent (1,950 MMbbl; ~11,448 PJ) in the global trade of crude oil and refined products. This fall in oil trade was experienced by most of the major oil exporting countries, with the exception of the US which showed a minor rise of 0.3 per cent (8.0 MMbbl; ~49 PJ). Australia’s oil exports reversed the global trend increasing by 19 per cent (15.8 MMbbl; ~93 PJ) in 2020.
Table 7. World energy exports by country in 2019
| Country | Energy exports (PJ) | World share (%) | Rank | Major energy exports |
|---|---|---|---|---|
| Russian Federation | 32,406 | 13.3 | 1 | Largest natural gas exporter (pipeline & LNG) and major exporter of oil and coal |
| United States | 22,697 | 9.3 | 2 | Major exporter of oil and natural gas |
| Saudi Arabia | 18,165 | 7.5 | 3 | Largest oil and NGL exporter |
| Australia | 15,317 | 6.3 | 4 | Largest exporter of coal, largest exporter of LNG |
| Canada | 13,177 | 5.4 | 5 | Major exporter of oil and natural gas |
| Indonesia | 11,677 | 4.8 | 6 | Second largest coal exporter |
| World Total | 243,665 |
Notes: Includes coal, natural gas, crude oil and natural gas liquids (NGL), and oil products. Source: International Energy Agency (2022)
In 2020, global trade of natural gas fell by 5.3 per cent (1.8 Tcf; ~1,990 PJ), driven by a 10.9 per cent (1.9 Tcf; 2,149 PJ) decline in pipeline trade. LNG supply increased slightly by 0.6 per cent (0.15 Tcf; 163 PJ) but was still well below the 10-year average of 6.8 per cent. Significant growth in LNG exports occurred in the US (29.2 per cent; 0.5 Tcf; 556 PJ), while Australia showed a moderate increase of 1.2 per cent (0.05 Tcf; 60 PJ).
Coal exports experienced a 6.2 per cent (2,000 PJ) fall in 2020, with declines seen in exports from all major coal producing countries. Australia’s coal exports fell by 4.3 per cent (380 PJ) in 2020, a significant decline from 2019 (0.9 per cent fall; 85.2 PJ). Coal imports fell in most countries, with the exception of China which increased coal imports by 3.1 per cent (210 PJ).
- In 2020–21, Australia was the world’s largest exporter of metallurgical coal and the second largest exporter of thermal coal (Department of Industry, Science, Energy and Resources, 2021b).
Ownership and administration of energy resources
The Australian Constitution provides that mineral and petroleum resources are owned either by the Australian Government, or the state and territory governments. Exploration and development of these resources are undertaken by companies operating under licences and permits granted by the government. The Australian, state and territory governments actively encourage investment in Australia’s energy resources.
Petroleum exploration and production activities beyond three nautical miles from the territorial sea baseline and within Australia’s Exclusive Economic Zone (‘Commonwealth Waters’) are the responsibility of the Australian Government. These resources are governed under the Offshore Petroleum and Greenhouse Gas Storage Act 2006 and by maritime boundary treaties with neighbouring countries. The Joint Authorities (comprising the Commonwealth and state and territory governments), the National Offshore Petroleum Titles Administrator and the National Offshore Petroleum Safety and Environmental Management Authority grant, administer and regulate petroleum titles to ensure that exploration and development activities are compliant with the relevant regulatory frameworks.
Exploration for, and development of, non-renewable resources onshore and out to three nautical miles is the responsibility of the state and territory governments. They are administered and regulated under the relevant state or territory legislation relating to minerals and petroleum. The legislation varies between jurisdictions but is similar in content and administration across the jurisdictions and is based on a two stage process of exploration permit and production licence. An overview is provided in Australia's Energy and Mineral Resources Investor Guide, and more information is available from the state and territory mineral and petroleum departments and agencies.
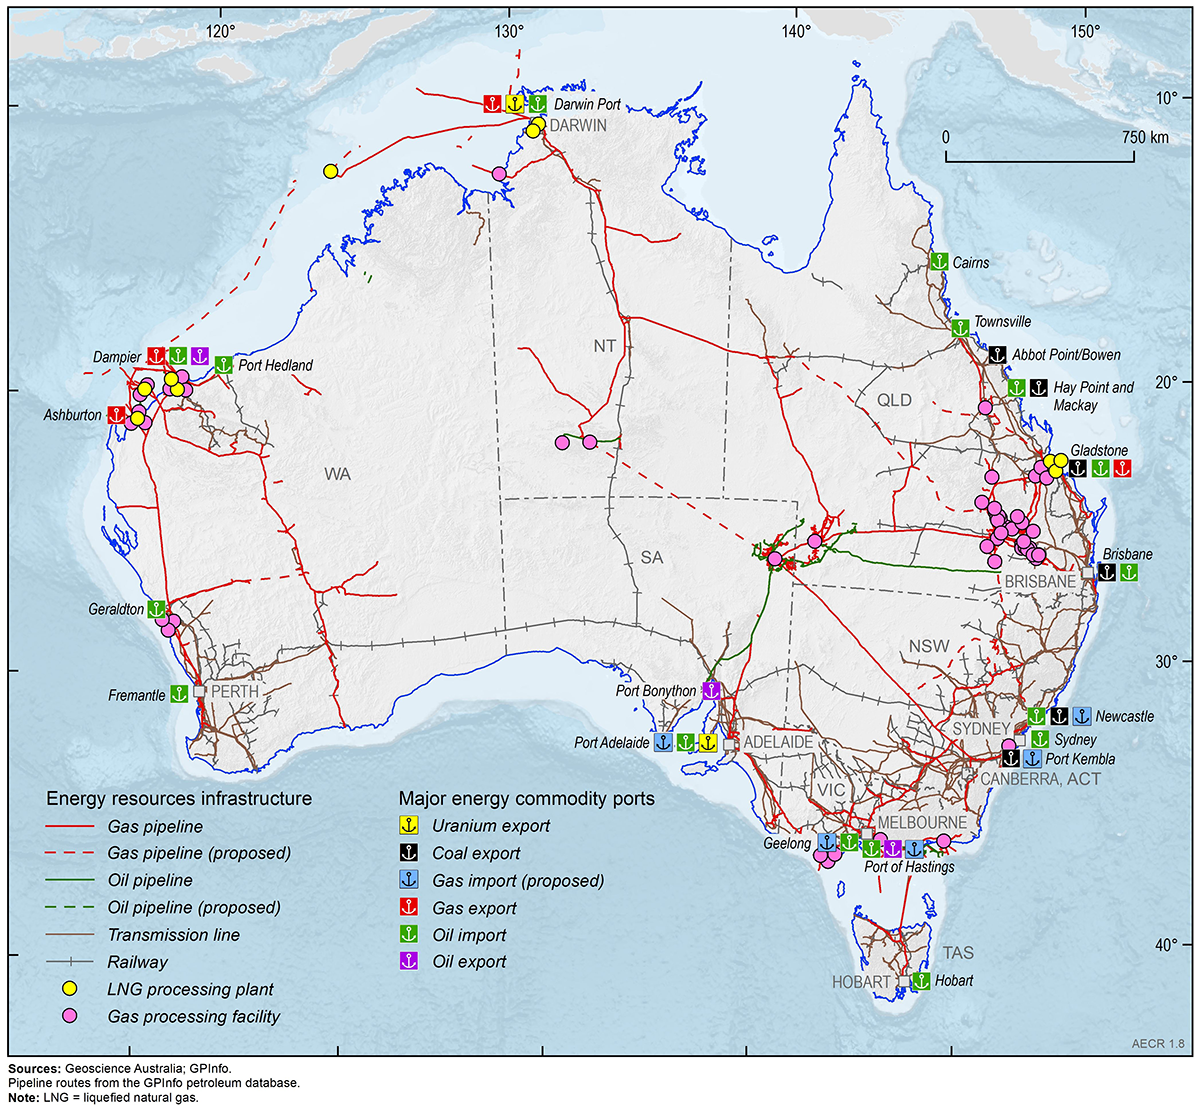
Energy production and distribution infrastructure
Utilisation of Australia’s abundant non-renewable energy resources requires investment in reliable energy supply infrastructure, including gas pipelines, gas processing and storage facilities, ports, rail networks (Figure 10). Gas is distributed across a series of transmission pipelines from areas of extraction and processing plants to either ports for export as LNG, or to power stations, large industrial and commercial plants, mines, and local consumers via gas retailers for domestic consumption. Shipping is the main transport mode used to trade Australia’s energy resources, including coal (six ports), petroleum liquids (four ports and one floating facility), gas (four ports and one floating facility), and uranium (two ports).
Maritime trade is forecast to double in the next 20 years as Australia’s economy continues to grow. Australia has a dedicated network of railway infrastructure for the transportation of coal and uranium resources from their extraction points to a number of major ports for export.
Gas pipelines
Gas pipelines in Australia consist of long-haul transmission pipelines, which deliver gas from production and processing facilities, to domestic markets and export terminals (Figure 10). These pipelines typically have wide diameters and operate under high pressure to optimise shipping capacity.
An interconnected gas pipeline network, including fourteen major pipelines, links gas fields in the Northern Territory, Queensland, South Australia and Victoria with industrial and domestic demand centres across eastern and southern Australia. This interconnected gas transmission network has become increasingly important in recent years to ensure peak gas demand in southern states during winter is supplied by gas producing basins in northern Australia (AEMO, 2022). The Western Australian gas market is serviced by a series of ten major pipelines, which link gas fields in the Perth Basin and the North West Shelf to the mining sector and domestic markets (AEMO, 2021). Construction also began in 2021 on the 580 km Northern Goldfields interconnect, which will allow gas from the Perth Basin to meet demand in the Kalgoorlie region (AEMO, 2021).
Gas storage facilities
Gas storage facilities provide flexible capacity to meet domestic consumption requirements by storing surplus gas produced during low demand periods in summer to meet increased demand during winter. In 2021, gas storage facilities include two depleted gas fields in Western Australia (Mondarra and Tubridgi), two depleted gas fields in eastern Australia (Silver Springs and Iona), and two LNG storage facilities in eastern Australia (Newcastle and Dandenong).
In recent years, there has been increased reliance on gas storage in southern states as gas production from locally sourced fields has decreased. The critical role for managing gas storage in southern Australia is expected to increase after 2023 to mitigate forecast drops in south-eastern Australia gas production (AEMO, 2022).
Ports
Shipping is the main mode of transport for Australia’s imports and exports. During 2021, about $135 billion of trade moved through Australian ports, making up 98 per cent of Australia’s total trade (Ports Australia). Australia has 77 trading ports, a number of which are equipped to export coal, oil, gas and uranium (Figure 10).
There are six major coal exporting ports, which are located in New South Wales and Queensland. Newcastle is currently the world’s largest coal export port (Department of Infrastructure and Regional Development, 2018). While infrastructure capacity constraints (including port and rail) have limited the ability of the Australian coal industry to respond to growing global demand in previous years, recent additions to capacity, including an expansion of the Hay Point coal port in Queensland, will help alleviate these constraints (Department of Industry, Innovation and Science, 2016).
Gas is exported as LNG from ports in Western Australia (Dampier and Ashburton), the Northern Territory (Darwin) and Queensland (Gladstone). Liquid hydrocarbons (petroleum and condensate, liquid petroleum gas [LPG]) are exported from the Dampier region (crude oil), Darwin (LPG), the Port of Hastings in Victoria (crude oil and LPG), and Port Bonython in South Australia (LPG). The Prelude floating LNG production facility in the Browse Basin (offshore Western Australia) is also used to export LNG and LPG. Overall, there are about 150 terminals that offload petroleum products from domestic and/or international sources.
The export of uranium is only approved from two ports—Darwin in the Northern Territory—and Port Adelaide in South Australia (Ports Australia, 2019).
Proposed LNG import terminals
LNG import terminals represent an alternative source of gas for consumers in eastern Australia. A number of LNG import terminals have been proposed to help offset declining production from gas fields in southern Australia, thereby firming seasonal and peak supply requirements. These terminals could source gas from both international and domestic markets, potentially providing a virtual pipeline from Australia’s northern gas fields to southern demand centres. The Port Kembla Energy Terminal is currently the only committed project and is anticipated to be operational by winter 2024 (AEMO, 2022).
Rail
Australia has substantial rail infrastructure including 33,221 route km of heavy railways, 291 route km of light rail/tramways and heavy and light urban passenger rail networks of 401 route km and 250 route km, respectively (Department of Infrastructure and Regional Development, 2018; Figure 10). The rail network transports a variety of resources from their extraction points to a number of major ports for export. For example, the railways enable Port Hedland to be the world’s largest bulk export port.
Most extracted coal is transported via the rail network and, with iron ore, forms the largest bulk freight flows. The principal coal rail networks include the central Queensland systems (1,979 route kilometres) and the New South Wales Hunter Valley Coal network (approximately 785 route kilometres). Approximately 90 per cent of coal produced in Queensland and 73 per cent in New South Wales is exported. Coal extracted in Tasmania is used domestically (Department of Infrastructure and Regional Development, 2018). Rail is also used to transport uranium to ports in Adelaide and Darwin for export.
Enabling Clean Energy Technologies
In 2021 the Australian Government committed to reach net zero CO2 emissions by 2050. In support of this target, Australia’s 2021 Technology Investment Roadmap and Low Emissions Technology Statement identifies hydrogen production and carbon capture and storage (CCS) as two key priority technologies to support the transition to a low emissions economy (Department of Industry, Science, Energy and Resources, 2021d).
Hydrogen
Hydrogen is a key enabling technology recognised under the 2021 Technology Investment Roadmap (Department of Industry, Science, Energy and Resources, 2020b) and has been identified as a key technology for decarbonising our energy systems in Australia’s National Hydrogen Strategy (Commonwealth of Australia, 2019).
There are two primary methods currently available for producing clean hydrogen:
- Production of hydrogen using renewable energy sources such as solar and wind power to split hydrogen from water using a process known as electrolysis.
- Production of hydrogen through a thermochemical reaction using water and fossil fuel feedstocks such as coal (coal gasification) or natural gas (steam methane reforming). The CO2 emissions created as a by-product are captured and stored in deep sub‑surface geological formations.
Globally, around 70 million tonnes of hydrogen are produced each year with a further 48 million tonnes produced as a by‑product of other industrial processes (IEA, 2019). The large majority of all hydrogen produced to date has been derived from fossil fuels without carbon capture and storage. Current global production of clean hydrogen is low, at around 390,000 tonnes a year, but this is expected to increase rapidly to 17 million tonnes by 2030, supported by the strong ambitions of governments and private industry (Department of Industry, Science, Energy and Resources, 2021e). It is currently less expensive to produce hydrogen using fossil fuels with CCS, but it is anticipated that the costs will narrow over the coming years.
Australia’s hydrogen potential
With large potential for renewable energy, abundant identified resources of natural gas and coal, and good potential geological storage sites for any co‑produced CO2, Australia is well placed to become a major hydrogen producer for both domestic consumption and export. Development of an Australian hydrogen industry will not only ensure our future energy security, but also enable our abundant non-renewable energy resources to be transformed into a carbon free energy source for overseas markets. There is already significant interest in hydrogen production for Australia. Some $133–185 billion dollars is currently in the investment pipeline for hydrogen. This is equivalent to 35 per cent of all planned energy and mineral resource investment into Australia (Department of Industry, Science, Energy and Resources, 2021f). The Government has also invested $1.2 billion in funding to support hydrogen projects and research (Department of Industry, Science, Energy and Resources, 2021e).
Geoscience Australia’s AusH2 data portal provides open access data sets and tools to assist governments and industry to assess hydrogen potential in Australia. One of these tools is the Hydrogen Economic Fairways Tool, or HEFT. Released in 2021, HEFT helps policymakers and investors make decisions about the location of new infrastructure and the development of hydrogen hubs. The tool conducts detailed geospatial-financial analysis of future large-scale hydrogen projects and considers both hydrogen produced by renewable energy and from fossil fuels with CCS.
Like natural gas or LNG, hydrogen can be transported by pipelines, trucks or ships in compressed, liquefied form, or as a chemical compound such as ammonia or methylcyclohexane. Hydrogen can be stored in tanks on the surface, or in sub‑surface salt caverns or depleted gas fields. Storage infrastructure is essential to enable hydrogen to be produced and stored during periods of low energy demand, then distributed to demand centres during periods of high energy consumption. Geoscience Australia is currently mapping the distribution of potential hydrogen storage sites, particularly thick underground salt accumulations, under its Exploring for the Future Program.
Australia’s hydrogen projects
While large scale implementation of hydrogen production is not yet available in Australia, there are several pilot, demonstration and small-scale projects in various stages of operation. Figure 11 shows the location of current hydrogen projects in Australia and the results of a mapping scenario using the HEFT tool that considers hydrogen production from electrolysis and hybrid wind and solar. The total number of hydrogen projects has increased from 58 at the end of 2020 to 83 at the end of 2021. Importantly, the number of operational projects or projects under construction has significantly increased from 3 in 2020 to 20 in 2021. These projects are still small, with the largest operational project Jemena’s Western Sydney Green Gas Project, producing 53 tonnes per year from electrolysis using renewable energy.
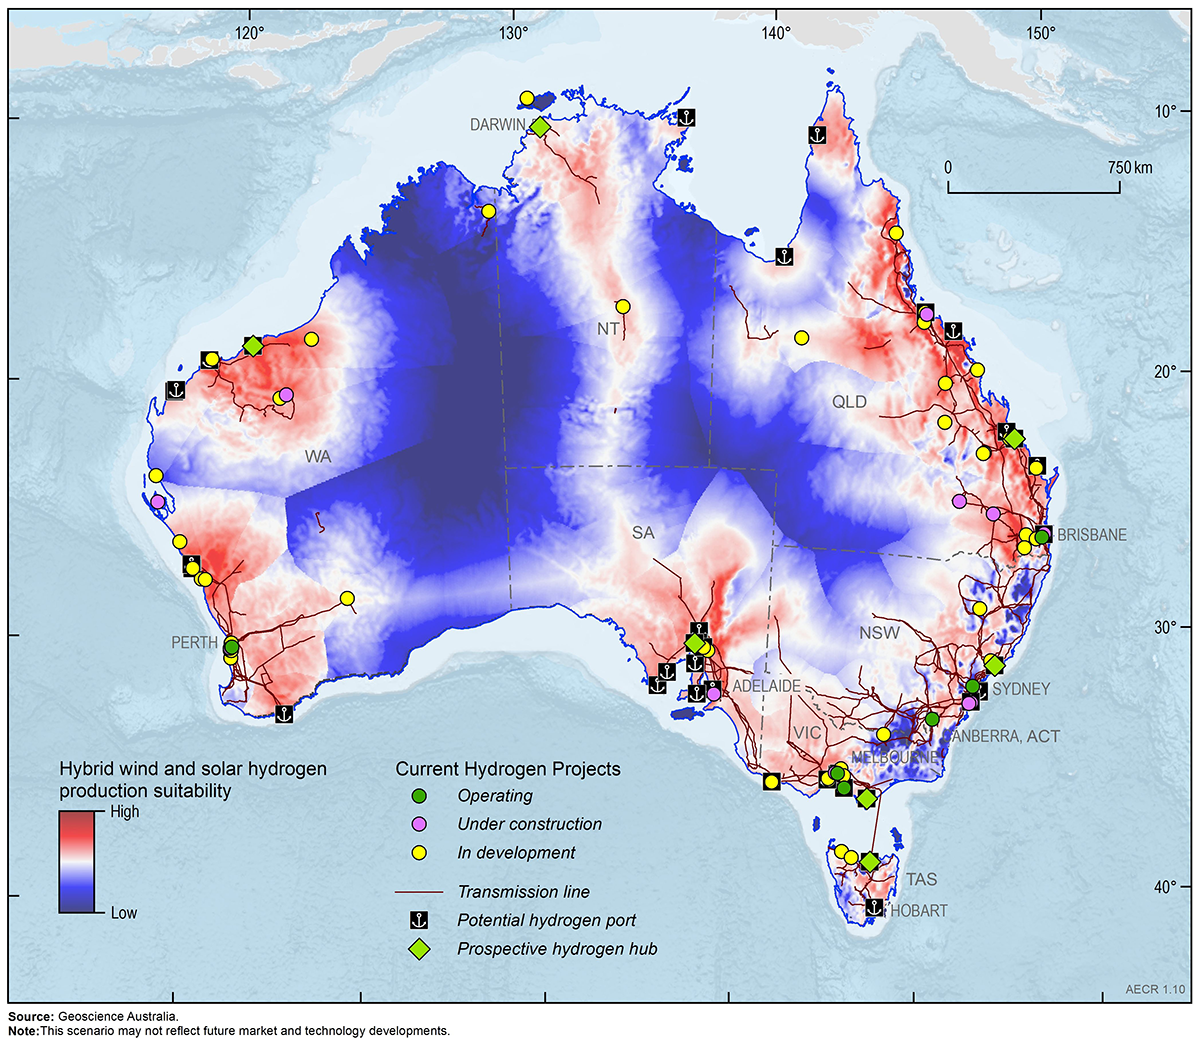
Australia’s Gippsland Basin is the location for a world first project, the Hydrogen Energy Supply Chain (HESC) Project, which is demonstrating the feasibility of producing clean liquid hydrogen from brown coal resources in the La Trobe Valley for export to Japan. The project has the potential to provide clean, economically viable hydrogen through gasification of coal, and associated carbon capture and storage of CO2 by-products in suitable geological storage sites within the Gippsland Basin. This first pilot hydrogen export project commenced hydrogen production in early 2021. The world’s first purpose-built liquefied hydrogen carrier, the Suiso Frontier, delivered liquid hydrogen from the HESC facility to Kobe, Japan, in February 2022.
Carbon Capture and Storage
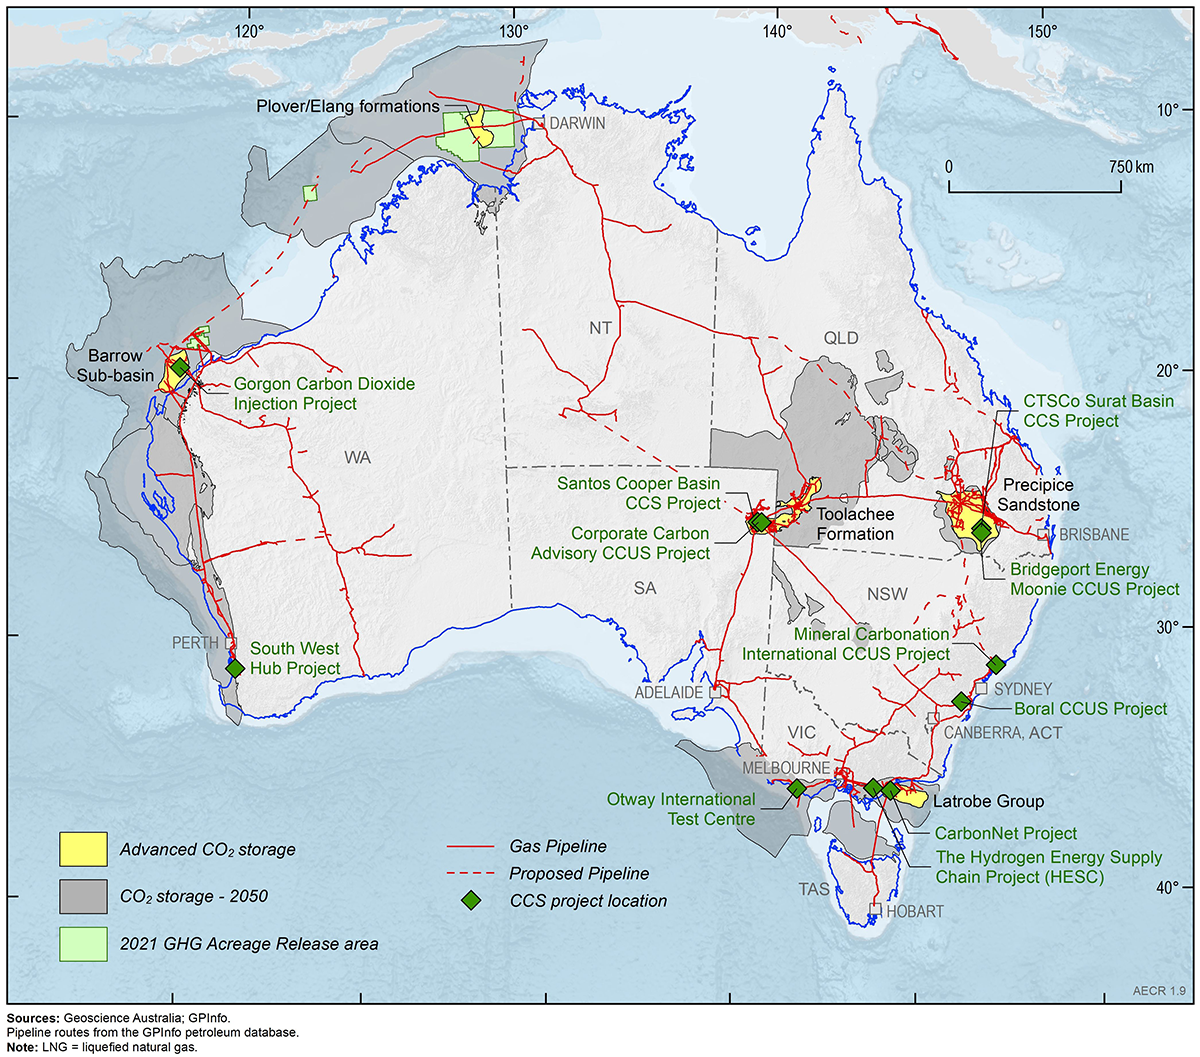
Carbon capture and storage (CCS) is a technology that can reduce the amount of CO2 released to the atmosphere from stationary anthropogenic sources and can also be used to remove CO2 directly from the atmosphere. CCS includes capturing, transporting, compressing and then injecting CO2 into deep underground geological formations where it becomes permanently trapped. There are two carbon capture and storage projects operating in Australia, and five additional projects are at various stages of assessment for commercial viability (Figure 12).
CCS for the gas industry
Natural gas can contain significant concentrations of CO2 mixed with methane. CO2 is most commonly separated from the natural gas stream and vented to the atmosphere. Venting practices are becoming less acceptable as concerns mount about increasing CO2 emissions to the atmosphere. In many regions, gas producers are already considering re‑injecting the CO2 gas stream into sub-surface formations near the producing gas fields, or into depleted gas fields. The Chevron led Gorgon LNG plant includes one of the largest and most advanced CCS projects in the world, capturing CO2 produced from the Gorgon and Jansz-Io gas fields and storing it in the Upper Jurassic Dupuy Formation in the Barrow Sub-basin. The Gorgon CCS project has to date stored about 6 Mt of CO2, and plans to inject and store more than 100 Mt of CO2 during the project’s 40-plus year lifetime (Chevron, 2022).
CCS for enhanced oil recovery
The use of anthropogenic CO2 in the enhanced oil recovery (EOR) process is another way to achieve permanent storage of CO2 in the sub‑surface (Verma, 2015). CO2–EOR involves injecting CO2 into mature oil fields to mobilise trapped oil and extend the life of the fields. This approach has been used widely in the USA where oil compositions, geological conditions, the proximity of CO2 sources to oil fields and tax credits for CO2 stored through CO2-EOR have made the process economically viable (United States Department of Energy, 2010). One CO2–EOR project is currently in the feasibility stage in Australia, Bridgeport Energy’s Moonie CCUS project in the Surat Basin.
CCS for hydrogen production
CCS is likely to play a significant role in the development of Australia’s nascent hydrogen industry. (Bruce et al., 2018). Although hydrogen can be generated with near-zero emissions through the use of renewable energy to electrolyse water, currently most hydrogen is produced from natural gas or coal combined with water. Producing hydrogen in such a manner produces significant amounts of CO2, which can be mitigated through CCS. The Hydrogen Energy Supply Chain (HESC) project, for example, plans to produce, liquefy and transport hydrogen from coal and biomass and store the resulting CO2 in the offshore Gippsland Basin, through the CarbonNet Project, which is planning to inject 5 Mtpa of CO2 from an emissions hub in the Latrobe Valley.
CCS for the coal industry
Due to the historical importance of coalfired power in providing cheap, baseload power in many countries, a significant amount of effort has been put towards capture and storage of CO2 from coalfired power plants over the past 20+ years. However, the gases emitted from coal-fired power plants possess a number of gas components, complicating the capture of CO2 from the gas stream and thereby increasing the cost of capture. As a result, older coal-fired power stations in Australia are instead progressively retiring rather than being retrofitted with capture facilities. The CTSCo Project (Carbon Transport and Storage Company), however, is assessing the feasibility of the full process of CO2 capture and storage applied to a comparatively new build coal-fired power station (Millmerran, operating since 2002). The demonstration project will capture and inject between 60,000 and 120,000 tonnes CO2 per year for three years (Coal 21, 2018), and has potential to expand to commercial scale CO2 capture and geological storage (millions of tonnes CO2 per year; University of Queensland Carbon Storage Assessment Project).
References
Australian Energy Market Operator. 2021. 2021 Western Australia gas statement of opportunities, December 2021 (last accessed 3 April 2022).
Australian Energy Market Operator. 2022. Gas statement of opportunities, March 2022, for eastern and south‑eastern Australia (last accessed 3 April 2022).
BP. 2021a. bp Energy Outlook: 2021 edition (last accessed 3 April 2022).
BP. 2021b. bp Statistical Review of World Energy, 70th edition (last accessed 3 April 2022).
Bruce, S., Temminghoff, M., Hayward, J., Schmidt, E., Palfreyman, D., and Hartley, P. 2018. National Hydrogen Roadmap, CSIRO, Australia (last accessed 5 May 2022).
Chevron. 2022. 2022 Chevron Investor Day (last accessed 11 April 2022).
Coal 21. 2018. CTSCO carbon capture and storage demonstration: Queensland (last accessed 5 May 2021).
Commonwealth of Australia 2019. Australia’s National Hydrogen Strategy (last accessed 5 May 2021).
Department of Industry, Innovation and Science. 2016. Resources and energy major projects. In: Resources and Energy Quarterly, December 2016 (last accessed 5 May 2021)
Department of Industry, Science, Energy and Resources. 2020a. Resources and Energy Quarterly, September 2020 (last accessed 3 April 2022).
Department of Industry, Science, Energy and Resources. 2020b. Technology Roadmap Discussion Paper, Australian Government, Department of Industry, Science, Energy and Resources (last accessed 5 May 2022).
Department of Industry, Science, Energy and Resources. 2021a. Australian Energy Statistics (last accessed 3 April 2022).
Department of Industry, Science, Energy and Resources. 2021b. Resources and Energy Quarterly, March 2021 (last accessed 3 April 2022).
Department of Industry, Science, Energy and Resources. 2021c. Resources and Energy Quarterly, December 2021 (last accessed 3 April 2022).
Department of Industry, Science, Energy and Resources. 2021d. Low Emissions Technology Statement 2021, (last accessed 8 April 2022)
Department of Industry, Science, Energy and Resources. 2021e. State of Hydrogen 2021, (last accessed 8 April 2022)
Department of Industry, Science, Energy and Resources. 2021f. Resources and Energy Major Projects: 2021 Report, (last accessed 8 April 2022)
Department of Infrastructure and Regional Development. 2018. Trainline 6 Statistical Report (last accessed 5 May 2021)
Geoscience Australia. 2018. Australian Energy Resources Assessment.
Geoscience Australia, 2021. Australia’s Energy Commodity Resources, 2021 Edition. Geoscience Australia, Canberra (last accessed 3 April 2022).
International Energy Agency (IEA). 2019. The Future of Hydrogen (last accessed 5 May 2021).
International Energy Agency (IEA). 2021. World Energy Balances: Overview (last accessed 3 April 2022).
Ports Australia. 2019. Trade statistics for 2016‑2017 (last accessed 5 May 2021).
Senior, A., Britt, A., Summerfield, D., Hughes, A., Hitchman, A., Cross, A., Champion, D., Huston, D., Bastrakov, E., Sexton, M., Moloney, J., Pheeney, J., Teh, M., and Schofield, A., Geoscience Australia 2021. Australia’s identified mineral resources, 2020 (last accessed 5 May 2021).
United States Department of Energy (National Energy Technology Laboratory). 2010. Carbon Dioxide Enhanced Oil Recovery Report. 31 pages (last accessed 5 May 2021).
Verma, M.K. 2015. Fundamentals of carbon dioxide‑enhanced oil recovery (CO2‑EOR)—A supporting document of the assessment methodology for hydrocarbon recovery using CO2‑EOR associated with carbon sequestration. U.S. Geological Survey Open‑File Report 2015–1071 (last accessed 5 May 2021).
Data download
Australia’s Energy Commodity Resources Data Tables – 2020 Reporting Period