

Key messages
- Uranium and thorium are naturally occurring elements that are widespread in the Earth's crust. Mining occurs in locations where such elements are naturally concentrated.
- To produce nuclear fuel from uranium ore, the uranium is extracted from the host rock and then the 235U isotope is progressively enriched.
- Australia has the world’s largest Economic Demonstrated Resources of uranium and is the world’s second largest uranium producer. However, Australia has no commercial nuclear power plants and has very limited domestic uranium requirements.
- Australia’s average annual export volume of uranium for the last 10 years is approximately 5,910 tonnes (tU). However, in the medium term, Australia’s uranium exports will drop by approximately 20 per cent due to the Ranger mine ceasing operations in January 2021.
- Thorium has been used previously in the nuclear generation process but its use is still largely experimental and there is no current commercial market for thorium.
- Thorium is not produced in Australia and production on a large scale is unlikely in the immediate future.
Summary
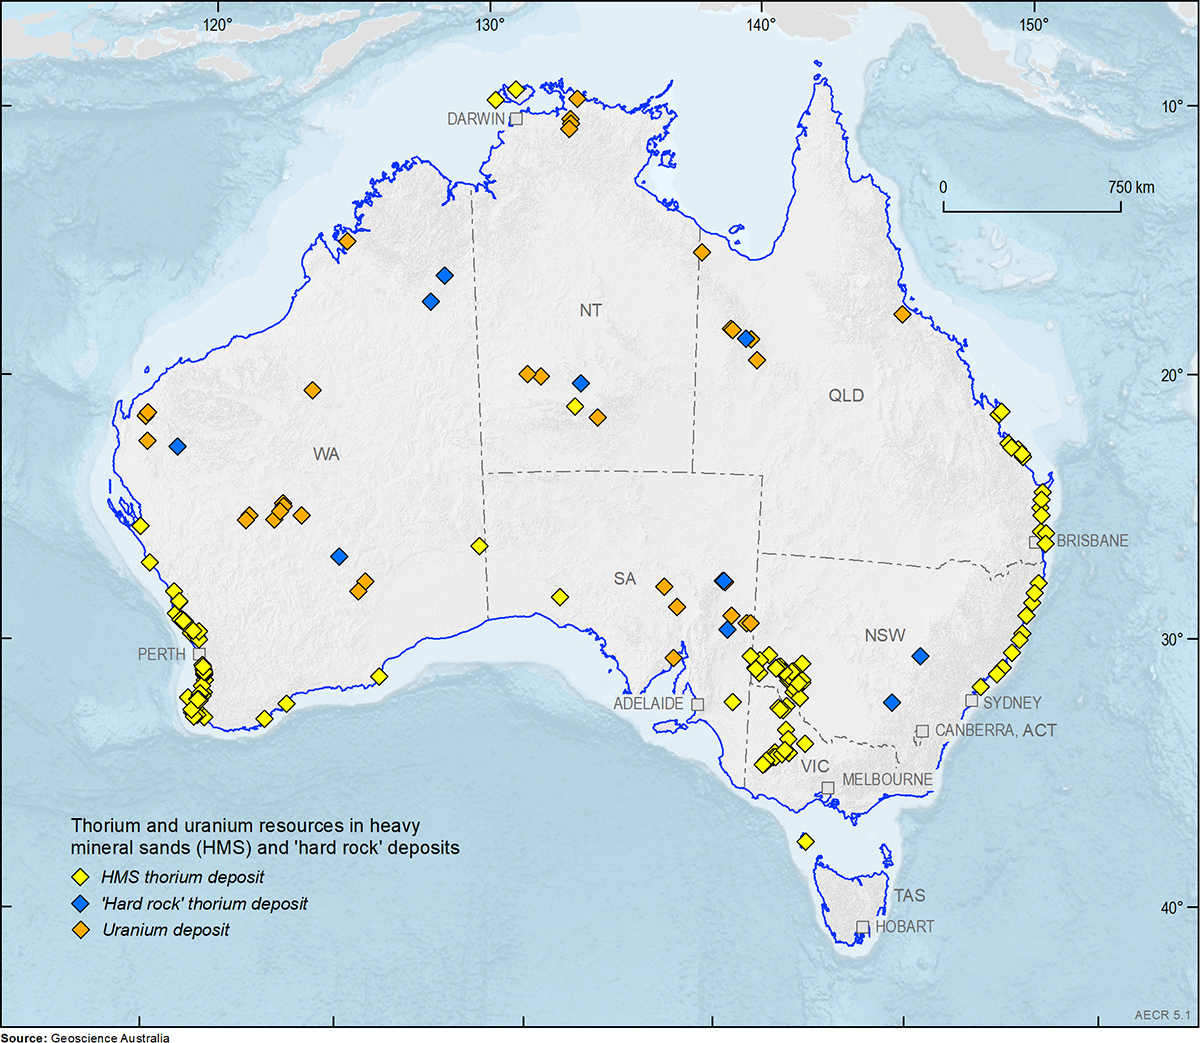
Australia has widespread uranium- and thorium-bearing mineral deposits (Figure 1). The Olympic Dam mine in South Australia remains the world’s largest deposit of uranium.
As at 31 December 2020, Australia has the world’s largest Economic Demonstrated Resources (EDR) of uranium—1,239 thousand tonnes of uranium (ktU; 693,672 petajoules [PJ])—and in 2020 was the world’s second largest producer of uranium. In 2020, Australia had three producing uranium mines: Olympic Dam and Four Mile in South Australia, and Ranger in the Northern Territory.
Australian supply of uranium has declined moderately over the past ten years, mainly due to the closure of two mines in 2014 and 2015. In the short to medium term, due to the closure of the Ranger Mine in January 2021, Australian annual production of uranium will decrease by approximately 20 per cent.
Exploration expenditure for uranium has also been in decline since the crash of the uranium price in 2011, following the Fukushima Daiichi nuclear accident. Additionally, bans and uncertainties concerning uranium mining in some states have negatively affected Australia’s ability to attract investment in uranium exploration. In 2020 investment in uranium exploration was $6.7 million, down by 34 per cent compared with the previous year and the lowest it has been since 2001. However, in 2021, exploration investment jumped to $12.3 million, an increase of 84 per cent compared to the 2020 figure.
There are currently no commercial applications for thorium and world production and consumption rates are negligible. As such, thorium is not produced in Australia and production on a large scale is unlikely in the immediate future.
At present, Australia has no plans for a domestic nuclear power industry. However, interest in the industry at state level led to the South Australian Nuclear Fuel Cycle Royal Commission in 2015 and, more recently, the New South Wales Uranium Mining and Nuclear Facilities (Prohibitions) repeal Bill 2019 and the Victorian Inquiry into Nuclear Energy Prohibition (2020). Additionally, at the federal level, an Inquiry into the Prerequisites for Nuclear Energy in Australia by the House of Representatives Standing Committee on the Environment and Energy was undertaken 2019.
Australia’s identified resources
Uranium
Uranium is a mildly radioactive element that is widespread at levels of 1–4 parts per million (ppm) in the Earth’s crust. Concentrations of uranium-rich minerals, such as uraninite, carnotite and brannerite, can form economically recoverable deposits. The majority of Australia's uranium occurs in four main types of deposit: iron oxide breccia complexes, unconformity-related resources, sandstone resources and palaeochannel/calcrete-style resources.
Once mined, uranium is processed into uranium oxide (U3O8), also referred to as uranium oxide concentrate, and is exported in this form. Natural uranium (from mine production) contains approximately 0.7 per cent of the uranium isotope 235U and 99.3 per cent 238U.
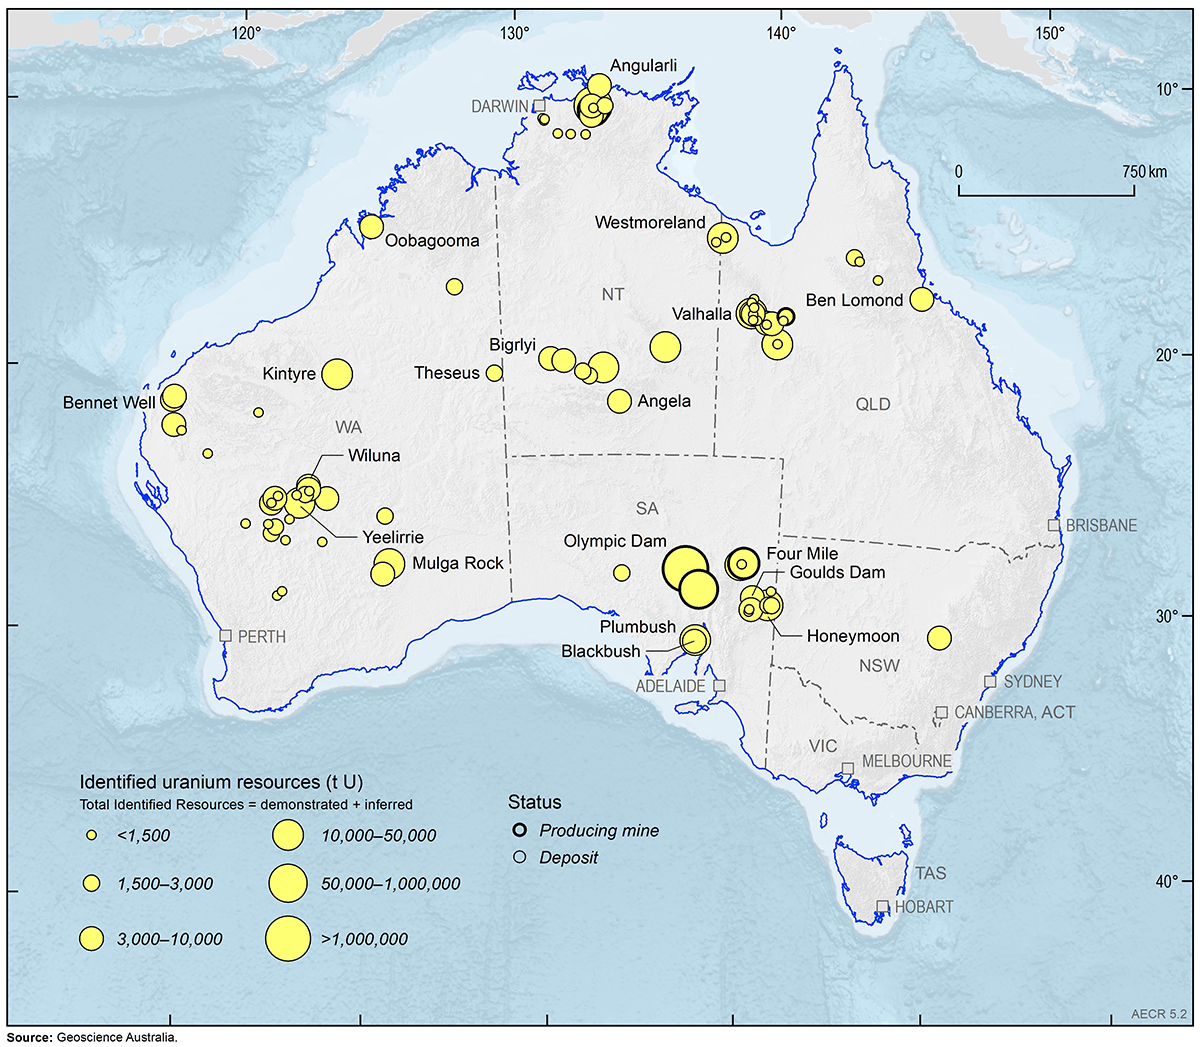
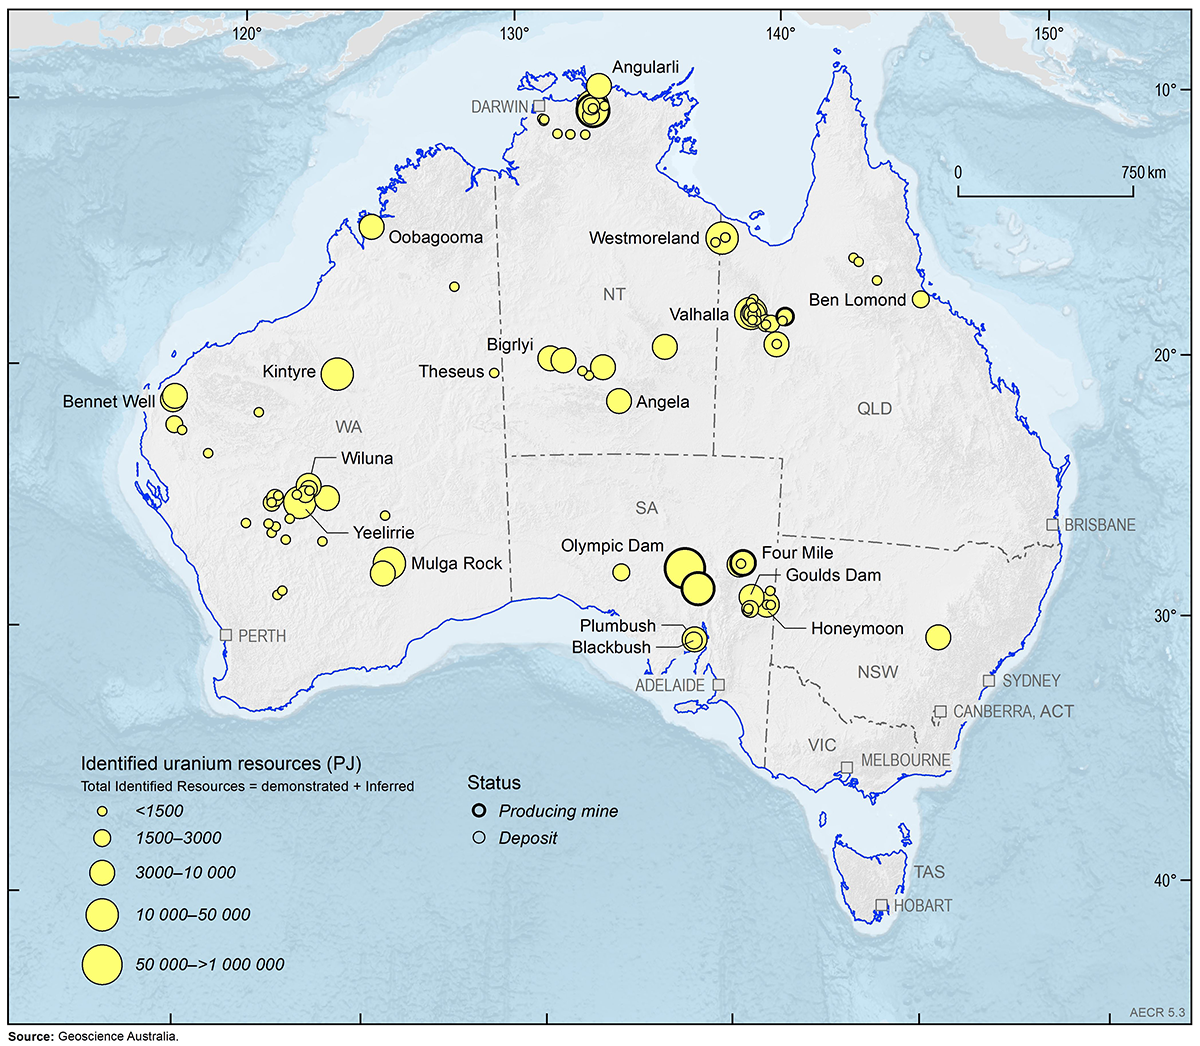
As at December 2020, Australia’s Economic Demonstrated Resource (EDR) for uranium was 1,239 ktU (693,672 PJ). An additional 79 ktU (44,251 PJ) was classified as Subeconomic Demonstrated Resources and 642 ktU (359,528 PJ) as Inferred Resources. Australia’s total Identified Resources were 1,960 ktU (1,097,474 PJ). Although most Australian states and territories host uranium deposits, EDR are concentrated in South Australia, the Northern Territory and Western Australia (Figure 2 and Figure 3). South Australia’s Olympic Dam is the world’s largest uranium deposit, with an EDR of 963 ktU (539,063 PJ).
Thorium
Thorium is a naturally occurring slightly radioactive metal that is three to five times more abundant in the Earth’s crust than uranium. It is less conducive to nuclear weapons proliferation and due to its greater energy-producing efficiency, generates substantially less radioactive waste. The most common source of thorium is monazite, a rare earth phosphate mineral that is a minor constituent of heavy mineral sand (HMS) deposits. On average, monazite contains approximately 6 per cent thorium and 60 per cent rare earth elements.
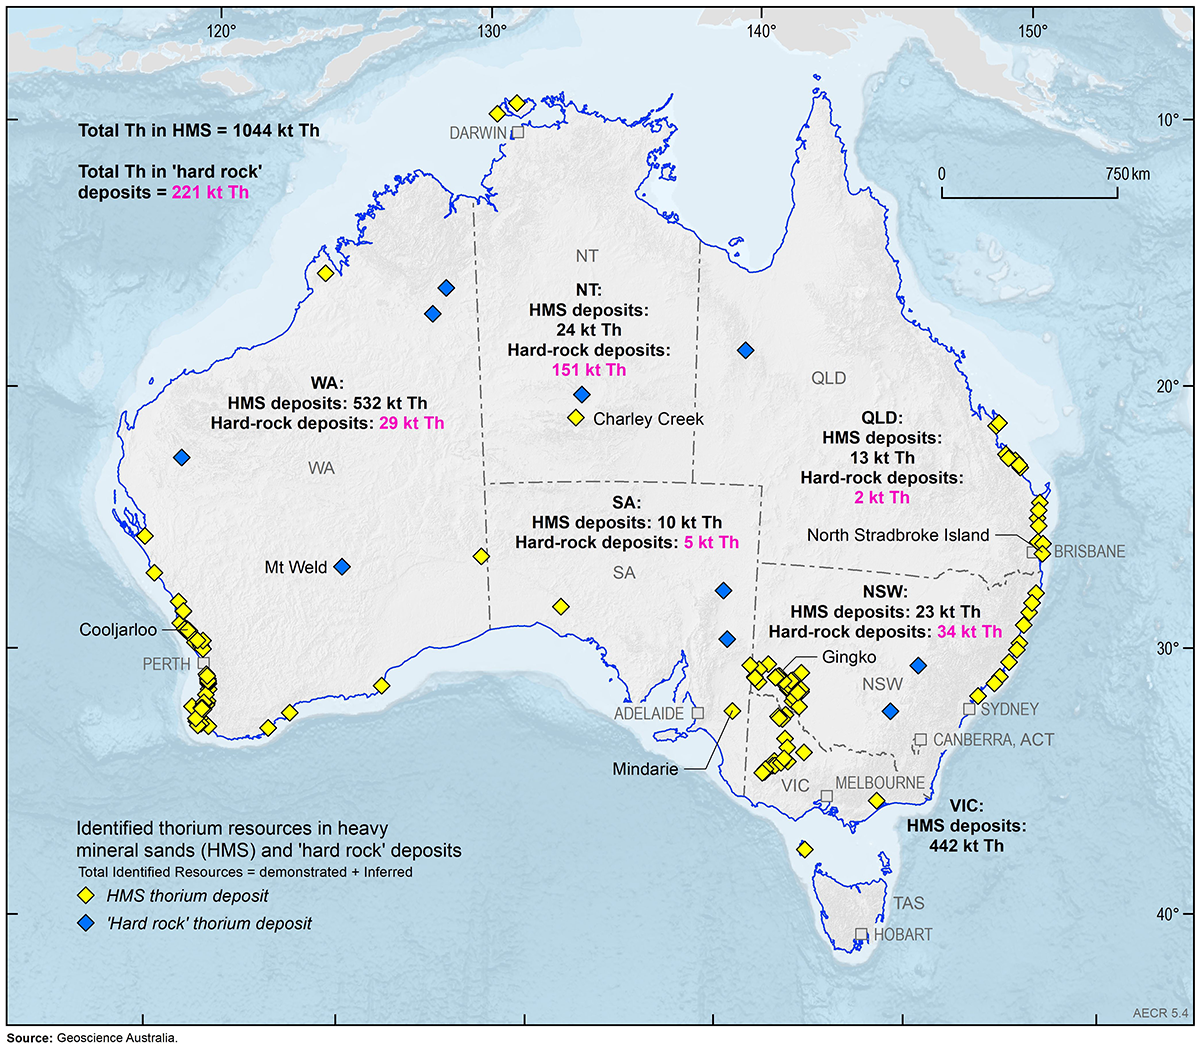
In Australia, approximately 80 per cent of thorium resources are contained in HMS deposits; the remaining 20 per cent are in rare earth element hard-rock deposits (Figure 4). Monazite and thorium resources are not generally published and so Geoscience Australia estimates the monazite (and hence thorium) content in deposits and classifies these estimated resources as Inferred Resources. Using this approach, Geoscience Australia estimates that Australia’s total identified in situ thorium resources were approximately 1,265 kt as of 31 December 2020.
Currently, no thorium is produced in Australia. Although HMS deposits containing monazite are currently being mined, the monazite is not recovered due to the lack of a thorium market.
Production
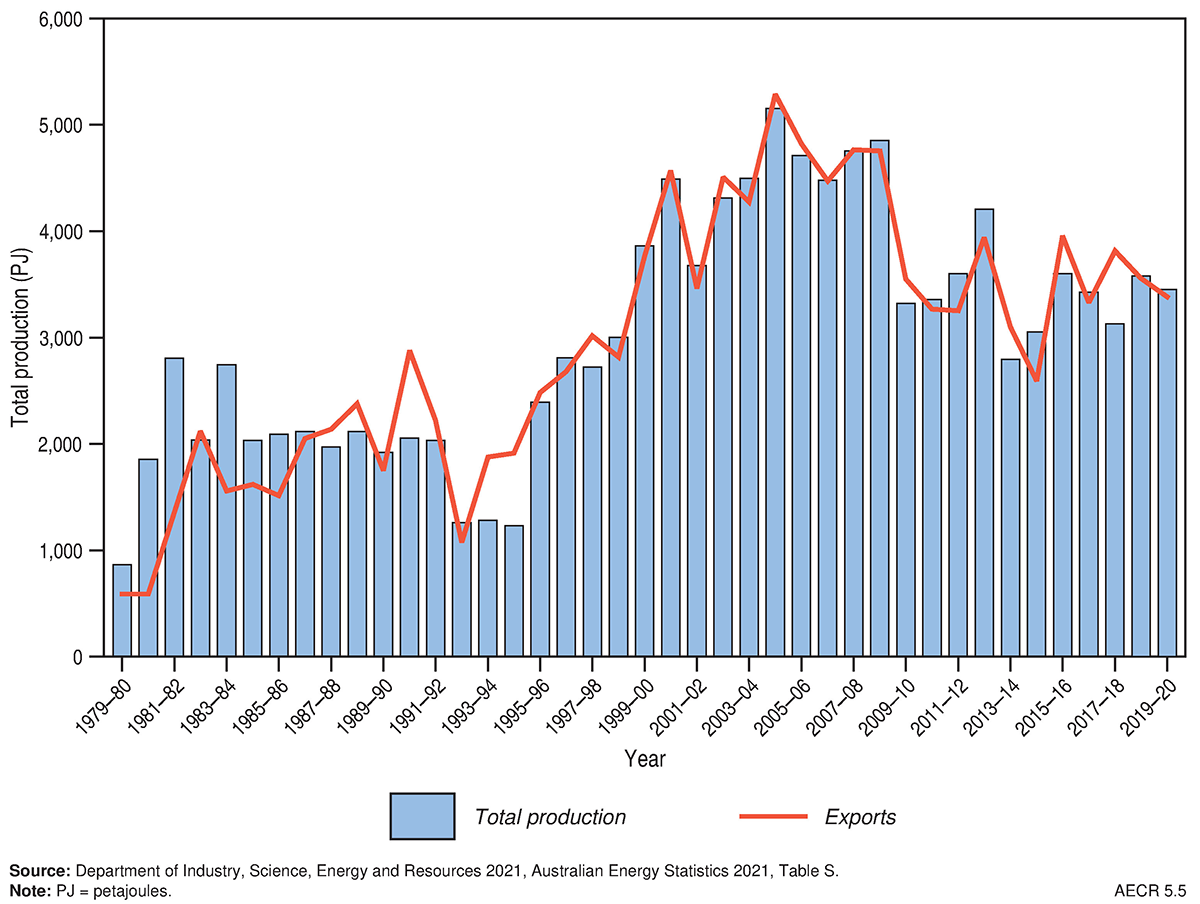
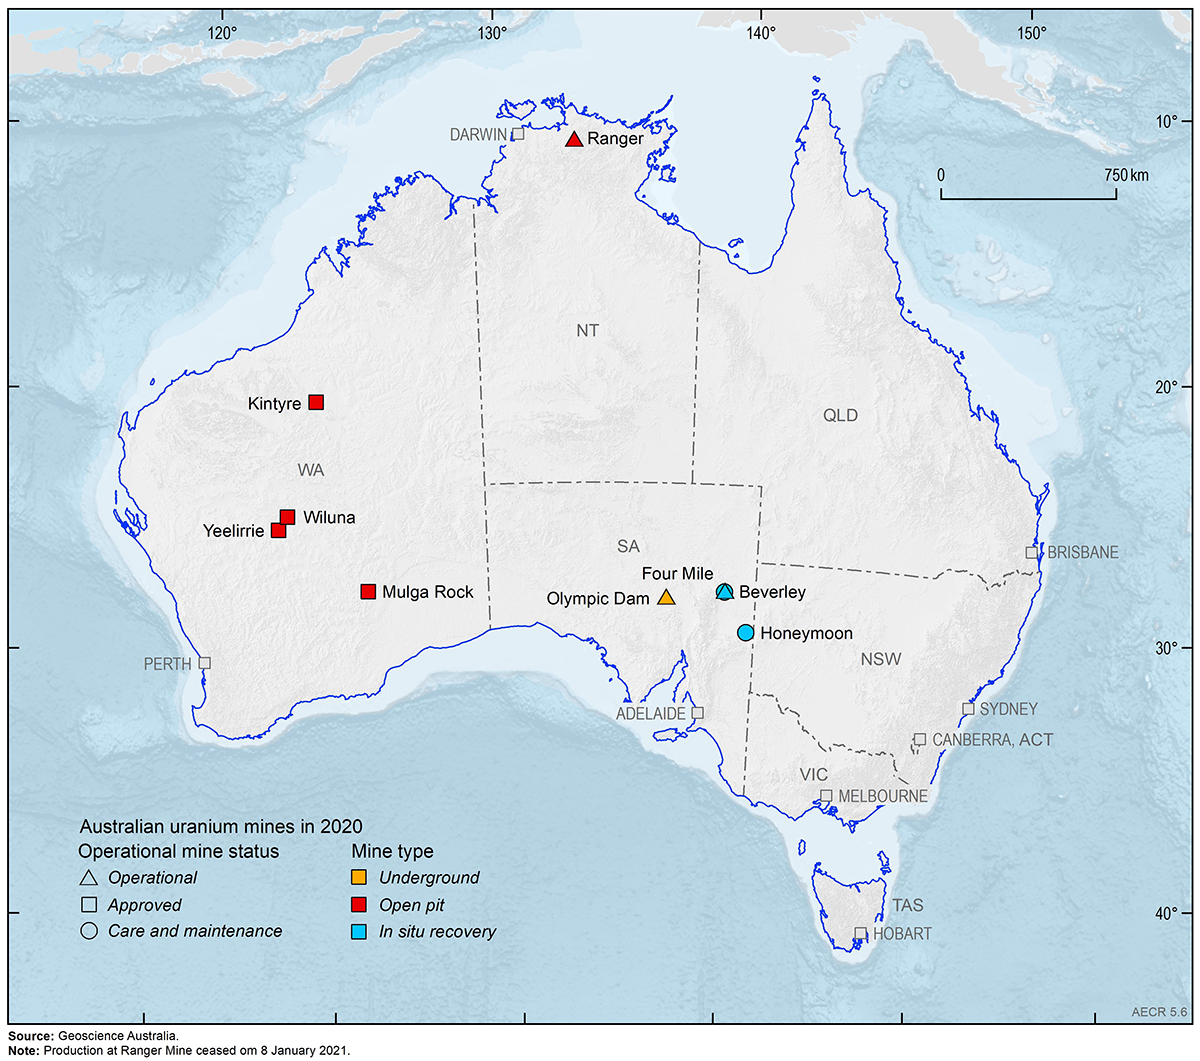
In 2020, Australia’s production of uranium was approximately 6,195 ktU (3,469 PJ; Figure 5) and was the world’s second largest uranium producer (13 per cent) after Kazakhstan (41 per cent) and ahead of Namibia (11 per cent). This is in contrast to the previous 10 years where Australia’s uranium production has ranked third behind Canada, whose production in 2020 dropped significantly. In 2020, Australia’s uranium was produced from three operating mines: Olympic Dam and Four Mile in South Australia, and Ranger in the Northern Territory (Figure 6). Australia's uranium production will fall by approximately 20 per cent in the medium term due to the cessation of mining at the Ranger mine. All of Australia’s domestic production is exported.
As of January 2022, new mining is proposed at Boss Energy’s Honeymoon project (South Australia). In Western Australia, the Cameco Australia’s Kintyre and Yeelirrie projects, Toro Energy’s Wiluna project, and Vimy Resources Mulga Rock project have all received environmental approval (Figure 6). Development of these projects is contingent on international uranium market conditions.
Global uranium production is focused in a small number of countries, with Australia, Kazakhstan, Canada, Namibia, South Africa and Niger accounting for most production. Proterozoic unconformity-related deposits in Canada dominate the categories of lowest production cost. The sandstone-hosted resources of Kazakhstan, Niger and the United States comprise the next cost level. The Australian Olympic Dam breccia complex deposit is dominant in the key cost category of less than US$130/kgU.
Trade
Australia exports all its uranium production to countries with which it has a bilateral safeguards agreement with, which now total 43. These agreements ensure that Australian uranium is only used for peaceful purposes and does not contribute to any military applications. Australian mining companies supply uranium under long-term contracts to electricity utilities in North America, Europe and Asia. In 2020, Australia exported 3,331 PJ (5,949 ktU)—88 per cent of this was exported to North America and the remaining 12 per cent to Europe.
World resources
The Organisation for Economic Co-operation and Development Nuclear Energy Agency and the International Atomic Energy Agency (OECD NEA and IAEA) describe 15 uranium deposit types. The largest tonnages are the sandstone, Proterozoic unconformity and Polymetallic iron-oxide breccia complex deposits (OECD-NEA and IAEA, 2020).
World Reasonably Assured Resources (RAR) of uranium recoverable at less than US$130/kgU were estimated at approximately 3,791 million tonnes (Mt) in 2020 (OECD NEA and IAEA, 2020). Australia accounts for approximately 31 per cent of this global inventory (Figure 7) (Table 1).
Extracting the latent energy value of thorium in a cost-effective manner is a challenge and requires considerable investment in research and development (World Nuclear Association, 2017). Another challenge is that thorium can only be used as a fuel in conjunction with a fissile material such as recycled plutonium.
Thorium-fuelled reactors have previously operated to generate electricity at Hamm-Uentrop in Germany (300 MWe, 1983–1989), at Peach Bottom (40 MWe, 1967–1974), Fort St Vrain (330 MWe, 1976–1989) and Shippingport (60 MWe, 1977–1982) in the United States (World Nuclear Association, 2017), with India having a longstanding program to develop thorium-based reactors. India has one small test facility in operation with a network of larger commercial facilities planned (World Nuclear Association, 2019; Power, 2019).
However, as international research into associated technologies tends to be small scale and intermittent (e.g. New Scientist, 2017), commercial use of thorium as a nuclear reactor fuel is still some decades away.
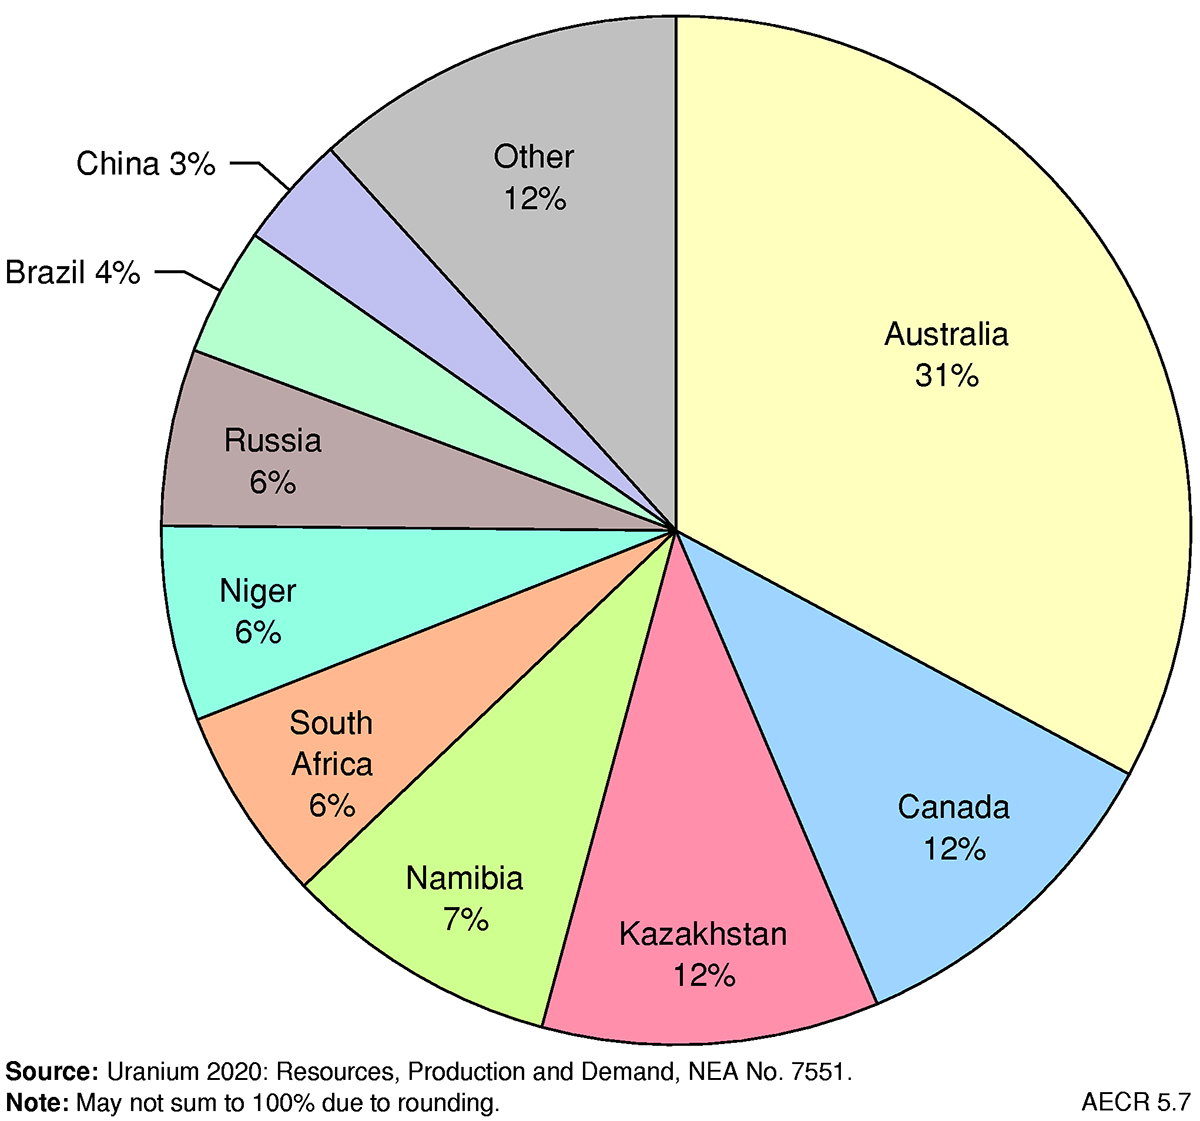
Table 1. Key uranium statistics
| Unit | Australia 2020 | World 2020 | |
|---|---|---|---|
| Resources | |||
| Identified RAR recoverable at <US$130/kg U | PJ | 693,672 | na |
| t U | 1,238,700 | na | |
| Share of World | % | na | 100 |
| World Ranking | na | na | |
| Production | |||
| Annual production | PJ | 3,469 | 26,729 |
| t U | 6,195 | 47,731 | |
| Share of world | % | 13.0 | 100 |
| World ranking | no. | 2 | na |
| CAGR from 2010 | % | -0.5 | na |
| Exports | |||
| Annual exports | PJ | 3,331 | na |
| t U | 5,949 | na | |
| Export value | A$b | 0.7 | na |
Notes: t = tonne; PJ = petajoule; RAR = Reasonably Assured Resources; CAGR = compound annual growth rate; na = not available or not applicable. Data Sources: World resources and production data are from the World Nuclear Association; Australian export data are from Department of Industry, Science, Energy and Resources (2021) Resources and Energy Quarterly December 2021 and have been converted from tonnes uranium oxide to tonnes uranium metal.
References
Australian Safeguards and Non-Proliferation Office (ASNO) 2021. Australian Safeguards and Non-Proliferation Office Annual Report 2020–2021 (last accessed 5 May 2022)
Department of Industry, Science, Energy and Resources 2021. Resources and Energy Quarterly, December 2021 (last accessed 5 May 2022).
New Scientist 2017. Thorium could power the next generation of nuclear reactors (last accessed 5 May 2022).
Organisation for Economic Co-operation and Development Nuclear Energy Agency and International Atomic Energy Agency (OECD NEA and IAEA) 2020. Uranium 2020: Resources, Production and Demand (last accessed 5 May 2022).
Power 2019. Indian-designed nuclear reactor breaks record for continuous operation (last accessed 5 May 2022).
World Nuclear Association 2017. Thorium (last accessed 5 May 2022).
World Nuclear Association 2019. Nuclear Power in India (last accessed 5 May 2022).
World Nuclear Association 2021. World Uranium Mining Production (last accessed 5 May 2022).
Upcoming data releases
- This preliminary release of AECR 2022 includes uranium and thorium commodity resource maps and a download of data tables for the 2020 reporting period.
- A final report documenting Australia’s identified uranium and thorium resources, production, trade and world ranking will be available in late June 2022.
- Contact the Energy Resources Advice and Promotion team for more information.
Data download
Australia’s Energy Commodity Resources Data Tables – 2020 Reporting Period