Black Coal
Page last updated:19 December 2023
Please note that this page is currently under review.
Resource figures are current as at 31 December 2016.
Coal is a sedimentary rock formed from peat that has been subjected to temperature, pressure and microbial action over millions of years. Over time, coal progresses in rank from lignite, to sub-bituminous coal, to bituminous coal and finally to anthracite; a process known as coalification. As the coal increases in rank, the carbon content - and hence the energy content - increases, whilst the moisture content decreases. In Australia, sub-bituminous, bituminous and anthracite are collectively referred to as black coal, whilst lignite is referred to as brown coal (in Europe, sub-bituminous coal is also considered to be brown coal).
The majority of the black coal mined in Australia belongs to the bituminous category, and is produced either in Queensland or New South Wales. Australian black coal is used predominately as (1) thermal coal, also called steaming coal, for electricity generation and (2) coking coal, also called metallurgical coal, in the iron and steel industries. Black coal is also used in cement manufacture, alumina refining, paper manufacture and for other industrial purposes.
JORC Reserves
As at December 2016, Proved and Probable Ore Reserves of black coal reported in compliance with the JORC Code amounted to 19 800 Mt (Table 1), of which 12 243 Mt was attributable to 93 operating mines (Table 2). Australia produced 566.3 Mt of black coal in 2016, 5% up from 2015 levels (539 Mt; Table 1). Conversely, during 2016, China reduced coal production and world prices consequently rose due to increased activity in the import market. Higher prices resulted in reduced demand and overall global coal production fell by 6.2% during 2016. According to BP plc, this is the largest decline on record1.
Table 1. Ore Reserves of recoverable black coal reported in compliance with the JORC Code, production and potential reserve life*, 2002-2016.
| Year | Proved and Probable Ore Reserve (Mt) | Production (Mt) | Reserve Life* (years) |
|---|---|---|---|
| 2016 | 19 800 | 566.3 | 35 |
| 2015 | 20 731 | 539 | 38 |
| 2014 | 19 816 | 565 | 35 |
| 2013 | 20 657 | 538 | 38 |
| 2012 | 20 662 | 489 | 42 |
| 2011 | 19 225 | 461 | 42 |
| 2010 | 17 238 | 449 | 38 |
| 2009 | 14 200 | 445 | 32 |
| 2008 | 13 400 | 425 | 32 |
| 2007 | 12 500 | 421 | 27 |
| 2006 | 12 100 | 404 | 30 |
| 2005 | 11 800 | 398 | 30 |
| 2004 | 13 100 | 375 | 35 |
| 2003 | 14 200 | 358 | 40 |
| 2002 | 17 400 | 348 | 50 |
*Reserve life is the ratio of Ore Reserves to production and represents a snapshot in time. It assumes that future production continues at the same rate and does not take into account future resource upgrades and successful exploration for new deposits.
Table 2. Ore Reserves and Mineral Resources of recoverable black coal (million tonnes) reported in compliance with the JORC Code at operating mines in 2016.
| No. of Operating Mines1 | Ore Reserves2 at Operating Mines | Measured and Indicated Resources3 at Operating Mines | Mine Production 20164 | Average Reserve Life (years) | Average Resource Life (years) |
|---|---|---|---|---|---|
| 93 | 12243 | 337745 | 566.36 | 22 | 60 |
- The number of operating mines counts individual mines that operated during 2016 and thus contributed to production. Some of these mines may belong to larger, multi-mine operations and some may have closed during or since 2016.
- The majority of Australian Ore Reserves and Mineral Resources are reported in compliance with the JORC Code, however there are a number of companies that report to foreign stock exchanges using other reporting codes, which are largely equivalent. In addition, Geoscience Australia may hold confidential information for some commodities. Ore Reserves are as at 31 December 2016.
- Mineral Resources are inclusive of the Ore Reserves. Mineral Resources are as at 31 December 2016.
- Source: Resources and Energy Quarterly, June 2017 published by the Office of the Chief Economist, Department of Industry, Innovation and Science unless otherwise stated.
- Measured and Indicated Resources for black coal are presented on a recoverable basis (these are Geoscience Australia estimates unless provided by the company).
- Mine production refers to raw coal.
Over the last 15 years, it can be seen in Figure 1 that Ore Reserves declined from 2002 to 2005 and then rapidly increased until 2012 from which point, they have been at similar levels each year. In 2016, Australia mined 566.3 Mt of black coal (Table 1), a small fraction of the Ore Reserves at currently operating mines (5%) and a smaller percentage of total Ore Reserves (3%). Indeed, Figure 1 shows that over the last 15 years of mining, cumulative production (6781 Mt) amounts to only 39% of the 2002 Ore Reserve (17 400 Mt), yet the Ore Reserve is greater today than it was then, indicating that the exploited coal has been replaced in the inventory and more added.
However, while Ore Reserves have risen over the last 15 years, production has increased at a faster rate (Figure 1). Ore Reserves of black coal have increased by 14% since 2002 but production has increased 63% from 348 Mt to 566 Mt, over the same time period. As a ratio, production has increased from 2% of the Ore Reserve in 2002 to 3% in 2016, but it has fallen from the high of 3.4% in 2007.
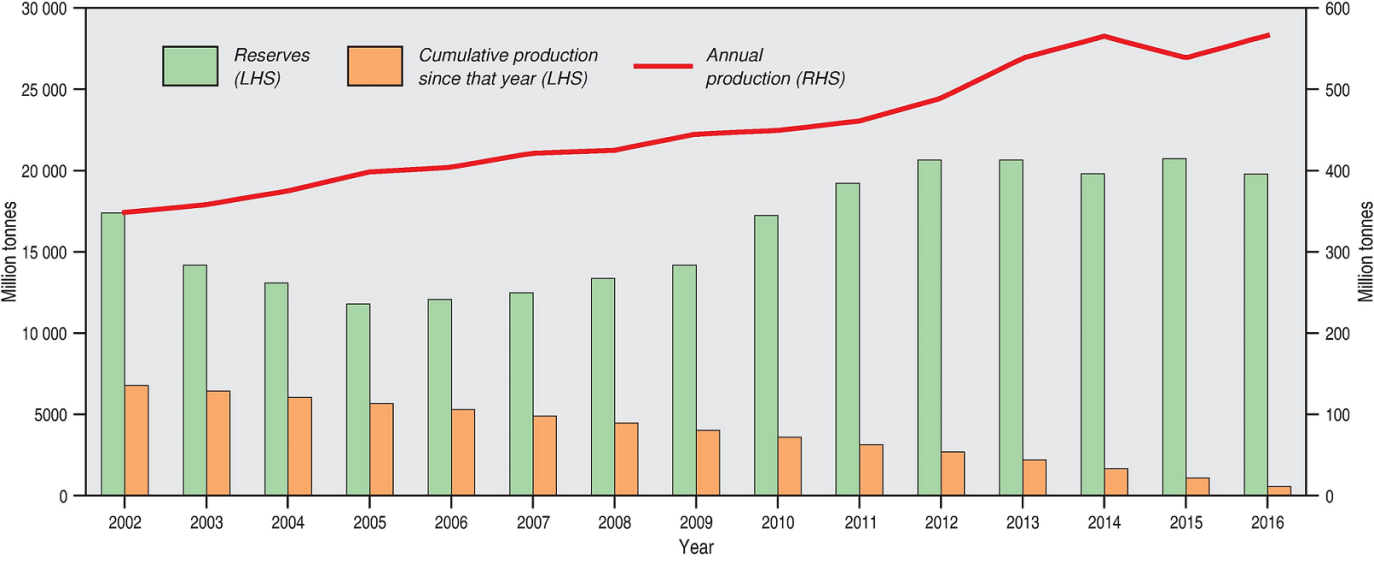
Figure 1. Black coal Ore Reserves and annual production 2002-2016, as well as cumulative production since each year. LHS/RHS = refer to axis on left-hand side/right-hand side.
Identified Resources
In 2016, the estimate of Australia's in situ Economic Demonstrated Resources (EDR) of black coal was revised upward to 85 753 Mt, an increase of almost 3% from the previous year (Table 3). Of this, 70 927 Mt is considered to be recoverable2, which is a 4% increase from 2015 (Table 4).
In 2016, EDR for black coal increased at 26 deposits and decreased at 39 deposits, with most decreases owing to small quantities of mine depletion. There were six increases and two decreases greater than 100 Mt, with resource upgrades resulting in a net increase in EDR of 2617 Mt of black coal. Large additions to EDR came from four deposits in the Sydney Basin: Dartbrook (Australian Pacific Coal Ltd), Mount Arthur (BHP Billiton Ltd), Mount Thorley (Rio Tinto Ltd) and Warkworth (Rio Tinto Ltd). In the Bowen Basin, a BHP Billiton Ltd/Mitsubishi Corporation joint venture reported large additions to EDR at Goonyella, Peak Downs, Peak Downs East and Saraji East. In the Galilee Basin, the Milray project (Glencore plc) also reported increased EDR.
In addition, Australia has 104 151 Mt of in situ Inferred Resources (Table 3) with 81 864 estimated to be recoverable (Table 4). In 2016, Inferred Resources of recoverable black coal increased by 3149 Mt or 4 per cent, with six increases and three decreases greater than 100 Mt. Large contributions to Inferred Resources from the Bowen Basin included Peak Downs and Peak Downs East and in the Surat Basin, the Columboola (Metro Mining Ltd) and Clifford (Stanmore Coal Ltd) projects reported large increases. In the Sydney Basin, Dartbrook (Australian Pacific Coal) and the United Wambo project (Glencore) also reported large increases in Inferred Resources. In 2016, the Hutton coking coal project (Valiant Resources Ltd) in the Bowen Basin reported a maiden in situ resource of 627.1 Mt of Indicated Resources and 4027.3 Mt Inferred Resources.
As at December 2016, Australia also had an estimated 4833 Mt of recoverable black coal considered subeconomic, along with 6882 Mt considered inaccessible (Table 4).
Table 3. Australia's identified in situ black coal resources (million tonnes) for selected years from 1975-2016.
| Year | Demonstrated Resources | Inferred Resources2 | ||
|---|---|---|---|---|
| Economic1 | Paramarginal | Submarginal | ||
| 2016 | 85 753 | 1370 | 4421 | 104 151 |
| 2015 | 83 324 | 1407 | 4277 | 101 145 |
| 2014 | 79 345 | 1395 | 4278 | 93 812 |
| 2013 | 79 074 | 1552 | 5341 | 93 773 |
| 2012 | 77 589 | 1613 | 5341 | 89 194 |
| 2011 | 71 146 | 1374 | 5345 | 79 013 |
| 2010 | 56 135 | 1549 | 5688 | 78 963 |
| 2009 | 60 700 | 3300 | 9200 | 125 200 |
| 2008 | 56 200 | 3000 | 10 300 | 106 000 |
| 2007 | 56 400 | 4100 | 9800 | 97 700 |
| 2006 | 57 300 | 3700 | 10 700 | 94 200 |
| 2005 | 55 800 | 5000 | 12 400 | 90 900 |
| 2000 | 62 600 | 1400 | 12 500 | very large |
| 1995 | 68 000 | 2000 | 6000 | very large |
| 1990 | 70 900 | 600 | 5700 | very large |
| 1985 | 54 000 | 3000 | 500 000 | |
| 1980 | 50 120 | very large | ||
| 1975 | 36 400 | 25 000 | 168 900 | |
- EDR includes Ore Reserves and most Measured and Indicated Mineral Resources reported in compliance with the JORC Code plus non-JORC equivalents.
- Total Inferred Resources in economic, subeconomic and undifferentiated categories.
Table 4. Australia's identified recoverable black coal resources and world figures (million tonnes) for selected years from 1975-2016.
| Year | Demonstrated Resources | Inferred Resources2 | Accessible EDR3 | Australian Mine Production4 | World Economic Resources5 | World Mine Production5 | ||
|---|---|---|---|---|---|---|---|---|
| Economic (EDR)1 | Paramarginal | Submarginal | ||||||
| 2016 | 70 927 | 1018 | 3815 | 81 864 | 64 045 | 566.3 | 712 000 | 7795 |
| 2015 | 68 310 | 1058 | 3818 | 78 715 | 61 428 | 539 | 699 000 | 6901 |
| 2014 | 62 623 | 1260 | 3849 | 67 905 | 55 741 | 565 | 690 530 | 7212 |
| 2013 | 62 095 | 1225 | 4017 | 64 041 | 55 213 | 538 | 690 530 | 6926 |
| 2012 | 61 082 | 1134 | 3984 | 64 184 | 54 200 | 489 | 665 000 | 6637 |
| 2011 | 57 538 | 822 | 3986 | 57 305 | 50 656 | 461 | 665 000 | 6185 |
| 2010 | 41 848 | 970 | 4184 | 58 046 | 41 749 | 449 | 675 000 | 6185 |
| 2009 | 43 800 | 1800 | 5900 | 78 200 | 43 700 | 445 | 669 000 | 5800 |
| 2008 | 39 200 | 1500 | 6700 | 66 700 | 39 100 | 425 | 681 000 | 5700 |
| 2007 | 38 900 | 2200 | 6700 | 61 600 | 38 800 | 421 | 687 000 | 5500 |
| 2006 | 39 600 | 2000 | 7200 | 58 900 | 39 500 | 404 | 734 000 | 5100 |
| 2005 | 39 200 | 2700 | 8200 | 57 000 | 39 100 | 398 | 739 000 | 4500 |
| 2000 | 42 600 | 1000 | 8300 | very large | 301 | 770 000 | 3500 | |
| 1995 | 49 000 | 2000 | 4000 | 240 | ||||
| 1990 | 51 100 | 400 | 3500 | 200 | 650 000 | 3200 | ||
| 1985 | 34 000 | 1000 | 300 000 | 158 | 631 000 | 2930 | ||
| 1980 | 28 570 | very large | 272 000 | 93 | 492 000 | 2816 | ||
| 1975 | 19 500 | 61 | 532 000 | 2258 | ||||
- EDR includes Ore Reserves and most Measured and Indicated Mineral Resources reported in compliance with the JORC Code.
- Total Inferred Resources in economic, subeconomic and undifferentiated categories.
- Accessible Economic Demonstrated Resources (AEDR) is the portion of total EDR that is accessible for mining. AEDR does not include resources that are inaccessible for mining because of environmental restrictions, government policies or military lands.
- Source: Office of the Chief Economist (Resources and Energy Quarterly).
- Source: United States Geological Survey (Mineral Commodity Summaries).
Figure 2, also demonstrates the vast inventory of black coal in Australia by showing that even over the longer time period of 40 years, cumulative production (11 631 Mt) has only mined out 60% of the 19 500 Mt of resources assessed as economic in 1975. But as with Figure 1 showing Ore Reserves, Figure 3 also shows that black coal production has increased more rapidly than the inventory. In 1975, black coal production was 61 Mt which rose to 566 Mt in 2016, an increase of more than 800% but recoverable black coal EDR has increased only 264% over the same 40-year period (19 500 Mt in 1975 to 70 927 Mt in 2016). As a ratio, annual production of black coal as a percentage of EDR has increased from 0.3% in 1975 to 0.8% in 2016.
While the increase in production has been more or less regular, the coal inventory has ebbed and flowed (Figure 2, Figure 3). Between 1998 and 2007, EDR for black coal declined due to the impact of increased rates of mine production and mining companies re-estimating Ore Reserves and Mineral Resources more conservatively to comply with requirements of the JORC Code. From 2008 onwards, black coal EDR increased significantly because of the discovery and delineation of additional resources as a result of high levels of exploration and through reclassification of resources.
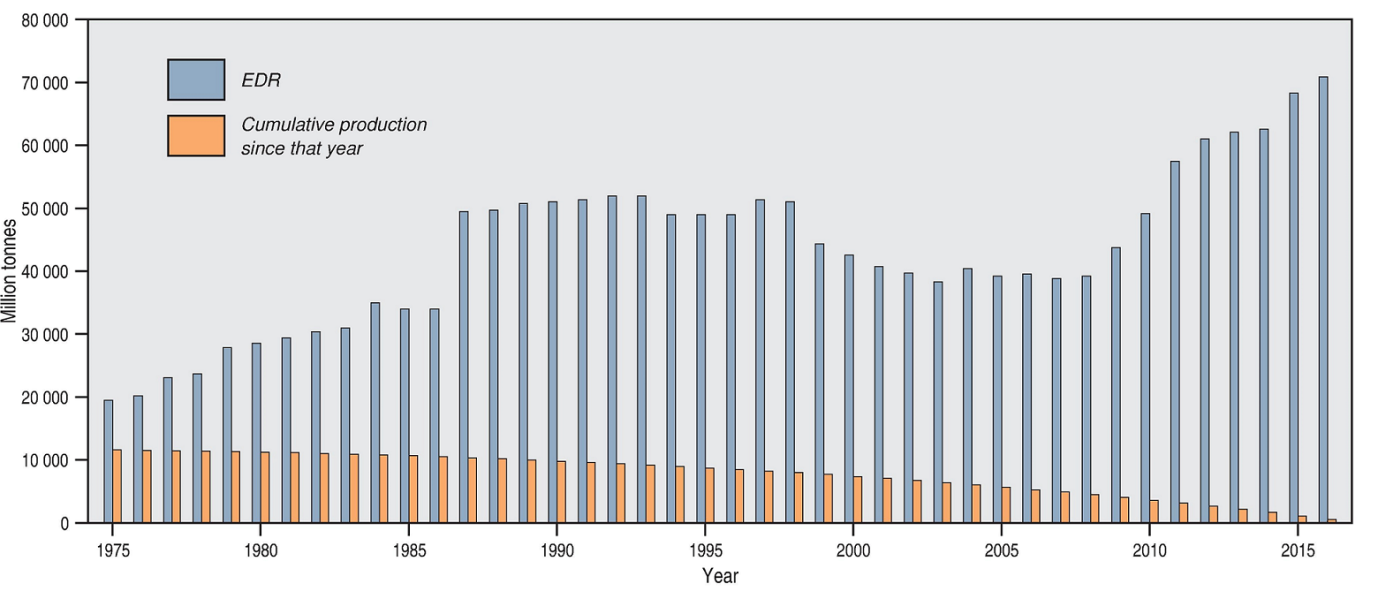
Figure 2. Economic Demonstrated Resources of black coal 1975-2016, as well as cumulative production since each year.
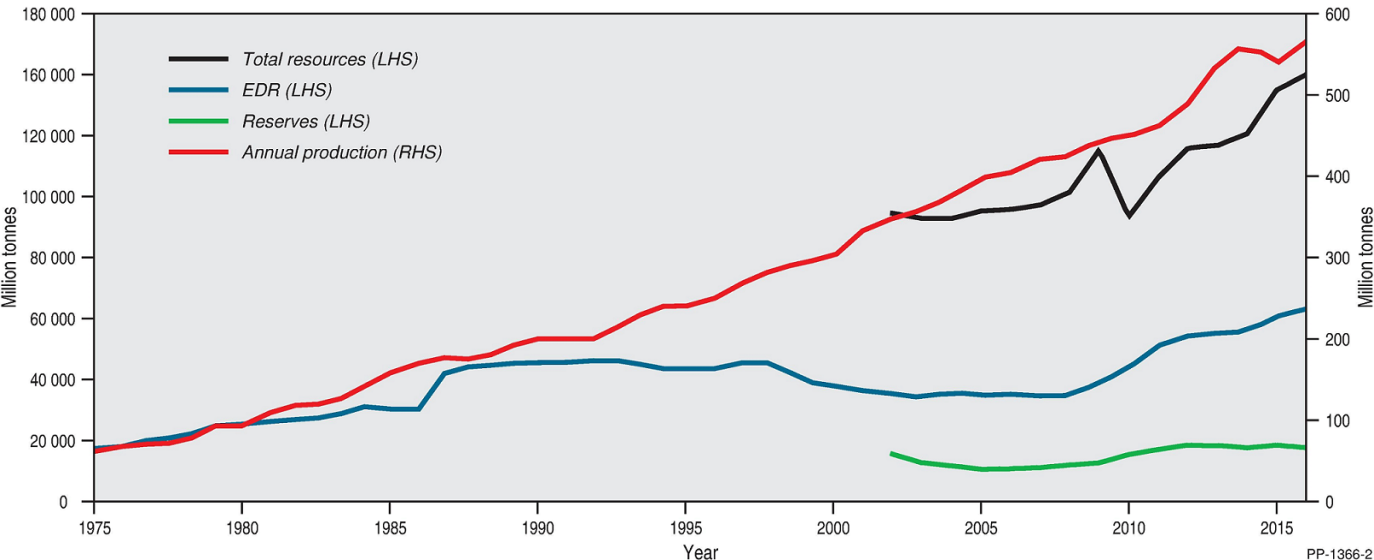
Figure 3. Trends in total resources, Economic Demonstrated Resources, Ore Reserves and annual production of black coal, 1975-2016. LHS/RHS = refer to axis on left-hand side/right-hand side.
Most of Australia's black coal EDR is located in Queensland (61%) and New South Wales (36%). Of this, 34% and 29% of recoverable EDR are located in the Bowen (Queensland) and Sydney (New South Wales) basins, respectively. These basins also dominate black coal production. Significant black coal resources are also found in the Surat (12%), Galilee (9%) and Tarong (3%) basins in Queensland and in the Gunnedah Basin (3%) in New South Wales.
Price and Demand
Australia is the largest exporter of coal in the world with 389.3 Mt exported during 20163.
Major importers of Australian metallurgical coal are India, Japan and China. Major importers of Australian thermal coal are Japan, China, South Korea and Taiwan4. World coal trade is expected to continue to increase until 2040 and Australia has significant resources of high quality black coal. The proximity of Asian markets, where demand is expected to grow, is expected to contribute to market share maintenance5.
Prices improved in 2016 compared to 2015: the Premium Hard Coking Coal contract price started at US$81/t and finished at US$200/t with spot prices reaching a peak of over US$300/t in November due to production restrictions in China and a resulting increase in demand. Pulverised Coal Injection (PCI) is used widely in steel-making; the finely ground coal acts as an energy source and a reductant in order to reduce the amount of coke required during the steel-production process. During 2016, the Low Volatile PCI contract price was US$69/t at the start of the year, increasing to US$156/t at the end. The spot price reached a peak of more than US$180/t in November. Semi-soft coking coal is also used in steel-making; it is blended with more-expensive hard coking coals to reduce costs. During 2016, the Semi-Soft Coking Coal contract price started at US$66/t, increasing to US$130/t at the end of the year with spot prices reaching more than US$140/t in November. The average Newcastle 6300 GAR6 Thermal Coal Contract price was US$61.60/t, with spot prices reaching over US$100/t in November7.
Historic price spikes, in 2008 and 2011, were related to flooding in Queensland and the ensuing supply restrictions.
Exploration
Exploration expenditure in Australia has been falling and is linked to the falling coal price. Coal exploration expenditure reached a high of $757 million in 2011. Expenditure in 2015 and 2016 was $213 million and $124 million, respectively, indicating a further year-on-year decline of 58%. In this period, as in previous periods, expenditure on coal exploration occurred almost exclusively in Queensland (67.1%) and New South Wales (28.8%). The decline in Australian expenditure on coal exploration is correlated with the fall in coal price, demonstrating some of the impact the low coal price has had on industry activity. The Energy in Australia 2015 publication suggests that lower exploration expenditure may also be related to a shift from investment to production in the mining boom8.
Production and Trade
The two largest producing black coal basins, by far, are the Bowen and Sydney basins. At 2016 production levels, Australia's current recoverable EDR of black coal is expected to last 125 years.
Australia is a major coal producer ranking behind China, United States and India in overall coal production. In 2016, the majority of coal was produced in Queensland (55%) and New South Wales (43%), leaving 2% to other Australian jurisdictions. In both 2015 and 2016, 78% of coal production came from open-cut mines, and 22% from underground mines9. In 2016, Australia produced 440 Mt of saleable black coal (or 567 Mt of raw coal) and, in 2015, produced 446 Mt of saleable black coal (or 567 Mt of raw coal)10.
World-wide, most coal is used for electricity generation: since 1990, Australian thermal coal production has grown from 94 Mt to 250 Mt in 201611, this is an increase of more than 250%. Recently, world thermal coal production has fallen from 6000 Mt in 2014 to 5800 Mt in 2015, and 5400 Mt in 2016.
World coking coal production fell in 2015 (and fell again in 2016) for the first time since 2002. Conversely, Mongolian coking coal production increased by 9.7 Mt to 22.8 Mt in 2016 due to increased demand from China12. China, followed by Australia, is the worlds' largest producer of coking coal. Consumption of coal for PCI is increasing, with Japan and Korea the largest reported consumers. However China (and other economies) does not report PCI steel-making statistics and it is estimated that China uses more PCI than Japan and Korea together13. Australian coking coal production has grown from 65 Mt in 1990 to 189 Mt in 201614; this is an increase of nearly 300%.
Almost all metallurgical coal is used in coke ovens: around 770 kg of coal is used to produce 1 t of steel when a basic oxygen furnace is used15. In addition to coking coal, Australia exports some metallurgical coke: although the amounts are confidential, the Office of the Chief Economist estimates that Australia exported 684 kt of coke during 2014-1516. During 2015, world coke-oven coke consumption was 678.8 Mt17, of which China accounts for 65%.
Overall, Australian coal production has increased, notwithstanding the declines seen in 2011 and 2016, to keep pace with different economic booms in Asian regions18. During 2016, total world coal trade was 1333.5 Mt19 and Australian exports of 389 Mt contributed 29% to world trade.
Domestic Coal Consumption
Coal fired generation accounted for 63% of Australia's electricity generation in 201620. Although coal use grew by 3% in 2015-16, due to increased use of coal for electricity generation, Australian coal consumption remains 17% lower than at its peak in 2008-0921.
Industry consumes the largest amount of the electricity (34% of total consumption) of any sector, noticeably during aluminium production. Commercial (31%) and residential (26%) users comprise the remaining major sectors22.
In 2016, New South Wales, Victoria and Queensland accounted for 92% of total coal-fired generation nationally23. All three states have a high reliance on coal for electricity generation, whereas the rest of Australia has a relatively higher reliance on natural gas and renewable energy24. In Victoria, lower-rank brown coal is used for energy generation. New South Wales and Queensland host the majority of Australia's black coal-fired generating capacity25.
Table 5. Operating black coal-fired power stations during 2016.
| Station | State | Year of commissioning | Announced decommissioning | Age (years) | Capacity (MW) |
|---|---|---|---|---|---|
| Eraring | NSW | 1982-84 | 32-34 | 2880 | |
| Bayswater | NSW | 1982-84 | 2035 | 32-34 | 2640 |
| Liddell | NSW | 1971-73 | 2022 | 43-45 | 2000 |
| Mt Piper | NSW | 1993 | 23 | 1400 | |
| Vales Point B | NSW | 1978 | 38 | 1320 | |
| Gladstone | QLD | 1976-82 | 34-40 | 1680 | |
| Tarong | QLD | 1984-86 | 30-32 | 1400 | |
| Stanwell | QLD | 1993-96 | 20-23 | 1460 | |
| Callide C | QLD | 2001 | 15 | 810 | |
| Millmerran | QLD | 2002 | 14 | 851 | |
| Kogan Creek | QLD | 2007 | 9 | 750 | |
| Callide B | QLD | 1989 | 27 | 700 | |
| Tarong North | QLD | 2002 | 14 | 443 | |
| Yabulu (Coal) | QLD | 1974 | 42 | 37.5 | |
| Gladstone QAL | QLD | 1973 | 43 | 25 | |
| Muju | WA | 1981, 1986 | 30-35 | 1070 | |
| Collie | WA | 1999 | 17 | 340 | |
| Bluewaters 1 | WA | 2009 | 7 | 208 | |
| Bluewaters 2 | WA | 2010 | 6 | 208 | |
| Worsley (Alumina) | WA | 1982-00 | 16-34 | 135 | |
| Total Number | Average Age | Total Capacity | |||
| 20 | 26 years | 20 357.5 MW |
Source: Australian Energy Council 2016.
World Ranking
In 2016, Australia was ranked number one in the world for coal exports, was the fourth biggest producer after China, the USA and India, and was ranked fourth in terms of recoverable economic coal resources behind the USA, China and India. China is the largest consumer, producer and importer of coal. India is the second largest consumer, producer and importer of coal. As at December 2016, Australia had 152 791 Mt of identified recoverable black coal resources including inferred resources.
Nearly 90% of Australian black coal is exported to overseas consumers. In 2016, Australia ranked fourth overall for coal production, behind China, the United States and India. Australia was the sixth largest thermal coal producer, the second largest coking coal producer (after China) and the largest coking coal exporter.
During 2016, Australia produced 440 Mt of black coal, 389 Mt of which was exported for energy production or coke manufacture. The remaining 51 Mt was used domestically.
The value of Australian coal exports during 2015-16 was $34.5 billion; this was 22% of total resource and energy exports26.
World Economic Resources
World economic resource data is affected by the different categorisation of sub-bituminous coal, which is classed as black coal in Australia but as brown coal in Europe. In addition, the term "reserves" in Australia specifically refers to a commercially demonstrated orebody reported in compliance with the JORC Code. In overseas jurisdictions, the term "reserves" is often used more generally and can usually be regarded as equivalent to Australian EDR.
In order for a comparison of world economic resources to be made, BP coal figures were used for Australia. BP estimates the world to have total proved reserves of coal27 amounting to 1 139 000 Mt. According to the BP Statistical Review of World Energy 2017, as at 31 December 2016, Australia had 13% of the world's total proved coal reserves, and ranked fourth in terms of total recoverable economic coal reserves (black and brown coals together) behind the United States, the Russian Federation and China.
Industry Developments
Overall, during 2015, the coal industry experienced hardship as the coal price continued to decline. A range of coal companies, including large coal businesses, reported financial losses; considered or announced close-downs, cut-backs and sales of mining properties; and generally reported challenges with the prevailing conditions. Conditions improved during the latter half of 2016 partly due to supply restrictions and the International Energy Agency suggested that, although producers may experience reduced urgency to cut costs, supply discipline and price volatility will continue28.
During the course of 2015, three mines in New South Wales closed or were placed on care and maintenance. These included the Integra coal operation owned by Vale S.A., and the Russell Vale and Wongawilli mines operated by Wollongong Coal Ltd. These mine closures reflect the continuing decline in coal price from the peak that occurred in February 2011. Since this time, the Integra underground mine was sold to Glencore Plc (the open-cut to Bloomfield Collieries Pty Ltd), re-opened and production of coking coal has commenced. During 2016, Wongawilli prepared for operational readiness and eventually re-opened in late 2017.
During 2016, more New South Wales mines closed or were placed on care and maintenance. They were Donaldson (owned by Yancoal Australia Ltd) and West Wallsend Colliery (owned by Glencore). Although Donaldson was placed on care and maintenance, Yancoal has reportedly commenced new feasibility studies in order to consider underground mining options. Although mine closure work has commenced at West Wallsend Colliery, the most recent resource estimate includes an additional coal seam. Tenement renewal applications have been submitted, suggesting the possibility of future works. In 2016, Glencore announced the planned shutdown of The Tahmoor Complex (a hard coking coal producer); since this time the mine has been purchased by the GFC Alliance consortium. GFC Alliance has also recently purchased Whyalla Steelworks (South Australia) and intends, by keeping the Tahmoor Complex open, to implement a vertically integrated business model whereby coking coal from the Tahmoor Complex will be used for steel production at Whyalla.
The Maules Creek thermal coal mine, located in the Gunnedah Basin, and owned by Whitehaven Coal Ltd and ITOCHU Corp, commenced mining in August 2014 and railing in January 2015. During 2015, approximately 2.6 Mt of saleable coal was produced. During 2016, Whitehaven ordered mining equipment to support planned production increases and produced 7.3 Mt during 2016 and 8.9 Mt during 2017, with further increases planned. The Vickery Coal Project, also owned by Whitehaven, and also located in the Gunnedah Basin, received development approval from the New South Wales Government. Initial production is expected to be approximately 4.5 million tonnes per annum (Mtpa), and is unlikely to commence until the Maules Creek project has reached its run-of-mine production target of 13 Mtpa.
In March 2015, the Moolarben thermal coal project, located in the Sydney Basin, and 80% owned by Yancoal, received approval for its Stage Two expansions, which include two new underground mines, an open-cut mine and additional infrastructure. Construction work continued throughout 2016 and the new Moolarben underground infrastructure became operational in late 2017.
During 2016, the Spur Hill Underground Coking Coal Project owned by Malabar Coal Ltd, and located in the Upper Hunter Valley region, continued to build from 2015 studies in relation to an Environmental Impact Statement (EIS), as well as the review and design of mine surface infrastructure, and a proposed layout for the underground mine. During 2016, a long-term access agreement with landowners was completed.
The Mount Owen Continued Operations Project, owned by Glencore and located in the Hunter Valley, was approved in 2016, allowing mining to continue until 2031. Also in 2016, the Mount Owen north-pit drilling program was completed, confirming an additional reserve. The Mount Owen Continued Operations Modification 2 resubmission seeks to increase the life of mine by six years (to 2037) and increase the volume of coal mined by approximately35 Mt run of mine (ROM) over the entire life of mine.
The Ulan Complex, owned by Glencore, produces thermal coal and is located in the Western Coalfield of the Sydney Basin. During 2016, the New South Wales Department of Planning and Environment approved a modification application to expand underground mining operations and thereby extend the life of mine by two years (until 2033).
The United-Wambo Open Cut Coal Mine Project is a joint venture between Glencore and Peabody Energy Corporation. The project is located in the Hunter Valley and a Preliminary Environmental Assessment was submitted to the New South Wales Department of Planning and Environment in 2015. The EIS was lodged with the New South Wales Department of Planning and Environment in 2016. The EIS was on display during 2016 and the project has submitted responses to the Planning and Assessment Commission for review. The project consists of two parts: (1) a new open-cut mine and (2) the continued operations, with an extension, of the approved Wambo open-cut. This project will allow for the continued employment of the existing Wambo workforce in addition to creating an extra 250 jobs during peak production.
As far as Geoscience Australia is aware, there have been no mine closures in Queensland during 2015 or 2016 with the exception of Crinium, where longwall mining was completed. Crinium is part of the Gregory Crinium Complex which is owned and operated by BHP Billiton and Mitsubishi Corp. Gregory, the open-cut mine, closed in 2012.
Valiant Resources Ltd reported a significant maiden resource in the southern Bowen Basin: the Hutton Coking Coal Project is located adjacent to prospective coal tenements Wandoan (Glencore Plc) and Ridgelands (BHP Ltd) and has the potential to produce 49-55 Mtpa of predominately semi-hard coking and semi-soft coking coals.
The Carmichael Coal Mine and Rail Project, owned by Adani Mining Pty Ltd, consists of a very large thermal coal mine situated in the Galilee Basin and a proposed 189-km railway that would link to a proposed coal terminal at the Abbot Point Port near Bowen. During 2014 and 2015, the Carmichael project experienced a number of developments:
- On 3 April 2016, Adani received approval for the Carmichael coal mine leases, from the Queensland Government. Adani indicated that it would not proceed with mine development until final legal challenges to the project were resolved.
- In December 2016, the federal and state governments gave approval for a rail project associated with the project.
- In June 2017 Adani reached a final investment decision.
- As of March 2018, Adani continues to work on finalising contracts and financing strategies with a target to achieve coal production in the 2021 fiscal year.
The China Stone Coal Project situated 300 km west of Mackay in the Galilee Basin, and owned by MacMines Austasia Pty Ltd, is still undergoing environmental approvals. The project is a large open-cut and underground thermal coal mine of 260 Mt Indicated and 3200 Mt Inferred Resources, and could provide up to 3400 jobs in operation.
Clifford is an exploration project owned by Stanmore Coal and located in the Surat Basin. During 2016, the project completed a drilling program, reported an updated JORC resource and commenced a mining and infrastructure concept study.
In December 2015, Stanmore Coal Ltd completed its exploration program for the Belview Coking Coal Project in the Bowen Basin. The study indicates the project is capable of producing high quality coking coal.
The U&D Mining Ltd project known as Meteor Downs South was granted a mining lease in November 2015. The project is located 60 km southeast of Emerald in the Bowen Basin. It has a relatively small tonnage, but plans to produce up to 1.5 Mtpa of export quality thermal coal. The projected start-up date is 2018.
The Teresa Coal Project, located in the Bowen Basin near Emerald, and formerly owned by Linc Energy Ltd, was sold to United Mining Group Ltd. The project will consist of an underground PCI coal mine, producing up to 8 Mtpa ROM coal for export. The anticipated mine life is up to 30 years of production, and operations would employ 440 staff.
Citation
Bibliographical reference: Hughes, A., 2018. Australian Resource Reviews: Black Coal 2017. Geoscience Australia, Canberra. http://dx.doi.org/10.11636/9781925297980
References
1. BP Statistical Review of World Energy, June 2017.
2. Recovery is the percentage of material of interest that is extracted during mining. Geoscience Australia has applied recovery factors to coal Mineral Resource estimates in order to improve understanding of Australia's resource potential. Unless otherwise stated by the company, deposits mined with open-cut methods are assumed to have a recovery factor of 90% and underground methods are assumed to have recovery factors of 50-75%. A coal Ore Reserve is reported at a higher level of confidence than a Mineral Resource and includes diluting materials, and allowances for losses that may occur during mining. Geoscience Australia does not apply recovery factors to Coal Reserves.
3. International Energy Agency, 2017. Coal Information: Overview 2017. International Energy Agency, Paris.
4. Office of the Chief Economist, 2016, Energy in Australia 2015, Australian Government, Canberra, Australia.
5 International Energy Agency, 2018. Energy Policies of IEA Countries Australia 2018 Review. International Energy Agency, Paris.
6 GAR (Gross As Received) describes calorific value, under laboratory conditions, and includes total moisture.
7 AME Research, https://aus.amegroup.com/, accessed 27 February 2018.
8 Office of the Chief Economist, 2016, Energy in Australia 2015, Australian Government, Canberra, Australia, p21.
9 Office of the Chief Economist, 2016, Energy in Australia 2015, Australian Government, Canberra, Australia.
10 ibid.
11 International Energy Agency, 2018. Energy Policies of IEA Countries Australia 2018 Review. International Energy Agency, Paris.
12 ibid.
13 ibid.
14 ibid.
15 World Coal Association 2018, https://www.worldcoal.org/coal/uses-coal/how-steel-produced accessed March 2018.
16 Office of the Chief Economist, 2016, Australian Energy Update Table N: Australian Energy Exports, by fuel type, physical units, Australian Government, Canberra, Australia.
17 International Energy Agency, 2018. Energy Policies of IEA Countries Australia 2018 Review. International Energy Agency, Paris.
18 ibid.
19 International Energy Agency, 2017. Coal Information: Overview 2017. International Energy Agency, Paris.
20 Office of the Chief Economist 2017, Resources and Energy Quarterly December 2017, Historical Data, Australian Government, Canberra, Australia.
21 ibid.
22 International Energy Agency, 2018. Energy Policies of IEA Countries Australia 2018 Review. International Energy Agency, Paris.
23 Office of the Chief Economist 2017, Resources and Energy Quarterly December 2017, Historical Data, Australian Government, Canberra, Australia.
24 ibid.
25 ibid.
26 ibid.
27 BP defines total proved reserves of coal as "Generally taken to be those quantities that geological and engineering information indicates with reasonable certainty can be recovered in the future from known reservoirs under existing economic and operating conditions. The data series for total proved coal reserves does not necessarily meet the definitions, guidelines and practices used for determining proved reserves at company level..." BP Statistical Review of World Energy 2017, p36.
28 International Energy Agency 2017, Market Report Series Coal 2017, International Energy Agency, Paris. https://www.iea.org/coal2017/ accessed 8th March 2018.