Gold
Page last updated:19 December 2023
Please note that this page is currently under review.
Resource figures are current as at 31 December 2018.
The principal uses for gold (Au) are as an investment instrument for governments, central banks and private investors, and as jewellery, which together account for most of its annual usage. The main industrial use for gold is in the electronics industry, taking advantage of its high conductivity and corrosion-resistant properties. Small amounts of gold are present in most modern electronic devices. Gold is also used in dentistry as gold alloys are strong, resistant to tarnishing and easy to work.
According to the World Gold Council, trade in physical gold during 2018 amounted to 4397 tonnes (t). This is almost 1100 t more than world mine production for the year (3298 t) as estimated by the United States Geological Survey (USGS). World Gold Council data shows jewellery consumed 2241 t, bullion and coins 1085 t and technology applications 335 t. Gold purchased by central banks went up 73% in 2018 amounting to 656 t of gold.
JORC Ore Reserves
Proved and Probable Ore Reserves of gold published in compliance with the Joint Ore Reserves Committee (JORC) Code increased by 149 t in 2018 to 4018 t (Table 1) and comprised 39% of Economic Demonstrated Resources1.
Gold deposits can be grouped into different geological or metal-association types with differing contributions to reserves, resources and production (Table 2). In Australia, the two most important are lode-gold deposits and copper-gold deposits, of which the latter includes iron oxide-copper-gold and porphyry deposits.
Copper-gold deposits are the most significant contributors to the nation's gold inventory, accounting for 59% of reserves and 65% resources at operating mines. In contrast, lode-gold deposits account for the majority of production (69%) whilst only accounting for 37% of reserves and 32% of gold resources at operating mines. Thus, at 2018 rates of production, the average mine life of Australia's lode-gold deposits appears considerably shorter than for other deposit types (Table 2).
Other gold-deposit types include polymetallic, epithermal and VHMS. Together, these account for 4% and 3% of Australian gold reserves and resources, respectively, at operating mines.
Table 1. Australia's Ore Reserves of gold, production and potential reserve life, 2002-2018.
| Year | P&P Ore Reserve1 (t Au) | Production2 (t Au) | Reserve Life3 (years) |
|---|---|---|---|
| 2018 | 4018 | 315 | 13 |
| 2017 | 3869 | 294 | 13 |
| 2016 | 3826 | 288 | 13 |
| 2015 | 3552 | 278 | 13 |
| 2014 | 3550 | 274 | 13 |
| 2013 | 3911 | 265 | 15 |
| 2012 | 4119 | 251 | 16 |
| 2011 | 4131 | 258 | 16 |
| 2010 | 4070 | 260 | 16 |
| 2009 | 3548 | 223 | 16 |
| 2008 | 3409 | 215 | 16 |
| 2007 | 3284 | 245 | 13 |
| 2006 | 3329 | 246 | 14 |
| 2005 | 3343 | 263 | 13 |
| 2004 | 3330 | 259 | 13 |
| 2003 | 3432 | 282 | 12 |
| 2002 | 3574 | 266 | 13 |
P&P = Proved and Probable; t Au = tonnes of contained gold.
- The majority of Australian Ore Reserves and Mineral Resources are reported in compliance with the JORC Code, however there are a number of companies that report to foreign stock exchanges using other reporting codes, which are largely equivalent. In addition, Geoscience Australia may hold confidential information for some commodities.
- Source: Office of the Chief Economist, Department of Industry, Innovation and Science, Resources and Energy Quarterly (September 2018). Production data often have a higher level of certainty than resource estimates and so may be presented with more significant figures.
- Reserve life is calculated by dividing the Ore Reserve by production. The resulting ratio is a snapshot in time that can only be used for general impressions because it is an average and it assumes (1) that production rates in the future will remain the same as those used in the calculation, (2) deposits deemed economic/uneconomic remain so in the future and (3) that depleted reserves are never replaced.
Table 2. Ore Reserves, Mineral Resources, reserve and resource life at Australian operating mines in 2018.
| Category | No. of Operating Mines1 | Ore Reserves2 (t Au) | Measured and Indicated Resources3 (t Au) | Mine Production 20184 (t Au) | Reserve Life (years)5 | Resource Life (years)6 |
|---|---|---|---|---|---|---|
| Lode Gold | 109 | 1058 | 2132 | 217 | 5 | 10 |
| Copper-Gold | 12 | 1703 | 4369 | 77 | 22 | 57 |
| Other | 20 | 111 | 188 | 21 | 5 | 9 |
| All | 141 | 2872 | 6689 | 315 | 9 | 21 |
t Au = tonnes of contained gold.
- The number of operating mines counts individual mines that operated during 2018 and thus contributed to production. Some of these mines may belong to larger, multi-mine operations and some may have closed during or since 2018.
- The majority of Australian Ore Reserves and Mineral Resources are reported in compliance with the JORC Code, however there are a number of companies that report to foreign stock exchanges using other reporting codes, which are largely equivalent. In addition, Geoscience Australia may hold confidential information for some commodities. NB: Not all operating mines report Ore Reserves. Ore Reserves are as at 31 December 2018.
- Measured and Indicated Mineral Resources are inclusive of the Ore Reserves. NB: Not all operating mines report Mineral Resources. Mineral Resources are as at 31 December 2018.
- Source: Office of the Chief Economist, Department of Industry, Innovation and Science, Resources and Energy Quarterly (September 2018). Production data often have a higher level of certainty than resource estimates and so may be presented with more significant figures.
- Reserve Life = Ore Reserves ÷ Production.
- Resource Life = Measured + Indicated Resources ÷ Production.
Identified Resources
Australia's gold resources occur in all states and the Northern Territory (Figure 1). As of December 2018, total resources of gold compliant with the JORC Code increased 847 t to 15 791 t, an increase of 5.6% on the previous year (14 944 t). Resource increases were reported in Western Australia (767 t), Queensland (12 t), South Australia (37 t), Northern Territory (33 t), and Victoria (3 t). Falls in resources were reported in New South Wales (‑5 t) and Tasmania (‑2 t).
In 2018, Australia's EDR of gold increased 95 t to 10 165 t (Table 3), up by 0.9% from 2017 (10 070 t). The top three states with the highest EDR are Western Australia 4499 t (44%) followed by South Australia 2568 t (25%) and New South Wales 1650 t (16%). Collectively, these three states hold slightly less than 86% of the national EDR. Most jurisdictions had an increase in EDR with the exception of Tasmania (down 1.5 t) and New South Wales (down 192 t).
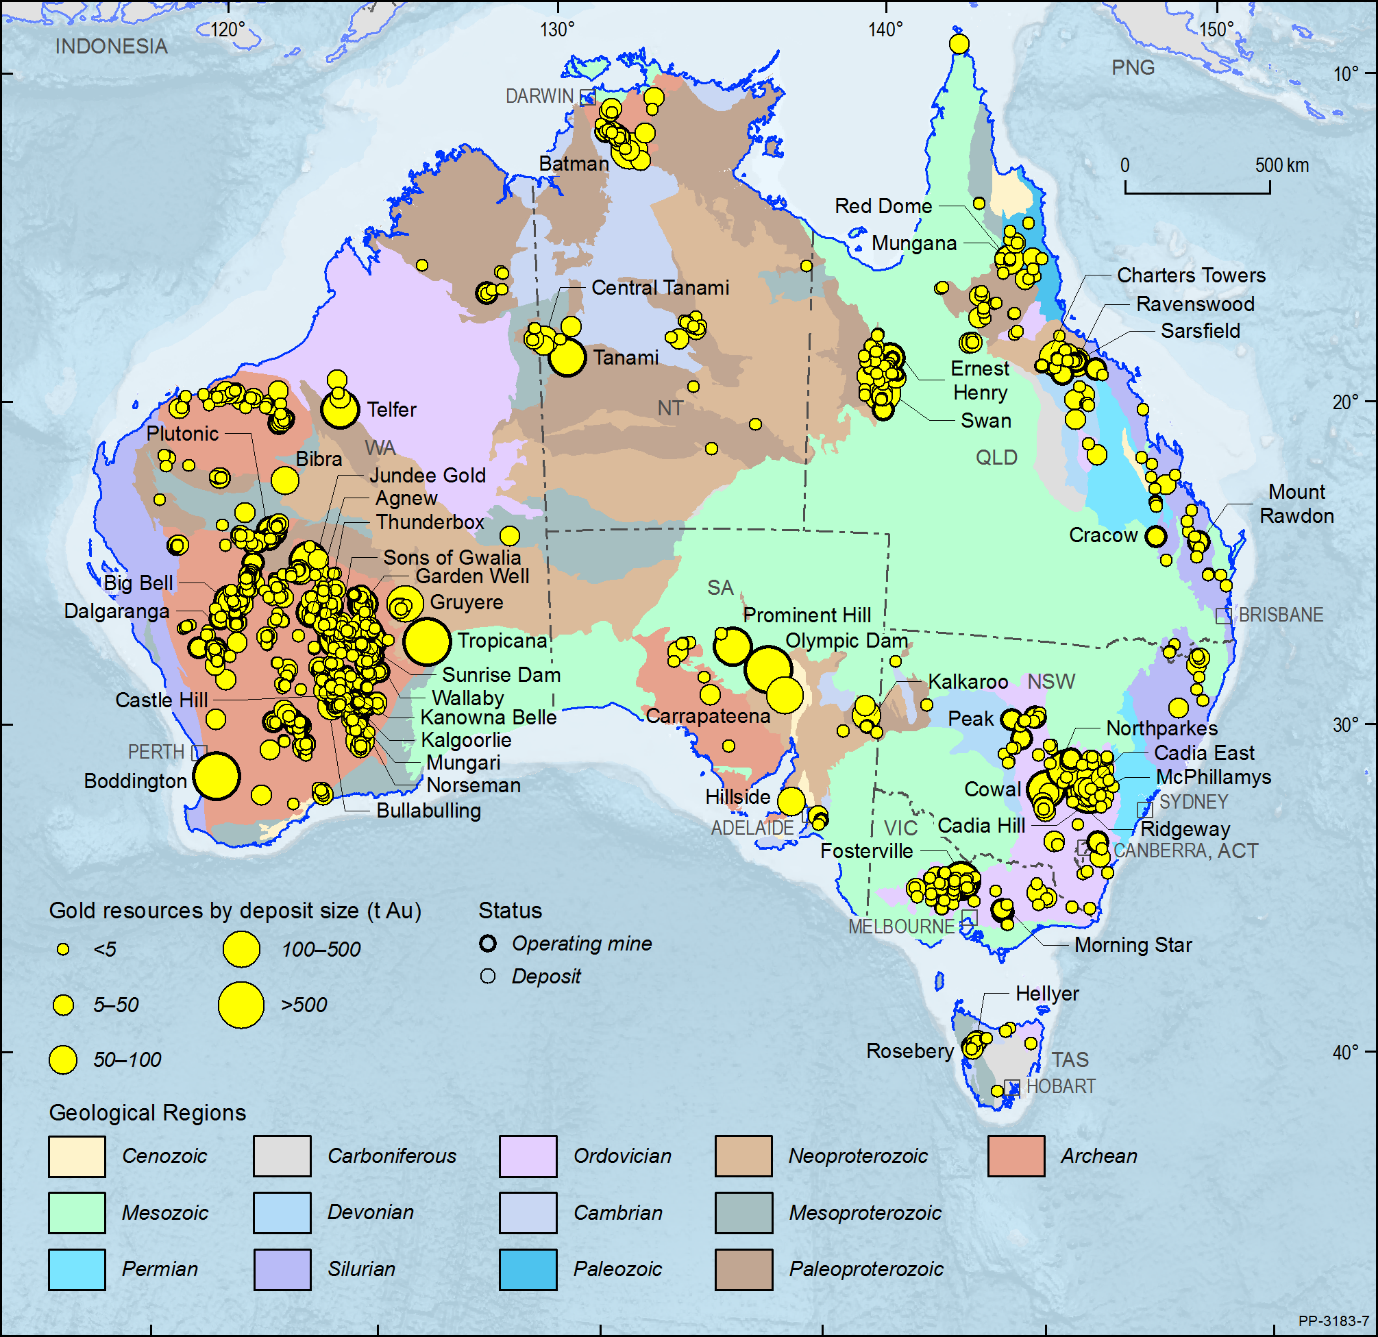
Figure 1. Australian gold deposits and operating mines 2018.
t Au = tonnes of contained gold. Deposit size is based on total resources (EDR + Subeconomic Resources + Inferred). For clarity, only major or significant deposits are labelled.
Paramarginal Resources of gold declined by 28 t to 157 t in 2018. Submarginal Resources increased by 138 t in 2018 to 200 t (Table 3). Gold in Paramarginal and Submarginal Resources has declined by about 1000 t since 2009 as more resources are being converted to JORC 2012 compliant resources.
Inferred Mineral Resources of gold in Australia increased by 625 t, or 13%, to total 5252 t. The largest rise in this resource category was seen in Western Australia (up by 631 t) and the largest fall was recorded in South Australia (down by 46 t) with lesser rises and falls across the other states. Western Australia's Inferred Mineral Resources remain the largest of any state or territory at 2620 t followed by South Australia with 1206 t and Queensland with 710 t.
Table 3. Australia's identified gold (t Au) resources and world figures for selected years, 1975-2018.
| Year | Demonstrated Resources | Inferred Resources3 | Accessible EDR4 | Australian Mine Production5 | World Economic Resources6 | World Mine Production6 | ||
|---|---|---|---|---|---|---|---|---|
| Economic (EDR)1 | Subeconomic2 | |||||||
| Paramarginal | Submarginal | |||||||
| 2018 | 10 165 | 157 | 200 | 5268 | 10 135 | 315 | 54 000 | 3260 |
| 2017 | 10 070 | 185 | 62 | 4627 | 10 040 | 294 | 54 400 | 3298 |
| 2016 | 9830 | 213 | 67 | 4389 | 9800 | 288 | 57 000 | 3255 |
| 2015 | 9546 | 227 | 75 | 4632 | 9516 | 278 | 57 000 | 3186 |
| 2014 | 9112 | 244 | 95 | 4562 | 9082 | 274 | 55 000 | 3314 |
| 2013 | 9808 | 317 | 110 | 4520 | 9778 | 265 | 54 000 | 3022 |
| 2012 | 9909 | 372 | 122 | 4571 | 9879 | 251 | 54 300 | 2660 |
| 2011 | 9153 | 487 | 135 | 4513 | 9112 | 258 | 52 740 | 2700 |
| 2010 | 8410 | 930 | 120 | 4450 | 8380 | 260 | 51 800 | 2510 |
| 2009 | 7399 | 1495 | 120 | 4431 | 7270 | 223 | 47 000 | 2350 |
| 2008 | 6255 | 1478 | 123 | 4596 | 6130 | 215 | 48 655 | 2407 |
| 2007 | 5839 | 1272 | 138 | 4336 | 5780 | 245 | 42 000 | 2476 |
| 2006 | 5480 | 1265 | 128 | 4499 | 5420 | 246 | 42 480 | 2500 |
| 2005 | 5225 | 1315 | 118 | 4403 | 5173 | 263 | 42 225 | 2457 |
| 2004 | 5589 | 1102 | 107 | 4058 | 5570 | 259 | 42 000 | 2489 |
| 2003 | 5382 | 1437 | 107 | 2933 | 5370 | 282 | 43 000 | 2619 |
| 2002 | 5415 | 1157 | 112 | 2823 | 5403 | 266 | 42 500 | 2530 |
| 2001 | 5156 | 1061 | 112 | 3146 | 280 | 50 156 | 2530 | |
| 2000 | 4959 | 1021 | 117 | 2717 | 296 | 48 959 | 2445 | |
| 1995 | 4263 | 1100 | 48 | 1378 | 253 | 44 000 | 2200 | |
| 1990 | 2129 | 588 | 126 | 1311 | 243 | 42 400 | 2010 | |
| 1985 | 959 | 119 | 122 | 1146 | 59 | 74 640 | 1556 | |
| 1980 | 332 | 73 | 14 | 16 | 17 | 31 415 | 1188 | |
| 1975 | 156 | 50 | 16 | 40 400 | 940 | |||
t Au = tonnes of contained gold.
- Economic Demonstrated Resources (EDR) predominantly comprise Ore Reserves and most Measured and Indicated Mineral Resources that have been reported in compliance with the Joint Ore Reserves Committee (JORC) Code to the Australian Securities Exchange (ASX). In addition, some reserves and resources may have been reported to foreign stock exchanges using other reporting codes, which are largely equivalent to the JORC Code. Geoscience Australia may also hold some confidential data.
- Subeconomic Demonstrated Resources are geologically demonstrated but do not meet the criteria for economic at the time of determination. Subeconomic resources classed as Paramarginal require a modest improvement in the commodity price/cost ratio to render them economic. Subeconomic resources classed as Submarginal require a substantially improved commodity price/cost ratio to render them economic.
- Total Inferred Resources in economic, subeconomic and undifferentiated categories.
- Accessible Economic Demonstrated Resources (AEDR) is the portion of total EDR that is accessible for mining. AEDR does not include resources that are inaccessible for mining because of environmental restrictions, government policies or military lands.
- Source: Office of the Chief Economist, Department of Industry, Innovation and Science, Resources and Energy Quarterly (September 2018). Production data often have a higher level of certainty than resource estimates and so may be presented with more significant figures.
- Source: United States Geological Survey (Mineral Commodity Summaries).
Accessible EDR
Australia's EDR for gold is essentially unencumbered with around 30 t, or less than 0.3%, currently unavailable for exploitation. Accessible EDR in 2018 was 10 135 t (Table 3). Deposits that contain gold resources that are unavailable for mining include Jabiluka, Koongarra and Coronation Hill, all of which are located in the Northern Territory.
Production and Reserve Life
Gold is mined in all states and the Northern Territory in Australia (Figure 1). Domestic mine production increased by 21 t in 2018 to 315 t (Table 4). By state, Western Australia maintained the highest output of gold at 211 t (Table 4). New South Wales retained second position at 39 t and Queensland had the third highest production at 18 t (Table 4). As a percentage, Western Australia's share of production was 67% followed by New South Wales with 12% and Queensland with 6%.
The Perth Mint in Western Australia is the sole refiner of gold in Australia. The mint acquires raw material from domestic mine production, recycled materials and from sources overseas. Total refined gold for 2018 amounted to 344 t.
As noted, gold deposits can be grouped into a number of geological or metal-association types with differing contributions to production and resources. In 2018, lode-gold deposits yielded 216 t or 69% of Australian mine production, more than double the next largest producing type—copper-gold deposits (Table 2). Copper-gold deposits include porphyries and iron oxide-copper-gold deposits (e.g., Olympic Dam). Gold output in 2018 from these deposits amounted to 77 t or 24% of national production (Table 2). Production for the year from polymetallic and other deposits, including epithermal and antimony-gold deposits, totalled 22 t (Table 2).
Reserve/resource life is a snapshot in time derived by taking a reserve or resource number and dividing it by a production number. Resource life for Australian gold dramatically increased, briefly, during the early 1980s as the introduction of new gold extraction technologies stimulated exploration (Figure 2). Resource life then declined rapidly as gold production surged 800% from 27 t in 1982 to 243 t in 1990 (Figure 2). Since 1990, resource life for gold has generally trended upward (Figure 2) as new resource delineation has outpaced increases in production. It is only since 2012 that gold resource life has decreased owing to favourable exchange rates stimulating increased production alongside slower increases in new resource delineation (Figure 2).
Table 4. Gold production by jurisdiction, 2009-2018.
| Jurisdiction | Production (t Au) | |||||||||
|---|---|---|---|---|---|---|---|---|---|---|
| 2009 | 2010 | 2011 | 2012 | 2013 | 2014 | 2015 | 2016 | 2017 | 2018 | |
| New South Wales | 25 | 30 | 30 | 26 | 32 | 34 | 35 | 40 | 34 | 39 |
| Northern Territory | 10 | 10 | 9 | 10 | 12 | 13 | 16 | 17 | 17 | 15 |
| Queensland | 16 | 15 | 16 | 15 | 17 | 16 | 18 | 19 | 20 | 18 |
| South Australia | 8 | 13 | 14 | 12 | 13 | 13 | 12 | 10 | 8 | 8 |
| Tasmania | 4 | 4 | 4 | 3 | 2 | 2 | 2 | 1 | 1 | 1 |
| Victoria | 8 | 7 | 5 | 4 | 6 | 7 | 7 | 8 | 11 | 13 |
| Western Australia | 152 | 181 | 180 | 180 | 183 | 189 | 188 | 193 | 203 | 211 |
| Australia (total) | 223 | 260 | 258 | 251 | 265 | 274 | 278 | 288 | 294 | 315 |
t Au = tonnes of contained gold. Production is rounded to the nearest tonne.
Source: Office of the Chief Economist2.
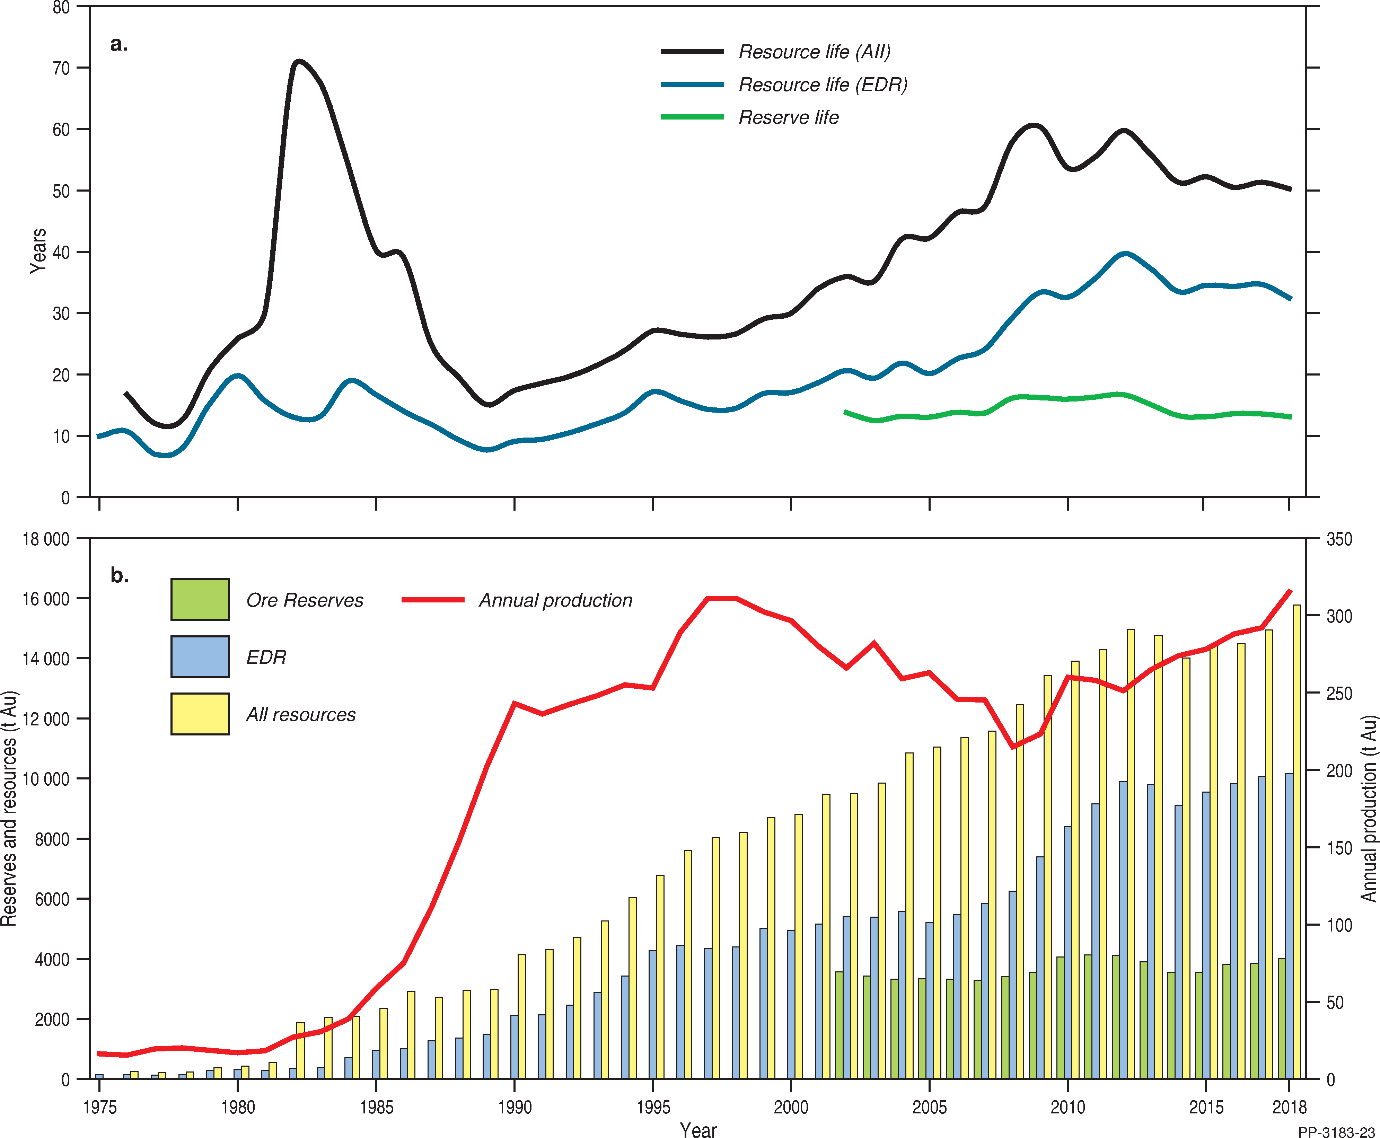
Figure 2. Trends in gold reserve and resource life. These ratios are derived from (b) gold Ore Reserves, Economic Demonstrated Resources (EDR), all resources (EDR + Subeconomic Demonstrated Resources + Inferred Resources) and annual production, 1975-2018. Au = tonnes of contained gold. Prior to 2002, Ore Reserves were not recorded.
Gold Price
The monthly average gold price commenced the 2018 calendar year at US$1332/oz in January and concluded in December at US$1248/oz (Figure 3). The average price over the year was US$1269/oz, which is US$12/oz higher than in 2017. The highest monthly average price was recorded in April at US$1335/oz. Due to prevailing exchange rates, the price of gold in Australian dollars fluctuated between a high of $1760/oz (April 2018) and a low of $1655/oz (August 2018; Figure 3). Overall, the average price of gold in Australian dollars for 2018 was $1697/oz, which was $56/oz higher than in 2017.
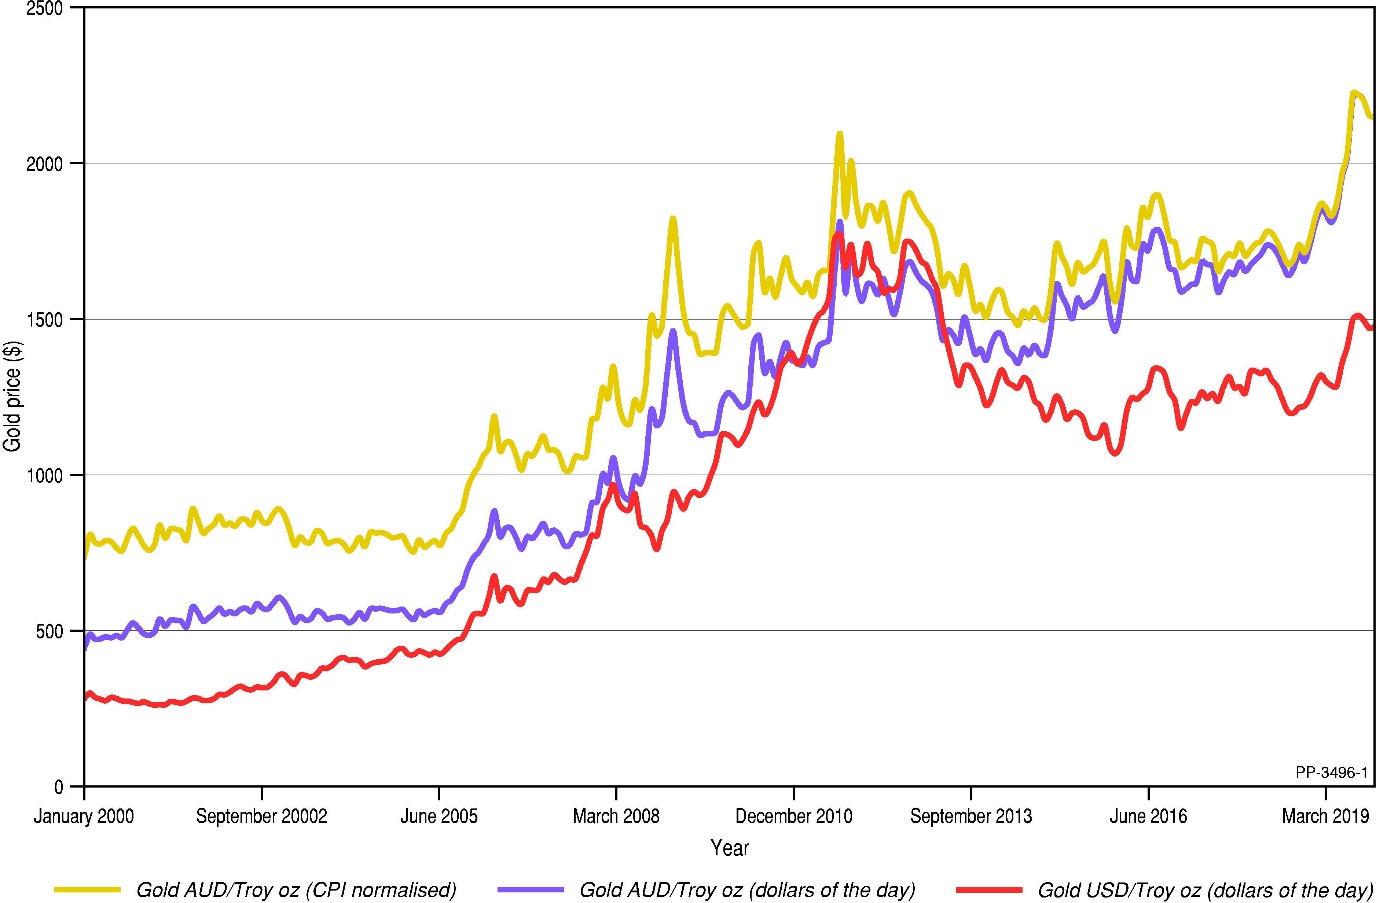
Figure 3. Variations in the quarterly average prices of gold (per Troy ounce) in Australian Dollars (AUD), US dollars (USD) and Australian dollars normalised to CPI based on the World Gold Council gold price4 and Australian Bureau of Statistics CPI data5.
Exploration
Total mineral exploration drilling expenditure, as reported by the Australian Bureau of Statistics, increased by 24.5% to $2183.6 million in 20183. Exploration drilling expenditure on gold reached an all-time high in 2018, increasing by 19.0% on the previous year to $892.1 million. This is higher than the previous peak of $740.9 million in 2012. Gold had the highest exploration expenditure of all commodities for 2018, ahead of iron ore ($300.9 million) and copper ($260.8 million), reflecting the strong price of gold in Australian dollars.
World Ranking
Based on estimates published by the USGS6 and adjusted for Australia by Geoscience Australia, world economic resources of gold in 2018 were 54 000 t. Australia, with an EDR of 10 165 t, or slightly less than 19% of world resources (Table 5), has the largest share ahead South Africa with 6000 t (11%), Russia with 5300 t (10%) and the United States of America with 3000 t (6%). According to the USGS, the world produced 3260 t of gold from mining in 20187. Australia's mine production of 315 t accounts for 10% of world production and was second to that of China (400 t), but ahead of Russia (295 t) and the United States of America (210 t; Table 6).
Table 5. World economic resources of gold 2018.
| Rank | Country | Economic Resources1 (t Au) | Percentage of world total2 |
|---|---|---|---|
| 1 | Australia | 10 165 | 19% |
| 2 | South Africa | 6000 | 11% |
| 3 | Russia | 5300 | 10% |
| 4 | USA | 3000 | 6% |
| 5 | Peru | 2600 | 5% |
| 6 | Indonesia | 2500 | 5% |
| 7 | Brazil | 2400 | 4% |
| 8 | Canada | 2000 | 4% |
| 9 | China | 2000 | 4% |
| 10 | Uzbekistan | 1800 | 3% |
| Others | 16 700 | 31% | |
| Total | 54 000 |
t Au = tonnes of contained gold.
- Source: USGS 8 and Geoscience Australia. National figures other than Australia are rounded.
- Percentages are also rounded and might not add up to 100% exactly.
Table 6. World production of gold 2018.
| Rank | Country | Production1 (t Au) | Percentage of world total2 |
|---|---|---|---|
| 1 | China | 400 | 12% |
| 2 | Australia | 315 | 10% |
| 3 | Russia | 295 | 9% |
| 4 | USA | 210 | 6% |
| 5 | Canada | 185 | 6% |
| 6 | Peru | 145 | 4% |
| 7 | Ghana | 130 | 4% |
| 8 | Mexico | 125 | 4% |
| 9 | South Africa | 120 | 4% |
| 10 | Uzbekistan | 105 | 3% |
| Others | 1236 | 38% | |
| Total | 3260 |
t Au = tonnes of contained gold.
Industry Developments
The following selected announcements provide a snapshot of industry activities in 2018. With the exception of Saint Arnaud, which is located in Victoria, these industry developments are located in Western Australia.
Sandstone: Alto Metals Ltd reported the completion of a maiden JORC 2012 Inferred Mineral Resource estimate of 2.58 million tonnes (Mt) at 1.49 g/t Au for 124 000 ounces (oz) for the Indomitable and Vanguard Camp deposits at Sandstone Gold Project11.
Katanning: Ausgold Ltd announced an expanded and upgraded JORC (2012) Mineral Resource estimate for the Company's 100%-owned Katanning Gold Project. The new Resource is 25.1 Mt at 1.29 g/t Au for 1 040 000 oz of gold. This is a 32% increase in total contained ounces and a 10% increase in grade, from the previous 2017 resource estimate12.
Burbanks: Barra Resources Ltd announced a maiden Indicated and Inferred Mineral Resource of 29 900 oz at 2.59 g/t Au, reported in compliance with the 2012 JORC Code, for the historical Main Lode underground mineat its solely-owned Burbanks Gold Project, 9 km south of Coolgardie in Western Australia13. The historic Main Lode Mine is located just 800 m north of the company's Birthday Gift underground mine. Both underground mines and several open pits are currently in care and maintenance. Barra aims to grow its Mineral Resources at its Coolgardie gold projects to a critical mass of 500 000 oz ahead of a restart in mining operations. The company reports that its Mineral Resource estimates are only a very small proportion of the strike and depth potential of the Burbanks high-grade gold system14.
Hermes South and Plutonic: Superior Gold Inc announced a high-grade gold discovery of 9 m at 9.3 g/t Au from 136.2 m at Hermes South, located 20 km south of its Hermes satellite development in Western Australia15. Superior also announced an increase in underground Ore Reserves at the Plutonic mine of 276 000 oz of gold, grading at 5.97 g/t Au, tripling the previous estimate16.
Mount Morgans: Dacian Gold Ltd announced the first pour of gold from the Mount Morgans mine in April 201817. In December 2018, the company announced an updated JORC (2012) compliant Ore Reserve of 26.7 Mt at an average grade of 1.6 g/t Au and Mineral Resources, inclusive of Reserves, of 54.67 Mt at an average grade of 2.0 g/t Au18.
Nullagine: Millennium Minerals Ltd increased its production guidance in 2018 for the Nullagine operation in Western Australia from 75 000 oz to 80 000 oz of gold, with all in sustaining costs of $1280-$1350/oz19. The majority of the production is to come from the Golden Eagle mining centre. In early 2019, Millennium announced a 70% increase in Ore Reserves at Nullagine to 375 300 oz after a successful exploration and growth program. The updated Ore Reserve includes a maiden estimate for Golden Gate Underground of 220.6 kt at 3.8 g/t Au for 27 100 oz of contained gold, underpinned by recent strong metallurgical test work results on arsenopyrite-dominant sulphide ore20.
Rothsay: Egan Street Resources Ltd announced a high-grade resource of 1.42 Mt grading at 8.8 g/t Au for 401 000 oz of gold for the Rothsay project, located 310 km northeast of Perth in Western Australia21.
South Yamarna: Gold Road Resources Ltd announced high-grade exploration results for Wanderrie Camp and Smoke Bush Camp within the South Yamarna project. Results include 2 m at 17.45 g/t Au from 80.0 m at Wanderrie Camp and 5 m at 1.95 g/t Au from 98.75 m, including 5.41 m at 4.22 g/t Au at Smoke Bush Camp22.
Hall Creek: Pantoro Ltd reported an initial Ore Reserve at the Wagtail and Rowdies deposits at the Hall Creek project near the Nicolsons processing plant in northern Western Australia. The Reserve totals 62 500 oz at an average grade of 5.4 g/t Au, and Indicated and Inferred Resource figures of 574 000 t at 6.8 g/t Au for 126 000 oz of gold23.
Mount Remarkable: King River Copper Ltd announced exploration results for Mount Remarkable in the Kimberley region of Western Australia that included hits of up to 300 g/t Au. Visible fine gold was observed in the drill chips at Trudi Vein prospect. Best results were 4 m @ 113.29 g/t Au including 1 m at 346 g/t Au; and 3 m at 34.8 g/t Au including 1 m at 50.5 g/t Au24.
Dalgaranga: Gascoyne Resources Ltd announced, in May 2018, the first pour of 9.55 kg of gold at the Dalgaranga operation in Western Australia25. This followed the construction and commissioning of the 2.5 Mt per annum processing facility in early May 2018. By the end of June 2018, a total of 245 000 t of low-grade material had been treated and 4093 oz of gold recovered26.
Saint Arnaud: Navarre Minerals Ltd reported on drilling results from the Saint Arnaud gold project in Victoria, located 130 km east of Fosterville. Navarre completed a 6512 m, 80-hole AC drill program in June 2018 with results including 4 m at 6.6 g/t from 48 m 27 . Drilling confirmed mineralisation extends north under shallow cover on the Nelson Trend, host to the historic high-grade 300 000 oz Lord Nelson mine. Navarre believes the St Arnaud Gold Project exhibits several similarities to the world-class Fosterville Project28.
Widgiemooltha: Mincor Resources NL announced in July 2019 the first pour of gold from their Widgiemooltha gold project in the Norseman region of Western Australia29. The gold was processed at the Higginsville processing plant.
Duketon: Regis Resources Ltd announced its plan to develop the Rosemount underground mine beneath the current open pit at the Duketon operation in Western Australia as part of an expansion of the existing operations30. Development started in the September 2018 with construction of a portal in the southern end of the open pit. The combined open-pit and underground mine will deliver 10.3 Mt of ore at 1.72 g/t Au for 570 000 oz of gold, including 214 000 oz from underground, over an initial five-year mine life31.
Bellevue: Bellevue Gold Ltd announced a high-grade maiden resource for the Bellevue Gold project of 1.9 Mt at 8.2 g/t Au for 500 000 oz of gold, using a 3.5 g/t cut-off32.
Citation
Bibliographical reference: Senior, A., 2020. Australian Resource Reviews: Gold 2019. Geoscience Australia, Canberra.
References
1 Economic Demonstrated Resources (EDR) is the category with the highest economic feasibility and geological assurance in the National Classification System for Identified Mineral Resources. It predominantly comprises Proved and Probable Ore Reserves and most Measured and Indicated Mineral Resources that have been reported in compliance with the JORC Code. In addition, EDR may contain some reserves and resources that have been reported using other reporting codes and include confidential data.
2 Office of the Chief Economist, Department of Industry, Innovation and Science, Resources and Energy Quarterly, September 2018.
3 Australian Bureau of Statistics, Mineral and Petroleum Exploration Australia, Mineral Exploration. 8412.0, March 2019 Tables 2, 4 and 6.
4 World Gold Council, https://www.gold.org/goldhub/data/price-and-performance
5 Australian Bureau of Statistics, Consumer Price Index, CPI: All groups, Index Numbers and Percentage Changes, cat. no. 6401.0, September 2019 Tables 1 and 2.
6 United States Geological Survey. Mineral Commodity Summaries 2019.
7 United States Geological Survey. Mineral Commodity Summaries 2019.
8 United States Geological Survey. Mineral Commodity Summaries 2019.
9 United States Geological Survey. Mineral Commodity Summaries 2019.
10 See Footnote 2.
11 Alto Metals Ltd. ASX announcement 25 September 2018.
12 Ausgold Ltd. ASX announcement 26 November 2018.
13 Barra Resources Ltd. ASX announcement 30 October 2018.
14 ibid.
15 Superior Gold Inc. TSXV announcement 7 May 2019.
16 ibid.
17 Dacian Gold ASX. Announcement 3 April 2018.
18 Dacian Gold Ltd. ASX announcement 18 December 2018.
19 Millennium Minerals Ltd. ASX announcement 4 February 2019.
20 ibid.
21 Egan Street Resources Ltd ASX announcement 19 July 2018.
22 Gold Road Resources Ltd. ASX announcement 7 May 2018.
23 Pantoro Ltd. ASX announcement 5 March 2018.
24 King River Copper Ltd. ASX announcement 4 June 2018.
25 Gascoyne Resources Ltd. ASX announcement 30 May 2018.
26 Gascoyne Resources Ltd. Quarterly Report June 2018.
27 Navarre Minerals Ltd. ASX announcement 1 Jun 2018.
28 ibid.
29 Mincor Resources NL. ASX announcement 25 July 2018.
30 Regis Resources Ltd ASX announcement 3 August 2018.
31 ibid.
32 Bellevue Gold Ltd. ASX announcement 1 August 2018.