Manganese Ore
Page last updated:19 December 2023
Please note that this page is currently under review.
Resource figures are current as at 31 December 2019.
Manganese (Mn) is the twelfth most abundant element in the Earth's crust. Amongst some 300 minerals containing manganese, only about a dozen are of economic significance. The two main manganese minerals are pyrolusite (MnO2) and rhodochrosite (MnCO3).
Manganese is the fourth-most used metal in terms of tonnage after iron, aluminium and copper and 90% of all manganese consumed annually goes into steel as an alloying agent. No satisfactory substitute for manganese has been identified which combines a relatively low price with outstanding technical benefits such as the ability to combine with sulphur and a powerful de-oxidation capacity.
After steel, the second most important market for manganese is in the form of electrolytic manganese dioxide and electrolytic manganese metal, both of which are used in the production of rechargeable electric vehicle (EV) batteries in association with lithium, cobalt and nickel. The growth in production of EVs and battery storage technology is stimulating the interest of existing manganese miners in project expansion, and of explorers in re-evaluating historical mine deposits and prospects for potential development.
Manganese is also an important alloying element with aluminium and copper, being used in plant fertilisers and animal feeds and as a colorant in glass and ceramics.
The use of manganese in many essential modern technologies has resulted in it being designated a critical mineral by a number of countries including Australia1, the United States of America2, Canada3 and Japan4. Critical minerals are those minerals (or elements) considered vital for the well-being of the world's economies, yet whose supply may be at risk of disruption.
JORC Ore Reserves
Ore Reserves of manganese were 91 million tonnes (Mt) in 2019, slightly down from 92 Mt the previous year (Table 1). Ore Reserves have been reported for the Woodie Woodie project in Western Australia and the Groote Eylandt and Bootu Creek projects in the Northern Territory.
The majority of Australian Ore Reserves and Mineral Resources are reported by industry in accordance with the Joint Ore Reserve Committee (JORC) Code5 to the Australian Securities Exchange. Where other reporting codes are used by companies listed elsewhere, these are also incorporated into the national inventory when they are largely equivalent.
Reserve life is calculated by dividing an Ore Reserve by that year's production. It can only be used for general impressions (see Table 2 footnotes for details) but is, nonetheless, a snapshot of potential future mineral supply that can be useful when considered cautiously.
Table 1. Australia's Ore Reserves1 of manganese, production and potential reserve life, 2002–2019.
| Year | Ore Reserves (Mt) | Production (Mt)2 | Reserve Life (years) |
|---|---|---|---|
| 2019 | 91 | 7.5 | 12 |
| 2018 | 92 | 7.0 | 13 |
| 2017 | 102 | 5.6 | 18 |
| 2016 | 110.2 | 3.2 | 33 |
| 2015 | 120.4 | 7.5 | 15 |
| 2014 | 121 | 7.67 | 16 |
| 2013 | 131.5 | 7.45 | 18 |
| 2012 | 135.4 | 7.21 | 37 |
| 2011 | 143 | 6.96 | 20 |
| 2010 | 144 | 6.5 | 21 |
| 2009 | 146 | 4.45 | 33 |
| 2008 | 152 | 4.8 | 32 |
| 2007 | 148 | 5.29 | 28 |
| 2006 | 112 | 4.6 | 23 |
| 2005 | 120 | 3.9 | 31 |
| 2004 | 95 | 3.4 | 28 |
| 2003 | 89 | 2.55 | 35 |
| 2002 | 85.7 | 2.2 | 39 |
Mt = million tonnes of ore. Reserve Life = Ore Reserves ÷ Production.
- The majority of Australian Ore Reserves and Mineral Resources are reported in compliance with the JORC Code, however there may be companies that report to foreign stock exchanges using other reporting codes, which are largely equivalent. In addition, Geoscience Australia may hold confidential information for some commodities.
- Australian manganese production from company reports and total reported production from Department of Mines, Industry Regulation and Safety, Western Australian Government, 2018–19 Major commodities resource file.
- All of Australia's Ore Reserves of manganese ore in 2019 were attributable to Australia's three operating mines (Woodie Woodie, Groote Eylandt and Bootu Creek). Ore Reserves amounted to 91 Mt and beneficiated manganese ore production was 7.5 Mt (Table 2). Using the 2019 Ore Reserve and rate of production, the average reserve life for operating manganese mines in Australia is 12 years (Table 2) but the resource life of these three operating mines using demonstrated resources (Measured and Indicated categories) averages out to 26 years, increasing to 30 years if the Inferred category is also included (Table 2).
Table 2. Ore Reserves and Mineral Resources of manganese ore reported in compliance with the JORC Code at operating mines in 2019.
| No. of Operating Mines1 | Ore Reserves2 (Mt) | Measured and Indicated Resources3 (Mt) | Inferred Resources4 (Mt) | Mine Production5 (Mt) | Reserve Life6 (years) | Resource Life 17 (years) | Resource Life 28 (years) |
|---|---|---|---|---|---|---|---|
| 3 | 91 | 196 | 27 | 7.5 | 12 | 26 | 30 |
Mt = million tonnes of ore.
- The number of operating mines are those that operated for some period during 2019. Some of these mines may belong to larger, multi-mine operations and some may have closed during or since 2019.
- The majority of Australian Ore Reserves and Mineral Resources are reported in compliance with the JORC Code, however there are a number of companies that report to foreign stock exchanges using other reporting codes, which are largely equivalent. In addition, Geoscience Australia may hold confidential information for some commodities. Ore Reserves are as at 31 December 2019.
- Measured and Indicated Mineral Resources are inclusive of the Ore Reserves. NB: Not all operating mines report Mineral Resources. Mineral Resources are as at 31 December 2019.
- Inferred Mineral Resources are as at 31 December 2019.
- Production from company reports and total reported production from Department of Mines, Industry Regulation and Safety, Western Australian Government, 2018–2019 Major commodities resources file.
- Reserve Life* = Ore Reserves ÷ Production.
- Resource Life 1* = (Measured + Indicated Resources) ÷ Production.
- Resource Life 2* = (Measured + Indicated + Inferred Resources) ÷ Production.
*Reserve and resource life for each mineral commodity is calculated by dividing the inventory by production. The resulting ratio is a snapshot in time that can only be used for general impressions because it is an average and it assumes (1) that production rates in the future will remain the same as those used in the calculation, (2) deposits deemed economic/uneconomic remain so in the future and (3) that depleted resources are never replaced.
A longer-term perspective on potential supply can be gained by using Economic Demonstrated Resources (EDR; Table 3) of manganese ore at all deposits, not just operating mines. Using the EDR for all deposits indicates that Australia could have approximately 35 years of manganese ore at 2019 rates of production.
Identified Resources
Australia's EDR of manganese ore have increased by 50% over the last decade from 181 Mt in 2009, to 272 Mt in 2019 (Table 3). Approximately 34% of EDR is comprised of Ore Reserves with the remainder drawn from Measured and Indicated Mineral Resource estimations. Projects that recorded an increase of EDR in 2019 were Butcherbird and Bootu Creek, whereas Groote Eylandt recorded a 6% decrease.
Table 3. Australia's identified resources of manganese ore and world figures for selected years from 1975–2019.
| Year | Demonstrated Resources (Mt) | Inferred Resources2 (Mt) | Accessible EDR3 (Mt) | Australian Mine Production4 (Mt) | World Economic Resources5 (Mt) | World Mine Production6 (Mt) | ||
|---|---|---|---|---|---|---|---|---|
| Economic (EDR)1 | Paramarginal | Submarginal | ||||||
| 2019 | 272 | 3 | 190 | 396 | 272 | 7.5 | 826 | 19 |
| 2018 | 232 | 3 | 190 | 354 | 232 | 7 | 760 | 18 |
| 2017 | 231 | 2.8 | 190.2 | 359.9 | 231 | 5.6 | 682 | 16 |
| 2016 | 219 | 2.8 | 190.2 | 379.7 | 219 | 3.2 | 1,790 | 44 |
| 2015 | 232.9 | 23.1 | 167 | 379.7 | 232.9 | 7.5 | 1,667 | 52 |
| 2014 | 226.9 | 23.1 | 167 | 311.9 | 226.9 | 7.67 | 1,520 | 51 |
| 2013 | 228.6 | 23.1 | 167 | 313.2 | 228.6 | 7.45 | 1,520 | 48 |
| 2012 | 186.8 | 23.1 | 167 | 324.1 | 186.8 | 7.21 | 1,635 | 48 |
| 2011 | 197 | 23 | 167 | 313 | 197 | 6.96 | 1,646 | 41 |
| 2010 | 185 | 23 | 132 | 135 | 178 | 6.5 | 1,623 | 40 |
| 2009 | 181 | 23 | 167 | 134 | 181 | 4.45 | 1,420 | 31 |
| 2008 | 181 | 23 | 167 | 133 | 181 | 4.8 | 1,370 | 41 |
| 2007 | 164 | 23 | 167 | 137 | 164 | 5.29 | 1,300 | 35 |
| 2006 | 139 | 23 | 167 | 160 | 139 | 4.6 | 1,200 | 31 |
| 2005 | 143 | 23 | 167 | 155 | 143 | 3.9 | 1,200 | 27 |
| 2004 | 133 | 28 | 167 | 135 | 133 | 3.4 | 1,175 | 25 |
| 2003 | 124 | 23.1 | 167 | 197.3 | 124 | 2.55 | 967 | 21 |
| 2002 | 126.8 | 23 | 167 | 198 | 126.8 | 2.2 | 1,678 | 19.1 |
| 2001 | 125 | 23 | 167 | 198 | n.a | 2.1 | 1,878 | 20.7 |
| 2000 | 128 | 23 | 167 | 198 | n.a | 1.6 | 1,871 | 21.7 |
| 1995 | 121.2 | 27.1 | 167 | 166.6 | n.a | 2.2 | ||
| 1990 | 111 | 72 | 311 | 119 | n.a | 1.934 | 816 | 24 |
| 1985 | 326 | 67 | 311 | 110 | 326 | 1.829 | 10,886 | 23 |
| 1980 | 490 | n.a | n.a | 401 | 490 | 2 | 4899 | 25.3 |
| 1975 | 490 | n.a | n.a | 401 | 490 | 1.56 | 5443 | 22.51 |
Mt = million tonnes of ore.
- Economic Demonstrated Resources (EDR) predominantly comprise Ore Reserves and most Measured and Indicated Mineral Resources that have been reported in compliance with the Joint Ore Reserves Committee (JORC) Code to the Australian Securities Exchange (ASX). In addition, some reserves and resources may have been reported to foreign stock exchanges using other reporting codes, which are largely equivalent to the JORC Code. Geoscience Australia may also hold some confidential data.
- Total Inferred Resources in economic, subeconomic and undifferentiated categories.
- Accessible Economic Demonstrated Resources (AEDR) is the portion of total EDR that is accessible for mining. AEDR does not include resources that are inaccessible for mining because of environmental restrictions, government policies or military lands.
- Australian manganese production from company reports and Department of Mines, Industry Regulation and Safety, Western Australian Government, Major commodities resources file.
- World economic resources from Mineral Commodity Summaries, published by the USGS and adjusted with Geoscience Australia data. World economic resource figures are presented as manganese content, not manganese ore.
- World production from Mineral Commodity Summaries, published by the USGS and adjusted with Geoscience Australia data. World mine production figures are presented as manganese content, not manganese ore.
Geoscience Australia's mineral resources database is reviewed annually to evaluate the economic status of each individual deposit. Consideration is given to factors including, but not limited to, the probability of economic development, accessibility, location and commodity prices. An outcome of these reviews can be changes to mineral inventories as resource estimates are reclassified.
Developing projects, including the Butcherbird Project, which reported resource increases at the Richies Find, Coodamudgi and Mundawindi deposits6, have contributed to the 12% increase in Inferred Resources from 354 Mt in 2018 to 396 Mt in 2019.
Only the Northern Territory and Western Australia host EDR of manganese ore, respectively 57% and 43%. Western Australia also hosts significant subeconomic resources and Queensland has minor Inferred Resources in the Mount Isa region (Table 4). Figure 1 shows the locations and relative sizes of Australia's manganese deposits and mines.
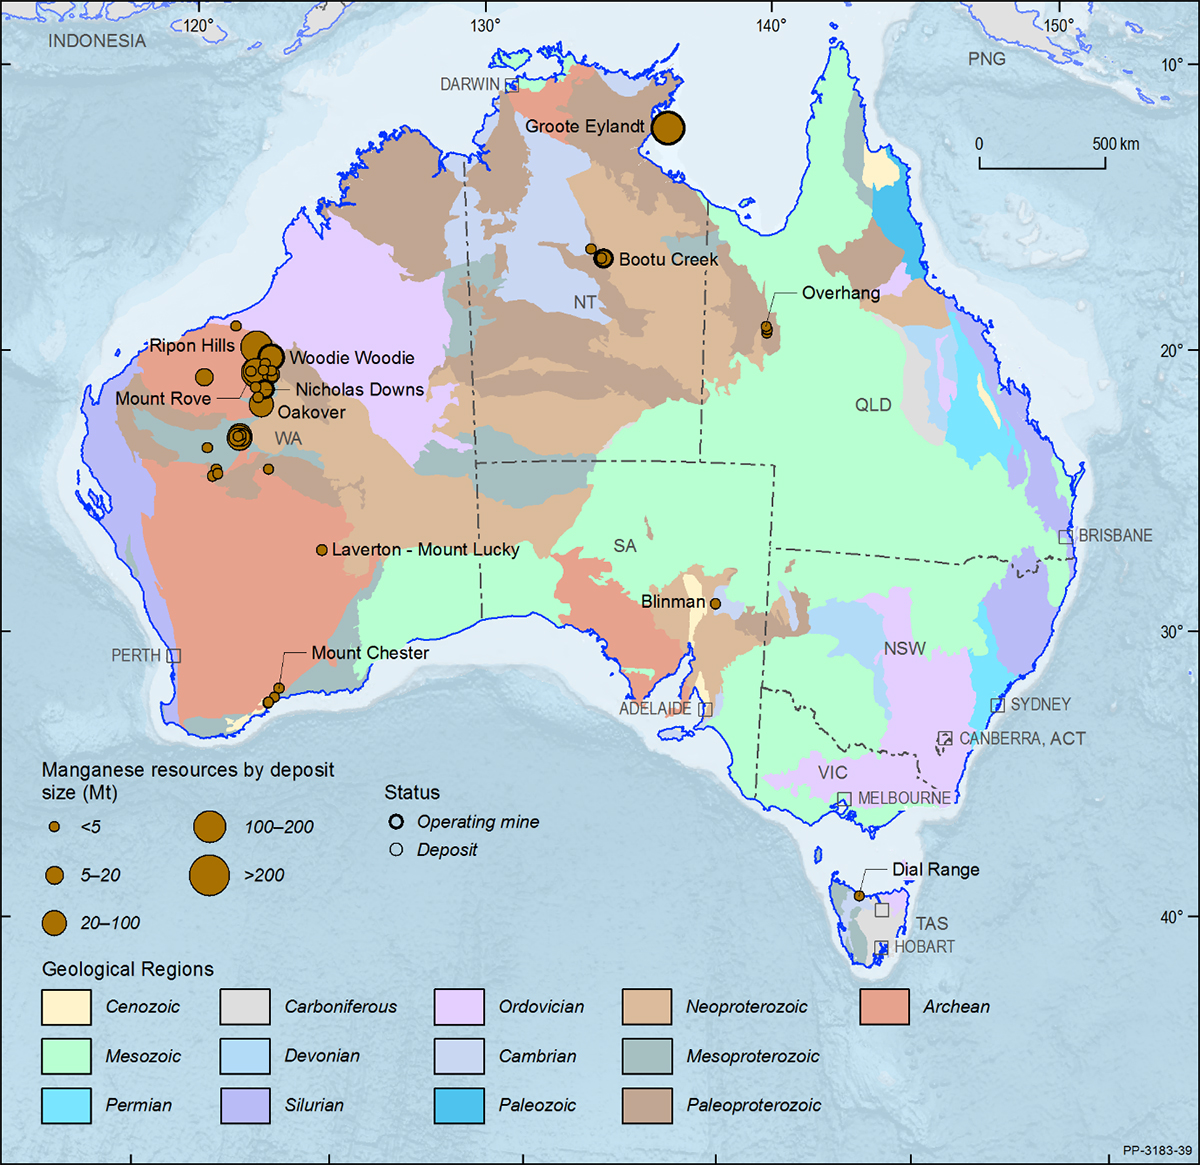
Figure 1. Australian manganese deposits and operating mines as at 31 December 2019.
Deposit size is based on total resources (EDR + Subeconomic Demonstrated Resources + Inferred). For clarity, only major or significant deposits are labelled. Mt = million tonnes.
Table 4. Identified Mineral Resources of manganese ore in Australian jurisdictions, as at 31 December 2019.
| Jurisdiction | Demonstrated Resources (Mt) | Inferred Resources (Mt) | ||
|---|---|---|---|---|
| Economic1 | Paramarginal2 | Submarginal3 | Undifferentiated4 | |
| Northern Territory | 154 | 0 | 0 | 25 |
| Queensland | 0 | 0 | 0 | 0.1 |
| Western Australia | 118 | 3 | 190 | 371 |
| Total | 272 | 3 | 190 | 396 |
- Economic Demonstrated Resources (EDR) predominantly comprise Ore Reserves and most Measured and Indicated Mineral Resources that have been reported in compliance with the Joint Ore Reserves Committee (JORC) Code to the Australian Securities Exchange (ASX). In addition, some reserves and resources may have been reported to foreign stock exchanges using other reporting codes, which are largely equivalent to the JORC Code. Geoscience Australia may also hold some confidential data.
- Paramarginal Demonstrated Resources are geologically demonstrated but do not meet the criteria for Economic at the time of determination. However they may become so with limited increases in commodity prices or cost-reducing advances in technology. The main characteristics of this category are economic uncertainty and/or failure (albeit just) to meet the criteria for the Economic category.
- Submarginal Demonstrated Resources are geologically demonstrated but do not meet the criteria for Economic at the time of determination. They require a substantially higher commodity price or a major cost-reducing advance in technology to render them viable.
- Total Inferred Resources with no economic differentiation.
Accessible EDR
Some resources are inaccessible for mining because of environmental restrictions, government policies or because they occur within military lands or national parks. All of Australia's EDR of manganese ore (272 Mt) in 2019 is considered accessible (Table 3).
Production
In Australia, there are three operating mines (Figure 2) and one tailings re-treatment plant. The Woodie Woodie mine is located about 400 km southeast of Port Hedland in Western Australia. A manganese tailings processing plant also operates near the Woodie Woodie mine. The Northern Territory has two manganese mines with one being located on Groote Eylandt in the Gulf of Carpentaria and the other at Bootu Creek, 110 km north of Tennant Creek.
In 2019, Australia's manganese ore production totalled approximately 7.5 Mt (Table 2; Table 3). The total tonnage of manganese ore mined is approximately twice the tonnage produced because of yields of around 50% after beneficiation.
Export data for Australia's manganese products, including manganese ore, were not available.
Another potential manganese source in Australia is the Mount Thirsty Cobalt-Nickel Project, approximately 16 km northwest of Norseman, Western Australia, which is a joint venture between Conico Ltd and Barra Resources Ltd. The project's pre-feasibility7 study results stated that most of the cobalt and some nickel mineralisation is hosted by the secondary manganese oxide mineral asbolane8 The project's beneficiation study demonstrated several leaching processes with one showing successful extraction of cobalt and nickel and the precipitation of manganese as a by-product9.
World Ranking
In 2019, South Africa had the largest world economic resources of manganese at 31%, followed by Brazil and Ukraine (17% each). Australia ranked fourth with 14%, above Gabon and China with 7% each (Table 5).
Table 5. World economic resources of manganese content 2019.
| Rank | Country | Resources1 (Mt Mn) | Percentage of world total2 |
|---|---|---|---|
| 1 | South Africa | 260 | 31% |
| 2 | Brazil | 140 | 17% |
| 3 | Ukraine | 140 | 17% |
| 4 | Australia | 114 | 14% |
| 5 | Gabon | 61 | 7% |
| 6 | China | 54 | 7% |
| 7 | India | 34 | 4% |
| 8 | Ghana | 13 | 2% |
| Others | 10 | 1% | |
| Total | 826 |
Mt Mn = million tonnes of manganese content.
- Data sourced from the USGS10. National figures other than Australia are rounded.
- Percentages are also rounded and may not add up to 100% exactly.
South Africa also led world production of manganese, accounting for 29% of global demand in 2019, followed by Australia (17%) and Gabon (13%; Table 6).
Table 6. World production of manganese content 2019.
| Rank | Country | Production1 (Mt Mn) | Percentage of world total2 |
|---|---|---|---|
| 1 | South Africa | 5.5 | 29% |
| 2 | Australia | 3.2 | 17% |
| 3 | Gabon | 2.4 | 13% |
| 4 | Ghana | 1.4 | 7% |
| 5 | China | 1.3 | 7% |
| 6 | Brazil | 1.2 | 6% |
| 7 | India | 1.0 | 5% |
| 8 | Ukraine | 0.5 | 3% |
| 9 | Malaysia | 0.4 | 2% |
| Others | 2.0 | 11% | |
| Total | 19 |
Mt Mn = million tonnes of manganese content.
- Data sourced from the USGS11. National figures other than Australia are rounded.
- Percentages are also rounded and may not add up to 100% exactly.
Industry Developments
Exploration
While data associated with exploration expenditure for manganese are not published by the Australian Bureau of Statistics, Australian manganese producers and exploration companies are actively engaged in extending their knowledge at brownfield operations and discovering new sources of supply.
South32 Ltd reported the commencement of its exploration drilling program at GEMCO on Groote Eylandt during the first half of 202012. The company stated that it would infill drill the known mineralisation and also test other targets in the southern areas of the GEMCO operation.
In 2019, OM Holdings Ltd's exploration program at Bootu Creek drill-tested the newly discovered Carruthers North prospect, northwest of the Bootu Creek mine within tenement EL2860413 . Significant intersections include 7 m at 27.67% Mn from surface and 2 m at 37.41% Mn from 38 m in RSRC0321, and 5 m at 24.22% Mn from surface in RSRC032314.
The 2019, drilling was also extended to the Renner West deposit where two diamond drill holes obtained core for metallurgical test work. The best intersections included:
- 4.8 m at 27.63% Mn from 4.0 m in RSDD001;
- 2.7 m at 28.2% Mn from 4.6 m, and 3.2 m at 33.65% Mn from 18.1 m in RSDD002; and
- 4.2 m at 26.81% Mn from 2.6 m, and 4.3 m at 33.98% Mn from 6.8 m in RSDD00315.
A joint venture between OM Holdings and Bryah Resources Ltd at the historic Horseshoe South manganese mine, Brumby Creek, Devils Hill and Black Cat prospects in Bryah Basin in Central Western Australia, has reported the completion of its Phase 1 drilling program. The program completed a total of 122 holes for 3,062 m of RC drilling16.
The best intersections included:
- 15 m at 26.2% Mn from 3 m at Brumby Creek;
- 12 m at 24.9% Mn from 7 m at Horseshoe South; and
- 7 m at 21.1% Mn from surface at Devils Hill.
The completion of the Phase 1 drilling program prompted planning of second phase of exploration activities for the December 2019 quarter17, including detailed ground mapping and high-resolution aerial photography18.
Groote Eylandt (GEMCO): South32 reported a 4% increase in GEMCO's total ore production in 2020 to 3.470 Mt19 . The operation's total manganese ore sales for 2020 were 3.440 Mt20, where 96% was sold to the company's external customers and the remaining 4% was shipped to the Tasmania Electro Metallurgical Company (TEMCO) alloy plant in Tasmania.
A key highlight at the GEMCO operation in 2019 was the commencement of an exploration program aiming to conduct infill drilling at known mineralisation and to test targets in the southern areas of the mine operation21 . GEMCO22 reported a 7% decrease in its JORC Mineral Resource from 2019 of 151 Mt to 138 Mt at an average grade of 43.4% Mn23 in 2020.
In August 202024, Subject to Australian's Foreign Investment Review Board approval, a binding conditional agreement was reached between South32 and an entity within GFG Alliance for the divestment of the TEMCO manganese alloy smelter, which was placed on care and maintenance in July 2020.
Bootu Creek: This open-cut mine is owned by OM Holdings and located 110 km north of Tennant Creek in the Northern Territory. The Bootu Creek project area contains a number of manganese deposits, including Chugga Far North, Masai, Shekuma, Tourag and Yaka. Since its first ore shipment in 200625 , the project has progressively mined these deposits for manganese ore to feed its 1 Mt-per-annum plant for the production of manganese concentrate. The company anticipates that mining activity for 2019–2020 will continue at mines planned in selected areas of the Chugga Far North, Tourag and Yaka deposits26. In 2019, the project reported a total JORC Mineral Resource of 10.03 Mt at an average grade of 16.51% Mn27.
Renner Springs: Approximately 70 km northwest of Bootu Creek, OM Holdings owns the Renner Springs Manganese Project, which has reported a JORC Inferred Resource of 0.28 Mt at 22.26% Mn28. The company stated that a preliminary feasibility study of the Renner West deposit, including metallurgical test work and mine assessment, commenced in 2020 with a view to upgrading the estimated Mineral Resource to Ore Reserve status29. Exploration RC drilling is also planned to evaluate several adjacent, untested geophysical anomalies.
Mary Valley: Manganese exploration at Mary Valley near Gympie has been the main focus of Eclipse Metals Ltd since its preliminary exploration program in 2014. Historical mining operations were carried out in the region during the 1920s and 1960s, including at the Mary Valley tenements30. Previous mining activities have produced manganese ore totalling at 31,477 tonnes (t) at a grade of over 45% Mn. The main historical deposit within Mary Valley is Amamoor No 1 with historical production of 19,630 t at 51% Mn31 .
The company's exploration activity at Mary Valley has resulted in some significant intersections, including
Butcherbird: The Butcherbird Manganese Project is located approximately 1,050 km north of Perth and 130 km south of Newman in the Pilbara region.
The project has had two Mineral Resource upgrades since the initial resource estimate in 2011. In October 2019, project owner, Element 25 Ltd (E25), reported the Butcherbird Project's total JORC 2012 Mineral Resource estimate to be approximately 263 Mt at 10% Mn36. This estimate was delineated over eight mineral deposits: Yenneri Ridge, Richies Find, Coodamudgi, Mundawindi, Ilgarrarie Ridge, Bindi Hill, Bugdie Hill and Cadgies Flat.
In May 2020, E25 announced the completion of the Butcherbird pre-feasibility study37. The study contemplated mining manganese ore through an open pit with a projected mine life of 42 years.
E25 indicated that the open-pit development would initially occur at the Yenneri Ridge deposit due to its higher grade mineralisation when compared to other deposits in the project38. In addition, Yanneri Ridge's minimal overburden favours low-cost mining and the deposit's location relative to infrastructure, such as the Great Northern Highway and the Goldfields Gas Pipeline, also gives it a development advantage.
Horseshoe South: The Horseshoe South Project is located within the Bryah Basin in central Western Australia.
Horseshoe South is known for its manganese deposits that were historically mined between 1948–1969 and 2008–201139 . The Horseshoe South Manganese Mine has produced approximately 1 Mt of manganese ore according to the present owner, Bryah Resources40. In 2019, the company initiated a joint venture with OM Holdings41 to drill at the mine and nearby prospects and later reported the following significant drilling intersections:
- 5 m at 23.2% Mn from surface and 15 m at 26.2% from 3 m at Brumby Creek42 ;
- 5 m at 28.8% Mn from 4 m at Horseshoe South43;
- 6 m at 38.1% Mn from surface at Black Hill44 ; and
- 4 m at 32.9% Mn from surface at Black Caviar45.
The joint venture companies report the Bryah Basin Manganese Project drilling programs are ongoing.
Woodie Woodie: Consolidated Minerals Ltd's subsidiary, Pilbara Manganese Pty Ltd, owns and oversees the operation at Woodie Woodie46, Australia's second major manganese producer. The mine is located approximately 400 km southeast of Port Hedland in the Pilbara region. The Woodie Woodie product has high manganese content and very low phosphorus, with low degradation and high thermal stability.
Ant Hill and Sunday Hill: These manganese deposits are located 400 km south of Port Hedland in the Pilbara region. Both deposits were previously mined but were placed under care and maintenance in 2012.
Oakover: Located approximately 80 km east of Newman in the East Pilbara region, Oakover's JORC 2004 Inferred Resource estimate of approximately 64 Mt at 10% Mn was last reported in June 2012 by Marindi Metals Ltd, previously known as Brumby Resources Ltd. A project development scoping study was conducted for Oakover but a review in 2016 concluded that the project was uneconomic due to the low price of manganese47 .
Tally-Ho, Contact and North Contact: These manganese deposits are part of the South Woodie Woodie Manganese Project located in the East Pilbara. In 2010, Bardoc Gold Ltd (previously Spitfire Resources Ltd), announced an Inferred Resource of 2.94 Mt at 7.07% Mn for Tally-Ho48. In 2012, the company announced a combined Inferred Resource of 11.3 Mt at 15% Mn for Contact and Contact North49. Market conditions were being monitored according the company’s 2019 annual report, but no activities were conducted at South Woodie Woodie during 2019 and 202050.
Citation
Bibliographical reference: Summerfield, D., 2021. Australian Resource Reviews: Manganese Ore 2020. Geoscience Australia, Canberra. http://dx.doi.org/10.11636/9781922446541
References
1Australia's Critical Mineral Strategy 2019, Australian Government, Canberra, 22pp.
2 United States Government Federal Register, 2018. Final List of Critical Minerals 2018. A Notice by the Interior Department on 05/18/2018. Document 83 FR 23295.
3 https://www.nrcan.gc.ca/our-natural-resources/minerals-mining/critical-minerals/23414
4 Nakano, J., 2021. The Geopolitics of Critical Mineral Supply Chains, Japan. Center for Strategic and International Studies. https://www.jstor.org/stable/resrep30033.8
5 The JORC Code is more correctly known as the Australasian Code for Reporting of Exploration Results, Mineral Resources and Ore Reserves. See: www.jorc.org.
6 Element 25 Ltd, ASX Announcement, 17 April 2019.
7 Barra Resources Ltd, ASX Announcement, 20 February 2020.
8 The chemical formula for asbolane is ((Ni,Co)2–xMn(O,OH)4 * nH2O).
9 See Footnote 8.
10 United States Geological Survey, Mineral Commodity Summaries 2020.
11 See Footnote 10.
12 South32 Ltd, ASX Announcement 13 February 2020.
13 OM Holdings Ltd 2019 Annual Report.
14 See Footnote 13.
15 See Footnote 13.
16 Byah Resources Ltd, ASX Announcement, 30th May 2019.
17 Bryah Resources Ltd, ASX Announcement, 7th August 2019.
18 Bryah Resources Ltd, September Quarterly Report, ASX 28 October 2019.
19 South32 Ltd. 2020 Annual Report.
20 See Footnote 19.
21 South32 Ltd ASX Announcement, 13 February 2020.
22 South32 Ltd. 2020 Annual Report.
23 See Footnote 21.
24 See Footnote 21.
25 OM Holdings Ltd. Annual Report 2018.
26 See Footnote 25.
27 OM Holdings Ltd. Annual Report 2019.
28 See Footnote 27.
29 OM Holdings Ltd. Annual Report 2020.
30 Eclipse Metals Ltd, http://eclipseuranium.com.au/projects/manganese-projects/
31 Eclipse Metals Ltd, http://eclipseuranium.com.au/
32 See Footnote 31.
33 Eclipse Metals Ltd. Annual Report 2019.
34 See Footnote 33.
35 See Footnote31.
36 Element 25 Ltd, ASX Announcement, 21 October 2019.
37 Element25 Ltd, ASX Announcement, 19 May 2020.
39 Bryah Resources Ltd, ASX Announcement, 7 May 2019.
40 See Footnote 39.
41 Bryah Resources Ltd. Annual Report 2019.
42 Bryah Resources Ltd, ASX Announcement, 4 July 2019.
43 See Footnote 42.
44 Bryah Resources Ltd, ASX Announcement, 2 August 2019.
45 See Footnote 44.
46 Consolidated Minerals Ltd, https://www.consmin.com/our-business/australia/manganese/
47 Marindi Metals Ltd, ASX Announcement 19 January 2017 - December 2016 Quarterly Activities Report.
48 See Footnote 44.
49 Bardoc Gold Ltd, https://www.bardocgold.com/south-woodie-woodie-project
50 Bardoc Gold Ltd, 2019 Annual Report.