Nickel
Page last updated:19 December 2023
Please note that this page is currently under review.
Resource figures are current as at 31 December 2019.
Nickel is a malleable, lustrous, silvery-white metal that has relatively low electrical and thermal conductivity, has strength and toughness at elevated temperatures and is capable of being magnetised. Its chemical symbol is ‘Ni’.
The most desired attribute of nickel is its anticorrosion properties, with around 80% of nickel used in steel production in 20191. When alloyed with other elements, nickel imparts toughness, strength, resistance to corrosion and various electrical, magnetic and heat resistant properties. About 65% of world nickel output is consumed in the manufacture of stainless and heat resistant steel2. These steels are used widely in the chemical industry, motor vehicles, medical applications, electronic engineering and the construction industry. These steels are also used in consumer products such as sinks, cooking utensils, cutlery and white goods.
Other uses of nickel are in the manufacture of non‑ferrous alloys and electroplating. In 2020, nickel used for battery precursors constituted 5 to 8% of nickel demand3.
Substitutes for nickel are limited. Most nickel substitutes are expensive and result in a trade‑off in performance, compromising the application’s physical or chemical attributes4.
Identified Resources
Australia's known resources of nickel are found mainly in Western Australia within komatiitic volcanic‑hosted nickel-copper-platinum group element (Ni-Cu-PGE) sulphide deposits, lateritic nickel deposits and, to a lesser extent, within tholeiitic intrusion‑hosted Ni‑Cu‑PGE sulphide and hydrothermal deposits. Australia’s distribution of nickel deposits is shown in Figure 1.
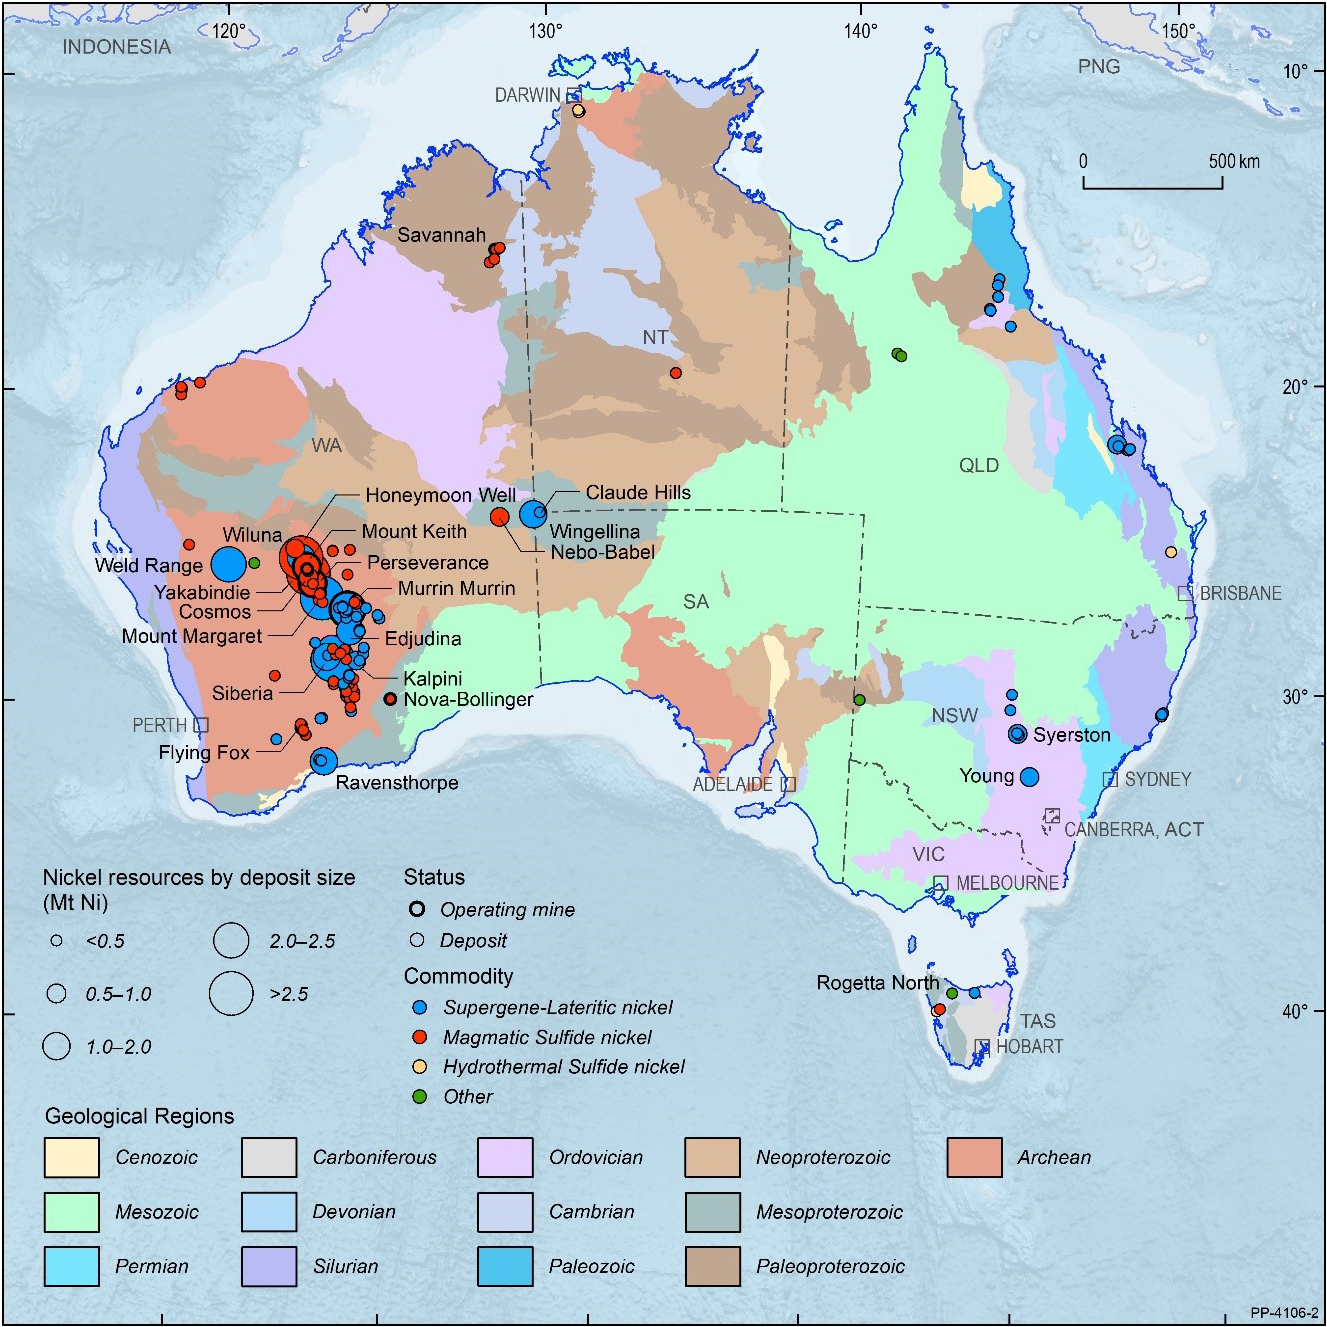
Figure 1. Australian nickel deposits and operating mines as at 31 December 2019. Deposit size is based on total resources (EDR + Subeconomic Demonstrated Resources + Inferred Resources). For clarity, only major or significant deposits are labelled.
Australia's Economic Demonstrated Resources (EDR) of nickel increased by 8% from 19.7 million tonnes (Mt) in 2018 to 21.2 Mt in 2019 (Table 1). Australia's EDR of nickel includes 8.3 Mt of total Proved and Probable Ore Reserves (39%), as defined under the Joint Ore Reserves Committee (JORC) Code, up 27% from 5.4 Mt in 2018.
Table 1. Australia's identified nickel resources and world figures from 1975–2019.
| Year | Demonstrated Resources (Mt Ni) | Inferred Resources2 (Mt Ni) | Accessible EDR3 (Mt Ni) | Australian Mine Production4 (Mt Ni) | World Economic Resources5 (Mt Ni) | World Mine Production6 (Mt Ni) | ||
|---|---|---|---|---|---|---|---|---|
| Economic (EDR)1 | Subeconomic | |||||||
| Paramarginal | Submarginal | |||||||
| 2019 | 21.2 | 2.5 | <1 | 19.5 | 21.2 | 0.155 | 90 | 2.7 |
| 2018 | 19.7 | 2.5 | <1 | 19.1 | 19.7 | 0.148 | 89 | 2.3 |
| 2017 | 19.7 | 3.1 | <1 | 20.0 | 19.7 | 0.179 | 74 | 2.1 |
| 2016 | 18.5 | 4.1 | 0.1 | 23.3 | 18.5 | 0.204 | 78 | 2.25 |
| 2015 | 18.8 | 3.6 | 0.1 | 19.4 | 18.8 | 0.235 | 79 | 2.54 |
| 2014 | 19.0 | 4.0 | 0.1 | 20.0 | 19.0 | 0.246 | 81 | 2.46 |
| 2013 | 19.0 | 4.0 | 0.1 | 19.7 | 19.0 | 0.234 | 74.9 | 2.48 |
| 2012 | 17.7 | 4.2 | 0.2 | 17.8 | 17.7 | 0.244 | 72.6 | 2.14 |
| 2011 | 20.4 | 3.5 | 0.6 | 18.4 | 20.4 | 0.215 | 76.0 | 1.81 |
| 2010 | 20.7 | 2.4 | 1.3 | 19.4 | 20.7 | 0.170 | 75.6 | 1.58 |
| 2009 | 24.0 | 3.0 | 1.9 | 21.2 | 24.0 | 0.165 | 68.6 | 1.4 |
| 2008 | 26.4 | 1.1 | 1.0 | 20.9 | 26.4 | 0.2 | 69.9 | 1.6 |
| 2007 | 25.8 | 1.6 | 1.1 | 21.9 | 25.8 | 0.185 | 68.7 | 1.7 |
| 2006 | 23.7 | 2.3 | 1.2 | 22.2 | 23.7 | 0.185 | 63.8 | 1.5 |
| 2005 | 23.9 | 2.3 | 1.1 | 20.3 | 23.9 | 0.189 | 64.1 | 1.5 |
| 2004 | 22.6 | 2.8 | 1.3 | 19.5 | 22.6 | 0.187 | 61.8 | 1.4 |
| 2003 | 22.8 | 2.3 | 1.6 | 16.4 | 22.8 | 0.192 | 62.8 | 1.4 |
| 2002 | 22.2 | 2.7 | 1.6 | 16.5 | 22.2 | 0.21 | 61.2 | 1.35 |
| 2001 | 21.9 | 3.3 | 1.3 | 18.8 | – | 0.21 | 59.9 | 1.24 |
| 2000 | 20 | 3.1 | 1.6 | 20 | – | 0.17 | 58.2 | 1.23 |
| 1995 | 3.7 | 3.6 | 2.8 | 4.4 | – | 0.10 | 47 | 1.04 |
| 1990 | 3 | 0.5 | 4.3 | 2 | – | 0.067 | 49 | 0.95 |
| 1985 | 1.65 | 0.59 | 6.05 | 1.71 | – | 0.086 | 101 | 0.783 |
| 1980 | 2.15 | 1.01 | 5.31 | – | – | 0.07 | 54.3 | 0.76 |
| 1975 | 1.9 | 3.6 | 2 | – | – | 0.076 | 45 | 0.76 |
Mt Ni = million tonnes of nickel content.
- Economic Demonstrated Resources (EDR) predominantly comprise Ore Reserves and most Measured and Indicated Mineral Resources reported in accordance with the JORC Code to the Australian Securities Exchange (ASX). In addition, some reserves and resources may have been reported to foreign stock exchanges using other reporting codes, which are largely equivalent to the JORC Code. Geoscience Australia may also hold some confidential data.
- Total Inferred Resources in economic, subeconomic and undifferentiated categories.
- Accessible Economic Demonstrated Resources (AEDR) is the portion of total EDR accessible for mining. AEDR does not include resources inaccessible for mining because of environmental restrictions, government policies or military lands.
- Mine production from Resources and Energy Quarterly September 2020, Office of the Chief Economist, Australian Government Department of Industry, Science, Energy and Resources.
- World economic resources from Mineral Commodity Summaries 2020 published by the USGS and adjusted with Geoscience Australia data.
- World production from Mineral Commodity Summaries 2020 published by the USGS and adjusted with Geoscience Australia data.
Western Australia hosts the largest proportion of Australia’s nickel resources with 90% of Australia’s EDR, followed by Queensland (5%) and New South Wales (4%). Western Australian EDR comprises both sulphide and laterite deposits; EDR in Queensland is mostly associated with laterite deposits.
Subeconomic Demonstrated Resources (Paramarginal and Submarginal Demonstrated Resources) of nickel accounted for approximately 2.5 Mt of Australia’s nickel inventory in 2019 and were unchanged from 2018 to 2019 (Table 1).
Inferred Resources increased from 19.1 Mt in 2018 to 19.5 Mt in 2019 (Table 1), with Western Australia accounting for 16.5 Mt of the total followed by Queensland with 1.4 Mt.
Accessible EDR
Some mineral resources are inaccessible for mining because of environmental restrictions, government policies or because they occur within military lands or national parks. All of Australia’s EDR of nickel are accessible.
JORC Ore Reserves
In 2019, Australia’s Ore Reserves of nickel amounted to 8.3 Mt (Table 2). This comprised 39% of EDR. The remaining 61% of EDR represents resources assessed by Geoscience Australia from the Measured and Indicated categories of industry-reported Mineral Resources. The majority of Australian Ore Reserves and Mineral Resources are reported by industry in accordance with the JORC Code to the Australian Securities Exchange. Where equivalent reporting codes are used by companies listed elsewhere, these are also incorporated into the national inventory.
Reserve life is calculated by dividing an Ore Reserve by that year’s production. Though only a general estimate (see Table 3 footnotes for details), it provides snapshot of potential future mineral supply that can be useful when considered cautiously. Figure 3 shows trends across time for nickel production, resources, Ore Reserves, and resource and reserve life.
Table 2. Australia's Ore Reserves of nickel, production and potential reserve life, 2002–2019.
| Year | Ore Reserves1(Mt Ni) | Production2(Mt Ni) | Reserve Life3(years) |
|---|---|---|---|
| 2019 | 8.3 | 0.155 | 54 |
| 2018 | 6.2 | 0.148 | 42 |
| 2017 | 5.4 | 0.179 | 30 |
| 2016 | 6.0 | 0.204 | 29 |
| 2015 | 6.4 | 0.235 | 25 |
| 2014 | 7.0 | 0.246 | 30 |
| 2013 | 8.3 | 0.234 | 35 |
| 2012 | 7.5 | 0.244 | 30 |
| 2011 | 7.04 | 0.215 | 33 |
| 2010 | 5.5 | 0.170 | 32 |
| 2009 | 4.7 | 0.165 | 28 |
| 2008 | 7.1 | 0.2 | 36 |
| 2007 | 6.58 | 0.185 | 36 |
| 2006 | 7 | 0.185 | 38 |
| 2005 | 7 | 0.189 | 37 |
| 2004 | 7 | 0.187 | 37 |
| 2003 | 7 | 0.192 | 35 |
| 2002 | 9.3 | 0.21 | 44 |
Mt Ni = million tonnes of nickel content.
- The majority of Australian Ore Reserves are reported in accordance with the JORC Code using the Proved and Probable categories. A number of companies report using other reporting codes, which are largely equivalent and may include the combined 'Proven & Probable' category that is no longer supported by the JORC Code. In addition, Geoscience Australia may hold confidential information. Geoscience Australia did not report Ore Reserves prior to 2002.
- Mine production from Resources and Energy Quarterly September 2020, Office of the Chief Economist, Department of Industry, Science, Energy and Resources.
- Reserve Life = Ore Reserves ÷ Production.
Table 3. Ore Reserves and Mineral Resources of nickel reported in accordance with the JORC Code at operating mines in 2019.
| No. of Operating Mines1 | Ore Reserves2 (Mt Ni) | Measured and Indicated Resources3 (Mt Ni) | Inferred Resources4 (Mt Ni) | Mine Production5 (Mt Ni) | Reserve Life6 (years) | Resource Life 17 (years) | Resource Life 28 (years) |
|---|---|---|---|---|---|---|---|
| 10 | 2.4 | 7.6 | 1.1 | 0.16 | 15 | 49 | 56 |
Mt Ni = million tonnes of nickel content.
- The number of operating mines are those that operated for some period during 2019. Some of these mines may belong to larger, multi-mine operations and some may have closed during or since 2019.
- The majority of Australian Ore Reserves and Mineral Resources are reported in accordance with the JORC Code, however there are a number of companies that report to foreign stock exchanges using other reporting codes, which are largely equivalent. In addition, Geoscience Australia may hold confidential information for some commodities. Ore Reserves are as at 31 December 2019.
- Measured and Indicated Mineral Resources are inclusive of the Ore Reserves. NB: Not all operating mines report Mineral Resources. Mineral Resources are as at 31 December 2019.
- Inferred Mineral Resources are as at 31 December 2019. NB: Not all operating mines report Mineral Resources.
- Mine production from Resources and Energy Quarterly September 2020, Office of the Chief Economist, Department of Industry, Science, Energy and Resources.
- Reserve Life* = Ore Reserves ÷ Production.
- Resource Life 1* = (Measured + Indicated Resources) ÷ Production.
- Resource Life 2* = (Measured + Indicated + Inferred Resources) ÷ Production.
*Reserve and resource life is calculated by dividing the mineral inventory by production. The resulting ratio is a snapshot in time used as a general estimate only, since it is an average and it assumes (1) that future production rates will remain unchanged, (2) deposits deemed economic/uneconomic remain so in the future and (3) that depleted resources are never replaced.
Using the 2019 Ore Reserve and rate of nickel production, the average reserve life for operating nickel mines in Australia is 15 years but the resource life (Measured and Indicated categories) is 49 years (Table 3). If Ore Reserves at mines on care and maintenance, developing mines and undeveloped deposits are also considered, the average reserve life of nickel is 54 years (Table 2).
If EDR (Table 1) is used as an indication of long‑term potential supply, Australia’s nickel resources could last approximately 135 years at 2019 rates of production. Australia, therefore, has the potential to produce nickel for many decades into the future and be a reliable source of supply for global decarbonisation strategies.
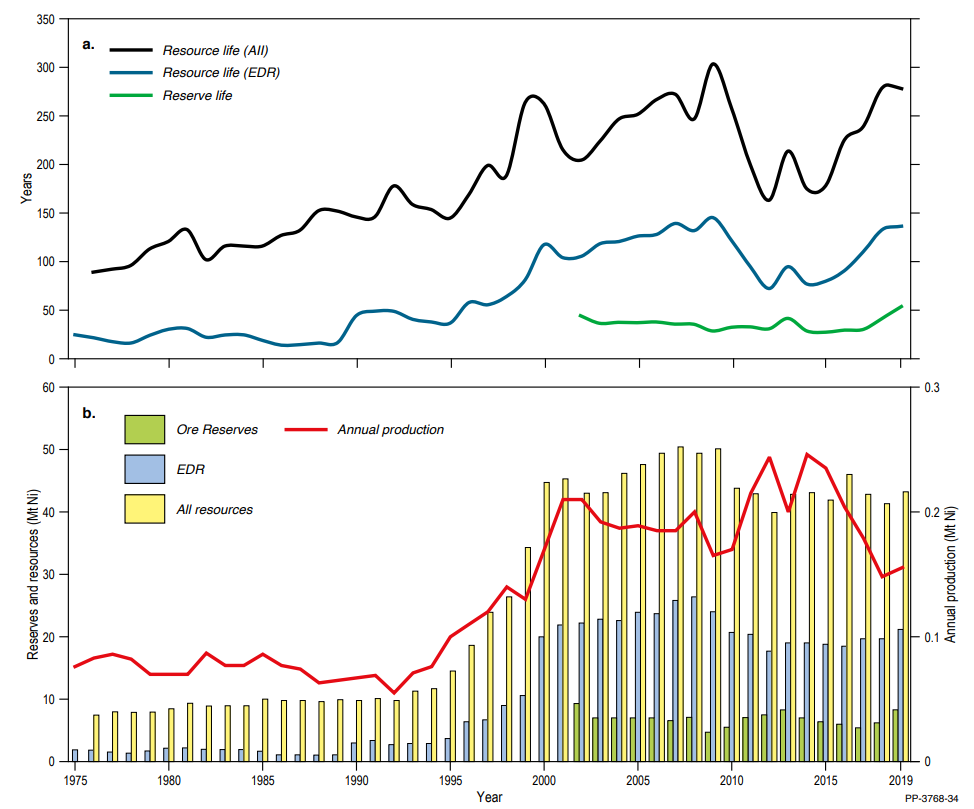
Figure 3. (a) Trends in nickel reserves and resource life. These ratios are derived from (b) nickel Ore Reserves, EDR, all resources (EDR + Subeconomic Demonstrated Resources + Inferred Resources), and annual production, 1975–2019.
Production
Australia hosts some of the world’s top-producing nickel operations: BHP Group Ltd’s Nickel West operation ranks 8th globally, while Glencore Plc’s Murrin Murrin Project ranks 11th5. In total, Australia's nickel production in 2019 amounted to 0.155 Mt from 10 operating mines (Table 3). This is an increase from Australia’s 2018 nickel production, which was 0.148 Mt (Table 2) from 12 operating mines.
Australia's nickel production is dominated by magmatic nickel sulphides from komatiite deposits (82%) associated with Archean greenstone sequences. These include Australia’s first nickel mines developed in the late 1960s in Western Australia6. Conversely, most of Australia's nickel resources occur as nickel oxides in laterite deposits (69%)7. The Murrin Murrin and Ravensthorpe projects (also in Western Australia) are the only producing lateritic nickel operations in Australia. Table 4 outlines key differences in the two major types of nickel ore.
Table 4. Production from nickel ore types. Adapted from Ehrlich (2018)8 and Mudd (2009)9.
| Nickel Ore | Sulphide | Laterite |
|---|---|---|
| Global occurrence | Worldwide | Hot or humid tropical and sub tropical areas |
| Mining technique | Open cut or underground | Open cut |
| Average ore grade | 1.5–3% nickel | 1.3–2.5% nickel |
| Processing | Froth flotation, smelting, and refining: relatively cheaper. | Based on laterite ore type (oxide or silicate); more complex and more expensive. May include acid leaching or rotary kiln electric furnace techniques. |
Nickel Price and Trends
Trends in nickel prices historically follow other base metals, e.g., copper10. Economists highlight the relationship between global income growth, the state of the world economy and nickel consumption owing to nickel’s versatile usage in capital and consumer goods. This is illustrated through increasing nickel consumption in the period following World War II, and a slump in nickel consumption during the stagnation of Western economies in the late 1970s11.
During the early 2000’s nickel prices were supported by rapid global economic growth, reaching a peak of US$50,000/tonne in 2007 (Figure 4). This was driven by China’s expansion and the commercial development of nickel pig iron for use in stainless steel as a cheaper alternative to traditional pure nickel production12.
Expansion of global nickel capacity, particularly in Brazil, Madagascar, Myanmar and New Caledonia, between 2001 and 2011, following the Global Financial Crisis of 2007–08, resulted in falling nickel prices that reached a low of US$7,700/tonne in 2016 (Figure 4).
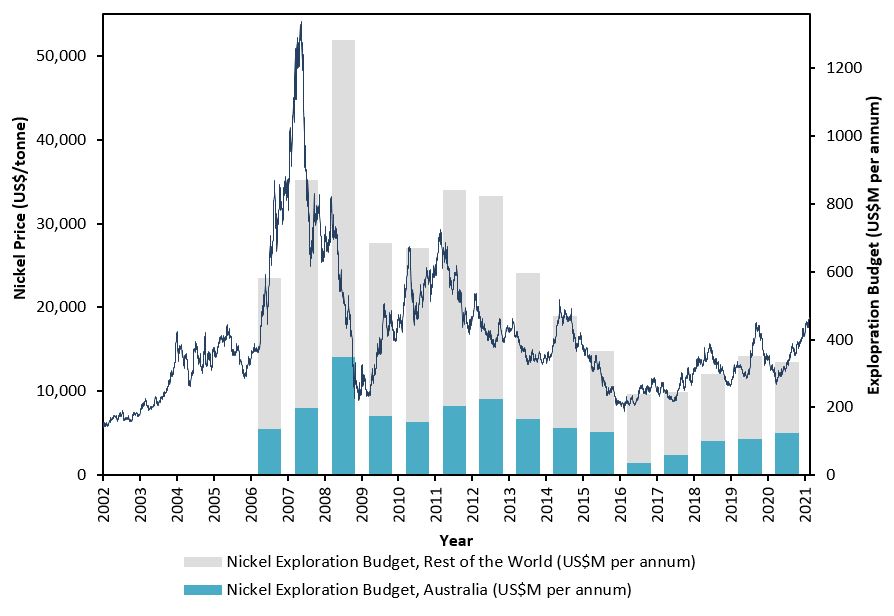
Figure 4. Nickel price (US$/tonne) compared to nickel exploration expenditure for Australia and the rest of the world (US$million per annum), January 2002 to April 2021.
Nickel price sourced from London Metals exchange and exploration expenditure from S&P Global Market Intelligence.
The outlook for base metal commodity markets, including nickel, is optimistic for an economic recovery following the COVID‑19 pandemic. In February 2021, nickel prices reached a 6-year high of US$19,689/tonne (Figure 4)13. Driven by investment in electric infrastructure, nickel prices are being supported by growing consumer and government environmental concerns. This has boosted demand for battery technology and its uptake in the electric vehicle market. Nickel prices have been bolstered by an emerging market preference towards using nickel in lithium-ion battery cathodes, which have high energy density, lower cost and longer life cycle capabilities compared to other cathode metals14. Emerging market concern about nickel supply is also supporting nickel prices15.
Nickel’s importance for modern technology has influenced the dynamics of global nickel production, including the imposition of export restrictions. For example, Indonesia imposed nickel export bans in August 2019 to encourage domestic development of nickel products, including electric vehicles16.
World Ranking
Based on global figures published by the United States Geological Survey and substituted with Geoscience Australia resource figures for Australia, world economic resources of nickel in 2019 were 89 Mt, unchanged from 2018 (Table 5).
In 2019, Australia ranked first globally with 24% of the world’s economic resources for nickel, slightly higher than Indonesia (23%). This is followed by Brazil (12%), Russia (8%) and Cuba (6%). New Caledonia also holds a significant share of the world’s economic resources of nickel, however these resource figures were not available for 2019.
Table 5. World economic resources of nickel 2019.
| Rank | Country | Economic Resources1 (Mt Ni) | Percentage of world total2 |
|---|---|---|---|
| 1 | Australia | 21.2 | 24% |
| 2 | Indonesia | 21.0 | 23% |
| 3 | Brazil | 11.0 | 12% |
| 4 | Russia | 6.9 | 8% |
| 5 | Cuba | 5.5 | 6% |
| 6 | Philippines | 4.8 | 5% |
| 7 | China | 2.8 | 3% |
| 8 | Canada | 2.6 | 3% |
| 9 | USA | 0.1 | <1% |
| Others | 14.0 | 16% | |
| Total | 90 | 100% |
Mt Ni = million tonnes nickel content.
- Data sourced from the USGS17 and Geoscience Australia. National figures other than Australia are rounded.
- Percentages are also rounded and may not add up to 100% exactly.
In 2019, Australia ranked sixth for nickel production contributing 155 kilotonnes (kt) or 6% to global supply (Table 6). Indonesia was the world's largest nickel producer with 800 kt (30%), followed by Philippines with 420 kt (16%), Russia with 270 kt (10%), and New Caledonia with 220 kt (8%).
Table 6. World production of nickel 2019.
| Rank | Country | Mine production1 (Mt Ni) | Percentage of world total2 |
|---|---|---|---|
| 1 | Indonesia | 0.800 | 30% |
| 2 | Philippines | 0.420 | 16% |
| 3 | Russia | 0.270 | 10% |
| 4 | New Caledonia | 0.220 | 8% |
| 5 | Canada | 0.180 | 7% |
| 6 | Australia | 0.155 | 6%3 |
| 7 | China | 0.110 | 4% |
| 8 | Brazil | 0.067 | 3% |
| 9 | Cuba | 0.051 | 2% |
| 10 | USA | 0.014 | 1% |
| Others | 0.370 | 14% | |
| Total | 2.700 | 100% |
Mt Ni = million tonnes nickel content.
- Data sourced from the USGS18 and Geoscience Australia. National figures other than Australia are rounded.
- Percentages are also rounded and may not add up to 100% exactly.
- Australia's share of global nickel production has been adjusted from the 7% published in Australia's Identified Mineral Resources 2020.
Industry Developments
This section provides an overview of active Australian nickel projects current as of April 2021. This section does not include operations where nickel is a minor resource or is imported.
Exploration Trends
Exploration expenditure in 2019 for nickel and cobalt, reported by the Australian Bureau of Statistics, was $229.7 million, an increase of 10% on 2018 ($208.7 million). Expenditure in 2020 for nickel and cobalt was down 21% on 2019 to $181.4 million.
Clean TeQ Sunrise/Syerston: The Clean TeQ Sunrise Project is located 350 kilometres (km) west of Sydney and is owned by Sunrise Energy Metals Ltd (formally Clean TeQ Holdings Ltd). The company assumed full ownership of the project in 2015 after completing the acquisition of Sunrise (then known as Syerston) from a wholly owned subsidiary of Ivanhoe Mines Ltd19.
Geology: The Sunrise deposit is a limonitic nickel‑cobalt laterite that lies over the mafic to ultramafic Tout Intrusive Complex.
Resources: As at September 2020, Mineral Resource estimates at Sunrise are 160 Mt at 0.56% Ni, 0.09% Co, 71 parts per million (ppm) Sc and 0.15 grams per tonne (g/t) Pt in the Measured and Indicated categories with 17 Mt at 0.26% Ni, 0.1% Co, 289 ppm Sc and 0.15 g/t Pt in the Inferred category. Proved and Probable Ore Reserve estimates are 143.2 Mt at 0.59% Ni, 0.1% Co and 47 ppm Sc20.
Activities: In September 2020,the companycompleted the Sunrise Project Execution Plan, which served as an update to the 2018 definitive feasibility study21. The plan incorporates a revised master schedule, cost estimates and mine design and engineering. It also states that the on‑site refinery is expected to produce 21,293 tonnes (t) of nickel and 4,366 t of cobalt from years 2–11 of mine operation, supporting the production of up to 2 million electric vehicles per annum22. Sunrise plans to run entirely on renewable energy but timing for commencement of operations is uncertain.
Nico‑Young: The Nico‑Young Project, owned by Jervois Mining Ltd, is located 120 km northeast of Wagga Wagga. The project is comprised of three lateritic nickel-cobalt deposits: Ardneree, East Thuddungra and West Thuddungra.
Resources: In May 2019, Jervois announced an updated Mineral Resources estimate for Nico‑Young23. Based on a 0.5% Ni cut‑off, Indicated Resources totalled 3.2 Mt grading 0.67% Ni and Inferred Resources totalled 90.1 Mt grading 0.63% Ni.
Activities: During the 2019–20 financial year, Jervois finalised a technical study on an integrated heap leach and refining facility that will produce battery-grade nickel sulphate and cobalt in refined sulphide. The company continues to negotiate with potential investment and off‐take partners before conducting feasibility studies for the Nico-Young Project24.
Sconi: The Sconi Project is owned and operated by Australian Mines Ltd and is located 200 km west of Townsville in north Queensland.
Geology: The project includes five key lateritic nickel-cobalt deposits, with mineralisation hosted in limonitic and saprolitic profiles25.
Resources: As at 30 June 2020, the Sconi Project has Measured and Indicated Resources of 93.51 Mt at 0.66% Ni and 0.06% Co, and Inferred Resources of 22.3 Mt at 0.54% Ni and 0.05% Co. Ore Reserve estimates were 57.3 Mt at 0.58% Ni, 0.08% Co and 35 ppm Sc26.
Activities: Australian Mines continued to conduct pre‑development works at Sconi during the 2019–20 financial year27, despite being hampered by the COVID‑19 pandemic. The Sconi Project plans to process an estimated 2 Mt of ore per annum over a 30-year mine life, producing high-purity nickel sulphate and cobalt sulphate crystals at an on-site battery minerals production plant.
Australian Mines has secured additional ground adjacent to the Sconi Project, where 14 new nickel‑cobalt target areas were identified following results from an independent study commissioned by the company28. While timing for commencement of operations is uncertain, Australian Mines is continuing to focus on securing offtake and finance partners29.
Barnes Hill Nickel: NQ Minerals Plc’s Barnes Hill Nickel‑Cobalt Project is located in the Tamar Development Corridor, 4 km west of Beaconsfield, in northern Tasmania. The project comprises the Barnes Hill, Scotts Hill and Mount Vulcan deposits 30 .
Geology: Mineralisation within these deposits is interpreted to have formed from the chemical weathering of a layered ultramafic formation known as the Andersons Creek Complex.
Resources: In April 2020, NQ Minerals announced an increased Mineral Resource estimate issued by Snowden Mining Industry Consultants Pty Ltd. This update, based on a 0.25% Ni cut-off, included Indicated Resources of 9,540 kt at 0.63% Ni and 0.06% Co, with Inferred Resources of 15,226 kt at 0.55% Ni and 0.04% Co31.
Activities: Results of metallurgical testwork completed by NQ Minerals support an updated flowsheet that serves as the base case for the current pre-feasibility study32. The study is targeting an annual throughput of 630,000 t per annum (tpa) of nickel ore to produce 6,000 tpa of contained nickel and 350 tpa of contained cobalt. The company is working to provide a new Ore Reserve estimate on the basis of outputs from a metallurgical simulation model and additional modifying factors.
Carr-Boyd: The Carr Boyd Project is located 80 km north of Kalgoorlie, and is owned by Estrella Resources Ltd, who acquired the project in 2017.
Geology: The project is contained in the Carr Boyd Igneous Complex, situated within the Archean Yilgarn Craton. Estrella’s tenements cover 75 square kilometres (km2) of the mafic-ultramafic igneous intrusive complex, which hosts several nickel and copper sulphide occurrences33.
Resources: Carr Boyd does not currently have a Mineral Resource estimate reported in accordance with the JORC Code. The project is a brownfields extension 1–1.2 km north-northwest of the historical Carr Boyd Nickel Mine, which produced 202.1 kt of ore at an average grade of 1.43% Ni and 0.46% Cu, producing a 9.7% Ni concentrate.
Activities: The company has previously conducted reverse circulation and diamond drilling programs, yielding significant intersections of nickel sulphide. These include 8 metres (m) at 1.11% Ni and 0.36% Cu. Estrella Resources continues to conduct exploration activities to further define mineralisation at Carr Boyd, with particular emphasis placed on the T5 Discovery Area34.
Cosmos Nickel Operation: The Cosmos Nickel Operation is located 30 km north of Leinster and is owned by Western Areas Ltd. Western Areas acquired Cosmos from Xstrata Nickel Australasia Pty Ltd in 2015. The Cosmos Operation historically produced over 127 kt of nickel in concentrate between 2000 and 2012, at an average head grade of 4.8% Ni35.
Geology: The project is situated within the Cosmos Nickel Complex, part of the Agnew‑Wiluna Belt of the central Yilgarn Craton. The deposit style is komatiite-hosted, disseminated to massive nickel sulphides.
Resources: In September 2020, Western Areas announced a maiden Ore Reserve estimate for the AM6 deposit, located 600 m southwest of the Odysseus deposit36. As at December 2020, total Mineral Resources at Cosmos were 64.4 Mt at 1% Ni, of which 10.2 Mt at 2.1% Ni are classified as Probable Ore Reserves.
Activities: Western Areas continued mine development works during the March 2021 quarter. First concentrate from Odysseus is expected to be produced midway through the 2022–23 financial year, with a production target of 14.6 kt nickel in concentrate per annum37.
Forrestania: The Forrestania Nickel Operations (FNO) are located 400 km east of Perth. Mining operations have been conducted at Forrestania since the early 1990s, with Western Areas assuming 100% interest in 2003. FNO consists of two operating mines, Flying Fox and Spotted Quoll, and an on‑site concentrator, Cosmic Boy.
Geology: Mineralisation at Forrestania occurs within komatiite‑hosted, nickel sulphide deposits. The deposits lie within the Forrestania Greenstone Belt, part of the Southern Cross Domain of the Archean Yilgarn Craton.
Resources: As at December 2020, Western Areas reported total FNO Mineral Resources of 18.2 Mt at 1.7% Ni. Of these Resources, 3.5 Mt at 2.4% Ni are classified as Probable Ore Reserves38.
Activities: In January 2020, Western Areas awarded new offtake contracts to BHP and Jinchuan Group Ltd for concentrate products produced from Forrestania39. During the 2019–20 financial year, FNO produced 20,926 t of nickel‑in‑concentrate from 586,640 t of milled ore at the Cosmic Boy Concentrator40.
Western Areas is continuing to conduct exploration activities in its Forrestania tenements, with focus directed towards developing full nickel prospectivity of the Western Ultramafic Belt and the geologic corridor extending between the Flying Fox and Spotted Quoll mines41. Renewed focus has been placed on the Seagull prospect, located 3 km north of the Cosmic Boy Concentrator, with geological reinterpretation and diamond drilling conducted during the 2019–20 financial year. Results from exploratory activities at FNO have prompted the planning of a second drilling program for the area42.
Julimar: The Julimar Project, which was staked in early 2018, is located around 70 km northeast of Perth and is owned by Chalice Mining Ltd.
Geology: The Julimar Project is a large‑scale magmatic Ni‑Cu‑PGE sulphide deposit, hosted in an igneous chonolith sill intrusion known as the Gonneville Intrusive Complex in the West Yilgarn Craton.
Resources: Chalice has not yet reported JORC Mineral Resource estimates for the Julimar Project.
Activities: The Julimar deposit was identified in March 2020 after the first drill hole intersected 33 m at 6.5 g/t Pd, 0.7 g/t Pt, 1.6% Ni, 0.7% Cu and 0.09% Co from 44 m43. Exploration drilling has since defined 11 high‑grade sulphide zones, comprising sulphide‑rich accumulations defined by grades greater than 1 g/t Pd44. These accumulations typically have a grade range of 1–15 g/t combined PGE and Au, 0.5–3.3% Ni, 0.4–4.5% Cu and 0.03–0.27% Co.
Chalice Mining aims to report a maiden Mineral Resource estimate in accordance with the JORC Code by late 2021, with a scoping study anticipated to be completed in the first half of 202245. The company has also engaged the Geological Survey of Western Australia to better define the geology of the deposit and help identify other potential deposits in the West Yilgarn using geochemistry and metallogenesis. Sulphide flotation and oxide leach metallurgical testing is also underway. Other early development activities include early‑stage metallurgical testwork and airborne electromagnetic surveys.
Kalgoorlie (Goongarrie): Ardea Resources Ltd’s Kalgoorlie Nickel Project (KNP) covers 1,738 km2 worth of tenements, located within 150 km of Kalgoorlie-Boulder46. The KNP incorporates a series of large undeveloped nickel-cobalt laterite deposits including the Goongarrie Nickel Cobalt Project (GNCP), Ardea’s most advanced development project to date.
Geology: Nickel and cobalt laterite mineralisation in the KNP tenements is hosted by enriched regolith formed over olivine-rich ultramafic units of the Archean Walter Williams Formation47. The GNCP is composed of four laterite deposits over a 25 km strike and includes the Goongarrie Hill, Goongarrie South, Big Four and Scotia Dam deposits.
Resources: As at 15 February 2021, the GNCP has total Mineral Resources of 259 Mt grading 0.7% Ni and 0.05% Co containing 1,817 kt of nickel and 119 kt of cobalt (based on a 0.5% Ni cut-off grade). This GNCP Resource falls within the broader KNP Mineral Resource of 826 Mt grading 0.7% Ni, 0.05% Co for 5,817 kt of nickel and 384 kt of cobalt48.
Activities: Ardea Resources has completed multiple studies on the operational viability of the GNCP, including a pre-feasibility study in March 201849, an expansion study in July 201850 and a pilot plant trial, operating June–October 2018. The pre-feasibility study was based on an initial mining and processing capability of 1 Mt per annum (Mtpa) over a 25-year mine life.
At a base production rate of 1 Mtpa, the GNCP has the potential to produce 41,500 tpa nickel sulphate and 5,500 tpa cobalt sulphate51. The results of the pilot plant trial indicated that high-purity, battery-grade nickel and cobalt sulphate crystals can be produced from GNCP ore52.
With the release of the updated Mineral Resource estimate in February 2021, Ardea Resources is continuing to progress active ‘Strategic Partner’ discussions to support the development of the GNCP53. The company is also planning to conduct exploratory activities within its ultramafic tenement to define Archean komatiite-hosted nickel sulphide and related deposits54.
Murrin Murrin: The Murrin Murrin Nickel Operation, owned by Glencore Plc, is situated between the towns of Lenora and Laverton in the north eastern Goldfields. Murrin Murrin is operated by Minara Resources Pty Ltd, a wholly owned subsidiary of Glencore.
Geology: Nickel and cobalt mineralisation is hosted within a laterite formed from the weathering of ultramafic sequences in the Archean Norseman‑Wiluna Greenstone Belt. Resources at Murrin Murrin are hosted in multiple deposits over three main project areas, North, South and East55.
Resources: As at December 2020, Murrin Murrin has Measured and Indicated Resources of 218.8 Mt at 1% Ni and 0.077% Co and Inferred Resources of 17 Mt at 0.9% Ni and 0.07% Co. This Resource contains total Ore Reserves of 136.8 Mt at 1.03% Ni and 0.088% Co. Murrin Murrin has a remaining mine life of 22 years56.
Activities: Ore is mined through conventional, shallow, open‑cut methods and processed at the on‑site hydrometallurgical processing plant. In 2020, the Murrin Murrin refinery produced 36.4 kt of nickel metal and 2.9 kt of cobalt metal from mined ore. The refinery also processed additional third‑party feed, which contributed to a total output of 40.8 kt of nickel metal and 3.3 kt of cobalt metal57. Nickel and cobalt products are both sold domestically and exported from the Kwinana port facility south of Perth.
Nickel West: Nickel West, located 80 km north of Leinster, is a fully integrated nickel sulphide mining, concentrating, smelting and refining operation, owned by BHP through its subsidiary BHP Billiton Nickel West Pty Ltd58. Mining operations at Nickel West are conducted at the Leinster Mine Complex and the Mount Keith Mine Complex, which began production in 1979 and 1995, respectively. All mining operations at Nickel West were acquired by BHP in 2005, as part of its acquisition of WMC Resources Ltd.
Geology: The orebodies at Nickel West are hosted within Archean disseminated and massive-textured nickel sulphides associated with metamorphosed komatiitic ultramafic lava flows and intrusions. Low-grade disseminated sulphide ore is produced at Mount Keith. High‑grade ore is mined at the Cliffs and Leinster underground mines and Rocky’s Reward open pit mine59.
Resources: As at June 2020, Nickel West reported Measured and Indicated Resources of 599 Mt at 0.68% Ni and Inferred Resources of 328 Mt at 0.64% Ni. This Resource estimate includes Proved and Probable Reserves of 275 Mt at 0.63% Ni.
Activities: In the 2019–20 financial year, BHP progressed construction of three new mines, with two in full production60. The Mount Keith satellite mine, Yakabindie, entered production in December 2019. The Venus underground mine (part of Leinster operations), entered production in September 2019.
Ore mined from Nickel West is crushed and processed on site at the Mount Keith concentrator (nominal capacity of 11 Mtpa of ore) and at the Leinster Concentrator and dryer (nominal capacity of 3 Mtpa of ore). Additionally, purchased third-party nickel material is processed at BHP’s Kambalda concentrator facility (nominal capacity of 1.6 Mtpa of ore).
All three processing facilities produce concentrates that are transported to BHP’s Kalgoorlie nickel smelter to produce a nickel matte, which is then refined into high‑grade nickel powder and briquettes at the company’s Kwinana nickel refinery. These products are exported from the Port of Fremantle61.
Production at Nickel West (inclusive of nickel metal, briquettes and powder, matte and by‑products) in the 2019–20 financial year decreased 8% from the previous year to 80 kt. The completion of maintenance activities and production from new mining areas is expected to increase total nickel production in the 2020–21 financial year to between 85 and 95 kt62.
In June 2020, BHP signed an agreement with MPI Nickel Pty Ltd, to acquire the Honeymoon Well development project and remaining 50% interest in the Albion Downs North and Jericho exploration joint ventures. Completion of the agreement is subject to regulatory government and third‑party approvals63.
In the 2020–21 financial year, Nickel West is expected to complete construction of the nickel sulphate plant located at the Kwinana nickel refinery. The plant (stage 1) is expected to produce approximately 100 kt per annum (ktpa) of nickel sulphate suitable for battery manufacturing64.
Nova‑Bollinger: The Nova‑Bollinger Operation is owned by Independence Group NL (IGO) and is located 160 km east-northeast of Norseman. The Nova and Bollinger deposits were discovered in 2012 and 2013, respectively, with the operation commencing commercial production in July 2017.
Geology: Recognised as the singular Nova‑Bollinger deposit, the orebody lies within the Mesoproterozoic Fraser Zone of the Albany‑Fraser Orogen. The Nova and Bollinger deposits occur within a tholeiitic mafic magmatic conduit intrusion65.
Resources: As of 31 December 2020, Nova-Bollinger has total Mineral Resources of 11.8 Mt grading 1.76% Ni, 0.71% Cu and 0.06% Co. This Mineral Resource includes Ore Reserves of 9 Mt at 1.82% Ni, 0.77% Cu and 0.07% Co66.
Activities: Ore from the Nova‑Bollinger mine is processed on‑site at the Nova concentrator, producing nickel‑cobalt and copper concentrates. Concentrates are delivered to customers in Kambalda, or exported from Esperance Port. In November 2019, IGO entered into a three‑year binding off‑take agreement with Trafigura Pte Ltd for 50% of the nickel concentrate and 100% of the copper concentrate produced at Nova-Bollinger. The company also entered a five‑year off‑take agreement with BHP Billiton Nickel West for an additional 50% of the nickel volume67.
At the end of June 2020, production of contained metals totalled 30,436 t of nickel, 13,772 t of copper and 1,142 t of cobalt68. Nova-Bollinger has a predicted mine life of approximately 6.5 years assuming a mining and processing rate of 1.5 Mtpa69.
IGO is continuing to conduct exploration activities within the company’s Fraser Range Project. The project, which encompasses Nova-Bollinger, comprises 12,400 km2 of IGO-managed ground tenure, which the company considers highly prospective for the discovery of new magmatic Ni-Cu sulphide deposits70. Looking forward, IGO continues to place particular focus on testing ‘Nova near mine’ prospects 71 .
Ravensthorpe: The Ravensthorpe Nickel Operation, owned by First Quantum Minerals Ltd, is located 140 km west of Esperance. First Quantum assumed ownership from BHP in 2010 and produced its first shipment of mined concentrates in November 2011. Mining operations continued until October 2017, when the company placed Ravensthorpe on care and maintenance owing to low global nickel prices72. The mine came out of care and maintenance in the first quarter of 2020 in response to the improved economic conditions for nickel.
Geology: Ravensthorpe lies at the southern margin of the Archean Yilgarn craton within the Ravensthorpe Greenstone Belt. The Operation consists of three low‑grade nickel laterite deposits, formed from the weathering of ultramafic parent rock into a thick lateritic regolith.
Resources: As at December 2020, Ravensthorpe has Measured and Indicated Resources of 227.7 Mt at 0.69% Ni and 0.03% Co, with Inferred Resources of 104.1 Mt at 0.52% Ni and 0.02% Co. Total Ore Reserves are 195.8 Mt at 0.6% Ni and 0.03% Co.
Activities: During 2020, Ravensthorpe produced 12.7 kt of nickel73. Guidance figures forecast that production at Ravensthorpe will increase to 23–27 ktpa in 2021 and again in 2023 to 27–32 ktpa74. All mined ore is processed at the on-site beneficiation plant.
In 2020, First Quantum commenced mine expansion works through the development of the Shoemaker Levy deposit. The expansion will increase the life of mine at Ravensthorpe by up to 20 years. Shoemaker Levy is targeted to begin production in late 202175.
Savannah: The Savannah Nickel Project, owned by Panoramic Resources Ltd, is located 250 km south of the port of Wyndham in the East Kimberly region. Panoramic Resources operated the Savannah mine from 2004 until 2016, when it was placed on care and maintenance due to a decline in global nickel prices76. The mine was recommissioned in July 2018 following the discovery of the Savannah North orebody. Operations were again suspended in April 2020 because of operational challenges attributed, in-part, to the COVID‑19 pandemic77.
Geology: The Savannah and Savannah North deposits are Paleoproterozoic Ni-Cu-Co sulphide deposits, developed within mafic and ultramafic magma chonoliths78.
Resources: As of July 2020, the Savannah Project contains Measured Resources of 3.09 Mt at 1.08% Ni, 0.58% Cu and 0.07% Co, Indicated Resources of 5.32 Mt at 1.28% Ni, 0.57% Cu and 0.09% Co and Inferred Resources of 2 Mt at 1.28% Ni, 0.39% Cu and 0.08% Co79. Of these Resources, the project contains total Ore Reserves of 8.27 Mt at 1.23% Ni, 0.59% Cu and 0.08% Co.
Activities: Underground pre‑development works recommenced in August 2020, with further preparations involving surface and underground infrastructure upgrades due to be completed in the first half of 2021.
In April 2021, Panoramic approved the restart of Savannah with ore processing scheduled to begin November 2021. Average annual concentrate production capacity is expected at 9.072 ktpa of nickel, 4.683 ktpa of copper and 0.676 ktpa of cobalt80.
South Kambalda: Mincor Resources NL owns the Kambalda Nickel Operation (KNO), located 60 km south of Kambalda, in the Eastern Goldfields. The KNO is comprised of three distinct mining areas: Cassini, Miitel and the Northern Operations (Durkin North and Long Mine).
Mincor has operated in the Kambalda region since it acquired the Miitel mine from WMC Resources in 2000. Miitel operated from 2000 until February 2016, when the slump in global nickel prices resulted in the mine being placed into care and maintenance. In 2019, Mincor acquired the Long Nickel Operation from IGO. Under IGO, Long had produced 135 kt of nickel in ore from 2002 until 2018, when the mine was placed on care and maintenance.
Geology: The deposits at Kambalda are classified as typical ‘Kambalda style’ Archean komatiitic nickel sulphide deposits81.
Resources: As at 30 June 2020, the KNO Mineral Resource was 5.20 Mt at 3.8% Ni, for a contained 196.1 kt of nickel. This resource includes 0.26 Mt and 4.24 Mt in the Measured and Indicated categories, respectively. Ore Reserve estimates were 2.46 Mt at 2.9% Ni, including 2.44 Mt in the Probable category82.
Activities: In August 2019, Mincor executed a binding ore tolling and concentrate purchase agreement with BHP Nickel West. Under this agreement, Mincor has the right to process up to 600 ktpa of nickel sulphide ore at the Kambalda Nickel Concentrator owned by BHP Nickel West. Nickel concentrates produced will be sold to BHP Nickel West for further downstream processing activities83.
Mincor’s Board approved development of the KNO in September 2020, with first firing of the portal face at Cassini conducted in November 2020. In March 2021,Mincor officially announced the opening of the Cassini Nickel Mine. First nickel concentrates from Cassini are expected to be produced in early 202284.
West Musgrave (Nebo‑Babel): The West Musgrave Project, wholly owned by OZ Minerals Ltd, is located 1,300 km northeast of Perth. The project consists of the Succoth copper deposit and the Nebo and Babel nickel-copper deposits. In October 2020, OZ Minerals gained 100% ownership in the project following the acquisition of previous owner Cassini Resources Ltd85.
Geology: The Nebo and Babel deposits are located 1.5 km apart, separated by the north‑south trending Jameson Fault. Both deposits are hosted by a tube‑shaped mafic intrusion86.
Resources: In December 2020, OZ Minerals announced an updated Mineral Resource totalling 390 Mt at 0.31% Ni for 1,200 kt Ni metal87. Ore Reserve estimates were 253 Mt at 0.32% Ni in the Probable category. Additionally, the Nebo‑Babel deposits possess polymetallic mineralisation, containing copper, gold, silver, cobalt, palladium and platinum88.
Activities: OZ Minerals released a pre-feasibility update for the Nebo and Babel deposits in December 2020. The update reported improved project metrics relative to the pre-feasibility study released in February 2020, including an increase in Mineral Resource and Ore Reserve estimates and an increase to the processing plant throughput rate to 12 Mtpa89.
OZ Minerals reported that the next development phase of the West Musgrave Project will include key activities such as advancing regulatory approvals, mining agreement discussions, engineering partner selection and field activity preparation. A final investment decision is expected in 202290.
Wingellina: The Wingellina Nickel-Cobalt Project is owned by Metals X Ltd and forms part of the Company’s Central Musgrave Project, which straddles the triple-point of Western Australia, South Australia and the Northern Territory91. The Central Musgrave Project also includes the Claude Hills Project, located 25 km from Wingellina.
Geology: Wingellina is a deeply weathered lateritic deposit, lying within the Proterozoic Musgrave Block.
Resources: As at 30 June 2016, Wingellina contains a total Mineral Resource of 182.6 Mt grading 0.92% Ni and 0.07% Co for 1,684 kt of nickel and 131.7 kt of cobalt. This Mineral Resource also includes a Probable Ore Reserve of 168.4 Mt at 0.93% Ni and 0.07% Co, for 1,561 kt of nickel and 122.6 kt cobalt92.
The nearby Claude Hills deposit contains Inferred Mineral Resources of 33.3 Mt grading 0.81% Ni and 0.07% Co for 270 kt of nickel and 22.27 kt of cobalt, based on a 0.5% Ni cut-off grade.
Activities: In 2018, metallurgical testwork on Wingellina ore succeeded in producing cobalt and nickel sulphate feedstocks for the battery industry, complementing previous testworks. In 2020, Metals X completed an infill drilling program that identified 15 potential high-grade nickel-cobalt open pits that could be exploited during the first 7–10 years of operation93. This included an intersection of 26 m at 1.57% Ni and 0.18% Co from the surface94.
Citation
Teh, M. and Pheeney, J., 2021. Australian Resource Reviews: Nickel 2020. Geoscience Australia, Canberra, Australia
References
1 Norilsk Nickel Group (Nornickel). (2020). Nickel Commodity Market Overview.
2 Ehrlich, L. G. (2018). What Drives Nickel Prices—A structural VAR Approach. Hamburg Institute of International Economics Research Paper 186. See also British Geological Survey. (2008). Nickel: Definition, mineralogy and deposits.
3 Azevedo, M., Goffaux, N., and Hoffman K. (2020). How clean can the nickel industry become. McKinsey & Company Commentary. See also McKay, H. (2019). The electrification of transport: episode two. BHP Prospects.
4 United States Geological Survey. Mineral Commodities Summaries—Nickel 2020.
5 S&P Global. (2020). Top Producing Projects—2019, Nickel. S&P Global Market Intelligence.
6 WMC Resources Ltd. (1967). Kambalda nickel project: opening ceremony by the Honourable David Brand, M.L.A., Premier of Western Australia, Friday 15th September 1967.
7 Geoscience Australia and Bureau of Resources and Energy Economics. (2013). Australian Minerals Resource Assessment 2013. 2nd Ed
8 See Footnote 2
9 Mudd, G. M. (2009). Nickel Sulphide versus Laterite: The Hard Sustainability Challenge Remains. Proceedings of the 48th Conference of Metallurgists, Canadian Metallurgical Society, Sudbury, Ontario, Canada, August 2009.
10 Wright, Y. N. (2014). The Reasons for the Rise in Nickel Prices. See also Deverell, R. and Yu, M. (2011). Long Run Commodity Prices: Where Do We Stand? CreditSuisse Fixed Income Research.
11 For an overview of studies on nickel price trends, see Footnote 2.
12 See Footnote 9.
13 Bloomberg News. (2021). Metals Are Soaring on a Green Frenzy and Global Recovery. Bloomberg NEF article
14 See Footnote 3. See also Hau, S. (2020). Nickel Mining Growing Due to Lithium Ion Batteries.
15 Barrera, P. (2020). Nickel Trends 2020: Prices Surge on EV Demand Expectations
16 Durrant, A. (2019). Indonesian nickel ore ban: who will fill the supply gap? See also Reuters. (2019). Indonesia president signs new EV decree to bolster industry.
17 See Footnote 4.
18 See Footnote 4.
19 CleanTeq Holdings Ltd. ASX Release 1 April 2015.
20 CleanTeQ Holdings Ltd. ASX Release 28 September 2020.
21 See Footnote 19.
22 See Footnote 19.
23 Jervois Mining Ltd. ASX Release 24 May 2019.
24 Jervois Mining Ltd. Annual Report 30 June 2020. ASX Release 30 September 2020.
25 Australian Mines Ltd. ASX Release 13 June 2019.
26 Australian Mines Ltd. Annual Report 30 June 2020. ASX Release 22 September 2020.
27 The Australian financial year runs from 31 July to 30 June of the following year.
28 See Footnote 25.
29 See Footnote 25.
30 NQ Minerals Plc. RNS Regulatory Announcement 22 April 2020.
31 See Footnote 29.
32 NQ Minerals Plc. Barnes Hill. https://nqminerals.com/barnes-hill/.
33 Estrella Resources Ltd. RIU Explorers Conference presentation. ASX Release 18 February 2021.
34 Estrella Resources Ltd. ASX Release 9 April 2021.
35 Western Areas Ltd. Cosmos. https://www.westernareas.com.au/what-we-do/cosmos.
36 Western Areas Ltd. ASX Release 2 September 2020.
37 Western Areas Ltd. Quarterly Activities Report. ASX Release 20 April 2021.
38 Western Areas Ltd. Quarterly Activities Report. ASX Release 28 January 2021.
39 Western Areas Ltd. ASX Release 21 January 2020.
40 Western Areas Ltd. Annual Report 2020. ASX Release 8 October 2020.
41 See Footnote 39.
42 See Footnote 39.
43 Chalice Mining Ltd. Quarterly Activities Report. ASX Release 28 April 2020
44 Chalice Mining Ltd. Julimar Nickel-Copper-PGE Project. https://chalicemining.com/project/julimar-nickel-copper-pge-project.
45 Chalice Mining Ltd. Annual Report 2021.
46 Ardea Resources Ltd. ASX Release 15 February 2021.
47 See Footnote 45.
48 See Footnote 45.
49 Ardea Resources Ltd. ASX Release 28 March 2018.
50 Ardea Resources Ltd. ASX Release 24 July 2018.
51 See Footnote 48.
52 Ardea Resources Ltd. ASX Release 30 October 2018.
53 Ardea Resources Ltd. Quarterly Operations Report. ASX Release 21 April 2020.
54 Ardea Resources Ltd. ASX Release 2 March 2021.
55 Glencore Plc. Glencore Resources & Reserves as at 31 December 2019.
56 Glencore Plc. Glencore Resources & Reserves as at 31 December 2020.
57 Glencore Plc. Glencore Full Year 2020 Production Report.
58 BHP Group Ltd. Annual Report 2020. ASX Release 15 September 2020.
59 BHP Group Ltd. Nickel West. https://www.bhp.com/our-businesses/minerals-australia/nickel-west/.
60 See Footnote 57.
61 See Footnote 57.
62 BHP Group Ltd. BHP Operational Review 30 June 2020. ASX Release 21 July 2020.
63 See Footnote 57.
64 See Footnote 57.
65 IGO NL. Annual Mineral Resource and Ore Reserves. ASX Release 17 March 2021. See also Dulfer, H., Skirrow, R. G., Champion, D. C., Highet, L. M., Czarnota, K., Coghlan, R. A., and Milligan, P. R. (2015). Potential for intrusion-hosted Ni-Cu-PGE sulphide deposits in Australia: A continental-scale analysis of mineral system prospectivity. Geoscience Australia Record 2016/001. Geoscience Australia, Canberra.
66 IGO NL. Annual Mineral Resource and Ore Reserves. ASX Release 17 March 2021.
67 IGO NL. ASX Release 1 November 2019.
68 IGO NL. Annual Report 2020. ASX Release 27 August 2020.
69 See Footnote 65.
70 See Footnote 65.
71 See Footnote 65.
72 First Quantum Minerals Ltd. Ravensthorpe. https://www.first-quantum.com/English/our-operations/default.aspx#module-operation--ravensthorpe.
73 First Quantum Minerals Ltd. TSX Release 16 February 2021.
74 See Footnote 72.
75 First Quantum Minerals Ltd. First Quantum Minerals Annual Report 2020.
76 Panoramic Resources Ltd. ASX Release 31 July 2020.
77 Panoramic Resources Ltd. ASX Release 15 April 2020.
78 Panoramic Resources Ltd. ASX Release 22 October 2020.
79 See Footnote 75.
80 Panoramic Resources Ltd. ASX Release 6 April 2021.
81 Mincor Resources NL. ASX Release 6 January 2020.
82 Mincor Resources NL. Annual Report 2020. ASX Release 15 October 2020.
83 Mincor Resources NL. ASX Release 25 March 2020.
84 Mincor Resources NL. ASX Release 30 March 2021.
85 OZ Minerals Ltd. 2020 Mineral Resource and Ore Reserve Statement.ASX Release 9 December 2020.
86 See Footnote 84.
87 See Footnote 84.
88 See Footnote 84.
89 OZ Minerals Ltd. Pre-Feasibility Study Update. ASX Release 9 December 2020.
90 See Footnote 88.
91 Metals X Ltd. Wingellina Nickel-Cobalt Project. https://www.metalsx.com.au/wingellina-nickel-cobalt-project/.
92 Metals X Ltd. ASX Release 13 February 2018.
93 Metals X Ltd. ASX Release 16 April 2020.
94 See Footnote 92.