Rare Earth Elements
Page last updated:19 December 2023
Please note that this page is currently under review.
Resource figures are current as at 31 December 2018.
The group of metals referred to as rare earth elements (REE) comprises the 15 elements of the lanthanide series. Metals in the lanthanide series are: lanthanum (La), cerium (Ce), praseodymium (Pr), neodymium (Nd), promethium (Pm), samarium (Sm), europium (Eu), gadolinium (Gd), terbium (Tb), dysprosium (Dy), holmium (Ho), erbium (Er), thulium (Tm), ytterbium (Yb) and lutetium (Lu). In addition, yttrium (Y) and scandium (Sc) are often grouped with the lanthanides and referred to as REE. Geoscience Australia assesses the lanthanides and yttrium together and has produced a separate review of scandium1.
Although these elements are referred to as rare they are not particularly rare in the earth’s crust. Cerium is the 25th most abundant crustal element and lutetium, the scarcest REE, is about the 60th most abundant. However, it is not common for them to occur in concentrations sufficient to support commercial mining operations. Resources of REE are mainly associated with four geological environments: alkaline igneous rocks, carbonatites, placer deposits with monazite-xenotime mineralisation and ion-adsorption clay deposits. Australian REE resources occur in a range of geological environments, which are comprehensively reviewed in Hoatson et.al.2.
Rapid technological advances have resulted in the REE growing in importance in many domestic, medical, industrial and strategic applications because of their unique catalytic, metallurgical, nuclear, electrical, magnetic and luminescent properties. Examples of the many applications for REE are their use in magnets and super magnets, motors, metal alloys, electronic and computing equipment, batteries, catalytic converters, petroleum refining, medical imaging, colouring agents in glass and ceramics, phosphors, lasers and special glass.
Many REE have numerous applications while particular applications may use different REE depending on the properties required; e.g., neodymium and praseodymium are used in high-power magnets; dysprosium, samarium, and terbium in high-temperature magnets and holmium is used in very-high-power magnets. Some REE may also be used in specialised applications, e.g., europium in currency security and gadolinium in MRI imaging.
The non-lanthanide REE, scandium and yttrium, have a number of important applications in modern technology. The major use of scandium is in the production of alloys for use in the aerospace industry. In addition, it may be used in solid oxide fuel cells, in specialised lighting applications, ceramics, lasers, electronics, and alloyed with aluminium for sporting goods production. Yttrium has a range of applications including ceramics, phosphors and metallurgy. In ceramic applications yttrium compounds are used in abrasives, bearings and seals. It is also used in wear- and corrosion-resistant cutting tools and has applications in high-temperature superconductors and metal alloys.
The growing strategic importance of REE and scandium was reflected in their inclusion in the US Government’s 2018 list of 35 critical minerals. This list was an initial step toward ensuring reliable and secure supplies of minerals critical to the US economy and military3.
When reporting on REE, companies may, at times, use a broad subdivision of the group into Light Rare Earth Elements (LREE), Heavy Rare Earth Elements (HREE) and, occasionally, Medium Rare Earth Elements (MREE). These are not formal groupings and are not applied consistently across the industry. In Australia, companies use these groupings from time to time and usually provide information on which elements are included in each. It should also be noted that companies usually report REE content as rare earth oxides (REO) and yttrium oxide (Y2O3). Geoscience Australia also reports the rare earths inventory as REO+Y2O3. Conversion factors must be applied to each individual REO to determine REE metal content.
JORC Reserves
As at December 2018, Proved and Probable Ore Reserves of REO+Y2O3 reported in compliance with the JORC Code amounted to 2.84 Mt, an increase of 36% over 2017 (Table 1). These Ore Reserves do not include the approximately 17 kt of REO+Y2O3 that have been reported within Proved and Probable Reserves of heavy mineral sands that are not expected to be recovered. Ore Reserves of REO+ Y2O3 at Australia’s two operating mines, Mount Weld and Browns Range (Table 2), accounted for 60% of all Ore Reserves, which in turn account for 69% of Australia’s Economic Demonstrated Resources (EDR).
Table 1. Australia's Ore Reserves of REO+Y2O3, production and potential reserve life, 2010-2018.
| Year | Ore Reserves1(Mt oxide) | Production (Mt oxide) | Reserve Life2 (years) |
|---|---|---|---|
| 20183 | 2.84 | 0.0194 | 149 |
| 2017 | 1.92 | 0.017 | 113 |
| 2016 | 2.10 | 0.014 | 150 |
| 2015 | 2.12 | ||
| 2014 | 2.12 | ||
| 2013 | 2.15 | ||
| 2012 | 2.15 | ||
| 2011 | 0.64 | ||
| 2010 | 0.33 |
Mt oxide = million tonnes of rare earth oxide plus yttrium oxide.
No reserves were reported prior to 2010.
- The majority of Australian Ore Reserves and Mineral Resources are reported in compliance with the JORC Code, however, some companies report to foreign stock exchanges using other reporting codes, which are largely equivalent. In addition, Geoscience Australia may hold confidential information for some commodities.
- Reserve life is calculated by dividing the Ore Reserve by production. The resulting ratio is a snapshot in time that can only be used for general impressions because it is an average and it assumes (1) that production rates in the future will remain the same as those used in the calculation, (2) deposits deemed economic/uneconomic remain so in the future and (3) that depleted reserves are never replaced.
- After 31 December 2018, revised Ore Reserve estimates were completed in early 2019 for some deposits, which will result in the Australian Proved and Probable Ore Reserve tonnage increasing substantially. These 2019 Ore Reserves will be incorporated into Geoscience Australia’s REE assessment for the year ending 31 December 2019.
- Australian rare earths production is based on Western Australian production of concentrates from Mount Weld and from trial mining and processing at Browns Range.
Table 2. Ore Reserves and Mineral Resources of REO+Y2O3 reported in compliance with the JORC Code at operating mines in 2018.
| No. of Operating Mines1 | Ore Reserves2 (Mt oxide) | Measured and Indicated Resources3 (Mt oxide) | Inferred Resources4 (Mt oxide) | Mine Production5 (Mt oxide) | Reserve Life6 (years) | Resource Life 17 (years) | Resource Life 28 (years) |
|---|---|---|---|---|---|---|---|
| 2 | 1.71 | 2.12 | 1.37 | 0.019 | 90 | 112 | 184 |
Mt oxide = million tonnes of rare earth oxide plus yttrium oxide.
- The number of operating mines are those that operated for some period during 2018. Production in 2018 was almost entirely from Mount Weld with a minor contribution from the trial mining and processing operation at Browns Range.
- The majority of Australian Ore Reserves and Mineral Resources are reported in compliance with the JORC Code, however there are a number of companies that report to foreign stock exchanges using other reporting codes, which are largely equivalent. In addition, Geoscience Australia may hold confidential information for some commodities. Ore Reserves are as at 31 December 2018.
- Measured and Indicated Mineral Resources are inclusive of the Ore Reserves. Mineral Resources are as at 31 December 2018.
- Inferred Mineral Resources are as at 31 December 2018.
- Mine production is a Geoscience Australia estimate based on published company data.
- Reserve Life* = Ore Reserves ÷ Production.
- Resource Life 1* = (Measured + Indicated Resources) ÷ Production.
- Resource Life 2* = (Measured + Indicated + Inferred Resources) ÷ Production.
*Reserve and resource life for each mineral commodity is calculated by dividing the inventory by production. The resulting ratio is a snapshot in time that can only be used for general impressions because it is an average and it assumes (1) that production rates in the future will remain the same as those used in the calculation, (2) deposits deemed economic/uneconomic remain so in the future and (3) that depleted resources are never replaced.
Identified Resources
Economic Demonstrated Resources (EDR) of REO+Y2O3 were 4.12 Mt at the end of December 2018, up by 26% from 3.27 Mt at the end of 2017 (Table 3).
Australia had 33.99 Mt of REO+Y2O3 resources considered to be subeconomic at the end of 2018, an increase of 11% from the 30.56 Mt at the end of 2017 (Table 3).
Inferred Resources of REO+Y2O3 in 2018 were 26.15 Mt, 5% higher than the 24.81 Mt at the end of 2017 (Table 3).
Accessible EDR
Some mineral resources are inaccessible for mining because of environmental restrictions, government policies or because they occur within military lands or national parks. All of Australia’s EDR of rare earths are considered to be accessible (Table 3).
Table 3. Australia's identified resources of REO+Y2O3 and world figures (Mt oxide) for selected years from 1990-2018.
| Year | Demonstrated Resources | Inferred Resources2 | Accessible EDR3 | Australian Mine Production4 | World Economic Resources5 | World Mine Production6 | ||
|---|---|---|---|---|---|---|---|---|
| Economic (EDR)1 | Paramarginal | Submarginal | ||||||
| 2018 | 4.12 | 0.43 | 33.56 | 26.15 | 4.12 | 0.019 | 120 | 0.170 |
| 2017 | 3.27 | 0.35 | 30.21 | 24.81 | 3.27 | 0.017 | 121 | 0.131 |
| 2016 | 3.43 | 0.35 | 29.22 | 25.81 | 3.43 | 0.014 | 120 | 0.126 |
| 2015 | 3.44 | 0.35 | 29.22 | 26.19 | 3.44 | 130 | 0.12 | |
| 2014 | 3.19 | 0.58 | 31.1 | 23.24 | 3.19 | 140 | 0.11 | |
| 2013 | 3.19 | 0.58 | 31.1 | 23.24 | 3.19 | 143 | 0.117 | |
| 2012 | 3.19 | 0.42 | 31.14 | 22.33 | 3.19 | 115 | 0.106 | |
| 2011 | 2.07 | 0.41 | 34.48 | 25 | 2.07 | 114 | 0.13 | |
| 2010 | 1.83 | 0.35 | 34.48 | 24.19 | 1.83 | 114 | 0.13 | |
| 2009 | 1.65 | 0.37 | 34.48 | 24.56 | 1.65 | 95 | 1.33 | |
| 2008 | 1.65 | 0.36 | 34.3 | 20.17 | 1.65 | 84 | 1.97 | |
| 2007 | 1.13 | 0.7 | 26.1 | 24.4 | 1.13 | 84 | 0.13 | |
| 2006 | 0.5 | 2 | 12.2 | 12 | 0.1 | 89 | 0.1 | |
| 2005 | 0.5 | 2 | 12.2 | 12 | 0.1 | 89 | 0.1 | |
| 2004 | 0.5 | 2 | 12.2 | 12 | 0.1 | 88 | 0.1 | |
| 2003 | 0.2 | 2.3 | 11.6 | 7 | 0.1 | 89 | 0.1 | |
| 2002 | 0.3 | 2.8 | 11.2 | 7 | 0.1 | 88 | 0.09 | |
| 2001 | 0.3 | 2.4 | 10.9 | 6.2 | 100 | 0.09 | ||
| 2000 | 0.9 | 2.8 | 10.1 | 5.5 | 100 | 0.08 | ||
| 1995 | 1.0 | 3.5 | 10.6 | 4.0 | ||||
| 1990 | 0.3 | 6.8 | 1.6 | 85 | 0.06 | |||
Mt oxide = million tonnes of rare earth oxide (REO) plus yttrium oxide (Y2O3).
- Economic Demonstrated Resources (EDR) predominantly comprise Ore Reserves and most Measured and Indicated Mineral Resources that have been reported in compliance with the Joint Ore Reserves Committee (JORC) Code to the Australian Securities Exchange (ASX). In addition, some reserves and resources may have been reported to foreign stock exchanges using other reporting codes, which are largely equivalent to the JORC Code. Geoscience Australia may also hold some confidential data.
- Total Inferred Resources in economic, subeconomic and undifferentiated categories.
- Accessible Economic Demonstrated Resources (AEDR) is the portion of total EDR that is accessible for mining. AEDR does not include resources that are inaccessible for mining because of environmental restrictions, government policies or military lands.
- Mine production is a Geoscience Australia estimate based on published company data. Production data often have a higher level of certainty than reserve and resource estimates and, thus, may be presented with more significant figures.
- World economic resources of REO (Y2O3 not reported) and production of REO from Mineral Commodity Summaries 2019 published by the United States Geological Survey (USGS) and adjusted with Geoscience Australia data, unless otherwise stated.
- Australia’s resources of REE were not assessed for 2014. Australian resources shown in this table are those assessed for 2013.
Exploration Expenditure
Exploration expenditure data for rare earths are not reported by the Australian Bureau of Statistics.
Production
Australian production of rare earths in 2018 was almost 0.019 Mt (Table 1, Table 2, Table 3). It came predominantly from Lynas Corporation’s Mount Weld mine in Western Australia with output in 2018 reported as 18 556 t of REO. Concentrates from Mount Weld are processed at the Lynas Advanced Materials Plant in Malaysia to produce REO products. In addition, 2.6 t of rare earth carbonate was produced and exported to China by Northern Minerals Ltd from its pilot mining and processing operation at the Browns Range project in the Kimberley region of Western Australia.
World Ranking
According to estimates published by the United States Geological Survey (USGS) and modified by Geoscience Australia for Australian resources, world economic resources of rare earths in 2018 totalled 120 000 kt of REO (Table 4). Detailed global data are not available for yttrium but the USGS have reported that world economic resources of Y2O3 are estimated to be more than 500 kt4.
Table 4. World economic resources of rare earths 2018.
| Rank | Country1 | Economic Resources2 (kt REO) | Percentage of world total3 |
|---|---|---|---|
| 1 | China | 44 000 | 38% |
| 2 | Brazil | 22 000 | 19% |
| 3 | Vietnam | 22 000 | 19% |
| 4 | Russia | 12 000 | 10% |
| 5 | India | 6900 | 6% |
| 6 | Australia | 3660 | 3% |
| 7 | USA | 1400 | 1% |
| 8 | Malaysia | 30 | <1% |
| Others | 4400 | 4% | |
| Total | 120 000 |
kt REO = thousand tonnes of rare earth oxide content (excluding Y2O3).
- Estimates of economic resources for Myanmar, Burundi and Thailand are not available although production is reported by the USGS for each country.
- Source: USGS 5 and Geoscience Australia. National figures other than Australia are rounded.
- Percentages are also rounded and might not add up to 100% exactly.
World production of rare earths, based on USGS data and modified for Australian production, was estimated to be 170 000 t of REO in 2018 (Table 5). Australia was the world’s second-largest producer due to output from Lynas Corporation’s Mount Weld mine in Western Australia. Trial mining and processing at Northern Minerals Ltd’s Browns Range project, also in Western Australia, contributed a small quantity to Australia’s output. Detailed data for world production of yttrium are not available. The USGS comments that world production of Y2O3 was almost entirely from China and was estimated at between 5000 and 7000 t 6.
Table 5. World production of rare earths 2018.
| Rank | Country | Production1 (kt REO) | Percentage of world total2 |
|---|---|---|---|
| 1 | China | 120 | 72% |
| 2 | Australia | 19 | 11% |
| 3 | USA | 15 | 9% |
| 4 | Myanmar | 5 | 3% |
| 5 | Russia | 2.6 | 2% |
| 6 | India | 1.8 | 1% |
| 7 | Brazil | 1 | <1% |
| 8 | Burundi | 1 | <1% |
| 9 | Thailand | 1 | <1% |
| 10 | Vietnam | 0.4 | <1% |
| 11 | Malaysia | 0.2 | <1% |
| Total | 170 |
kt REO = thousand tonnes of rare earth oxide content (excluding Y2O3).
- Rare Earth Element production based on the Rare Earth Oxide equivalent content of products.
- Percentages are also rounded and might not add up to 100% exactly.
- Includes production from Mount Weld and the Browns Range pilot plant. Source: USGS7, and company reports. National figures other than Australia are rounded.
Industry Developments
Current interest in REE is shown by the range of projects located in the Northern Territory and most Australian states (Figure 1). This section highlights recent company exploration and development-related activities. Companies use a range of units to report tonnage and grade and these have generally not been converted from the original source material. All reported reserves and resources are compliant with the JORC Code unless otherwise stated.
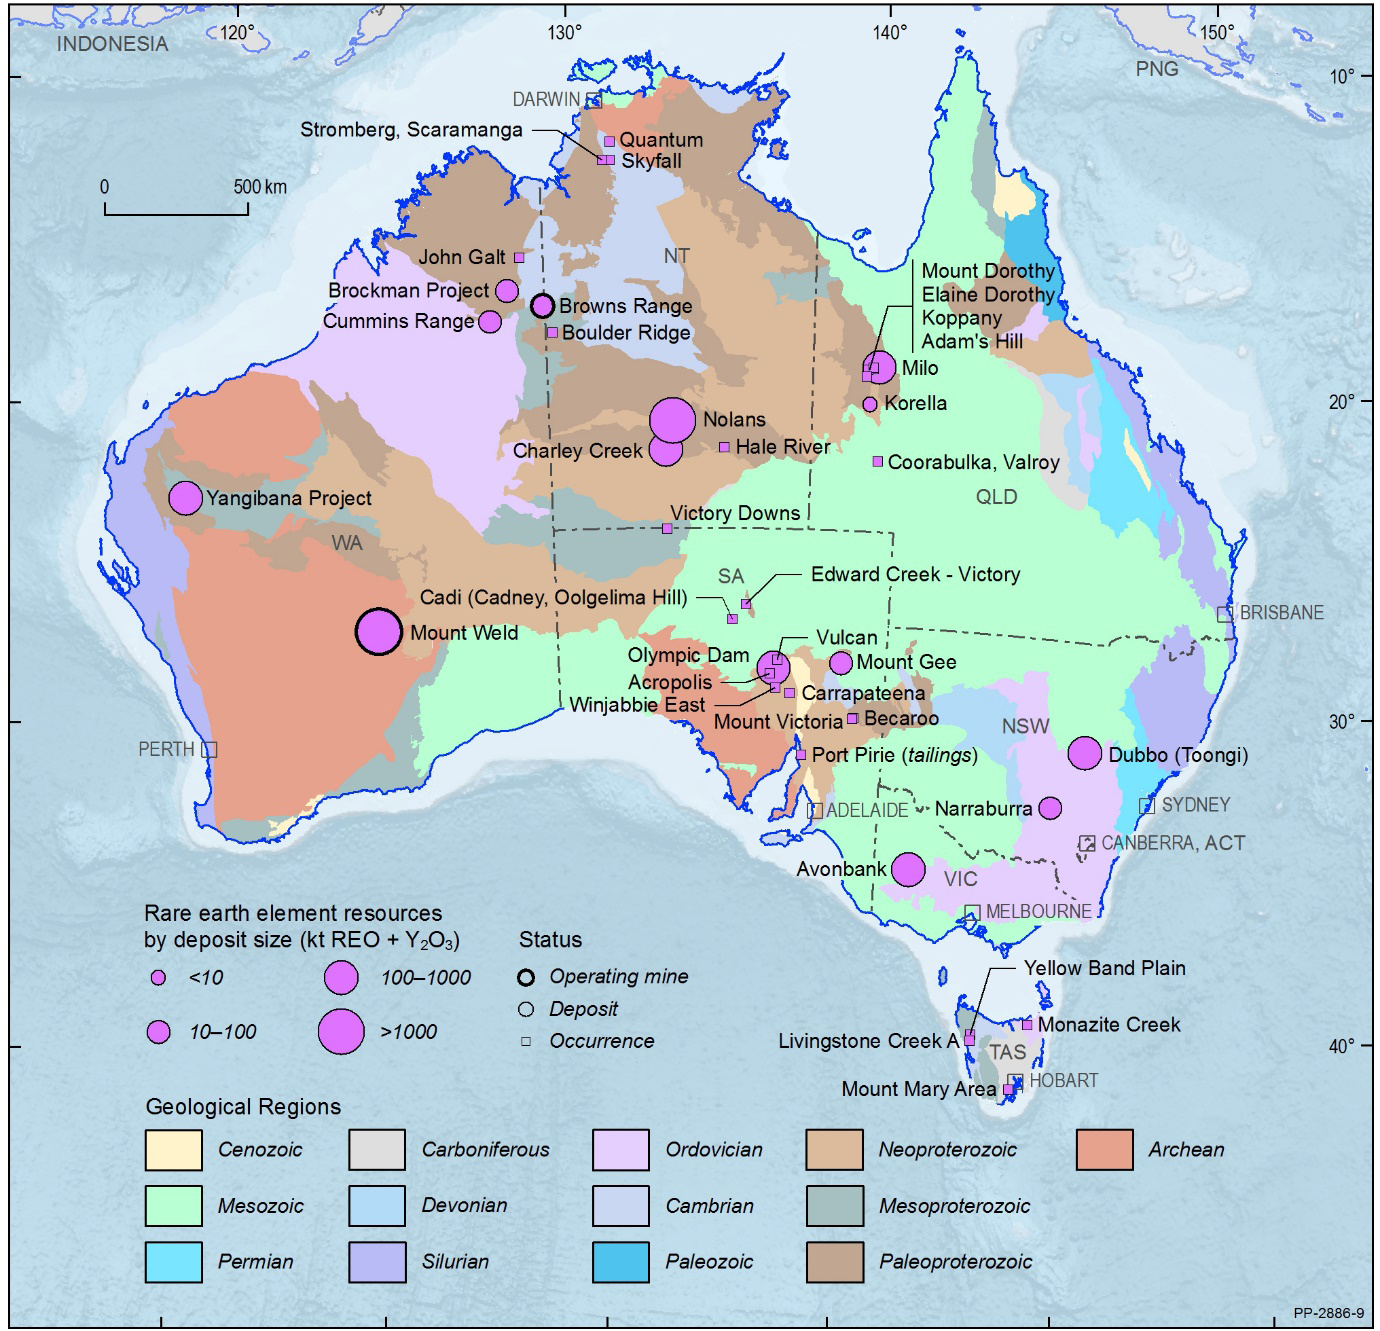
Figure 1. Australian rare earths deposits as at 31 December 2018.
Mt REO+Y2O3 = million tonnes of rare earth oxide (REO) and yttrium oxide (Y2O3). Resource size is based on total resources (Measured + Indicated + Inferred, inclusive of Ore Reserves). Note: Mount Gee (Inferred Resource only) is currently not accessible.
Dubbo (Toongi) Project: Alkane Resources Ltd’s Dubbo Project, located at Toongi, 25 km south of Dubbo, is operated by its wholly-owned subsidiary Australian Strategic Materials Ltd. Toongi is associated with a hydrothermally altered, pipe-like alkaline intrusion8 and has significant in-ground resources of zirconium, hafnium, niobium and REE including yttrium.
Alkane reported that as at 30 June 2018 the Dubbo Project had a Proved Reserve of 18. Mt @ 1.85% ZrO2, 0.04% HfO2, 0.44% ZrO2, 0.03% Ta2O5, 0.14% Y2O3 and 0.74% total rare earth oxides (TREO9)10. These reserves are included in a Measured + Inferred Mineral Resource of 75.18 Mt @ 1.89% Zr02, 0.04% HfO2, 0.44% ZrO2, 0.03% Ta2O5, 0.14% Y2O3, and 0.74% TREO.
The Company also reported in June 2018 that the project had an estimated 20-year life and that all key state and federal approvals and licences required for plant construction and start of mining had been received11. In addition, they said that the project could be implemented in either a single stage (1 Million tonne per annum (Mtpa) plant feed) or via two stages (0.5 Mtpa each). Offtake agreements for Dubbo products are being sought as a precursor to gaining finance but progress is being hampered by prevailing unsatisfactory prices12.
Narraburra Prospect: Previous exploration of the area covering the Narraburra Prospect focussed on the search for gold and base metals. Assessment of past exploration results suggested that the area had potential for the occurrence of REE and rare metals13. Capital Mining Ltd explored the Narraburra Intrusive Complex which includes peralkaline and alkaline granitic intrusions on the western margin of the Springdale Rift.
In 2011, the company reported an Inferred Resource of 73.2 Mt @ 1250 g/t ZrO2, 327 g/t REO, 146 g/t Y2O3, 45 g/t HfO2, 126 g/t ZrO2, 54 g/t Ga2O3, 61 g/t ThO2, and 118 g/t Li2O14. Resources and Geoscience New South Wales15 reproduced these estimates and also noted that they are hosted in deeply weathered and fresh leucogranite.
In December 2017, Paradigm Resources Pty Ltd was granted approval by the New South Wales Planning and Environment Department to undertake exploration activity on EL8436 which covers the Narraburra prospect.
Boulder Ridge Project: Northern Minerals Ltd’s Boulder Ridge project is located in the Tanami region some 100 km southeast of the company’s Browns Range project (located in Western Australia). The company noted that exploration at Boulder Ridge in the 1970s and 1980s recorded high TREO grades in rock-chip samples. In 2013, they undertook initial reconnaissance geological mapping and rock-chip sampling.
Sampling was not systematic but aimed at broadly delineating the extent of mineralisation and the distribution of REOs. Of the 19 samples collected, 17 returned assays of greater than 1% TREO with grades ranging from 0.003% to 12.284% TREO16. A further program of soil, rock-chip and channel sampling returned encouraging results with TREO grades for rock chip samples ranging from 0.79 ppm to 9.45 ppm TREO, channel samples ranged from 0.66 ppm to 4.91 ppm TREO and for soil samples the range was from150.5 ppm to 440.9 ppm TREO17.
Charley Creek Project: Crossland Strategic Metals Ltd (changed from Crossland Uranium Mines Ltd in 2013) targeted REE mineralisation in monazite- and xenotime-bearing alluvial sands at Charley Creek, located 110 km northwest of Alice Springs. Basement rocks of the Arunta Block underlie the area. These are overlain by the mineralised Quaternary alluvial gravels and sands that the Company interprets as outwash fans derived from the older basement and which also have elevated grades of uranium and thorium.
In 2012, Crossland announced an initial resource for the Cattle Creek and Western Dam prospects18. At Cattle Creek, an Indicated Mineral Resource of 249.9 Mt @ 280 ppm TREO contained 17 600 t of xenotime, 97 200 t of monazite and 124 650 t of zircon and an Inferred Mineral Resource of 353.21 Mt @ 291 ppm TREO contained 26 450 t xenotime, 141 075 t monazite and 183 750 t of zircon. At Western Dam, the Indicated Mineral Resource totalled 136.96 Mt @ 322 ppm TREO with 9675 t of contained xenotime, 63 700 t of monazite and 70 930 t of zircon and an Inferred Mineral Resource of 65.232 Mt @ 281 ppm TREO for contained xenotime of 4240 t, 26 160 t of monazite and 36 230 t of zircon. The Company also noted that 18.3% of the TREO are HREOs, 5.8% are MREOs and 75.9% are LREOs19.
The results of a project scoping study in 2013 indicated potential for the resource to support a mine life in excess of 20 years with a capital cost at that time of $156 million20. Despite a drilling program being completed in 2014, budgetary constraints meant that samples were not submitted for analysis until 2016. A further program of drilling totalling a proposed 3675 m was undertaken in early 201921. An updated resource estimate for Charley Creek is expected to be completed by August 201922.
Hale River Prospect: REE enrichment at Hale River, about 150 km east of Alice Springs, was first identified by the Northern Territory Geological Survey in 2006. Mineralisation occurs in dykes and the highest grade sample returned 1.66% REO and Y2O3. Kidman Resources Ltd undertook a program of rock-chip sampling of siliceous, dark, dyke rocks in late 2010 that resulted in the number of anomalous REE-bearing dykes increasing from four to eight as well as increasing the lateral extent of some previously known zones.
Samples from this program returned grades ranging from 0.32% to 0.86% TREO+Y2O3. Copper mineralisation also occurs with grades ranging from 0.8% to 30.5% Cu23. A second rock-chip sampling program extended the Main Dyke Zone and the Northern Dyke Zone by about 1.2 km. Sample grades from this program ranged from 0.33% to 0.89% TREO+Y2O3. Copper enrichment was again recorded but Kidman said that the REE-Cu relationship was not systematic and they considered the copper resulted from a later mineralising event24.
The company planned a 15-hole drilling program, subject to approval from all authorities but, although approvals were received, there appears to have been no drilling carried out. Kidman disposed of its interest in the Hale River tenements in the December Quarter of 201425.
Nolans Project: This project was previously known as Nolans Bore and is based on an REE-phosphorus-uranium deposit, discovered in 1995, in the Arunta Region of the Northern Territory about 135 km northwest of Alice Springs. The main REE-bearing minerals at Nolans are fluorapatite, allanite and monazite. Arafura Resources Ltd has explored the deposit since 2000 and they report it is a hydrothermal stockwork vein-style deposit hosted in Paleoproterozoic metamorphosed igneous and sedimentary rocks26.
Ongoing exploration results and resource estimates were regularly reported and planning for development progressed. In 2017, a detailed review of geological and geochemical data resulted in a new mineral resource estimate. While the company said that there was no material change to the resource tonnages, the study revealed the consistent nature of the NdPr distribution across the deposit and the abundance of P2O5 material they considered best suited to the project’s proposed production flow sheet. The revised mineral resource estimate was Measured Resources of 4.9 Mt @ 3.2% TREO, 13% P2O5 with 26.15% of TREO being NdPr; Indicated Resources of 30 Mt @ 2.7% TREO, 12% P2O5 with 26.4% of TREO being NdPr and an Inferred Resource of 21 Mt @ 2.3% TREO, 10% P2O5 with 26.5% of TREO being NdPr 27.
In February 2019, Arafura released the results of a Definitive Feasibility Study (DFS) for Nolans. Principal findings were that the project could support an operation with a 23-year mine life and an annual concentrate production of 293 000 t. Products would include 13 343 tonnes per annum (tpa) TREO equivalent, 4357 tpa NdPr Oxide, 135 808 tpa merchant-grade phosphoric acid as well as cerium hydroxide and high-purity mixed middle-heavy rare earth carbonate.
Underpinning the DFS are Ore Reserves of 19.2 Mt @ 3.0% TREO, where NdPr is 26.4% of TREO, and 13% P2O5. Of this total, Proved Reserves are 4.3 Mt @ 3.1% TREO (with NdPr 26.1% of TREO) and 13% P2O5 and Probable Reserves are 14.9 Mt @ 2.9% TREO (with NdPr 26.5% of TREO) and 13% P2O5. Mineral resources on which these reserves were based are the 2017 estimates referred to above28.
Following the release of the DFS the Company renewed efforts to secure offtake agreements. Currently it has two offtake Memorandum of Understandings (MOUs) with potential Chinese customers and is in the process of negotiating MOUs with other end users in China, as well as in Japan, South Korea and Europe29.
Quantum Prospect: Territory Uranium Company Ltd (now Spectrum Metals Ltd) announced the intersection of uranium-REE-gold mineralisation in drilling at the Quantum prospect in the Pine Creek region, approximately 120 km south of Darwin. The discovery hole, TDD8, had 5 m @ 1.09% REE (excluding Ce and La) from 248 m down-hole, 7 m @ 55 ppm U3O8 from 246 m down-hole, 12 m @ 0.52 g/t Au from 246 m down-hole and 10 m @ 2.1 g/t Ag from 246 m down-hole30.
The company subsequently released a more detailed analysis of the REE mineralisation in TDD8, which is also associated with sulphides and fluorite. The intersection was 33 m @ 1.76% TREE from 246 m and included 6 m @ 6.55% TREE from 248 m and 1 m @ 9.67% TREE from 251 m31. Other results also increased the REE intersection in TDD8 to 50 m @ 1.55% TREO from 245 m down-hole. A second diamond drill hole, TDD9, returned an intersection of 2.3 m @ 2.75% TREO of which 14.9% of the REO was Nd+Pr+Dy32. Additional holes to the south and east returned encouraging grades and further drilling aimed at testing the strike extent of mineralisation was undertaken.
In its 2012 Annual Report, Territory Uranium noted that it had decided to suspend work on the Quantum prospect in order to concentrate on its other REE prospects33. In the December Quarter 2016, Spectrum Rare Earths (now Spectrum Rare Metals Ltd) relinquished tenement EL25229 which covered the Quantum prospect34.
Skyfall Prospect: Skyfall is located about 140 km west of Katherine in the Daly region and its REE mineralisation is mostly clay-hosted. In 2013, Territory Uranium Resources Ltd reported that rock-chip samples from Skyfall returned assays of 1.25% TREO, 0.81% TREO and 0.48% TREO35. In 2014, Spectrum Rare Earths Ltd (formerly Territory Uranium Resources Ltd) announced the results from sampling at two trial pits, which included a highest assay of 1.58% TREO that had 3540 ppm Nd2O3 and 477 ppm Dy2O3 in Trial Pit 236. The company later reported that it had identified flat-lying, generally clay-hosted REE mineralisation ranging in thickness from 0.9 m to 4.3 m with grades between 0.17% and 0.8% TREO37.
Benchtop-scale testing produced a rare earth carbonate product in which LREO made up 55.1% of REO and 44.9% were HREO38. Total REO in the carbonate product was 44.5%39. Spectrum announced that laboratory testing of Skyfall ore indicated that fine crushing created treatment issues by reducing the grainsize to un-floatable sizes and that the crandallite mineral group may be better disaggregated by high-pressure water jets and ultrasonic treatment. Analysis of heavy fractions separated in this way indicated that the mineralised component was crandallite-florencite, florencite-kaolin and florencite-goethite40.
Following a major review of the project and for a number of reasons, including the complexity of the mineralisation and its very fine grain size, the company decided not to pursue further activity and to relinquish the associated tenements41.
Stromberg and Scaramanga Prospects: The Stromberg prospect is located on the western margin of the Pine Creek basin in the Daly region of the Northern Territory and is some 10 km west-northwest of the Skyfall prospect. Scaramanga is about 5 km north of Stromberg.
In 2011, Territory Uranium Resources Ltd reported that re-sampling of RC drill samples identified a zone of HREE enrichment with a best intersection of 7 m @ 1% TREO42. The company later announced that drill intersections from Stromberg included 5 m @ 0.43% TREO and 3 m @ 0.52% TREO and from Scaramanga, first-pass drilling yielded 2 m @ 0.12% TREO and 5 m @ 0.1% TREO43. Further diamond drilling at Stromberg in 2013 returned intersections including 4.2 m @ 0.93% TREO, 3.0 m @ 0.59% TREO and 2.5 m @ 0.32% TREO44.
Subsequently, the company directed exploration to the assessment of the Skyfall prospect. Territory Uranium Resources Ltd changed its name to Spectrum Rare Earths Ltd and then to Spectrum Rare Metals Ltd.
Andy’s Hill Prospect: Hammer Metals Ltd reported drilling three holes on the Andy’s Hill prospect, some 60 km southeast of Mount Isa, to test geophysical anomalies that they considered were indicative of IOCG mineralisation. One hole (AH-001), drilled in 2011, intersected 298 m @ 0.1% Cu from 119 m down-hole. It also had elevated cerium and lanthanum values. From 260 m down-hole, an intersection of 95 m @ 1239 ppm Ce and 960 ppm La was reported45. Later drilling to the south of AH-001 returned 14 m @ 0.2% Cu, 2469 ppm Ce and 1955 ppm La from 63 m down-hole in AHRC00346.
Coorabulka and Valroy Occurrences: Krucible Metals Ltd announced in January 2012 that it had identified REE in nodules at Coorabulka located about 300 km south-southeast of Mount Isa. Assays from surface nodules returned grades of 946 ppm Y, 3440 ppm Nd, 195 ppm Dy, 107 ppm Eu, 274 ppm Gd, 922 ppm Pr and 496 ppm Sm. An application for an exploration permit was lodged47 and EPM 19285 was granted in 2013. The company noted that samples also returned significant strontium, barium and phosphate grades48.
Further reconnaissance surface sampling 1 km from the original discovery returned values up to 0.62 kg/t Dy2O3, 4.49 kg/t Nd2O3, 1.07 kg/t Pr2O3 and 3.16 kg/t Y2O3. Associated with these results were anomalous strontium values of up to 9.47% Sr49. Costeaning at Coorabulka in 2014 indicated that the mineralised nodules may be a surface feature up to 0.5 m thick, overlying clay of the Allaru Mudstone which is not considered prospective50.
Valroy adjoins Coorabulka, and portable XRF testing identified anomalous REE, Sr, P and Pb in surface lag samples51. Krucible later reported assays from these samples returned strongly anomalous values up to 307 ppm Cu, 1500 ppm Ce, 357 ppm Pb, 2.87% Sr, 2.78% P (6.37% phosphate), 235 ppm Pr, 894 ppm Nd, 107 ppm Sm, 254 ppm Y and 734 ppm Zn52. Following a review of the Company’s exploration activities by a new management team, the Coorabulka and Valroy tenements were relinquished in July 201553.
Elaine Dorothy Prospect: Elaine is located about 5 km south of the historic Mary Kathleen uranium mine in northwest Queensland. In 2010, China Yunnan Copper Australia Ltd (name changed to China Yunnan Copper Resources Ltd in 2011) reported encountering REE mineralisation in the prospect in three diamond drill holes.
Intersections included 3.5 m @ 1.60 kg/t U3O8 and 3.81% TREO, which included 1 m @ 3.99 kg/t U3O8 and 7.56% TREO54. This drilling was followed by the release of an Inferred Resource estimate for the deposit of 83 000 t @ 283 ppm U3O8 and 3236 ppm TREO at a cut-off grade of 200 ppm U3O855. A later hole drilled about 200 m from the resource intersected copper-cobalt, REE and uranium mineralisation with REE intersections including 25 m @ 0.07 kg/t U3O8 and 2043 ppm TREO from 69 m down-hole and 13 m @ 0.09 kg/t U3O8 and 2550 ppm from 149 m down-hole56.
The prospectivity of the area increased with mineralised intersections at the Elaine 2 and Elaine 3 prospects, 1 km southeast of Elaine 1. At Elaine 2, 19 m @ 2050 ppm TREO, 0.17 kg/t ThO2 and 0.04 kg/t U3O8 occurred in hole MKED024. In MKED027, an intersection of 34 m @ 2135 ppm TREO, 0.18 kg/t ThO2 and 0.03 kg/t U3O8 was reported. At Elaine 3, an intersection of 22 m @ 1633 ppm TREO, 0.22 kg/t ThO2 and 0.03 kg/t U3O8 was recorded57.
In July 2012, the company released a new copper-gold resource estimate for Elaine 1. However, REE (Ce, La, Nd) and uranium were not included in the estimate because the company stated that they did not meet the requirement of reasonable prospects for eventual economic extraction58. Hammer Metals Ltd undertook further exploration for copper-gold mineralisation at the prospect.
Mount Dorothy Prospect: The Mount Dorothy prospect is located 20 km southwest of Mary Kathleen. In 2011, China Yunnan Copper Australia Ltd reported an intersection of 16 m @ 1249 ppm HREE59 plus yttrium from a depth of 71 m in a diamond drill hole at Mount Dorothy60. Further drilling yielded 10 m @ 1099 ppm TREO+Y2O3, 1.6 m @ 1475 ppm TREO+Y2O3 (ended in mineralisation) and in a second hole, MDD011, 6 m @ 1045 ppm TREO+Y2O3, 0.17% Cu, 196 ppm Co, 10g/t Ag. Hole MDD011 also encountered significant copper-cobalt mineralisation.
The company commented that the yttrium and REO mineralisation appeared to be associated with secondary copper-cobalt mineralisation and possibly with mineralised breccia61. A soil-sampling program at Mount Dorothy in 2015 returned a single location with a high copper assay resulting in the Company downgrading the prospect62.
Koppany Prospect: Hammer Metals Ltd announced that a review of its drilling database had indicated potential for the Koppany prospect, about 2 km southeast of Mary Kathleen, to host REE mineralisation. This assessment highlighted the presence of REE and copper in diamond drill holes that had been drilled to test a separate sulphide alteration zone. REE were not specifically targeted in this drilling but intersections included 158 m @ 0.39% LREO from 76 m down-hole, including 12 m @ 2% LREO from 156 m, in hole KOPD005 and 121 m @ 0.38% LREO from 142 m down-hole, including 22 m @ 0.79% LREO in hole KOPD007. The company noted that peak values over any one metre interval included 1.7% Ce, 1.15% La, 0.26% Nd and 0.13% Pr63.
Korella Deposit: The Korella deposit, located about 150 km southeast of Mount Isa, was previously referred to as the PHM South deposit. Krucible Metals Ltd applied for two mining leases over the deposit in June 2010 and noted that, at a 25% P2O5 cut-off grade, Korella had a resource estimated at 5 Mt @ 30.8% P2O564.
In January 2011, Krucible announced that analyses of samples from old drill holes at Korella had shown anomalous yttrium values with up to 7 m @ 0.13% Y from a depth of 12 m65. Further sampling suggested that a shallow zone of yttrium enrichment occurs immediately above the high-grade phosphate resource. Intersections included 3 m @ 2450 ppm Y, 3 m @ 2080 ppm Y and 3 m @ 1390 ppm Y66.
An initial Inferred Resource of 4.2 Mt @ 746 g/t Y was reported in April 2011 with the yttrium occurring in xenotime67. Ongoing assessment resulted in increases in resources such that by 2013 the Inferred Resource was 7.03 Mt @ 0.7 kg/t Y2O3 (at a lower cut-off grade, the resource was 13.72 Mt @ 0.7 kg/t Y2O3) and drilling had also intersected other REE including 1 m @ 831 ppm Nd and 336 ppm Sc and, in another drill hole, 2 m @ 294 ppm Dy68.
Krucible sold the Korella phosphate deposit to Australian New Agribusiness & Chemical Group Ltd (ANB) in 2014 and was subsequently invited to submit proposals for joint development of the Korella phosphate and the REE resources. ANB started trial mining of Korella in 2015 with the aim of mining 20 000 t of phosphate and encountered shallow (<1 m depth) yttrium with estimated grades of between 1000 and 2200 ppm69.
ANB went into voluntary administration and was subsequently placed in liquidation in 2016. The Korella deposit remains undeveloped.
Milo Deposit: The Milo deposit is located 20 km east of Cloncurry and is part of GBM Resources Ltd’s Brightlands Project. It is an IOCG breccia-style deposit with a REE and yttrium halo. GBM reported that the base and precious metals occur in a dipping, north-south-trending breccia zone. The REE, yttrium and phosphate mineralisation encloses the base metal mineralisation.
The company reported an updated Inferred Resource in November 2012 of 176 Mt @ 0.75% P2O5, 260 ppm CeO2, 150 ppm La2O3, 80 ppm Nd2O3, 24 ppm Pr2O3, 12 ppm Sm2O3, 4 ppm Eu2O3, 10 ppm Gd2O3, 8 ppm Dy2O3, 5 ppm Er2O3,52 ppm Y2O3 and 9 ppm “others”. The outcome of a scoping study supported progressing the project to the pre-feasibility stage70.
In 2013, the company reported that a diamond drill hole in the Milo Western Gossan, located less than 1000 m from Milo, intersected 12 m of mineralisation with a grade of 0.43% Cu, 0.24 g/t Au, 120 ppm Mo, 143 ppm U, 250 ppm Co and 781 ppm REEYO71,72. Subsequently, the company identified the potential for the prospect to host graphite mineralisation73.
GBM noted in its 2016 Annual Report that Milo has a halo of REE-Y-P2O5 overprinting the base-metal mineralisation. It says that the REE zone is very continuous at grades of <200 ppm TREEYO, has a simple shape and width varying between 100 and 200 m74.
Acropolis Occurrence: Acropolis is located 25 km southwest of the Olympic Dam mine. Drilling by Minotaur Exploration Ltd encountered anomalous copper, uranium, molybdenum and gold values from about 1470 m and there was associated anomalous barium, lanthanum and cerium75. Subsequently Minotaur announced that the lanthanum and cerium occurs in a very fine grained phosphate mineral76.
Becaroo Prospect: In 2010, Pepinnini Minerals Ltd followed up the discovery of high-grade uranium assays from rock-chip sampling at the Becaroo prospect some 15 km northeast of the Croker Well deposit with limited drilling. Rock-chip samples returned assays to a maximum of 1200 ppm U3O8. Drill intersections included 10 m from 36 m down-hole @ 469 ppm U3O8, 582 ppm Ce, 606 ppm La, 204 ppm Y. A second hole returned 48 m from 40 m down-hole @ 340 ppm U3O8, 367 ppm Ce, 365 ppm La, 107 ppm Y. Other intersections had assays of up to 3580 ppm Ce, 3300 ppm La and 110 ppm Y77.
Cadi (Cadney, Oolgelima Hill) Occurrence: The occurrence of REE in drilling at Cadi, located east of Coober Pedy, was reported in drilling by BHP during exploration for IOCG mineralisation. Drill hole NC9202 returned anomalous REE with Ce+La grades up to 2.55% from the down-hole interval at 150–152 m78.
Carrapateena Deposit: The South Australian Department of State Development reported that drill hole CAR002 intersected 73 m @ 2.89% Cu and 0.4 g/t Au from 476–549 m, 58 m @ 0.94% Cu from 549–607 m, and 13 m @ 0.65% Cu from 607–654 m. They also noted assays for the intersection of 178 m (476–654 m) was 1.83% Cu, 0.64 g/t Au, 0.21% Ce, and 0.13% La79.
Edward Creek – Victory Occurrence: This occurrence is in central northern South Australia, 110 km southeast of Oodnadatta. Surface sampling returned anomalous uranium and REE with best results of 412 ppm U and 3.92% TREE+Y. Other results included grades of 1320 ppm Cu, 60.3 ppm U, 1250 ppm Co, 361 ppm Zn, 7.87% Mn and 0.56% TREE+Y80.
Mount Gee Deposit: Mount Gee is a uranium deposit, located 520 km north-northeast of Adelaide, formerly held by Marathon Resources Ltd. In 2005, the company reported that the deposit had an Inferred Resource of 51 800 t of La-Ce restricted to zones of >500 ppm U3O8. This resource estimate was based on historical drilling with high-grade REE intersections, including 5.8 m @ 3722 ppm Ce+La81. Subsequently, the South Australian Government announced in July 2011 that it would permanently protect the Arkaroola area, which includes Mount Gee. The Arkaroola Protection ACT 2012 came into force on 26 April 2012 thereby removing any possibility of future exploration or mining in the area and rendering the Mount Gee resource inaccessible.
Mount Victoria Occurrence: Samples from diamond drilling at Mount Victoria, located to the north of Crocker Well, returned significant grades of uranium and REE. Assays included 7 m from 10 m down-hole @ 4927 ppm U3O8, 1.57% LREO82 and 0.19% HREO83, 9 m from 14 m down-hole @ 2846 ppm U3O8, 0.89% LREO and 0.11% HREO, including 1 m @ 3665 ppm U3O8, 1.25% LREO and 0.14% HREO84.
Olympic Dam Deposit: The giant Olympic Dam IOCGU+Ag+REE deposit is located in the Gawler Craton about 560 km north of Adelaide. Mineralisation is hosted in hematite breccias, which occur in fractured granite and host REE in bastnasite, florencite, monazite, xenotime and britholite. Olympic Dam is principally an underground copper mine operated by BHP Ltd that has associated production of uranium, gold and silver. In addition to these commodities, the deposit hosts a variety of other elements, including REE, which are not recovered during processing. Hoatson et al85 note that a significant proportion of Australia’s Demonstrated Submarginal and Inferred Resources of REE occur in the Olympic Dam deposit with lanthanum (0.2% La) and cerium (0.3% Ce) the most abundant.
Port Pirie Tailings: Davidite concentrates produced at the Radium Hill mine between 1954 and 1961 were treated at Port Pirie where an estimated 1500 t of REE remain in tailings. REOs in these tailings are reported to be: scandium (3%), yttrium (16%), lanthanum (38%), cerium (24%), praseodymium (0.7%), neodymium (1.8%), samarium (0.2%), europium (0.07%), gadolinium (0.4%), terbium (0.5%), dysprosium (3.3%), holmium (0.7%), erbium (3.8%), thulium (0.7%), ytterbium (6.5%) and lutetium (0.6%)86. The Department of State Development noted that after decommissioning of the plant in 1962 some minor operations took place, including the extraction of REE, but all infrastructure at the site was demolished in 2006.
Victory Downs Occurrence: Stream sediment sampling at Victory Downs on the Northern Territory/South Australia border returned heavy mineral content averaging 38% with zircon levels of 1.6% to 8.6%. Yttrium (100 ppm), cerium (800 ppm) and lanthanum (600 ppm) were detected in 15 samples on the western side of a granite outcrop87.
Vulcan Prospect: The Vulcan prospect is located about 30 km north of the Olympic Dam mine. In late 2009, Tasman Resources Ltd announced the discovery of IOCGU mineralisation at Vulcan in the first hole drilled88. Mineralisation and alteration typical of IOCGU and consistent with that at Olympic Dam were reported from later drilling.
In reporting the results of diamond drill hole VUD 003, Tasman noted that minor elements, including lanthanum and cerium, which they said are normally associated with IOCGU deposits such as Olympic Dam, were strongly anomalous but grades were not reported89. Subsequently, Tasman noted that individual sections of the first four drill holes returned assays for copper, uranium, gold, lanthanum and cerium that are equivalent to the high-grade ore mined at Olympic Dam90.
Later, under a Joint Venture/Farm-In Agreement with Rio Tinto Exploration, additional diamond drilling was done and drill hole VUD 15 returned lanthanum and cerium mineralisation in an intersection of 145 m (from 1191 m) @ 0.49% Cu, 0.26 ppm Au, 1.21 ppm Ag, 0.06 kg/t U3O8, 390 ppm La and 610 ppm Ce. A higher grade zone within that intersection was 52 m (from 1284 m) @ 0.87% Cu, 0.46 ppm Au, 1.13 ppm Ag, 0.07 kg/t U3O8, 970 ppm La and 1420 ppm Ce. This zone included 21 m (from 1310 m) @ 1.69% Cu, 1.05 ppm Au, 1.90 ppm Ag, 0.09 kg/t U3O8, 2450 ppm La and 3520 ppm Ce91.
Subsequently, Rio Tinto Exploration withdrew from the project in 2014. Ground gravity surveying adjacent to the Vulcan discovery identified several new prospects. Tasman is looking to explore at least one of these either in a joint venture or in its own right92.
Winjabbie East Prospect: The Winjabbie East prospect was explored for IOCG mineralisation by Argo Exploration Ltd and later by that company in joint venture with Xstrata Mount Isa Mines Ltd. Following previous drilling by Argo, the joint venture drilled three diamond drill holes on the prospect in 2011. They reported patchy copper, gold and silver mineralisation in skarn-altered basement rock with cerium (up to 0.2%) and lanthanum (up to 0.15%) coinciding with some enriched copper intersections in the first hole WJE001. The best cerium-lanthanum mineralisation occurred between 787 m and 791 m down-hole93.
Two further deep diamond drill holes encountered REE mineralisation. Hole WJE002 had lanthanum and cerium in altered basement rocks with the highest 1 m interval returning 0.34% Ce, 0.17% La and 175 ppm Y from 772 m down-hole. Rare earth elements in WJE003 occurred in a similar environment with the best interval being 2 m @ 0.16% La, 0.32% Ce and 129 ppm Y from 759 m down-hole94.
Tasmania has no recorded significant REE mineralisation. A review of REE in Tasmanian rocks noted anomalous values of 18 ppm to 2182 ppm TREE95. Bottrill noted that Cyprus Minerals undertook random sampling of diamond drill cores from the Cygnet porphyries in the Mount Mary area and identified some anomalous results, with one sample assaying in excess of 0.07 wt% TREE+Y. However, the results were not considered adequate to support further work.
Mineral Resources Tasmania show three occurrences of alluvial REE, all in association with tin, on a map of alluvial mineral occurrences in Tasmania96. Two of these are in northwest Tasmania. Livingstone Creek A is in an area of alluvial workings at the confluence of Livingstone Creek and the Stanley River and Yellowband Plain is some 15 km to the north. The third location is Monazite Creek in northeast Tasmania in the Scottsdale area.
Avonbank Project: WIM Resource Pty Ltd’s Avonbank heavy mineral sand project is located about 15 km north of Horsham and is the first Australian mineral sand project targeting the production of REE products in addition to traditional mineral sand components. Successful development of this aspect of the project would be an important milestone in the Australian REE sector. A brief overview of REE in heavy mineral sands deposits in Australia is at the end of this review.
The Avonbank deposit is hosted by the Loxton-Parilla Sands and has an average thickness of 10 m. In October 2018, the company announced a maiden Ore Reserve for the project of Proved and Probable Reserves of 311.8 Mt @ 19.9% zircon, 16.9% rutile, 8.6% leucoxene, 27.0% ilmenite, 2.0% monazite and 0.6% xenotime97. WIM stated that a premium rare-earth concentrate would be produced from monazite and xenotime using conventional processing technology. This concentrate would contain about 51 wt% TREE+Y and would include praseodymium, neodymium, dysprosium and terbium. Pilot studies have indicated that a rare-earth carbonate could be produced.
Brockman Project: Hastings Technology Metals Ltd acquired the Brockman project, located 18 km south of Halls Creek in the Kimberley region, in 2010 and for a period referred to it as the Hastings project. The deposit is hosted in the Niobium Tuff, a fine grained volcaniclastic unit at the base of the Brockman Volcanics. Hastings note that the Niobium Tuff can be traced for 3.5 km, has a thickness of up to 35 m and is vertical to steeply east-dipping98.
Mineral resource estimates have been reported for the main mineralised area and a southern extension. A drilling program by Hastings in 2011 over the central area of the Niobium Tuff culminated in an upgraded resource estimate to: Indicated Resources of 27.1 Mt @ 8913 ppm ZrO2, 3545 ppm Nb2O5, 182 ppm Ta2O5, 110 ppm Ga2O5, 318 ppm HfO2, 186 ppm Dy2O3,1120 ppm Y2O3 and 2103 ppm TREO; and Inferred Resources of 9.1 Mt @ 8914 ppm ZrO2, 3547 ppm Nb2O5, 182 ppm Ta2O5, 110 ppm Ga2O5, 318 ppm HfO2, 186 ppm Dy2O3, 1120 ppm Y2O3 and 2100 ppm TREO99.
In early 2013, Hastings announced that reconnaissance mapping and sampling had identified mineralisation to the south of these resources. Following testing of two radiometric anomalies, the company reported that the Levon target, 1.3 km south of the resource, returned rock-chip sample assays including 4281 ppm TREO and 5237 ppm TREO. At the Haig target, samples almost all exceeded 2100 ppm TREO100. Initial drilling at Levon and Haig intersected mineralisation, with Levon returning intersections of 95 m @ 2770 ppm TREO, 800 ppm HREO and 78 ppm Dy2O3 and 95 m @ 2785 ppm TREO, 760 ppm HREO and 76 ppm Dy2O3101.
Subsequently, only limited work was done on the Brockman project as the company focussed attention on its Yangibana project but, based on drilling undertaken in 2014 in the southern area, Hastings reported an Indicated and Inferred Resource of 41.4 Mt @ 0.21% TREO which included 0.18% HREO and 0.36% Nb2O5 and 0.90% ZrO2102. At the end of 2018, Hastings said that it was continuing with the preparation of documents to support an application for a Mining Lease over the Brockman project103.
Browns Range Project: Northern Minerals Ltd’s Browns Range project is located 160 km southeast of Halls Creek, adjacent to the Northern Territory border. In 2018, mineral resources were announced for six deposits in the project area, namely Wolverine, Gambit, Gambit West, Area 5, Cyclops and Banshee.
As at 30 June 2018, resources in these deposits and stockpiles were: Indicated Resources of 4.59 Mt @ 0.71% TREO, 0.6 kg/t Dy2O3, 3.99 kg/t Y2O3, 0.09 kg/t Tb4O7 with 86% HREO104 for a contained TREO105 of 32 304 t; and Inferred Resources of 4.48 Mt @ 0.56% TREO, 0.46 kg/t Dy2O3, 3.18 kg/t Y2O3, 0.07 kg/t Tb4O7 with 86% HREO for a contained TREO of 25 001 t. Within these resources, Probable Reserves have been reported for the Wolverine (open-pit and underground) and Area 5 (open-pit) deposits totalling 3.293 Mt @ 6.78 kg/t TREO, 0.59 kg/t Dy2O3, 0.09 kg/t Tb4O7 and 3.94 kg/t Y2O3 for contained products of 22 339 t TREO, 1948 t Dy2O3, 288 t Tb4O7 and 12 969 t Y2O3106.
At the Dazzler prospect, about 15 km south of the Browns Range Pilot Plant, drilling in 2013 tested the Browns Range Metamorphics at the base of a scarp slope but returned limited mineralised intersections. However, in 2018 the company followed an alternative geological model and drilled from the top of the escarpment into the Gardiner Sandstone, previously regarded as non-prospective. Significant mineralisation was encountered and intersections reported included: 21 m @ 1985.4 ppm Dy2O3 and 2.15% TREO and 18 m @ 8627.2 ppm Dy2O3 and 9.10% TREO107. Subsequently an Inferred Resource estimate was released for Dazzler of 0.14 Mt @ 2.23%TREO, 2.08 kg/t Dy2O3, 12.79 kg/t Y2O3, 0.27 kg/t Tb4O7 and 93% HREO for a contained 3200 t TREO. The company noted that the grade of the resource is more than three times the average grade for the Browns Range project108.
In 2016, Northern Minerals commenced preliminary work on the construction of a pilot plant to process Browns Range ore and the plant was officially opened in July 2018. The first rare-earth carbonate was produced in October 2018 and, in December, the company reported that the first shipment of 2578 kg of this product had left the project site for customers in China109.
Cummins Range Deposit: This prospect is located 130 km southwest of Halls Creek. The Cummins Range intrusive is part of an alkaline intrusive complex which is mainly pyroxenite with a central plug of carbonatite. CRA Exploration Pty Ltd undertook initial exploration for REE at Cummins Range between 1978 and 1984 and limited drilling identified REOs in the Cummins Range carbonatite with drill samples returning grades of up to 7.81% REO over a 1 m interval110.
In 2009, Navigator Resources Ltd reported a revised Inferred Resource of 4.17 Mt @ 1.72% TREO, 11.0% P2O5, 187 ppm U3O8 and 41 ppm Th111. This was subsequently updated, in June 2012, to an Inferred Resource of 4.90 Mt @ 1.74% TREO 11.2% P2O5, 145 ppm U3O8 and 48 ppm Th at a 1.0% TREO cut-off grade112.
Following a re-assessment of the project data in 2015, the company considered that the cut-off grade used was too low and published a revised summary of the resource estimates and commented that Inferred Resource classification should only apply to cut-off grades of 2.5% TREOY113 or higher. At 2.5% TREOY the Inferred Resource was 687 kt @ 3.38% TREOY, 273 ppm U3O8, 68 ppm ThO2 and 11.6% P2O5114.
After a review of the property, Navigator relinquished the Cummins Range tenement in May 2017 without any further exploration or assessments. The prospect was recorded as being inactive by the Western Australia Government in April 2019115.
John Galt Deposit: The John Galt project is located 28 km south of Turkey Creek in the Kimberley region. Northern Uranium Ltd (name changed in February 2011 to Northern Minerals Ltd) noted that mineralisation was discovered in the 1970s when three REE mineralised zones were identified and 503 m of diamond drilling was completed in nine holes in what was referred to as the “Main Zone”. Rock-chip samples from the other two zones returned assays of between 4.5% and 17.8% TREO. An Inferred Resource of 52 000 t @ 0.35% REO was reported in 1992 by Noble Resources Ltd116.
No further drilling or fieldwork appears to have been done on the prospect until Northern Uranium was granted an exploration lease over the prospect in 2010117. Northern Uranium describes the mineralisation as hosted in the Red Rock Beds and occurring in a system of quartz-xenotime veins where the xenotime is either interstitial or in pods or thin veins within the quartz vein118. Based on an analysis of the historical drilling and surface sampling the company said that the principal composition of the John Galt mineralisation was: yttrium 67%, dysprosium 9%, erbium 7%, ytterbium 6% and terbium 1%119.
A high-resolution airborne magnetic and radiometric survey was flown by Northern Minerals in 2011. This survey, together with historical exploration data, was used to provide targets for a rock chip sampling program later in that year. Three mineralised zones—Main Zone, Gadolin and Ytterby—returned high grades with Main Zone samples assaying at up to 23.6% TREO. Gadolin assays were up to 18.6% TREO and Ytterby up to 1.4% TREO.
Further samples from talus in a valley directly below the Main Zone returned results ranging from 13.2% to 31.7% TREO. Dy2O3 grade in samples ranged from 1350 ppm to 36 791 ppm120. Additional rock chip sampling at the Main Zone was reported in 2015 when 99 samples collected at the top of the ridge averaged 1.47% TREO and 12 samples from the base of the ridge averaged 5.53% TREO121.
Activity at John Galt has been limited in recent years as company attention has focussed on developments at its Browns Range project. However, in 2016, Northern Minerals noted that John Galt was also being investigated for its base metals and graphite potential122.
Mount Weld Project: Lynas Corporation Ltd produces an REE concentrate from the Mount Weld mine, located 35 km south of Laverton, which is subsequently processed at the Lynas Advanced Materials Plant (LAMP) near Kuantan, Malaysia. The Mount Weld project area covers a near vertical carbonatite plug, called the Mount Weld Carbonatite, which intruded strongly deformed Archean volcanic and sedimentary rocks of the Laverton Tectonic Zone. The Mount Weld deposit is composed of a central high-grade core, referred to as the Central Lanthanide Deposit (CLD), and a surrounding mineralised halo, part of which was referred to as the Duncan Deposit.
In August 2018, Lynas released an updated Mineral Resource and Ore Reserve estimate for the project and noted that CLD and Duncan were now considered as part of the same mineralised system, although Duncan is of lower grade. The revised estimate (CLD and Duncan combined) resulted an increase of 138% over the previous estimate published in 2015123.
The new total Mineral Resource was 55.4 Mt @ 5.4% TREO for a contained 3 Mt TREO124. The updated Mount Weld Ore Reserve totalled 19.7 Mt @ 8.6% TREO for a contained 1.69 Mt TREO. The in-pit Proved Ore Reserve of 14.1 Mt @ 8.8% TREO had 20 200 ppm Nd2O3+Pr6O11, 300 ppm Dy2O3, 21 200 ppm La2O3 and 41 560 ppm CeO2. The grade of the in-pit Probable Ore Reserve of 5.1 Mt was slightly lower at 7.7% TREO with 17 500 ppm Nd2O3+Pr6O11, 430 ppm Dy2O3, 17 800 ppm La2O3 and 35 630 ppm CeO2. In addition, reserves in stockpiles were 0.5 Mt @ 10.6% TREO.
In the same report, Lynas noted that there are deposits surrounding the CLD and Duncan deposits but they are not included in these resources and reserves. The surrounding deposits are the Anchor, Crown, Coors, Swan and Emu deposits which contain niobium, tantalum, titanium and phosphate as well as REE. The company has previously referred to these as the Rare Metals Project for which it has reported an Indicated+Inferred Resource of 37.7 Mt @ 0.24% Ta2O5, 1.07% Nb2O5, 1.16% TREO, 0.3% ZrO2, 7.99% P2O5, 0.09% Y2O3 and 4.01% TiO2125.
The current open-pit mine, which has a life of about 25 years, is operated on a campaign basis, mainly on the CLD. Lynas claims it is the highest grade REE mine in the world126. Mining Campaign 3 commenced during the December Quarter 2018 and the CLD ore from this campaign will be blended with the Duncan ore, which was mined and stockpiled during Mining Campaign 2127.
In addition to the Mineral Resource and Reserve upgrade, Lynas reported significant operational achievements at the LAMP in the first half of the 2019 financial year including two consecutive months of 600 t per month NdPr production in September and October 2018. They also noted the successful start-up of their new Nd and Pr separation circuit128.
The Malaysian government undertook a review of the company’s Malaysia operations and released the results in December 2018. Key findings were that Lynas Malaysia is compliant with applicable laws; that its operations are low risk and that there were no breaches of the company’s operating licence. In December, however, in a separate development, the Malaysian Ministry for Energy, Science, Technology, Environment and Climate Change announced two new pre-conditions for the company’s licence renewal due on 2 September 2019 and future permission renewals relating to residue management. Lynas is appealing against one of these decisions129.
Yangibana Project: Hastings Technology Metals Ltd’s Yangibana project is located about 260 km northeast of Carnarvon. Exploration for REE at Yangibana was first done by Challenger Mining Corporation NL and Hurlston Pty Ltd between 1985 and 1991 when anomalous surface samples and drill intersections exceeding 5% TREE were recorded. The project area covers most of the Gifford Creek Ferrocarbonatite Suite. Hastings notes that a key feature of this rock suite in the Yangibana project area is the widespread occurrence of ironstone dykes that are spatially associated with the ferrocarbonatite intrusions. It is these ironstones that have historically been the focus of REE exploration in the area130.
In August 2014, Hastings announced a maiden Indicated and Inferred Resource for the Yangibana project of 3.36 Mt @ 13 400 ppm TREO131. Several subsequent resource estimates were then followed by an updated estimate in November 2018132. During this period, resources were reported from the Bald Hill, Frasers, Auer, Auer North, Yangibana, Yangibana West, Yangibana North, Simon’s Find, Gossan, Lion’s Ear, Hook and Kane’s Gossan deposits. The total Measured, Indicated and Inferred resource for the project was reported as 21.673 Mt @ 1.17% TREO with 0.39% Nd2O3+Pr6O11. In January 2019, Hastings released an updated Ore Reserve estimate that was 34% higher than that of July 2018133. The new Probable Ore Reserve was reported as 10.35 Mt @ 1.22% TREO, which included 0.43% Nd2O3+Pr6O11.
A DFS suggested that the established resources could support an initial mine life of 8 years with plans to produce up to 15 000 tpa of mixed rare-earth carbonates on site at Yangibana. It notes that the project has high NdPr to TREO ratio at 41% and that the metallurgical pilot test plant achieved a recovery of 75.6%. It also noted that there are three off-take MOUs signed with customers in China that cover 40% of the projected production volume134.
Subsequently, Hastings announced a fourth off-take MOU which, with the other three, would represent 73% of the planned mixed rare-earth carbonate production. This MOU was with Thyssenkrupp Raw Materials Gmbh135. In March 2019, the company announced that the project development capital cost reported in its DFS had been reduced by 4% to approximately $427 million136. In late June 2019, Hastings announced that the Australian Government’s Environmental Protection Authority had recommended environmental approval for the Yangibana project137.
Rare Earth Elements in Australian Heavy Mineral Sands Deposits
Rare earths-bearing minerals monazite and xenotime occur in many of Australia’s heavy mineral sand deposits and, up until the mid-1990s, monazite was produced from them and exported, mainly to Europe. A brief overview of these activities is given by Hoatson et.al (2011)138.
Following environmental issues in France relating to the disposal of toxic and radioactive waste generated in the processing of monazite, the French plant was closed. A second major obstacle to continued processing of monazite was the high cost of disposing of thorium produced during the process. France’s monazite imports stopped immediately causing Australian mine production to cease. Subsequently, monazite generated by heavy mineral sand mining was returned to the mine.
In recent developments, some companies are planning to restart Australian REE production from mineral sands deposits. Iluka Resources Ltd began a prefeasibility study in 2018 on the Wim 100 deposit near Horsham in Victoria. Also near Horsham, WIM Resources Pty Ltd announced its intention to produce an REE concentrate in conjunction with heavy mineral sand products from its Avonbank project in Victoria (see page 16).
Currently, REE occurring in heavy mineral sand resources make up around 6% of Australia’s inventory of REE resources.
Citation
Bibliographical reference: Huleatt, M.B., 2019. Australian Resource Reviews: Rare Earth Elements 2019. Geoscience Australia, Canberra. http://dx.doi.org/10.11636/9781925848441
References
1 Australian Resource Reviews: Scandium 2019.
2 Hoatson, D.M., Jaireth, S. and Miezitis, Y., 2011. The major rare-earth-element deposits of Australia: geological setting, exploration, and resources. Geoscience Australia, 204pp.
3 United States Government Federal Register, 2018. Final List of Critical Minerals 2018. A Notice by the Interior Department on 05/18/2018. Document 83 FR 23295.
4 United States Geological Survey, 2019. Mineral Commodity Summaries 2019. U.S. Geological Survey, 200p.
6 ibid.
7 ibid.
8 Resources and Geoscience New South Wales, 2018. Rare Earth Elements Opportunities in New South Wales, Australia. September 2018 pamphlet.
9 TREO is the sum of all rare earth oxides and excludes ZrO2, HfO2, Nb2O5, Ta2O5 and Y2O3.
10 Alkane Resources Ltd. Annual Report 2018.
11 Alkane Resources Ltd. ASX announcement 4 June 2018.
12 Alkane Resources Ltd9. Dubbo Project (DP) Community Newsletter. Issue 22 February 2019.
13 Hine, R., 2004. Combined Annual Report for the Period Ending 30th September 2004 on Exploration Licences 5629 & 5985 Narraburra (SI55-11). Heemskirk Resources Pty Ltd, Canberra, October 2004.
14 Capital Mining Ltd. ASX announcement 9 November 2011.
15 See footnote 8.
16 Northern Minerals Ltd. ASX announcement 22 October 2013.
17 Northern Minerals Ltd. Quarterly Report March 2015. ASX announcement 30 April 2015.
18 Crossland Uranium Mines Ltd. ASX announcement 15 May 2012.
19 HREOs reported as oxides of Tb, Dy, Ho, Er, Tm, Yb, Lu, Y; MREOs are oxides of Sm, Eu, Gd; LREOs are oxides of La, Ce, Pr, nd.
20 Crossland Uranium Mines Ltd. ASX announcement 15 April 2013.
21 Crossland Strategic Metals Ltd. ASX announcement 18 March 2019.
22 Crossland Strategic Metals Ltd. Quarterly Report March 2019. ASX announcement 30 April 2019.
23 Kidman Resources Ltd. ASX announcement 18 January 2011.
24 Kidman Resources Ltd. ASX announcement 7 March 2011.
25 Kidman Resources Ltd. Quarterly Report December 2014. ASX announcement 30 January 2015.
26 Arafura Resources Ltd. ASX announcement 7 August 2012.
27 Arafura Resources Ltd. ASX announcement 7 June 2017.
28 Arafura Resources Ltd. ASX announcement 7 February 2019.
29 Arafura Resources Ltd. ASX announcement 28 March 2019.
30 Territory Uranium Resources Ltd. ASX announcement 18 October 2010.
31 Territory Uranium Resources Ltd. ASX announcement 26 October 2010.
32 Territory Uranium Resources Ltd. ASX announcement 15 November 210.
33 Territory Uranium Resources Ltd. Annual Report 2012.
34 Spectrum Rare Earths Ltd. Quarterly Report December 2016. ASX announcement 23 January 2017.
35 Territory Uranium Resources Ltd. ASX announcement 16 May 2013.
36 Spectrum Rare Earths Ltd. ASX announcement 24 March 2014.
37 Spectrum Rare Earths Ltd. Quarterly Report December 2014. ASX announcement 30 January 2015.
38 The company classifies light REE as Ce, La, Pr and Nd; medium REE as Gd, Eu and Sm; and heavy REE as Dy, Er, Ho, Lu, Tb, Tm, Yb and Y.
39 Spectrum Rare Earths Ltd. Quarterly Activity Report June 2015. ASX announcement 27 July 2015.
40 Spectrum Rare Earths Ltd. Quarterly Activity Report September 2015. ASX announcement 30 October 2015.
41 Spectrum Rare Earths Ltd. ASX announcement 16 December 2015.
42 Territory Uranium Resources Ltd. Annual Report 2011.
43 Territory Uranium Resources Ltd. ASX announcement 19 September 2012.
44 Territory Uranium Resources Ltd. ASX announcement 18 January 2013.
45 Hammer Metals Ltd. ASX announcement 5 June 2015.
46 ibid.
47 Krucible Metals Ltd. ASX announcement 11 January 2012.
48 Krucible Metals Ltd. Annual Report 2012.
49 Krucible Metals Ltd. ASX announcement 13 November 2012.
50 Krucible Metals Ltd. Annual Report 2014.
51 Krucible Metals Ltd. ASX announcement 5 June 2014.
52 Krucible Metals Ltd. ASX announcement 17 July 2014.
53 Krucible Metals Ltd. Quarterly Activities Report June 2015. ASX announcement 27 July 2015.
54 China Yunnan Copper Australia Ltd. ASX announcement 28 January 2010.
55 China Yunnan Copper Australia Ltd. ASX announcement 24 March 2010.
56 China Yunnan Copper Australia Ltd. ASX announcement 24 February 2011.
57 Chinalco Yunnan Copper Resources Ltd. ASX announcement 8 June 2012.
58 Chinalco Yunnan Copper Resources Ltd. ASX announcement 18 October 2012.
59 HRRE includes Gd, Tb, Dy, Ho, Er, Tm and Yb.
60 China Yunnan Copper Australia Ltd. ASX announcement 6 January 2011.
61 China Yunnan Copper Australia Ltd. ASX announcement 22 March 2011.
62 Chinalco Yunnan Copper Resources Ltd. Quarterly Report September 2015. ASX announcement 23 October 2015.
63 Hammer Metals Ltd. ASX announcement 3 July 2019.
64 Krucible Metals Ltd. Annual Report 2010.
65 Krucible Metals Ltd. Quarterly Report December 2010. ASX announcement 27 January 2011.
66 Krucible Metals Ltd. ASX announcement 28 February 2011.
67 Krucible Metals Ltd. ASX announcement 5 April 2011.
68 Krucible Metals Ltd. Annual Report 2013.
69 Australia New Agribusiness & Chemical Group Ltd. ASX announcement 13 November 2015.
70 GBM Resources Ltd. ASX announcement 22 November 2012.
71 REEYO is rare earth elements and yttrium oxide.
72 GBM Resources Ltd. Quarterly Report March 2013. ASX announcement 30 April 2013.
73 GBM Resources Ltd. Quarterly Report December 2014. ASX announcement 30 January 2015.
74 GBM Resources Ltd. Annual Report 2016.
75 Minotaur Exploration Ltd. ASX announcement 18 March 2008.
76 Minotaur Exploration Ltd. Quarterly Report June 2008. ASX announcement 31 July 2008.
77 Pepinnini Minerals Ltd. Quarterly Report June 2010. ASX announcement 30 July 2010.
78 Department of Energy and Mining, South Australian Government, 2019. SA Geodata Database, Mineral Deposit Details, Deposit Number 8437 Cadi. https://minerals.sarig.sa.gov.au/MineralDepositDetails.aspx
79 Department of State Development South Australia, 2013. Rare Earth Elements in South Australia. Resources and Energy Group Brochure M28 2013.
80 ibid.
81 Marathon Resources Ltd. ASX announcement 2 August 2005.
82 Oxides of Y, Ce, La, Yt, Pr, Nd and Sm.
83 Oxides of Dy, Er, Eu, Gd, Ho, Lu, Tb, Tm and Yb.
84 Pepinnini Minerals Ltd. Quarterly Report September, 2010. ASX announcement 28 October 2010.
85 See Footnote 2.
86 See Footnote 78.
87 Department of Energy and Mining, South Australian Government, 2019. SA Geodata Database, Mineral Deposit Details, Deposit Number 34 Victory Downs.
88 Tasman Resources Ltd. ASX announcement 10 November 2009.
89 Tasman Resources Ltd. ASX announcement 6 July 2010.
90 Tasman Resources Ltd. Quarterly Report June 2010. ASX announcement 30 July 2010.
91 Tasman Resources Ltd. ASX announcement 15 August 2013.
92 Tasman Resources Ltd. Quarterly Report December 2018. ASX announcement 25 January 2019.
93 Argo Exploration Ltd. ASX announcement 30 September 2011.
94 Argo Exploration Ltd. Quarterly Report September 2012. ASX announcement 31 October 2012.
95 Bottrill, R.S., 2001. Rare earth, tantalum and niobium minerals reported in Tasmania. Tasmanian Geological Survey Record 2001/7.
96 Jackman, Carl, 2018. Alluvial Mineral Occurrences of Tasmania. 1:500 000 scale map, Mineral Resources Tasmania, 6 November 2018.
97 WIM Resource Pty Ltd. Avonbank Project – Maiden JORC Reserve Statement. News Release 22 October 2018.
98 Hastings Technology Metals Ltd, 2019. https://hastingstechmetals.com/projects/brockman/brockman-geology/
99 Hastings Rare Metals Ltd. ASX announcement 8 September 2011.
100 Hastings Rare Metals Ltd. ASX announcement 1 July 2013.
101 Hastings Rare Metals Ltd. ASX announcement 13 August 2014.
102 Hastings Technology Metals Ltd. Quarterly Report December 2015. ASX announcement 29 January 2016.
103 Hastings Technology Metals Ltd. Quarterly Report December 2018. ASX announcement 31 January 2019.
104 HREO Total of Sm2O3, Eu2O3, Gd2O3, Tb4O7, Dy2O3, Ho2O3, Er2O3, Tm2O3, Yb2O3, Lu2O3 and Y2O3.
105 TREO Total of La2O3, CeO2, Pr6O11, Nd2O3, Sm2O3, Eu2O3, Gd2O3, Tb4O7, Dy2O3, Ho2O3, Er2O3, Tm2O32O3, Yb2O3, Lu2O3 and Y2O3.
106 Northern Minerals Ltd. ASX announcement 28 September 2018.
107 Northern Minerals Ltd. ASX announcement 11 September 2018.
108 Northern Minerals Ltd. ASX announcement 6 March 2019.
109 Northern Minerals Ltd. ASX announcement 27 December 2018.
110 Kimberley Rare Earths Ltd, 2011. Prospectus 14 March 2011.
111 Navigator Resources Ltd. ASX announcement 17 September 2009.
112 Navigator Resources Ltd. ASX announcement 11 September 2012.
113 TREOY = total rare earth oxides + yttrium oxide.
114 Navigator Resources Ltd. ASX Notice 21 January 2016.
115 Department of Mines, Industry Regulation and Safety, Western Australia, 2019. Cummins Range, Minedex database, 3 April 2019.
116 Noble Resources Ltd. Annual Report 1992.
117 Northern Uranium Ltd. ASX announcement 9 April 2010.
118 ibid.
119 Northern Minerals Ltd. ASX announcement 5 April 2011.
120 Northern Minerals Ltd. ASX announcement 11 January 2012.
121 Northern Minerals Ltd. Quarterly Report March 2015. ASX announcement 30 April 2015.
122 Northern Minerals Ltd. Annual Report 2016.
123 Lynas Corporation Ltd. ASX announcement 6 August 2018.
124 TREO = La2O3, CeO2, Pr6O11, Nd2O3, Sm2O3, Eu2O3, Gd2O3, Tb4O7, Dy2O3, Ho2O3, Er2O3, Tm2O3, Yb2O3, Lu2O3 and Y2O3.
125 Lynas Corporation Ltd. Annual Report 2017.
126 Lynas Corporation Ltd. NASDAQ Virtual Investor Conference Presentation, March 2018.
127 Lynas Corporation Ltd. Quarterly Report March 2019. ASX announcement 16 April 2019.
128 Lynas Corporation Ltd. H1 2019 Results Roadshow, 4 March 2019.
129 Lynas Corporation Ltd. Quarterly Report December 2018. ASX announcement 22 January 2019.
130 Hastings Technology Metals Ltd. https://hastingstechmetals.com/projects/yangibana/yangibana-geology/
131 Hastings Rare Metals Ltd. ASX announcement 5 August 2014.
132 Hastings Technology Metals Ltd. ASX announcement 28 November 2018.
133 Hastings Technology Metals Ltd. ASX announcement 29 January 2019.
134 Hastings Technology Metals Ltd. ASX announcement 28 November 2017.
135 Hastings Technology Metals Ltd. ASX announcement 28 February 2018.
136 Hastings Technology Metals Ltd. ASX announcement 11 March 2019.
137 Hastings Technology Metals Ltd. ASX announcement 27 June 2019.
138 See Footnote 2.