Tantalum
Page last updated:19 December 2023
Please note that this page is currently under review.
Resource figures are current as at 31 December 2018.
Tantalum (Ta) is a highly ductile, highly refractory metal (chemically inert and resistant to heat and wear), with a very high melting point (fourth highest of the metals). It is very resistant to corrosion due to the formation of a thin surface layer of tantalum oxide, which also has the property of being an insulating layer. This thin layer of tantalum oxide results in favourable dielectric properties, hence the major usage of tantalum is in capacitors for the electronics and telecommunications industry. Tantalum capacitors are small and reliable and are favoured for miniaturised electronic applications, such as in mobile phones, hand held devices and solid state drives.
Tantalum is also used in resistors and semiconductors. Other uses include within alloys and superalloys, to increase ductility, melting point and corrosion resistance (e.g., high temperature applications, turbine blades), within medical and dental applications (using its inertness and biocompatibility) and chemical process industries (making use of its high temperature and corrosion resistance properties, e.g., heat exchangers, vacuum furnaces).
Tantalum is one of a suite of commodities identified by the Australian Government as critical minerals1, i.e., minerals (or elements) considered vital for the well-being of the world's economies, yet whose supply may be at risk of disruption. Tantalum is essential for advanced technology.
Tantalum mineralisation in Australia
Tantalum shares many of its properties with niobium (Nb), with which it is commonly found. This close association has led to use of the 'coltan' terminology, short for columbite-tantalites, reflecting the niobium-dominant (columbite)2 and tantalum-dominant (tantalite) end-members of this oxide mineral series (see text box below). Tantalite is a dominant ore mineral of tantalum and is most commonly found within rare-metal granites and pegmatites, which are suggested to account for more than three-quarters of current tantalum production.
Other niobium-tantalum minerals found in Australian pegmatites include stibiotantalite, wodginite, ixiolite and microlite (see text box below)3. Pegmatites form the host for the majority of Australian tantalum deposits, commonly occurring with tin (cassiterite) and/or lithium mineralisation, e.g., the Western Australian deposits of Greenbushes and Wodgina. Tantalum (by-product) grades in these deposits range from 100 to 400 ppm.
Tantalum and niobium are also found in other deposit types, in particular as a by-product of rare earth element-zirconium mineralisation in carbonatites and peralkaline rocks. Examples of these include the Mount Weld carbonatite in Western Australia, the Toongi trachyte (peralkaline host for the mineralisation of the Dubbo Project) in New South Wales and the Brockman deposit in northern Western Australia. Reported host minerals for the tantalum and niobium in these deposits include natroniobate at Toongi4, columbite and yttrium-bearing rare-earth niobates at Brockman5, and columbite, niobium-enriched titanium minerals (ilmenite, rutile) and pyrochlore at Mount Weld6. Tantalum grades in these deposits are comparable to those in the pegmatites.
Minor placer deposits (alluvial and elluvial) of tantalum and niobium minerals have been sporadically worked in Western Australia, chiefly close to known hard-rock mineralisation, e.g., in the Pilbara (Wodgina, Moolyella, Tabba Tabba areas) and in the Greenbushes area of the Yilgarn Craton7. These deposits were often associated with tin.
JORC Ore Reserves
As at December 2018, Proved and Probable Ore Reserves of tantalum reported in compliance with the JORC Code amounted to 39.8 kt (Table 1). This represents an 8% increase from 36.7 kt in 2016.8 As of December 2018, Ore Reserves accounted for about 45% of Australia's Economic Demonstrated Resources (EDR) of tantalum.
Apart from the temporary 2017 reduction9, Ore Reserves of tantalum have stayed relatively constant over the last 16 years. This has largely reflected the constancy of Reserves reported for the Wodgina deposit. The dip after 2007 represents the non-reporting of tantalum Reserves from the Greenbushes deposit (up till then 21.3 kt). Since 2011, Ore Reserves have been reported for Wodgina, Mount Cattlin, Toongi, Tabba Tabba, Pilgangoora and Bald Hill.
Table 1. Australia's Ore Reserves of tantalum, 2002-2018.
| Year | Ore Reserve1 (kt Ta) | Production2 (kt Ta) | Reserve Life3 (years) |
|---|---|---|---|
| 2018 | 39.8 | 0.06 | 663 |
| 2017 | 13.5 | 0.05 | 270 |
| 2016 | 36.7 | 0.03 | 1223 |
| 2015 | 29.1 | 0.18 | 162 |
| 2014 | 29 | ||
| 2013 | 30 | ||
| 2012 | 29 | ||
| 2011 | 29 | ||
| 2010 | 19 | ||
| 2009 | 19 | 0.022 | 864 |
| 2008 | 19 | 0.68 | 28 |
| 2007 | 40.3 | 0.435 | 93 |
| 2006 | 40.3 | 0.58 | 69 |
| 2005 | 40.3 | 0.8 | 50 |
| 2004 | 40.3 | 0.6 | 67 |
| 2003 | 40.3 | 1.02 | 40 |
| 2002 | 35.1 | 0.85 | 41 |
kt Ta = thousand tonnes of contained tantalum.
- Ore Reserves in Proved and Probable categories. The majority of Australian Ore Reserves are reported in compliance with the JORC Code, however there are a number of companies that report to foreign stock exchanges using other reporting codes, which are largely equivalent. In addition, Geoscience Australia may hold confidential information for some commodities.
- Source: Australian tantalum production data, 2015 to 2018, from Department of Mines, Industry Regulation and Safety, Western Australian Government, 2018-2019 Major commodities resources file. Production data prior to 2015, see Australia's Identified Mineral Resources, past editions.
- Reserve life is calculated by dividing the Ore Reserve by production. The resulting ratio is a snapshot in time that can only be used for general impressions because it is an average and it assumes (1) that production rates in the future will remain the same as those used in the calculation, (2) deposits deemed economic/uneconomic remain so in the future and (3) that depleted reserves are never replaced.
Identified Resources
Economic Demonstrated Resources of tantalum were 88.8 kt at 31 December 2018, up from 75.7 kt in 2016 (Table 2)10. Since 2010, EDR has shown a steady increase (apart from a temporary drop in 2017), reflecting the high level of exploration activity and exploration success over that period for lithium, for which tantalum is a common by-product. Over a similar period (2010-2018), world economic resources of tantalum, as reported by the USGS, have, although variable, changed little. This appears to be an artefact of the lack of resource reporting for most countries.
More than 90% of Australia's tantalum resources occur within four deposits (Toongi, Wodgina, Pilgangoora and Greenbushes). Western Australia holds 88% of Australia's EDR, with the remainder in New South Wales (in the Toongi deposit). Australia had 1.4 kt considered subeconomic at the end of 2018, slightly down from 2017 (Table 2). Inferred Resources of tantalum in 2018 (34.9 kt) were slightly up from 2016 (32.9 kt; Table 2).
Accessible EDR
Some mineral resources are inaccessible for mining because of environmental restrictions, government policies or because they occur within military lands or national parks. All of Australia's EDR of tantalum are considered to be accessible (Table 2).
Table 2. Australia's identified tantalum (kt Ta) resources and world figures for selected years, 1990-2018.
| Year | Demonstrated Resources | Inferred Resources3 | Accessible EDR4 | Australian Mine Production5 | World Economic Resources6 | World Mine Production6 | ||
|---|---|---|---|---|---|---|---|---|
| Economic (EDR)1 | Subeconomic2 | |||||||
| Paramarginal | Submarginal | |||||||
| 2018 | 88.8 | 1.2 | 0.2 | 34.9 | 88.8 | 0.06 | 123 | 1.8 |
| 2017 | 59.3 | 1.3 | 0.2 | 50.6 | 59.3 | 0.05 | 89 | 1.3 |
| 2016 | 75.7 | 7.4 | 0.2 | 32.9 | 75.7 | 0.03 | 100 | 1.1 |
| 2015 | 69.2 | 6.7 | 0.2 | 31.4 | 69.2 | 0.18 | 100 | 1.2 |
| 2014 | 67 | 11 | 0.2 | 31 | 67 | 100 | 0.79 | |
| 2013 | 67 | 11 | 0.2 | 29 | 67 | 103 | 0.59 | |
| 2012 | 60 | 18 | 0.2 | 21 | 60 | 156 | 0.77 | |
| 2011 | 62 | 18 | 0.2 | 29 | 62 | 131 | 0.79 | |
| 2010 | 53 | 15 | 0.2 | 30 | 53 | 121 | 0.59 | |
| 2009 | 51 | 15 | 0.2 | 31 | 51 | 0.022 | 116 | 0.62 |
| 2008 | 51 | 15 | 0.3 | 80 | 51 | 0.68 | 130 | 1.1 |
| 2007 | 41 | 32 | 0.2 | 87 | 41 | 0.44 | 130 | 0.99 |
| 2006 | 52 | 32 | 0.2 | 69 | 52 | 0.8 | 55 | 1.5 |
| 2005 | 52 | 32 | 0.2 | 69 | 52 | 0.58 | 55 | 1.1 |
| 2000 | 29 | 30 | 0.23 | 60.4 | 0.6 | 32.3 | 0.62 | |
| 1995 | 6.2 | 5.5 | 0.1 | 65.1 | 0.2 | 22 | 0.34 | |
| 1990 | 11.4 | 3.2 | 62 | 0.19 | 22 | 0.4 | ||
kt Ta = thousand tonnes of contained tantalum.
- Economic Demonstrated Resources (EDR) predominantly comprise Ore Reserves and most Measured and Indicated Mineral Resources that have been reported in compliance with the Joint Ore Reserves Committee (JORC) Code to the Australian Securities Exchange (ASX). In addition, some reserves and resources may have been reported to foreign stock exchanges using other reporting codes, which are largely equivalent to the JORC Code. Geoscience Australia may also hold some confidential data.
- Subeconomic Demonstrated Resources are geologically demonstrated but do not meet the criteria for economic at the time of determination. Subeconomic resources classed as Paramarginal require a modest improvement in the commodity price/cost ratio to render them economic. Subeconomic resources classed as Submarginal require a substantially improved commodity price/cost ratio to render them economic.
- Total Inferred Resources in economic, subeconomic and undifferentiated categories.
- Accessible Economic Demonstrated Resources (AEDR) is the portion of total EDR that is accessible for mining. AEDR does not include resources that are inaccessible for mining because of environmental restrictions, government policies or military lands. All of Australia's tantalum resources are considered accessible.
- Australian tantalum production data from Department of Mines, Industry Regulation and Safety, Western Australian Government, 2018-2019 Major commodities resources file.
- Source: United States Geological Survey (Mineral Commodity Summaries). Resource numbers for niobium for the last few years are reported as a minimum value.
Production
Tantalum production in Australia is largely a by-product of lithium production and was reported by the Western Australian Government to be 84 t of tantalite in 201811, which is approximately 0.06 kt of tantalum metal (Table 2). Production from individual mines has been reported from the Bald Hill and Pilgangoora mines. Bald Hill produced approximately 95 000 lb (43 t) of tantalite in the last nine months of 201812,13. Pilgangoora indicated production of 78 700 lb (36 t) of tantalite concentrate (grade not specified) for 201814. This does not, however, include any tantalite contained in direct shipping ore (DSO) produced from Pilgangoora during 2018.
World Ranking
World niobium and tantalum resources are poorly reported. Central Africa is known to host major resources but dependable resource estimates are rarely available. According to world estimates published by the USGS15, and supplemented with Australian figures, world economic resources of tantalum in 2018 totalled about 123 kt (Table 2). These figures, however, are a minimum, given that they are based on resources from Australia and Brazil alone and do not include Rwanda, Congo, Nigeria, Brazil or China. With the caveat of being based on reliably reported economic resources, Australia ranks first in the world.
World production, based on USGS estimates and adjusted for Australia, was estimated to be 1.80 kt of contained tantalum in 2018 (Table 3). The Central African region was responsible for approximately 67% of world production, split between the Democratic Republic of Congo (0.71 kt for 39% of world production) and Rwanda (0.50 kt for 28%). Other major producers include Nigeria (0.15 kt; 8%), China (0.12 kt, 7%) and Brazil (0.10 kt, 6%). Australia ranks seventh in 2018, accounting for 3% of tantalum production.
Table 3. World production of tantalum 2018.
| Rank | Country | Production1 (kt Ta) | Percentage of world total2 |
|---|---|---|---|
| 1 | Congo | 0.710 | 39% |
| 2 | Rwanda | 0.50 | 28% |
| 3 | Nigeria | 0.15 | 8% |
| 4 | China | 0.12 | 7% |
| 5 | Brazil | 100 | 6% |
| 6 | Ethiopia | 0.07 | 4% |
| 7 | Australia | 0.06 | 3% |
| Others | 0.10 | 6% | |
| Total | 1.80 |
kt Ta = thousand tonnes of contained tantalum.
Industry Developments
Australia's tantalum resources occur in Western Australia, the Northern Territory and New South Wales (Figure 1). This section highlights recent company resource estimates and development-related activities. All reported reserves and resources are compliant with the JORC Code unless otherwise stated.
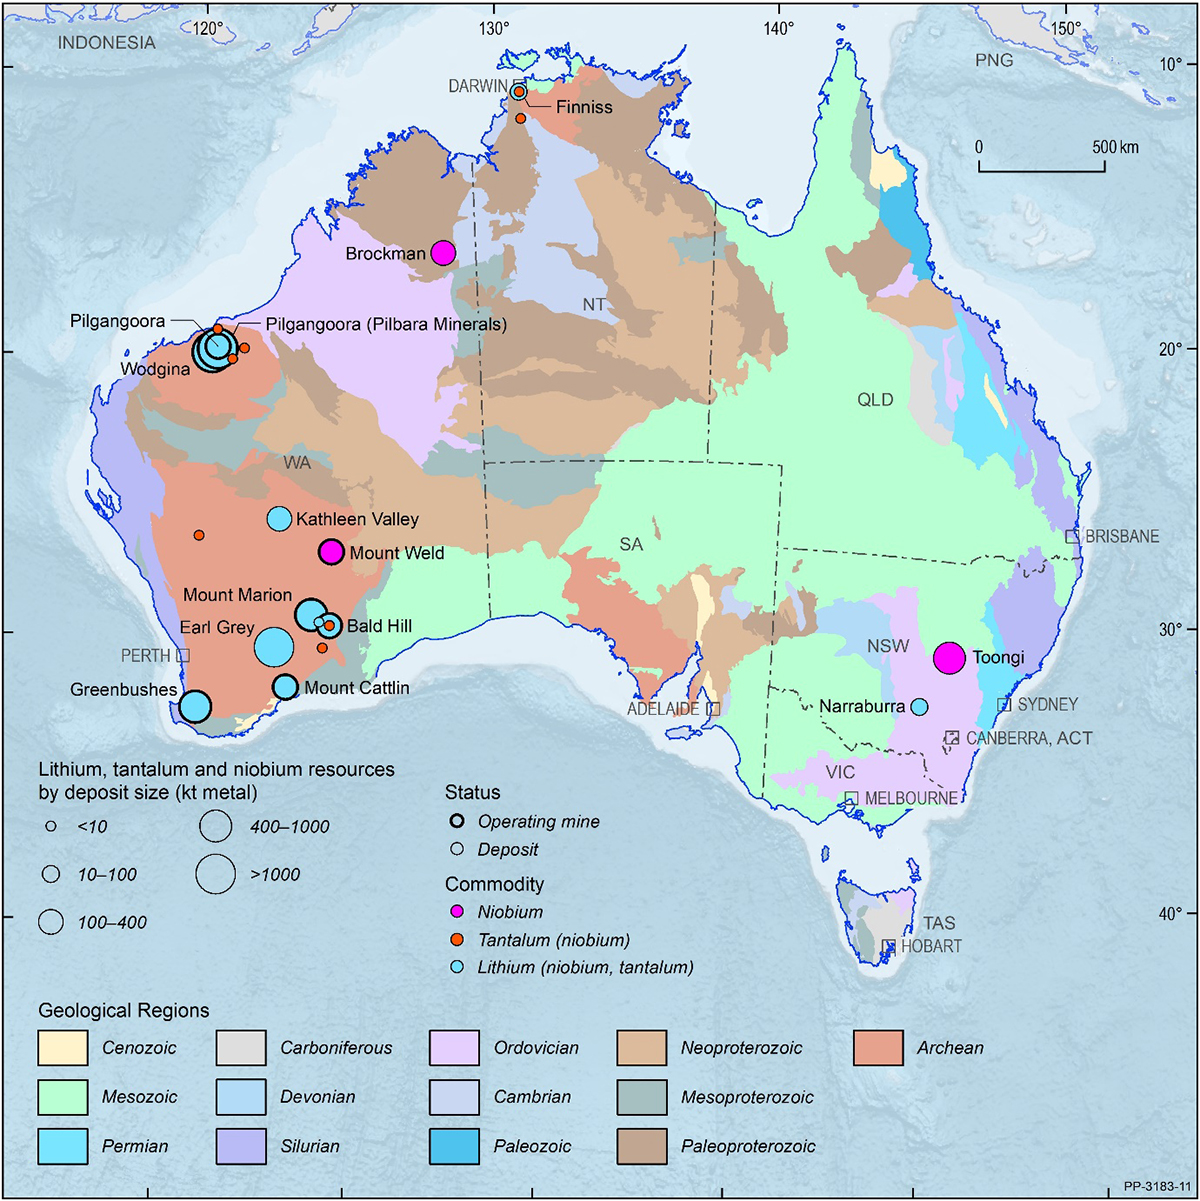
Figure 1. Australian lithium, tantalum and niobium deposits and operating mines 2018.
kt metal = thousand tonnes of contained lithium, tantalum or niobium. Deposit size is based on total resources (EDR + Subeconomic Resources + Inferred). For clarity, only major or significant deposits are labelled.
Exploration
Within Australia, tantalum exploration is largely supplementary to other commodities of interest, e.g., lithium, rare earth elements and niobium. Additions in the last five years to Australia's tantalum resources have been in conjunction with large increases in lithium resources, mostly in Western Australia. There has been little change in tantalum resources associated with peralkaline and carbonatite-hosted deposit styles. No statistics are available on actual exploration expenditure.
Pegmatite-hosted deposits
The majority of Australia's EDR of tantalum and, probably, all of Australia's tantalum production, are from lithium-tantalum, hard-rock pegmatite deposits, where tantalum is produced as a by-product from lithium (spodumene) mining. In the past, however, a number of these deposits were primarily focussed on tantalum mining, sometimes with lithium and/or tin as by-products, e.g., the Western Australian deposits of Wodgina, Greenbushes and Bald Hill.
Bald Hill: The Bald Hill lithium and tantalum deposit is located approximately 105 km southeast of Kalgoorlie, Western Australia. It is owned by Alita Resources Ltd (previously Alliance Mineral Assets Ltd), formed by a merger with Tawana Resources NL in late 2018; previously, Alliance and Tawana were equal owners. Bald Hill was initially mined for tantalum by Haddington Resources Ltd (now Altura Mining Ltd) between 2001 and December 2005 with some 820 000 lb (372 t) of Ta2O5 produced18. The region was also mined for alluvial tantalum in the 1970s and 1980s.
In late 2016, spodumene was reported as present in the tantalite ore at the pegmatite deposit with the commencement of metallurgical test work, exploration and resource drilling19. A maiden lithium mineral resource was released in 201720 and a further resource estimate was published in 201821. Using a cut-off grade of 0.3% Li2O, the deposit has total resources of 26.5 Mt at 0.96% Li2O and 149 ppm Ta2O5, for a total of 3.2 kt of contained tantalum. The deposit has a Probable Ore Reserve of 11.3 Mt at 1.01% Li2O and 160 ppm Ta2O5 for 2.0 kt of contained tantalum22.
Initial production of lithium and tantalum commenced at Bald Hill in March 2018 with the first shipment of concentrates in May that year23. Alliance report production for the 2018 calendar year of approximately 68.5 wet metric tons of spodumene concentrates (6% Li2O) and approximately 95 000 lb of Ta2O524. The company is targeting production of 180 kt of spodumene concentrates (6% Li2O) and 330 000 lb of tantalite concentrate (~30% Ta2O5) in 2019, increasing to 240 kt and 470 000 lb, respectively, in 202025. Alliance indicated they had shipped 40 dry metric tonnes (dmt) of tantalite concentrate (~31% Ta2O5) during 201826. In addition, some 340 dmt of low-grade tantalum concentrate (~3.1% Ta2O5) was also sold in 201827.
Alliance report that tantalum at Bald Hill is recovered from three streams: (1) primary tantalum through their existing 320 000 tpa processing facility; (2) tantalum in fines (<1 mm) from the lithium plant (206 ppm Ta2O5); and (3) tantalite (800 g/t) in the final spodumene concentrate initially not recovered prior to shipping28. A stand-alone circuit is being installed to recover most of this tantalite.
In August 2019, voluntary administrators were appointed to Alita29. A Deed of Company Arrangement was entered into with China Hydrogen Energy Ltd and Liatam Mining Pty Ltd in December 201930.
Greenbushes: Australia's, and one of the world's largest tantalum deposits is the Greenbushes lithium-tantalum deposit 250 km southeast of Perth in Western Australia. Mineralisation at Greenbushes occurs within a large Archean pegmatite body in the Yilgarn Craton. Historical mining, largely for tin, has been undertaken in this area since the late 1800s. Apart from a brief period of tantalum mining in World War II, significant lithium and tantalum mining at Greenbushes commenced in the early 1980s. The initial mining focus was largely on tantalum, gradually switching over to lithium in the mid-2000s, following a drop in tantalum demand and price and the rise of the lithium market31.
In 2010, the lithium and tantalum (and other mineral) assets at the Greenbushes deposit were divided between Talison Lithium Pty Ltd and Talison Minerals Pty Ltd (which became Global Advanced Metals Pty Ltd (GAM))32. In early 2013, Talison Lithium, owner of the lithium rights to the deposit, was fully acquired by the Chinese company Chengdu Tianqi Industry (Group) Co Ltd (Tianqi) through its Australian incorporated, wholly-owned subsidiary, Windfield Holdings Pty Ltd. In May 2014, Rockwood Lithium Inc (a lithium producer from brine operations in Chile and in Nevada) acquired a 49% share in Talison Lithium Pty Ltd from Tianqi. In January 2015, the parent company of Rockwood Lithium, Rockwood Holdings Inc (a US-based specialty chemicals and advanced materials company), became a wholly-owned subsidiary of Albemarle Corporation, a speciality chemical company, under a merger agreement reached in mid-2014.
Non-lithium rights, including tantalum, for the deposit are held by GAM. Reports by Talison Lithium indicate that tantalum mining began in 1992 with an ore processing capacity of 800 ktpa33. Initial mining was from the Cornwall open pit, moving underground in the early 2000s. Plant capacity was upgraded in the late 1990s to 4 Mtpa. Primary tantalum production at Greenbushes ceased in the early 2000s, apart from brief mining in 2004-2005.
The tantalum operation has largely been on care and maintenance since, although secondary processing from external sources and, more recently, of the tantalum by-product from Talison Lithium's operations has continued34. Media reports (early 2018) suggest that GAM wishes to again mine tantalum at the Greenbushes deposit in conjunction with the secondary processing of tantalum by-product from Talison Lithium's Greenbushes operation, and from other lithium mines in Western Australia, e.g., Pilgangoora35.
Current tantalum resources, and also lithium, at Greenbushes are not reported. The most recent publicly reported resource figures for Greenbushes date from September 2012, but are for lithium only. Talison Lithium (prior to its acquisition by Tianqi) reported combined Measured and Indicated Resources of 118.4 Mt grading at 2.4% Li2O, containing Proved and Probable Ore Reserves of 61.5 Mt at 2.8% Li2O36. The most recent tantalum resource estimates date from 2008, amounting to 226 Mt at 162 ppm Ta2O5 for a contained 30 kt of tantalum metal37.
Current production figures for both lithium and by-product tantalum are also not reported. However, it is known that there has been significant increases in lithium (spodumene) production capacity at the deposit over the last few years. In 2017, Talison Lithium announced a $320 million expansion with construction of a second chemical-grade lithium processing plant38. This will reportedly double the lithium concentrate production capacity at Greenbushes to 1.3 Mtpa. The upgrade was completed in 2019.
In mid-2018, a $516 million, second-stage expansion of Greenbushes was announced, including two additional chemical-grade plants39. The latter upgrade, once completed40, is planned to increase the Greenbushes production capacity to a potential 2.3 Mtpa of lithium concentrate (from approximately 9.5 Mtpa of spodumene ore)41. These figures do not include any contribution from potential construction of a tailings retreatment plant.
Although not explicitly stated, it is envisaged that the amount of by-product tantalum produced from lithium mining will also increase markedly at Greenbushes, in addition to any possible future tantalum mining by GAM. As part of a revised commercial agreement between GAM and Talison Lithium, related to the latest planned expansion of production capacity at Greenbushes, the installation and operation of a tantalum recovery circuit is to be incorporated in the new chemical-grade lithium processing plant that Talison Lithium is constructing42.
Kathleen Valley: The Kathleen Valley lithium-tantalum project, wholly owned by Liontown Resources Ltd, is located 400 km north of Kalgoorlie, Western Australia. The project is centred on two swarms of Archean pegmatite dykes at the Kathleen's Corner and Mount Mann deposits, which are interpreted to coalesce at depth43. Liontown obtained the rights to the Li-Ta pegmatite mineralisation at Kathleen Valley from Ramelius Resources Limited in 201644.
Following initial drilling in 2017 and first half of 2018, Liontown released a maiden Mineral Resource for Kathleen Valley in September 2018 of 21.2 Mt at 1.4% Li2O and 170 ppm Ta2O545. This was followed by a large increase of estimated resources in July 2019 totalling 74.9 Mt at 1.3% Li2O and 140 ppm Ta2O5, of which 69.9 Mt have open-pit potential46. Just under 60 Mt of the open-pit Mineral Resource is in the Indicated (42.2 Mt) and Measured (17.6 Mt) categories. Liontown have indicated that additional Ta2O5 mineralisation exists external to that within the Li2O-defined resource, which they intend to include in future resource estimates47. Another significant increase in Mineral Resources was released in February 2020 totalling 139 Mt at 1.3% Li2O and 140 ppm Ta2O548.
Mount Cattlin: The Mount Cattlin lithium-tantalum mine (hard-rock spodumene) near Ravensthorpe, Western Australia, is owned by Galaxy Resources Ltd. The Mount Cattlin orebody is located within flat-lying pegmatites. The deposit recently recommenced production following an earlier period of mining between 2010 and 2012.
During the first phase of mining, the Mount Cattlin deposit had a reported Mineral Resource (February 2011) of 18 188 kt at 1.08% Li2O and 168 ppm Ta2O5, containing an estimated 91 kt of lithium and 2.3 kt of tantalum49. Production at the deposit ceased in mid-2012, with a year's supply of spodumene feedstock stockpiled. Until operations were suspended, the Mount Cattlin deposit had produced some 120 kt of spodumene concentrates.50 Tantalum production was not regularly reported although Galaxy indicate 2011 and 2012 combined sales of 872 t of tantalite concentrate51 (some 22.5 t of Ta, based on 3% Ta2O5 grades)52.
In 2015, Galaxy entered into an agreement (with a purchase option) with General Mining Corporation Ltd for the latter to take over the operation of Mount Cattlin, with the aim of bringing the deposit back into production53. The agreement was modified in early June 2015, with General Mining to supply the resources needed to recommence production at Mount Cattlin by March 201654. General Mining was to earn 50% equity interest and to be sole operator and manager. In May 2016, Galaxy via a successful takeover of its Mount Cattlin joint venture partner General Mining resumed full ownership of the project55.
Following upgrading, the recommissioned facility was reopened with production recommencing in April 2017. Reported production was approximately 156 kt of lithium concentrate for the 2017 calendar year56 and 157 kt of concentrate for the 2018 calendar year57. Tantalum production was not reported.
In December 2018, the Mount Cattlin deposit had a reported Mineral Resource of 16.7 Mt at 1.28% Li2O and 159 g/t Ta2O5, containing an estimated 99.2 kt of lithium and 2.2 kt of tantalum (based on a cut-off grade of 0.4% Li2O)58. These figures include 10.4 Mt in the Measured and Indicated categories, and 8.0 Mt in Proved and Probable Ore Reserves. An additional 2.7 Mt of Probable Ore Reserves were present in surface stockpiles, making a total of 10.7 Mt in Reserves at 1.15% Li2O and 137 ppm Ta2O5.
Pilgangoora: In July 2014, Pilbara Minerals Ltd announced that it had completed acquisition of the Pilgangoora tantalum-lithium project, 150 km southeast of Port Hedland, Western Australia, from GAM59. The project, centred on a swarm of Archean pegmatite dykes (Pilgangoora pegmatite field) in the Pilbara region, is along strike from Altura Mining Ltd's lithium project, also named Pilgangoora. Mineralised zones within the pegmatites contain spodumene, tantalum- and tin-bearing minerals. Pilbara Minerals also holds lithium (‑tantalum) tenements in the Mount Francisco and Lynas Find regions in the Pilbara.
In September 2018, Pilbara Minerals announced an increase in Mineral Resources to 226 Mt at 1.27% Li2O and 116 ppm Ta2O5, for a contained 1.33 Mt of lithium, (0.82 Mt in the Measured and Indicated categories) and 21.5 kt of tantalum (13.7 kt in the Measured and Indicated categories)60. These figures include both Pilgangoora and Lynas Find deposits. The 2018 Ore Reserve was 108.2 Mt at 1.25% Li2O and 120 ppm Ta2O5 for a contained 0.63 Mt of lithium and 10.6 kt of tantalum, of which 22.1 Mt at 1.30% Li2O and 135 ppm Ta2O5 were in the Proved category61.
As part of the Stage 1 development of the Pilgangoora mine, Pilbara Minerals reached first production of spodumene and tantalite concentrates in mid-201862. Stage 1, with initial commissioning in the second quarter of 2018, was designed to achieve an annual production rate of 330 ktpa at 6% Li2O spodumene concentrate and approximately 300 000 lb (136 t) of >5% tantalite concentrate (~5.5 t Ta), with full capacity expected to be realised in early 201963.
In August 2018, Pilbara Minerals followed up on Stage 1 with a positive definitive feasibility study for a Stage 2 expansion that would increase annual processing capacity to 5 Mtpa, and allow it to produce up to 850 ktpa of 6% Li2O spodumene concentrate and 800 000 lb (363 t) of >5% tantalite concentrate (~15 t Ta)64. The results indicated that Pilgangoora would be subject to finance and regulatory approvals65.
In March 2019, the company announced a positive Stage 3 scoping study looking at 7.5 Mtpa producing 1.2 Mtpa of 6% Li2O spodumene concentrate and 1 100 000 lb (500 t) per annum of >5% tantalite concentrate (~20 t Ta) over a 15-year mine life66.
The Pilgangoora mine officially opened in November 2018. Pilbara Minerals was producing DSO from early 2018 as part of a mine-gate sales agreement with Atlas Iron Ltd. By mid-2018, Pilbara Minerals had produced its first spodumene and tantalum concentrates, with first shipment (approximately 8.8 kt of 6% Li2O spodumene concentrate) in October 201867. Softer lithium markets resulted in DSO production halting in the second half of 2019.
According to company figures, total 2018 production for Pilgangoora was just under 59 kt of 6% Li2O spodumene concentrate and 78 800 lb (36 t) of tantalite concentrate, of which 35 200 lb (16 t) was sold68. Initial offtake of the tantalum concentrate (100 000 lb (45 t) of contained Ta2O5 as 4-5% concentrates) was secured (in part) by GAM69. Pilbara reported that additional tantalite concentrate is expected to be sold as 25-30% Ta2O5 final concentrate, as production capacity increases70.
Wodgina: The Wodgina deposit is owned by the MARBL Lithium Joint Venture71 and located approximately 110 km south of Port Hedland, Western Australia. It has a long history of production, since discovery in the early 1900s, being mined for tin and, more significantly, as one of the world's largest tantalum deposits. Tantalum was mined for many years until its closure in 2012 by previous owner GAM.
Tantalum and lithium are both located within a series of mostly flat to shallow-dipping pegmatites. Mineral Resources purchased the Wodgina deposit, tenements and associated infrastructure from GAM in late 2016, with GAM retaining the tantalum rights.
Taking advantage of the existing mine and infrastructure, the company commenced lithium mining at Wodgina in March 2017, with first shipment of lithium as DSO in April 2017. The company exported some 720 kt DSO in the last quarter of the 2016–1772 financial year and just under 3500 kt DSO in 2017–1873. Production for the 2018 calendar year was 2415 kt DSO with 2194 kt exported74.
Mineral Resources suspended DSO production and exports in September 2018, to concentrate on producing spodumene concentrates, although there was no production of spodumene concentrate in 201875. The company was targeting steady-state production of 750 ktpa of 6% Li2O spodumene concentrate by mid-201976, with the upgrade 99% completed by September 2019 77 . The company has not reported production figures for tantalum.
Current resource figures (2018) for the Wodgina pegmatite are 236.92 Mt at 1.19% Li2O and 0.016% Ta2O5, based on a 0.50% Li2O cut-off, for 1.31 Mt of contained lithium and 30.5 kt of tantalum78. Of the total Mineral Resources, 177 Mt at 1.19% Li2O and 0.017% Ta2O5 are in the Indicated category, with 152 Mt at 1.17% Li2O and 0.017% Ta2O5 classified as Probable Ore Reserves79. The deposit also has resource figures for the tailings (from previous tantalum production) of 22 Mt at 0.96% Li2O and 0.019% Ta2O5, of which 90% is classified as Indicated80.
Mineral Resources was investigating a lithium hydroxide plant with two 28.4 ktpa lithium hydroxide modules, aiming to convert at least 50% of spodumene concentrate from Wodgina81. In May 2018, Mineral Resources announced it was looking for joint venture partners82. The company entered into a binding agreement with USA-based Albemarle Corporation in December 2018 for purchase, by Albemarle, of 50% of the Wodgina Lithium Project and formation of a 50/50 joint venture producing spodumene concentrate.
The agreement was revised in August 2019 to increase Albemarle's purchase to 60% of the Wodgina Lithium Project, accompanied by Mineral Resources gaining a 40% interest in the first two 25 ktpa lithium hydroxide conversion units currently under construction by Albemarle at its Kemerton hydroxide facility south of Perth, Western Australia. The sale was approved in late 2019, forming the MARBL joint venture83.Tantalum rights at the deposit have reportedly stayed with Global Advanced Metals. In late 2019, the MARBL announced that Wodgina would be placed on care and maintenance, in response to the state of the global lithium market84.
Alkaline rock-associated deposits
A component of Australia's tantalum inventory occurs within deposits associated with peralkaline igneous rocks or carbonatites, chiefly Dubbo in New South Wales, and Mount Weld and Hastings (now referred to as Brockman), both in Western Australia.
Dubbo: The Dubbo Project (owned by Alkane Resources Ltd through its subsidiary Australian Strategic Materials Ltd), is located 25 km south of Dubbo, New South Wales. The deposit is hosted in the Toongi Trachyte, a peralkaline volcanic or shallow intrusive body of Jurassic age. The deposit is multi-commodity comprising zirconium, hafnium, niobium and REE, with potential by-product tantalum and yttrium. Ore elements are largely hosted in very fine-grained complex (Na-Ca-Zr-Hf-HREE) silicate phases, though most niobium and tantalum are in the mineral natroniobite85. Extraction of zirconium, hafnium niobium and REE from the ore and each other is metallurgically complex, but has been successfully confirmed at a pilot demonstration plant at the Australian Nuclear Science and Technology Organisation in Sydney (ANSTO)86. Tantalum is extracted with the niobium.
In 2019, Alkane republished the Dubbo Project's Mineral Resource estimates of 75.18 Mt at 1.89% ZrO2, 0.04% HfO2, 0.44% Nb2O5, 0.03% Ta2O5, 0.88% TREO (including Y2O3), of which 42.81 Mt at 1.89% ZrO2, 0.04% HfO2, 0.45% Nb2O5, 0.03% Ta2O5, 0.88% TREO in the Measured Resource category87. The latter includes Proved Ore Reserves of 18.90 Mt at 1.85% ZrO2, 0.04% HfO2, 0.44% Nb2O5, 0.03% Ta2O5, and 0.87% TREO. The total resource includes 234 kt of contained niobium and 18.7 kt of tantalum.
Currently, the project is at an advanced stage, being construction-ready, subject to financing, with all key state and federal approvals in place. Definitive feasibility studies were undertaken in 201188 (400 kt per annum throughput) and 201389 (1 million tonnes per annum (Mtpa) throughput), followed by an Engineering Design study in mid-201590. The Mining Lease was granted in late 2015.
The company undertook additional studies, including modularisation to reduce initial capital costs, culminating in the mid-2018 Engineering and Financials Update91. This report suggests an initial estimated mine life of 20 years with a 1 Mtpa plant, and considerable multi-decade expansion potential.
Two options were considered: the originally-planned single 1 Mtpa plant or a modular two-stage development of two 500 ktpa plants, with the second plant to be built four to five years after the first became operational. The first option is more economical but the latter option allows for lower initial capital expenditure. Work is continuing on investigating/reviewing the two-stage strategy and project financing.
Brockman: The Brockman Project (originally Hastings), is situated 18 km southeast of Halls Creek in Western Australia, and is owned by Hastings Technology Metals Ltd. Hastings acquired the project in 2010, although earliest exploration dates back to the 1980s.
The deposit is hosted within the Niobium Tuff, a peralkaline volcaniclastic unit within the Brockman Volcanics. Mineralisation comprises REE, niobium and zircon with associated tantalum, occurring as very fine-grained minerals. Niobium and tantalum are hosted in columbite and samarskite92. Hastings have undertaken metallurgical test work on the project in conjunction with ANSTO, demonstrating the feasibility of separating the ore elements93, reinforcing earlier (1980s) work by previous owners West Coast Holdings Ltd94. West Coast, who were focussed on niobium and zirconium, processed 100 t of ore through a pilot plant in the United Kingdom95.
The most recent (2015) resource figures for Brockman indicate a total Mineral Resource of 41.4 Mt at 0.21% REO, 0.36% Nb2O5 and 0.90% ZrO2, for a contained 103.6 kt of niobium96. The tantalum content, based on the tantalum grade of 182 ppm reported in the previous (2011) resource estimate97, is approximately 6.1 kt. The deposit has seen minimal focus over the last few years, with the company concentrating on their rare earth Yangibana Project, also in Western Australia.
Mount Weld: The Mount Weld rare earths deposit, 240 km north-northeast of Kalgoorlie, is owned by Lynas Corporation Ltd. The main focus of the deposit and current mine is the REE mineralisation, which occurs within a secondary, phosphate-rich regolith horizon formed above the Mount Weld carbonatite98. The deposit also locally hosts niobium-tantalum and phosphate mineralisation.
Niobium and tantalum mineralisation are hosted in a distinct zone—the niobium-rich rare metals resource (also known as the Crown deposit). This Mineral Resource, defined separately from the main REE resource, totals 37.7 Mt at 1.07% Nb2O5, 0.024% Ta2O5, 0.30% ZrO2, 8.0% P2O5, 1.16% REO and 0.09% Y2O3, with a contained 280 kt of niobium and 7.6 kt of tantalum99. All but 1.5 Mt are in the Inferred category. The niobium-tantalum mineralisation was the subject of an early scoping study for producing 1 Mtpa of ore100. There are no indications of when, or if, this resource will be mined.
Citation
Bibliographical reference: Champion, D., 2020. Australian Resource Reviews: Tantalum 2019. Geoscience Australia, Canberra.
References
1Australia's Critical Mineral Strategy 2019, Australan Government, Canberra, 22pp.
2 Niobium, when first discovered was named columbium.
3 Melcher, F., Graupner, T., Gabler, H-E, Sitnikova, M., Oberthur, T. Gerdes, A, Badanina, E. and Chudy, T., 2017. Mineralogical and chemical evolution of tantalum–(niobium–tin) mineralisation in pegmatites and granites. Part 2: Worldwide examples (excluding Africa) and an overview of global metallogenic patterns. Ore Geology Reviews 89, 946-987.
4 Alkane Resources Ltd. Presentation. ASX release 10 November 2015.
5 Ramsden, A.R., French, D.H. and Chalmers, D.I., 1993. Volcanic-hosted rare-metals deposit at Brockman, Western Australia. Mineralium Deposita 28, 1-12.
6 Lottermoser, B.G., 1990. Rare-earth element mineralisation within the Mt Weld carbonatitic laterite, Western Australia. Lithos 24, 151-167.
7 Fetherston, J.M., 2004. Tantalum in Western Australia. Western Australia Geological Survey, Mineral Resources Bulletin 22, 162p.
8 ibid
9 In 2017, tantalum figures were atypical, largely reflecting the temporary classification of Ore Reserves (and thus EDR) as Inferred Resources at the Wodgina deposit. Thus 2018 Ore Reserves and EDR are compared to 2016
10 ibid.
11 Department of Mines, Industry Regulation and Safety, Western Australian Government, 2018-2019 Major commodities resources file.
12 Alliance Minerals Assets Ltd. ASX Release 25 October 2018.
13 Alliance Minerals Assets Ltd. Quarterly Report. ASX Release 31 January 2019.
14 Pilbara Minerals. Quarterly Report. ASX Release 25 January 2019.
15 United States Geological Survey. Mineral Commodity Summaries 2019.
16 United States Geological Survey. Mineral Commodity Summaries 2019.
17 See Footnote 11.
18 Alliance Mineral Assets Ltd. Conference Presentation. ASX Release 20 March 2019.
19 Tawana Resources NL. ASX Release 17 November 2016.
20 Tawana Resources NL. ASX Release 11 October 2017.
21 Tawana Resources NL. ASX Release 6 June 2018.
22 ibid.
23 Tawana Resources NL. ASX Release 3 May 2018.
24 Alliance Mineral Assets Ltd. Conference Presentation. ASX Release 20 March 2019.
25 ibid.
26 Alliance Mineral Assets Ltd. Quarter Report. ASX Release 31 January 2019.
27 ibid.
28 Alliance Mineral Assets Ltd. Prospectus. ASX Release 4 December 2018.
29 Alita Resources Ltd ASX Release 20 December 2019.
30 ibid.
31 Talison Lithium Australia Pty Ltd. Greenbushes Lithium Mine Expansion Environmental Referral Supporting Report. July 2018.
32 ibid.
33 ibid.
34 ibid.
35Australian Mining. Article published 2 February 2018.
36 Behre Dolbear Australia Pty Ltd, 2012. Greenbushes Lithium Operations, NI 43-101 Technical Report, TSX release 21 December 2012.
37 Talison Minerals Pty Ltd. Outlook for the Lithium Industry. Industrial Minerals 2008.
38 Talison Lithium. Greenbushes web site; Albemarle Corporation. Press release 16 March 2017. Further details in South West Development Commission, Western Australian Government. Major Projects South West Report August 2018.
39 Talison Lithium Australia Pty Ltd. Greenbushes Lithium Mine Expansion Environmental Referral Supporting Report. July 2018. Further details in South West Development Commission, Western Australian Government. Major Projects South West Report August 2018
40 The Greenbushes second-stage expansion was originally planned to be completed by late 2020 but media reports suggest that the upgrade is currently on hold.
41 ibid.
42 ibid.
43 Liontown Resources Ltd. ASX Release 9 July 2019.
44 ibid.
45 Liontown Resources Ltd. ASX Release 4 September 2018.
46 Liontown Resources Ltd. ASX Release 9 July 2019.
47 ibid.
48 Liontown Resources Ltd. ASX Release 13 February 2020.
49 Galaxy Resources Ltd. ASX Release 28 February 2011.
50 Compiled from Galaxy Resources Ltd Annual Reports 2010, 2011 and 2012.
51 ibid.
52 ibid.
53 Galaxy Resources Ltd. Annual Report 2015. ASX Release 31 December 2015.
54 ibid.
55 Galaxy Resources Ltd Annual Report 2016. ASX Release 31 December 2016.
56 Galaxy Resources Ltd. Quarterly Report. ASX Release 16 January 2018.
57 Galaxy Resources Ltd. Quarterly Report. ASX Release 24 January 2019.
58 Galaxy Resources Ltd. ASX Release 23 January 2019.
59 Pilbara Minerals Ltd. ASX Release 28 July 2014.
60 Pilbara Minerals Ltd. ASX Release 17 September 2018.
61 ibid.
62 Pilbara Minerals Ltd. ASX Release 21 June 2018.
63 Pilbara Minerals Ltd. Annual Report. ASX Release 9 October 2018.
64 Pilbara Minerals Ltd. ASX Release 3 August 2018.
65 Pilbara Minerals Ltd. ASX Release 12 November 2018.
66 Pilbara Minerals Ltd. ASX Release 26 March 2019.
67 Pilbara Minerals Ltd. ASX Release 9 October 2018.
68 Pilbara Minerals Ltd. Quarterly Report. ASX Release 29 April 2019.
69 Pilbara Minerals Ltd. Annual Report. ASX Release 9 October 2018.
70 ibid.
71 The MARBL Lithium Joint Venture is between Albemarle Corporation (60%) and Mineral Resources Ltd (40%).
72 Mineral Resources Ltd. Quarterly Report. ASX Release 31 July 2017.
73 Mineral Resources Ltd. Annual report 2018. ASX Release 18 October 2018.
74 Mineral Resources Ltd. Half year profit announcement. ASX Release 21 February 2019.
75 ibid.
76 Mineral Resources Ltd. ASX Release 23 October 2018.
77 Mineral Resources Ltd. Quarterly report. ASX Release 24 October 2019.
78 ibid.
79 ibid.
80 ibid
81 Mineral Resources Ltd. Annual report 2018. ASX Release 18 October 2018.
82 Mineral Resources Ltd. Conference Presentation. ASX Release 2 May 2018.
83 Mineral resources Ltd. ASX Release 1 November 2019.
84 ibid.
85 Alkane Resources Ltd. Presentation. ASX release 10 November 2015.
86 Alkane Resources Ltd. ASX Release 11 April 2013.
87 Alkane Resources Ltd. Annual Report 2019.
88 Alkane Resources Ltd. ASX Release 19 September 2011.
89 Alkane Resources Ltd. ASX Release 11 April 2013.
90 Alkane Resources Ltd. ASX Release 27 August 2015.
91 Alkane Resources Ltd. ASX Release 4 June 2018.
92 Ramsden, A.R., French, D.H. and Chalmers, D.I., 1993. Volcanic-hosted rare-metals deposit at Brockman, Western Australia. Mineralium Deposita 28, 1-12.
93 Hastings Rare Metals Ltd. Brockman Project History web page.
94 ibid.
95 ibid.
96 Hastings Rare Metals Ltd. ASX Release 29 January 2016.
97 Hastings Rare Metals Ltd. ASX Release 8 September 2011.
98 Lottermoser, B.G., 1990. Rare-earth element mineralisation within the Mt Weld carbonatitic laterite, Western Australia. Lithos 24, 151-167.
99 Lynas Corporation Ltd. Annual Report 2019.
100 ibid.