Tin
Page last updated:19 December 2023
Please note that this page is currently under review.
Resource figures are current as at 31 December 2017.
Tin (Sn) is a soft, non-toxic, highly malleable, rust and fatigue resistant metal. It is one of the few metals that has been used and traded by humans for more than 5000 years. Tin has a low melting point and alloys easily with other metals, thus enabling humans to combine tin with copper to make bronze, taking us from the Stone Age to the Bronze Age.
Although still used in bronze, tin is used nowadays in solders for joining metals and pipes, as a coating for steel cans and in metal alloys. Solders are the largest single application for tin, accounting for about half of current world consumption. Solders are used in light engineering applications such as plumbing and sheet metal work, in the motor vehicle industry and in cans for various uses.
Another major application for tin is coating steel sheet in the manufacture of tinplate, which accounts for about 16% of world tin consumption. Tinplate is used for containers in the form of cans for food products, drinks, oils, paints, disinfectants and chemicals. Other uses for tin include tin oxide as a white pottery glaze, in the manufacture of plate glass, in superconducting magnets (e.g., niobium-tin), in dyes, disinfectants, perfumes, cast iron, fire retardants, pewter and tinsel.
While tin is not poisonous, organotin compounds can be, and such compounds have been used as fungicides and insecticide, in biocides such as wood preservatives, and also as stabilisers in plastics, such as PVC. Some organotin compounds (e.g., tributyltin, which was used as an anti-fouling agent in paints for marine vessels), can be highly toxic.
Tin occurs in both primary and secondary ore deposits. Primary ore deposits typically occur within granite or within associated pegmatites or aplites. Deposits also occur associated with the margins of these intrusive rocks as veins, disseminations, skarns or carbonate replacements generated by tin-bearing fluids derived from the granite magmas. Carbonate-replacement deposits (such as found in western Tasmania, e.g., Renison) form some of the largest tin deposits in Australia.
Cassiterite (SnO2) is by far the most important tin ore in all deposits. Small amounts of tin are also recovered from sulphide minerals such as stannite (Cu2FeSnS4). Secondary tin deposits (placers) come from the weathering and erosion of primary tin occurrences and deposits, where cassiterite readily forms residual concentrations owing to its density and chemical resistance. Significant amounts of historical tin production in Australia have been from secondary sources, such as in the Mount Garnet region of north Queensland. Much of historical world production has also been from secondary sources.
JORC Reserves
Proved and Probable Ore Reserves published in compliance with the Joint Ore Reserves Committee (JORC) Code amounted to 253 kilotonnes (kt) of tin in 2017 (Table 1). Approximately 67% of Australia’s Ore Reserves of tin are attributable to the Renison Bell mine in Tasmania (Table 2), which is Australia’s only producer of tin as a major product. Minor amounts of by-product tin are also produced from pegmatite deposits such as Greenbushes in Western Australia. The remaining Reserves belong to the Cleveland, Kara and Mount Lindsay deposits in Tasmania and to the Taronga deposit in New South Wales. Ore Reserves were down marginally from 258 kt in 2016 (Table 1).
Table 1. Australia's Ore Reserves of tin, production and potential reserve life, 2002-2017.
| Year | Ore Reserves (kt Sn) | Production1 (kt Sn) | Reserve Life2 (years) |
|---|---|---|---|
| 2017 | 253 | 7.4 | 34 |
| 2016 | 258 | 6.6 | 39 |
| 2015 | 269 | 7.2 | 37 |
| 2014 | 215 | 6.9 | 31 |
| 2013 | 213 | 6.5 | 33 |
| 2012 | 170 | 5.8 | 29 |
| 2011 | 119 | 5.0 | 24 |
| 2010 | 141 | 6.6 | 21 |
| 2009 | 47 | 5.6 | 8 |
| 2008 | 57 | 1.8 | 32 |
| 2007 | 216 | 2.1 | 104 |
| 2006 | 137 | 1.5 | 93 |
| 2005 | 64 | 2.8 | 23 |
| 2004 | 64 | 0.8 | 80 |
| 2003 | 129 | 3.8 | 34 |
| 2002 | 85 | 6.3 | 14 |
kt Sn = kilotonnes of tin content.
- Tin production sourced from Office of the Chief Economist, Department of Industry, Innovation and Science and Australian Government predecessor organisations.
- Reserve life is calculated by dividing the inventory by production. The resulting ratio is a snapshot in time that can only be used for general impressions because it is an average and it assumes (1) that production rates in the future will remain the same as those used in the calculation, (2) deposits deemed economic/uneconomic remain so in the future and (3) that depleted reserves are never replaced.
Table 2. Ore Reserves and Mineral Resources of tin reported in compliance with the JORC Code at operating mines in 2017.
| No. of Operating Mines1 | Ore Reserves2 (kt Sn) | Measured and Indicated Resources3 (kt Sn) | Inferred Resources4 (kt Sn) | Mine Production5 (kt Sn) | Reserve Life (years) | Resource Life 1 (years) | Resource Life 2 (years) |
|---|---|---|---|---|---|---|---|
| 1 | 171 | 215 | 90 | 7.4 | 24 | 30 | 43 |
kt Sn = kilotonnes of tin content.
Reserve Life = Ore Reserves ÷ Production.
Resource Life 1 = (Measured + Indicated Resources) ÷ Production.
Resource Life 2 = (Measured + Indicated + Inferred Resources) ÷ Production.
Reserve and resource life for each mineral commodity is calculated by dividing the inventory by production. The resulting ratio is a snapshot in time that can only be used for general impressions because it is an average and it assumes (1) that production rates in the future will remain the same as those used in the calculation, (2) deposits deemed economic/uneconomic remain so in the future and (3) that depleted resources are never replaced.
- The number of operating mines counts individual mines that operated during 2017 and thus contributed to production. Some of these mines may belong to larger, multi-mine operations and some may have closed during or since 2017.
- The majority of Australian Ore Reserves and Mineral Resources are reported in compliance with the JORC Code, however there are a number of companies that report to foreign stock exchanges using other reporting codes, which are largely equivalent. In addition, Geoscience Australia may hold confidential information for some commodities. NB: Not all operating mines report Ore Reserves. Ore Reserves are as at 31 December 2017.
- Measured and Indicated Mineral Resources are inclusive of the Ore Reserves. NB: Not all operating mines report Mineral Resources. Mineral Resources are as at 31 December 2017.
- Inferred Mineral Resources are as at 31 December 2017. NB: Not all operating mines report Mineral Resources.
- The Office of the Chief Economist reports tin production of 7.4 kt in 2017, however the sole operating mine (Renison Bell) reports 7.1 kt. The remainder is interpreted to be by-product from other operations such as Greenbushes. Production data often have a higher level of certainty than reserve and resource estimates and, thus, may be presented with more significant figures.
Identified Resources
More than 100 Australian deposits are known to contain tin but mostly in Subeconomic or Inferred resource categories. The bulk of Australia’s tin resources occur in eastern Australia with Tasmania holding 76% of Economic Demonstrated Resources (EDR), followed by Queensland (12%) and New South Wales (11%). On the other side of the country, tin occurs in the Wodgina deposit in Western Australia’s Pilbara region (1% of EDR), and also Greenbushes (for which no tin resource is publicly reported).
Accessible EDR
Some resources are inaccessible for mining because of environmental restrictions, government policies or because they occur within military lands or national parks. All of Australia’s EDR of tin is considered to be accessible.
Table 3. Australia's identified tin resources and world figures (kt Sn) for selected years from 1975-2017.
| Year | Demonstrated Resources | Inferred Resources2 | Accessible EDR3 | Australian Mine Production4 | World Economic Resources5 | World Mine Production6 | ||
|---|---|---|---|---|---|---|---|---|
| Economic (EDR)1 | Paramarginal | Submarginal | ||||||
| 2017 | 415 | 63 | 32 | 372 | 415 | 7.4 | 4740 | 290 |
| 2016 | 486 | 65 | 31 | 319 | 486 | 6.6 | 4657 | 278 |
| 2015 | 434 | 65 | 31 | 316 | 434 | 7.2 | 4900 | 270 |
| 2014 | 413 | 65 | 31 | 316 | 413 | 6.9 | 4843 | 297 |
| 2013 | 366 | 65 | 31 | 381 | 366 | 6.5 | 4826 | 231 |
| 2012 | 277 | 65 | 31 | 262 | 277 | 5.8 | 4947 | 228 |
| 2011 | 243 | 65 | 32 | 231 | 243 | 5.0 | 4863 | 250 |
| 2010 | 358 | 21 | 27 | 373 | 358 | 6.6 | 5378 | 278 |
| 2009 | 176 | 63 | 27 | 395 | 176 | 5.6 | 5560 | 332 |
| 2008 | 145 | 59 | 48 | 429 | 145 | 1.8 | 5660 | 332 |
| 2007 | 247 | 59 | 195 | 306 | 247 | 2.1 | 6100 | 300 |
| 2006 | 247 | 48 | 128 | 309 | 247 | 1.5 | 6100 | 273 |
| 2005 | 163 | 95 | 134 | 290 | 163 | 2.8 | 6100 | 280 |
| 2000 | 107 | 24 | 166 | 337 | 107 | 9.1 | 9600 | 200 |
| 1995 | 136 | 46 | 143 | 345 | 136 | 8.7 | 7000 | 180 |
| 1990 | 146 | 79 | 77 | 664 | 146 | 7.4 | 5920 | 216 |
| 1985 | 262 | 75 | 705 | 262 | 6.4 | 3000 | 156.9 | |
| 1980 | 209 | 127 | 209 | 11.6 | 9700 | 199.5 | ||
| 1975 | 332 | 332 | 9.6 | 10160 | 175.7 | |||
kt Sn = kilotonnes of tin content
- Economic Demonstrated Resources (EDR) predominantly comprise Ore Reserves and most Measured and Indicated Mineral Resources that have been reported in compliance with the Joint Ore Reserves Committee (JORC) Code to the Australian Securities Exchange (ASX). In addition, some reserves and resources have been reported using other reporting codes to foreign stock exchanges and Geoscience Australia may hold confidential data for some commodities.
- Total Inferred Resources in economic, subeconomic and undifferentiated categories.
- Accessible Economic Demonstrated Resources (AEDR) is the portion of total EDR that is accessible for mining. AEDR does not include resources that are inaccessible for mining because of environmental restrictions, government policies or military lands.
- Australian mine production from Resources and Energy Quarterly, June 2018 published by the Office of the Chief Economist, Department of Industry, Innovation and Science unless otherwise stated. Production data often have a higher level of certainty than reserve and resource estimates and, thus, may be presented with more significant figures.
- World economic resources from Mineral Commodity Summaries 2018 published by the USGS and adjusted with Geoscience Australia data, unless otherwise stated.
- World production from Mineral Commodity Summaries 2018 published by the USGS and adjusted with Geoscience Australia data, unless otherwise stated.
Exploration
Data on exploration expenditure for tin are not available in published statistics.
Production
Tin is currently only produced as a major product from the Renison mine in Tasmania. The only other mine which produced significant tin as a major product, Mount Bischoff in Tasmania, ceased production in 2011.
According to the Office of the Chief Economist, domestic mine production of tin amounted to 7.4 kt in 20171, of which 7.1 kt is attributable to Renison. The remainder is thought to be a by-product from the Greenbushes lithium-tantalum operation in Western Australia. An additional, unquantified source, may also be from minor trial production at the Granville East Mine (Tasmania). Australian tin production in 2017 was up from 6.6 kt in 2016.
World Ranking
Based on estimates provided by the USGS and adjusted for Australia, world economic resources of tin amounted to approximately 4740 kt, largely unchanged from the previous year (4657 kt; Table 3). On the global stage, China dominates production and resources. China’s share of global tin resources amounts to 23% followed by Indonesia (16%), Brazil (14%) and Australia (9%; Table 4). The top three tin producers are China (34%), Burma and Indonesia (17% each; Table 5). Australia ranks seventh for tin production (Table 5), despite production predominantly coming from a single source.
Table 4. World economic resources of tin 2017.
| Rank | Country | Economic Resources (kt Sn) | Percentage of World Total |
|---|---|---|---|
| 1 | China | 1100 | 23% |
| 2 | Indonesia | 800 | 16% |
| 3 | Brazil | 700 | 14% |
| 4 | Australia | 415 | 9% |
| 5 | Bolivia | 400 | 8% |
| 6 | Russia | 350 | 7% |
| 7 | Malaysia | 250 | 5% |
| Others | 650 | 14% | |
| Total | 4740 |
kt Sn = thousand tonnes of tin content.
Source: United States Geological Survey2 and Geoscience Australia. National figures other than Australia are rounded. Percentages are also rounded and might not add up to 100%.
Table 5. World production of tin 2017.
| Rank | Country | Production (kt Sn) | Percentage of World Total |
|---|---|---|---|
| 1 | China | 100 | 34% |
| 2 | Burma | 50.0 | 17% |
| 3 | Indonesia | 50.0 | 17% |
| 4 | Brazil | 25.5 | 9% |
| 5 | Bolivia | 18.0 | 6% |
| 6 | Peru | 18.0 | 6% |
| 7 | Australia | 7.4 | 3% |
| Others | 21.7 | 7% | |
| Total | 290 |
kt V = thousand tonnes of vanadium content.
Source: United States Geological Survey3. National figures other than Australia are rounded. Percentages are also rounded and might not add up to 100%.
Industry Developments
The price of tin on the London Metal Exchange has recovered significantly from lows of around US$15 000/t in 2015 and 2016 to between US$19 000/t to US$22 000/t (~AU$25 000/t to AU$28 000/t) in late 2018 to early 2019. Despite the improved price for tin, exploration by many companies over this period has been scaled down with the exception of ongoing operations at Renison.
All reported reserves and resources of tin in Australia are compliant with the JORC Code unless otherwise stated. Major deposits are shown in Figure 1 on a total resource basis.
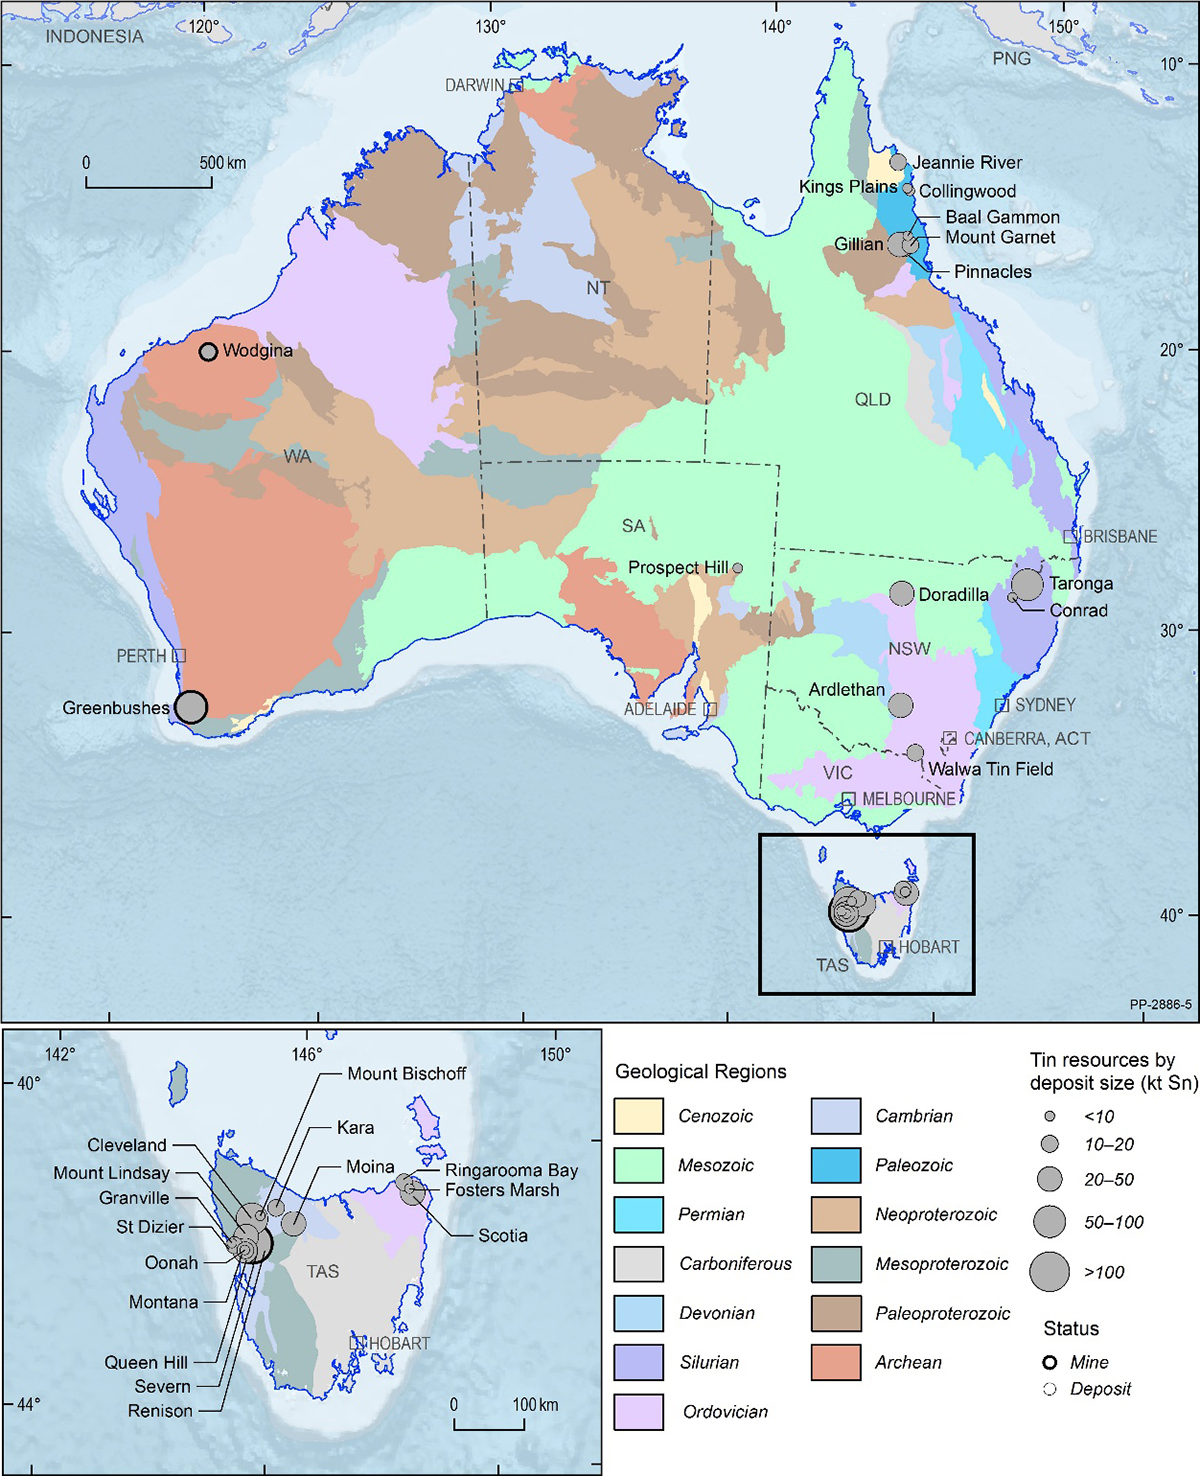
Figure 1. Australian tin deposits as at 31 December 2017.
kt Sn = thousand tonnes of tin content. Resource size is based on total resources (Measured + Indicated + Inferred, inclusive of Ore Reserves).
Conrad: The Conrad Project (previously Conrads Silver Project), 25 km south of Inverell in northeast New South Wales, was purchased by Silver Mines Ltd in 2017 from Malachite Resources NL. Minimal exploration has been undertaken over the past 6 years. The current resource figures for the Conrad and King Conrad lodes have combined Indicated Resources of 658 kt at 128.8 g/t Ag, 0.24% Cu, 1.69% lead (Pb), 0.68% zinc (Zn), 0.28% Sn and 8.3 g/t In, as well as Inferred Resources of 1994 kt at 97.6 g/t Ag, 0.19% Cu, 1.21% Pb, 0.48% Zn, 0.21% Sn and 6.3 g/t In4. This is total tin resource of 2.65 Mt at 0.22% Sn for 5.83 kt of contained metal. Tin is present as stannite and cassiterite. A preliminary scoping study into the Conrad deposit highlighted the narrow width of ore zones (largely 0.6 m to 0.8 m) and the sensitivity of such to the economics of the deposit5. Silver Mines Ltd has indicated that they are looking to divest the property6.
Doradilla and Tallebung: In late 2012, Aurelia Metals Ltd (at the time YTC Resources Limited) announced it had reached agreement with Straits Resources Ltd to acquire 100% of the Doradilla Tin Project. The Doradilla Project, which is 55 km southeast of Bourke in New South Wales, contains the Doradilla, Midway-East Midway and 3KEL tin deposits. These deposits occur within a linear skarn unit traceable for more than 17 km along strike. Mineralisation is thought to be genetically related to the mid-Triassic Midway granite. The resource is limited to the weathered zone where tin is hosted in stanniferous goethite, garnet, secondary cassiterite and minor primary cassiterite. The most recent resource estimate (2008) has a combined Inferred Resource at Midway and 3KEL deposits of 7.81 Mt averaging 0.28% Sn at a cut-off grade of 0.1% Sn, for 22.3 kt of contained tin7. The Doradilla project has been subject to minimal exploration over the last 5 years.
Following a switch in focus by Aurelia on to the Hera deposit (Cobar region), the company indicated it was disposing of the Doradilla deposit and the Tallebung tin-tungsten deposit, both held in Aurelia’s 100% owned subsidiary Stannum Pty Ltd. Aurelia sold Stannum to Big Sky Metals Pty Ltd (BSM) in June 2018, maintaining a 25% interest in BSM. In late 2018, Planet Gas announced a proposal to acquire 100% of BSM, and change their focus to tin and tungsten exploration, and their name to Sky Metals Ltd8. Planet Gas indicated they aim to undertake a two-year exploration program initially focusing on tin and tungsten.
The Tallebung Project, located some 50 km northwest of Condobolin in New South Wales, comprises tin-tungsten mineralisation within sheeted and stockwork cassiterite-wolframite-bearing quartz veins on Ordovician sediments above the Silurian Erimeran granite. The Tallebung deposit has historic mining—both alluvial and hard rock—mostly from the 1960s and early 1970s. The deposit is thought to have potential for a large tonnage low-grade tin deposit, however, no JORC compliant resource exist for this deposit at present.
Taronga and Torrington: Aus Tin Mining Ltd (previously AusNiCo Ltd) acquired all of the shares in Taronga Mines Limited in 2013, including ownership of the large, low-grade Taronga deposit. The deposit is located about 7 km northwest of Emmaville and 50 km north of Glen Innes, in New South Wales. The mineralisation occurs as a sheeted vein system within two main zones (northern and southern) of mineralisation about 300 m apart. Tin occurs predominantly as cassiterite largely within quartz veins in the host volcano-sedimentary rocks.
Aus Tin Mining released a maiden JORC Code resource estimate for the Taronga deposit in August 20139. Indicated Resources, which include a larger northern zone (19.3 Mt) and a southern zone (7.6 Mt), are 26.9 Mt at 0.17% Sn for a contained 45 kt of tin. The deposit also has an Inferred Resource estimate of 9.4 Mt at 0.13% Sn for a contained 12.2 kt of tin. In addition, the resource figures include Inferred Resources of 36.3 Mt at 0.07% Cu and 3.8 g/t Ag, for a contained 26.4 kt of Cu and 4.4 million ounces of Ag. Resource figures were calculated using a 0.1% Sn cut-off.
Aus Tin Mining completed a positive updated prefeasibility study in April 201410. Newmont completed a prior prefeasibility study for Taronga in 198211. As part of the prefeasibility study, Aus Tin Mining released a maiden Probable Ore Reserve for Taronga of 22.0 Mt at 0.16% Sn for 35.6 kt of contained metal, of which 25.6 kt of tin were in the larger northern zone. Additional metallurgical test work in 2015 demonstrated that improved tin-in-concentrate grades (to approximately 65%) and improved tin recovery (approximately 76%) was achievable12. In April 2015, the Company announced a Stage 1 trial open-cut mining and pilot-plant processing operation for Taronga, with a plan to mine approximately 330 kt of ore over a 12-month period13. Progression of Stage 1 has continued since then, with the company obtaining State approval for the development in January 2018 and granting of a mining lease in September 2018. The company has since developed a mining operation plan which is awaiting approval14. The company intend to produce a sulphide concentrate to evaluate the recovery of by-product metals, including copper and silver15. During 2018, Aus Tin Mining demonstrated that ore sorting at Taronga could improve head grades and tin recovery and was considering this for Stage 116.
Aus Tin Mining has also undertaken exploration within the nearby Torrington Tin Project at the McDonalds prospect, approximately 20 km north of Emmaville, as well as the Dutchman and Harts prospect, west of Torrington. The company is assessing these prospects and other surrounding tin deposits as potential feed for Taronga.
Mount Garnet: The Mount Garnet Project, 200 km southwest of Cairns in north Qld, is 100% owned by Consolidated Tin Mines Ltd. The project, centred within a 25 km radius of Mount Garnet, includes the Gillian, Pinnacles, Windemere, and Deadmans Gully deposits, as well as several smaller alluvial and hard rock tin deposits (including those in the Coolgarra group). The Gillian, Pinnacles and Windemere deposits are in iron-rich skarns adjacent to granitic intrusions, while the Coolgarra area contains sediment-hosted and granite greisen mineralisation.
The most recent resource estimate reported a total JORC-compliant mineral resource of ~12 Mt at 0.4% Sn and 23.4% Fe (for a contained 48 kt of tin), of which 1.2 Mt at 0.86% Sn and 7.9 Mt at 0.36% Sn are in the Measured and Indicated categories, respectively17. More than half of the tin resource is contained within the Pinnacles deposit, although highest average tin grades are reported from the Gillian deposit. The Mount Garnet project also has a total resource of 7.0 Mt at 5.8% F, of which 5.46 Mt are in the Indicated category.
The Mount Garnet skarn deposits contain fine-grained cassiterite which is metallurgically difficult to recover. During 2011-2012, Consolidated undertook metallurgical testing to separate the fine cassiterite from the ironstone skarn material, including processing an 80 t sample from the Gillian Project at the Talison mine site at Greenbushes in Western Australia. Results of the metallurgical testing were incorporated into their 2013 prefeasibility study on Gillian and Pinnacles18. The company undertook a Definitive Feasibility Study (DFS) of the Gillian deposit with preliminary results (December 2015) indicating that, with the tin price at that time, further resources would be required to improve the financial viability, leading to the Pinnacles deposit being added to the DFS19. The amended DFS has not been released.
In 2017, the company suggested their long term plans involved tin mining at Mount Garnet (with 500 ktpa ore)20. Consolidated has concentrated on base metal resources since that time, including the operating Mount Garnet base-metal mine. The company also owns the Jeannie River prospect, 92 km northwest of Cooktown in north Queensland, which has an undifferentiated Inferred Resource of 2240 kt at 0.60% Sn21. The Jeannie River prospect comprises parallel cassiterite mineralised quartz veins. The company sold the now-closed Baal Gammon mine, near Herberton in north Queensland, in 2017. The multi-commodity deposit has an Indicated Resource dating from 2012 of 2.8 Mt at 40 g/t Ag, 1.0% Cu, 0.2% Sn and 38 g/t indium for a contained 5.5 kt of tin22.
Prospect Hill: In 2007, Havilah Resources NL entered into a joint venture (Havilah; earning up to 85%) with the private investor owners of the Prospect Hill Tin Project, located in the northern Flinders Ranges of South Australia. Through initial exploration up to 2010, Havilah has earned a 65% interest in the project, with an additional 20% dependent on completion of a feasibility study. Minimal exploration appears to have been undertaken since 2011. The South Ridge prospect within the Prospect Hill project area contains Inferred Resources of 172 kt at 1.15% Sn, reported in 200723.
Renison, Rentails and Mount Bischoff: The Renison (previously Renison Bell) deposit, approximately15 kilometres northeast of Zeehan in western Tasmania, is equally owned by Metals X Ltd and Chinese company Yunnan Tin Group, through their Bluestone Mines Tasmania Joint Venture (BMTJV). Mineralisation at Renison dominantly occurs as stratabound massive sulphides replacing carbonate units of the Late Proterozoic to Early Cambrian Success Creek Group and Crimson Creek Formation, and also as massive sulphides or stringer/vein zones within fault-bound blocks. Tin is present as cassiterite. Mining at Renison has been undertaken for more than 100 years, starting with alluvial mining followed by hard-rock mining of surface outcrops. The current phase of underground mining began in 1968.
The most recent global resource estimate24 suggests that the Renison deposit had, in 2012, a contained 432 kt of tin metal (based on approximately 30 Mt at 1.44% Sn), this is, however, a minimum estimate. Metals X figures indicate approximately 260 Kt of tin has been produced since 1968, i.e., during the current phase of mining. This equates to approximately 370 kt of total contained tin mined (using typical recovery rates of around 70%). Combined with current Reserve figures (16.9 kt of Proved and 51.8 kt of Probable contained tin) gives a total post-1968 production plus in-ground Reserve of ~440 kt of Sn metal. The Renison deposit also contains by-product copper (Cu), with an estimated a global resource of 1.93 Mt at 0.35% Cu25.
The latest resource figures26 for Renison include Measured Resources of 1540 kt at 1.69% Sn, Indicated Resources of 7142 kt at 1.30% Sn and Inferred Resources of 7756 kt at 1.25% Sn, for a contained ~215 kt of tin. The resource includes Proved Reserves of 1310 kt at 1.29% Sn and Probable Reserves of 5512 kt at 0.94% Sn for a contained 68.8 kt of tin. Renison has total copper resources of 34 kt and total copper Ore Reserves of 15.2 kt.
Current operations are from the Renison underground mine with ore from the mine treated at the Renison concentrator at a rate of 700 kilotonnes per annum (ktpa). During mid-2018, Renison completed construction of a new crushing, screening and ore sorting plant, which allows underground production of approximately 920 ktpa27. Inclusion of this in the processing workflow is expected to reject some 200 kt of ore, resulting in upgraded ore going to the 720 ktpa processing plant. Tin production for 2017 was 7.1 kt of metal28 and production for 2018 was 6.6 kt of metal29; figures for copper production have not been reported. A copper circuit was commissioned in December 2010, with production of up to 500 tonnes per annum (tpa) of copper-in-concentrate30. The company is carrying out both underground and surface exploration around the Renison deposit. Current areas of exploration include the Area 5, Deep Federal, Leatherwood and Huon North lodes. Metals X announced high grade intersections in the Area 5 and Leatherwood zones of 6-20 m at 2-6% Sn31.
The BMTJV, in addition to the Renison mine, includes the Renison Expansion Project (Rentails) and the Mount Bischoff Tin Project. Significant tailings produced by tin ore processing since 1968 exist at the Renison mine. In 2009, Metals X completed a feasibility study on proposals to recover tin from these tailing; their Rentails Project32. The company recently completed a positive updated DFS33 based on an 11-year processing life at 2 million tonnes per annum (Mtpa), producing approximately 5 400 tpa of tin and 2 200 tpa of copper. Metals X indicate that, together, Rentails and Renison would produce 13.4 to 13.9 ktpa of tin. Current resources at Rentails comprise Measured Resources of 23.886 Mt averaging 0.44% Sn and 0.22% Cu, for a contained 104 kt of tin and 52.7 kt of copper34. The resource includes Probable Reserves of 22.313 Mt at 0.44% Sn and 0.23% Cu (for 98.9 kt of tin and 50.7 kt of copper). Metals X indicated that a development proposal would be lodged in 201935.
Mining ceased at Mount Bischoff, 40 km north of Renison, in July 2010 with the last ore processed in late 2010. Significant resources remain at depth and may be amenable to mining if the tin price increases. The deposit, which is on care and maintenance, has a current resource estimate of 1.7 Mt at 0.54% Sn (containing 9 kt of tin)36. Reports suggest 65 kt of tin metal have been produced from the Mount Bischoff deposit, comprising approximately 60 kt of historical production (since the late 1800s, predominantly 1875 to 1905) and 5 kt by Metals X in the period 2009 to 2010. Mineralisation at Mt Bischoff is dominantly hosted within cassiterite-bearing massive sulphide zones replacing carbonates of the Neoproterozoic Mount Bischoff Beds. Mineralisation is thought to be related to the Devonian Meredith granite, and porphyries associated with the granite are themselves mineralised.
Mount Lindsay: The Mount Lindsay tin-tungsten deposit, about 125 km south of Burnie by road, is wholly owned by Venture Minerals Limited. Located 15 km northwest of the Renison tin mine and 20 km west of Rosebery in western Tasmania, the prospect occurs in magnetite (Fe3O4) rich skarns within the contact aureole of the Meredith granite. This granite is part of a suite of Devonian (to Early Carboniferous) granites that are the source rocks for large tin, tungsten and magnetite deposits in western Tasmania and King Island.
The Mount Lindsay tin-tungsten deposit has combined resources of 45 Mt at 0.4% Sn equivalent based on a 0.2% Sn cut-off (56% in the Measured and Indicated Resource categories) or 13 Mt at 0.7% Sn equivalent based on a 0.45% cut-off (73% in the Measured and Indicated Resource categories)37. Reserves comprise Proven Ore Reserves of 6.4 Mt at 0.2% Sn, 0.2% tungsten oxide (WO3) and 0.1% Cu, and Probable Ore Reserves of 7.3 Mt at 0.2% Sn, 0.1% WO3, and 0.1% Cu, for a contained 30 kt of tin38. The deposit also includes an iron resource.
In late 2012, Venture completed a bankable feasibility study (BFS) for Mount Lindsay, which highlighted the long-term potential of the deposit39. Highlights of the BFS included a mine life of nine years, a plant capacity of 1.75 Mtpa, a payback period of four years and a capital cost of just under $200 million. The BFS assumed tin prices of US$23 800/t. The company also completed a pilot-scale metallurgical program in August 2012 that demonstrated recoveries of 72% Sn and 83% WO3, as well as high grade tungsten concentrate (more than 66% WO3)40. A mining lease for the Mount Lindsay Project was granted in mid-201441. Since 2014, Venture has undertaken low-cost reconnaissance exploration seeking to identify additional high-grade tin-tungsten targets close to the Mount Lindsay deposit, such as Big Wilson, Webbs Creek, Stanley, Salmons and Mount Ramsey. In mid-2018, Venture commenced a scoping study investigating the feasibility of underground mining of the high-grade portions of the deposit42. Results are expected in 2019.
Heemskirk: The Heemskirk Tin Project in western Tasmania, is 100% owned by Stellar Resources Ltd and comprises the Queen Hill, Montana and Severn deposits (all near Zeehan), and the St Dizier deposit, 20 km northwest of Zeehan. The deposits comprise cassiterite-bearing stockwork and replacement-style mineralisation, related to Devonian Zeehan-group granites, and cassiterite-bearing skarn mineralisation related to the Heemskirk Granite (St Dizier). In 2016, the company released 2012 JORC-compliant estimates for the Zeehan deposits amounting to a combined mineral resource of 6.35 Mt at 1.13% Sn for 72 kt of tin43. These include Indicated Resources of 1.29 Mt at 1.32% Sn at the Queen Hill deposit (17 kt of tin). The majority of the resource is in the Severn deposit, with an Inferred Resource of 4.03 Mt at 0.97% Sn (39 kt tin).
Stellar completed a favourable scoping study for the three deposits in July 2011 highlighting the potential for an economic underground tin mine44. The company completed a positive prefeasibility study in mid-2013 that indicated an initial mine life of seven years with an annual production of around 4.3 kt of tin-in-concentrate, and a head grade of 1.06% Sn45. Metallurgical test work on the Heemskirk ores has suggested concentrate grades approaching 48% Sn with an overall tin recovery of 70%.
Since 2013, Stellar has been exploring several development options for the Zeehan deposits. Options include concurrently mining the three deposits (with a seven-year mine life) or mining them sequentially (20-year mine life).
The company drilled the lower Queen Hill and Severn deposits in 2017 and 2018, but indicated more work is required to upgrade the resource. Stellar plans to undertake a DFS, including additional diamond drilling to upgrade resource estimates and convert Mineral Resources to Ore Reserves. The company indicated, in early 2019, that a resource update was underway for the Heemskirk Project46. A mining lease for the deposits was granted in February 2017.
In March 2014, Stellar reported mineral resource estimates for the nearby St Dizier deposit totaling 2.26 Mt at 0.61% Sn for a contained 13.8 kt of tin metal47. The estimate includes Indicated Resources of 1.20 Mt at 0.69% Sn (8.3 kt tin). A mining lease was granted for St Dizier in early 2019. The company released a positive scoping study (updated from the initial 2015 study) for the deposit in early 201948 investigating the viability of an open-pit mine. The study relied on a US$20 000/t tin price with a mine life of 30 months producing 1.8 kt of tin-in-concentrate. The scoping study used the 2014 Indicated Resource estimate. Exploration has continued in the Zeehan region, most recently in the Razorback and Montana Flats regions; Stellar is intending to release a resource estimate for the Oonah deposit (Montana Flats) in 2019.
Cleveland: In mid-2013, the Australian based Elementos Ltd acquired the Cleveland Tin Project through a merger with the unlisted Rockwell Minerals Ltd, which previously controlled the project and owned 50% of the asset. The Cleveland project is located 60 km southwest of Burnie in Tasmania and includes the underground tin-copper Cleveland mine. Cleveland was mined sporadically since the early 1900s, with modern mining commenced in 1968. The underground mine, which was mined by Aberfoyle Ltd between 1968 and 1986, produced about 23.5 kt of tin and 9.7 kt of copper-in-concentrate (from approximately 5.6 Mt of ore). The mine closed as a result of low tin prices in the late 1980s.
Mineralisation at Cleveland is thought to be related to the nearby Meredith granite and is mainly hosted in vertical-dipping, semi-massive sulphide lenses replacing limestone. Tin is present as cassiterite and minor stannite. The Cleveland project also includes a large, low-grade, tin-copper tailings dam, as well as the Foley Zone tungsten deposit.
Since 2013, Elementos has reported on three studies investigating the development potential of the Cleveland resources. The most recent resource figures for the project49 are 7.47 Mt at 0.75% Sn and 0.30% Cu for 56.1 kt of tin and 22.2 kt of copper, including Indicated Resources of 6.23 Mt. The total mineral resource estimate includes an underground resource (5.58 Mt at 0.68% Sn and 0.28% Cu) and an open pit resource (1.89 Mt at 0.95% Sn and 0.34% Cu). Elementos are focusing on developing the open-cut and tailings resources prior to moving to underground mining. The tailings dam resource contains Indicated Resources of 3.85 Mt at 0.30% Sn and 0.13% Cu for 11.6 kt of tin, of which 3.7 Mt at 0.29% Sn and 0.13% Cu are Probable Reserves (11 kt of tin and 5 kt of copper)50. Rockwell had previously completed an internal scoping study which demonstrated the reprocessing potential of the tailings.
A JORC Code compliant Inferred Resource of 3980 kt at 0.30% WO3, for a contained 12 kt of WO3, has also been estimated for the adjacent Foley Zone tungsten deposit51. The tungsten occurs as wolframite hosted within a quartz stock work.
Granville: In 2016, Aus Tin Mining Ltd acquired the Granville Tin Project, via their wholly-owned subsidiary Ten Star Mining Pty Ltd. Granville is located approximately 20 km north of Zeehan in western Tasmania. Mineralisation at Granville occurs within a thin magnetite skarn horizon within the Neoproterozoic Oonah Formation.
At the time of purchase, the Granville project included an open-cut mine and processing plant on care and maintenance. Aus Tin Mining undertook the refurbishment of the plant and production of tin concentrate commenced in August 2016, focused on tailings and existing high grade stockpiles from previous mining52. The company completed a successful trial producing approximately five tonnes of high-grade (>60% Sn) tin concentrate in late 201753. Aus Tin Mining indicated that they planned to resume mining from the pit and received approval for expansion of mining in 2017, allowing increased production rates from 2.5 ktpa to 40 ktpa54. The company also published a forecast production rate at the expanded mine of 550 tpa of contained tin55. In early 2019, Aus Tin Mining finalised completion of a new tailings storage facility, as part of the mine expansion, and indicated they would resume tin production and shift from tailings and stockpiles to ore from the Granville East mine56. Mining of ore commenced February 201957.
Greenbushes and Wodgina: At the Greenbushes mine in southwest Western Australia, production of tin ceased with the closure of the smelter in 2007. No publicly reporting of tin resources for the Greenbushes operations has occurred for more than a decade, by either Global Advanced Metals (GAM; owner of the non-lithium rights at Greenbushes) or Talison Lithium (owner of the lithium rights at the deposit). Estimates of tin resources for Greenbushes have not formed part of Australia’s EDR since 2008. GAM has indicated that it has produced by-product tin from its previously owned tantalum deposit at Wodgina about 100 km southeast of Port Hedland in Western Australia, but has not reported the amounts. Mining at Wodgina did not occur between 2012 and March 2017, with new owners Mineral Resources Ltd producing lithium and by-product tantalum. No by-product tin production has been reported by Mineral Resources.
Citation
Bibliographical reference: Champion, D. and Britt, A.F., 2019. Australian Resource Reviews: Tin 2018. Geoscience Australia, Canberra.
References
1 Office of the Chief Economist, Resources and Energy Quarterly, June 2018. Department of Industry, Innovation and Science.
3 ibid.
4 Malachite Resources NL. ASX Release 16 December 2008.
5 ibid.
6 Silver Mines Ltd. Annual Report 2018. ASX Release 28 September 2018.
7 YTC Resources Ltd. ASX Release 3 March 2008.
8 Planet Gas Ltd. ASX Release 22 November 2018.
9 AusNiCo Ltd. ASX Release 26 August 2013.
10 Aus Tin Mining Ltd. ASX Release 7 April 2014.
11 Newmont Holdings PL, 1982. Taronga Project Preliminary Feasibility Study, February 1982.
12 Aus Tin Mining Ltd. ASX Release 7 October 2015.
13 Aus Tin Mining Ltd. ASX Release 15 April 2015.
14 Aus Tin Mining Ltd. ASX Release 14 March 2018.
15 See footnote 8.
16 Aus Tin Mining Ltd. ASX Release 2 July 2018.
17 Consolidated Tin Mines Ltd. ASX Release 25 June 2014.
18 Consolidated Tin Mines Ltd. ASX Release 30 September 2013.
19 Consolidated Tin Mines Ltd. ASX Release 3 December 2015.
20 Consolidated Tin Mines Ltd. ASX Release 1 November 2017.
21 Geoscience Australia estimate based on CEC exploration work from the 1980s.
22 Monto Minerals Ltd. ASX Release 12 January 2012.
23 Havilah Resources NL. ASX Release 27 September 2007.
24 Green, G.R., 2012. Ore deposits and metallogenesis of Tasmania. Episodes 35, 205–215.
25 Metals X Ltd. ASX Release 23 August 2018.
26 ibid.
27 Metals X Ltd. ASX Release 3 July 2018.
28 Metals X Ltd. Quarterly Report December 2017. ASX Release 23 January 2018.
29 Metals X Ltd. Quarterly Report December 2018. ASX Release 23 January 2018.
30 Metals X Ltd. ASX Release 21 December 2010.
31 Metals X Ltd. ASX Release 11 February 2019.
32 Metals X Ltd. Quarterly Report. ASX Release 30 July 2009.
33 Metals X announcement DFS June 2017.
34 Metals X Ltd. ASX Release 23 August 2018.
35 ibid.
36 Metals X Ltd. ASX Release 29 September 2011.
37 Venture Minerals Ltd. Quarterly Report. ASX Release 17 October 2012.
38 Venture Minerals Ltd. ASX Release 7 November 2012.
39 ibid.
40 Venture Minerals Ltd. ASX Release 31 August 2012.
41 Venture Minerals Ltd. ASX Release 3 July 2014.
42 Venture Minerals Ltd. Quarterly Report. ASX Release 31 July 2018.
43 Stellar Resources Ltd. ASX Release 29 November 2016.
44 Stellar Resources Ltd. ASX Release 6 July 2011.
45 Stellar Resources Ltd. ASX Release 24July 2013.
46 Stellar Resources Ltd. ASX Release 14 March 2019.
47 Stellar Resources Ltd. ASX Release 6 March 2014.
48 Stellar Resources Ltd. ASX Release 23 January 2019.
49 Elementos Ltd. ASX Release 26 September 2018.
50 Elementos Ltd. ASX Release 3 August 2015.
51 Elementos Ltd. ASX Release 18 April 2013.
52 Aus Tin Mining Ltd. ASX Release 17 August 2016.
53 Aus Tin Mining Ltd. ASX Release 6 October 2017.
54 Aus Tin Mining Ltd. ASX Release 29 June 2017.
55 ibid.
56 Aus Tin Mining Ltd. ASX Release 18 January 2019.
57 Aus Tin Mining Ltd. ASX Release 18 February 2019.