Tungsten
Page last updated:19 December 2023
Please note that this page is currently under review.
Resource figures are current as at 31 December 2018.
Tungsten (W) and its alloys are amongst the hardest of all metals. In addition to its hardness, tungsten possesses the highest melting point of all pure metals making it useful for many commercial and industrial applications. Tungsten occurs as wolframite, which is an iron manganese tungstate mineral ([Fe,Mn]WO4), and scheelite (CaWO4). Tungsten-bearing deposits occur in Western Australia, the Northern Territory and along the eastern coast of Australia. There is potential for new resource definition and upgrade of existing resources in historical mining areas.
The major use for tungsten is in cemented carbides, also called hard metals, which have a hardness approaching that of diamond – ideal for use in cutting applications and in wear-resistant materials. Tungsten carbides are used primarily in the metalworking, mining, oil drilling and construction industries. Tungsten and its alloys are used in electrodes, filaments (light bulbs), wires, welding and as components in electrical, heating, lighting and the aeronautical industry. Chemical compounds of tungsten are used in a range of applications including catalysts and paint pigments.
Tungsten is not typically sold as a raw ore, it is chemically extracted from crushed ore and a partially refined product, such as ammonium paratungstate (APT), is then sold for further processing. However, alloys for which hardness and heat resistance are required, such as ferrotungsten (FeW), which is used in steel, are commonly produced from rich concentrates, typically with 65% or more contained tungsten trioxide (WO3).
Tungsten is considered a critical mineral by the European Union1, the United Kingdom2 and the United States3. This is due to its economic importance and potential for supply disruption. Tungsten is strategically important, with the United States maintaining a government stockpile of tungsten since the 1940s.
JORC Reserves
As at December 2018, Proved and Probable Ore Reserves of tungsten reported in compliance with the JORC Code amounted to 216.4 thousand tonnes (kt; Table 1) of which 2.9 kt was attributable to Australia's one operating tungsten mine – Kara in Tasmania (Table 2). In 2018, Ore Reserves remained unchanged whilst production increased and, thus, reserve life decreased (Table 1). The reserve life, however, remains very large and this is attributable to the relatively small overall production rate.
Table 1. Australia's tungsten Ore Reserves, production and potential reserve life, 2002-2018.
| Year | Ore Reserves1 (kt W) | Production2 (kt W) | Reserve Life3 (years) |
|---|---|---|---|
| 2018 | 216.4 | 0.02 | >10 000 |
| 2017 | 216.4 | 0.001 | >100 000 |
| 2016 | 215.8 | 0.11 | 1960 |
| 2015 | 225 | 0.35 | 640 |
| 2014 | 225.6 | 0.48 | 470 |
| 2013 | 200 | 0.3 | 660 |
| 2012 | 201 | 0.29 | 690 |
| 2011 | 182 | 0.015 | >10 000 |
| 2010 | 217 | 0.02 | >10 000 |
| 2009 | 40.3 | 0.004 | >10 000 |
| 2008 | 10.7 | 0.01 | >1000 |
| 2007 | 10.8 | 0 | - |
| 2006 | 68.1 | 0 | - |
| 2005 | 2.5 | 0 | - |
| 2004 | 2.5 | 0 | - |
| 2003 | 0 | 0 | - |
| 2002 | 1.7 | 0.11 | 15 |
kt W = thousand tonnes of contained tungsten.
- Ore Reserves are combined Proved and Probable. The majority of Australian Ore Reserves and Mineral Resources are reported in compliance with the JORC Code, however there are a number of companies that report to foreign stock exchanges using other reporting codes, which are largely equivalent. In addition, Geoscience Australia may hold confidential information for some commodities.
- Production is a Geoscience Australia estimate based on company correspondence and reports.
- Reserve life is calculated by dividing the Ore Reserve by production. The resulting ratio is a snapshot in time that can only be used for general impressions because it is an average and it assumes (1) that production rates in the future will remain the same as those used in the calculation, (2) deposits deemed economic/uneconomic remain so in the future and (3) that depleted reserves are never replaced.
Table 2. Tungsten Ore Reserves, Mineral Resources, production, and reserve and resource life at operating mines, 2018.
| No. of Operating Mines1 | Ore Reserves2 (kt W) | Measured and Indicated Resources3 (kt W) | Mine Production4 (kt W) | Reserve Life5 (years) | Resource Life6 (years) |
|---|---|---|---|---|---|
| 1 | 2.9 | 399.8 | 0.02 | 145 | 20 000 |
kt W = thousand tonnes of contained tungsten.
- The number of operating mines counts individual mines that operated during 2018 and thus contributed to production.
- The majority of Australian Ore Reserves and Mineral Resources are reported in compliance with the JORC Code, however there are a number of companies that report to foreign stock exchanges using other reporting codes, which are largely equivalent. In addition, Geoscience Australia may hold confidential information for some commodities. Ore Reserves are as at 31 December 2018.
- Mineral Resources are inclusive of the Ore Reserves. Mineral Resources are as at 31 December 2018.
- Source: Geoscience Australia estimate based on company correspondence.
- Reserve Life = Ore Reserves ÷ Production.
- Resource Life = Measured and Indicated Resources ÷ Production.
Identified Resources
Tungsten resources have been identified in all Australian jurisdictions apart from Victoria and South Australia (Figure 1). Economic Demonstrated Resources (EDR) of tungsten were 394 kt at the end of December 2018, slightly up from 386 kt the previous year (Table 3). Western Australia holds 53% of EDR, Tasmania 26% and Queensland 18%. Minor EDR (<5%) also occurs in the Northern Territory and New South Wales.
Australia's subeconomic resources of tungsten remained unchanged at the end of 2018 at 5 kt. Inferred resources of tungsten increased slightly from 232 kt to 236 kt during 2018.
Accessible EDR
Some mineral resources are inaccessible for mining because of environmental restrictions, government policies or because they occur within military lands or national parks. All of Australia's EDR of tungsten are considered to be accessible.
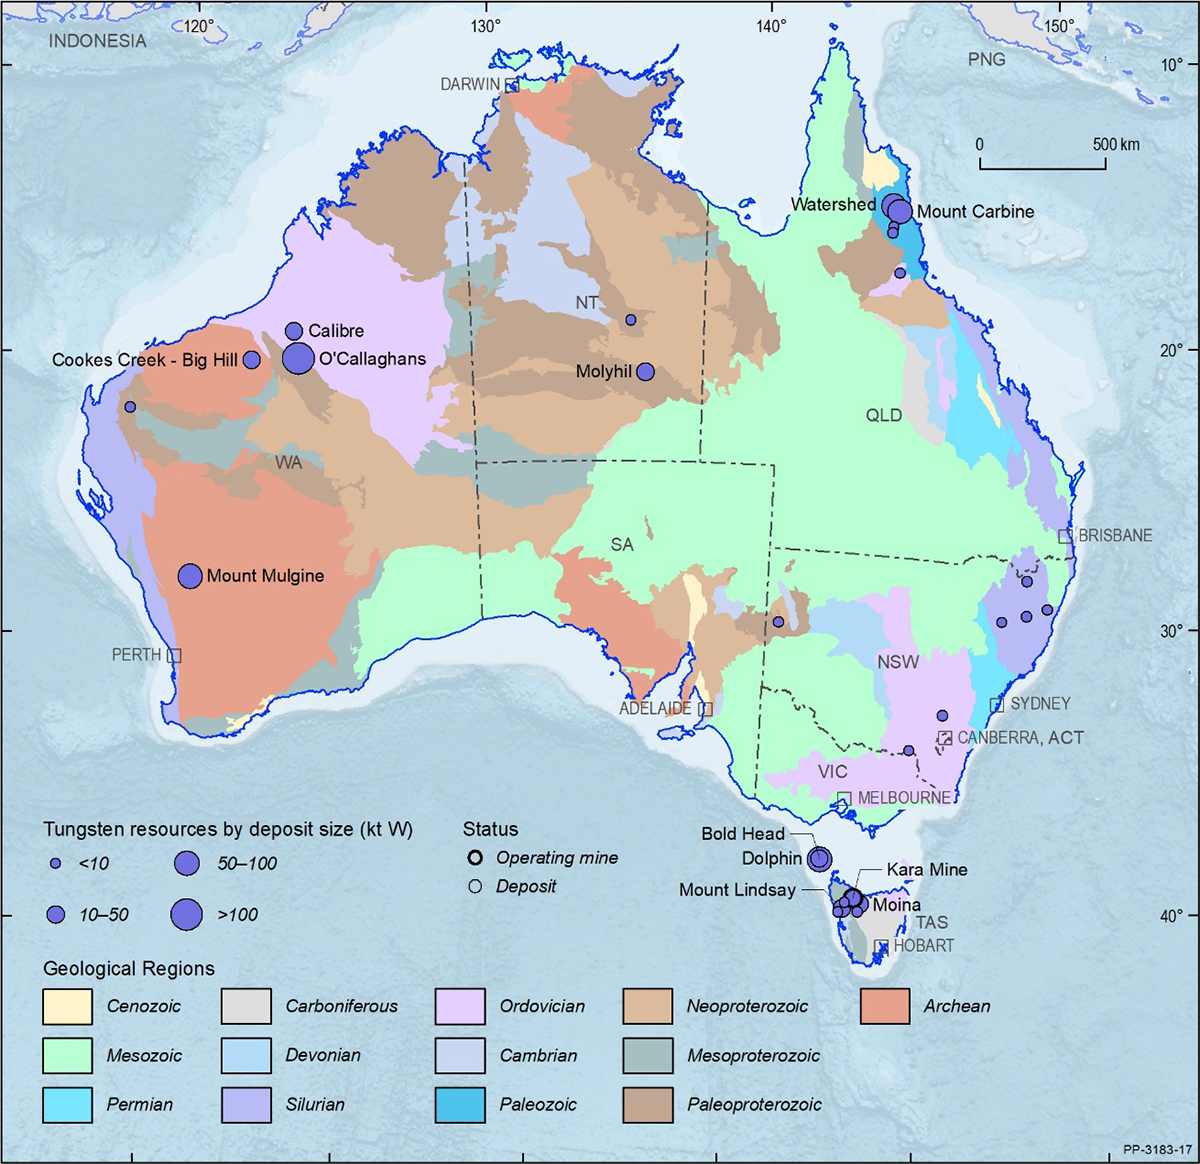
Figure 1. Australian tungsten deposits and operating mines 2018.
kt W = thousand tonnes of contained tungsten. Deposit size is based on total resources (EDR + Subeconomic Resources + Inferred). For clarity, only major or significant deposits are labelled.
Table 3. Australia's identified tungsten resources and world figures for selected years, 1975 to 2018.
| Tungsten (kt W) | ||||||||
|---|---|---|---|---|---|---|---|---|
| Year | Demonstrated Resources | Inferred Resources3 | Accessible EDR4 | Australian Mine Production5 | World Economic Resources6 | World Mine Production6 | ||
| Economic (EDR)1 | Subeconomic2 | |||||||
| Paramarginal | Submarginal | |||||||
| 2018 | 394 | 0 | 5 | 236 | 394 | 0.02 | 3739 | 82 |
| 2017 | 386 | 0 | 5 | 232 | 386 | 0.001 | 3200 | 95 |
| 2016 | 391 | 0.4 | 4.5 | 240 | 391 | 0.11 | 3484 | 86.5 |
| 2015 | 403 | 0.8 | 5 | 236 | 403 | 0.35 | 3610 | 87.3 |
| 2014 | 392 | 0.8 | 5 | 231 | 392 | 0.48 | 3486 | 82.3 |
| 2013 | 396 | 0.8 | 5 | 102 | 162 | 0.3 | 3500 | 71 |
| 2012 | 391 | 11.1 | 5 | 102 | 391 | 0.29 | 3488 | 73.3 |
| 2011 | 376 | 11.1 | 1.4 | 107 | 376 | 0.02 | 3300 | 72 |
| 2010 | 403 | 0.9 | 1.4 | 110 | 403 | 0.02 | 2900 | 61 |
| 2009 | 195.5 | 0.8 | 1.4 | 204 | 195.5 | 0.004 | 2995 | 58 |
| 2008 | 111.5 | 10 | 10.9 | 73.5 | 111.5 | 0.008 | 3000 | 54.6 |
| 2007 | 86.6 | 10 | 18.9 | 52.9 | 86.6 | 0 | 2900 | 89.6 |
| 2006 | 72.1 | 10 | 27.5 | 48 | 72.1 | n.a. | 2900 | 73.3 |
| 2005 | 4.6 | 31.8 | 27.7 | 56.7 | 4.6 | 0 | 2900 | 76.5 |
| 2004 | 4.6 | 31.8 | 27.7 | 56.7 | 4.6 | 0 | 2900 | 60 |
| 2003 | 8.6 | 31.8 | 27.6 | 56.7 | 8.6 | 0 | 2900 | 59.5 |
| 2002 | 8.6 | 31.8 | 28.2 | 56.2 | 8.6 | n.a. | 2900 | 46.6 |
| 2001 | 2.8 | 31.8 | 28.2 | 56.2 | n.a. | n.a. | 1900 | 44.6 |
| 2000 | 7 | 44 | 28 | 49 | n.a. | n.a. | 2000 | 31.5 |
| 1995 | 1 | 34.1 | 28 | 180.10 | n.a. | n.a. | 2100 | 31 |
| 1990 | 5.4 | 117 | 7 | 128 | n.a. | 1.09 | 2566 | 45 |
| 1985 | 75.73 | 67.58 | 73.11 | 115.5 | n.a. | 1.97 | 3460 | 43.33 |
| 1980 | 123.22 | 194.7 | 44.02 | 80.6 | n.a. | 4.51 | 3273 | 60.93 |
| 1975 | 76.7 | 2.2 | 55.8 | n.a. | n.a. | 1.9 | 2060 | 47.7 |
kt W = thousand tonnes of contained tungsten; n.a. = not available.
- Economic Demonstrated Resources (EDR) predominantly comprise Ore Reserves and most Measured and Indicated Mineral Resources that have been reported in compliance with the Joint Ore Reserves Committee (JORC) Code to the Australian Securities Exchange (ASX). In addition, some reserves and resources may have been reported to foreign stock exchanges using other reporting codes, which are largely equivalent to the JORC Code. Geoscience Australia may also hold some confidential data.
- Subeconomic Demonstrated Resources are geologically demonstrated but do not meet the criteria for economic at the time of determination. Subeconomic resources classed as Paramarginal require a modest improvement in the commodity price/cost ratio to render them economic. Subeconomic resources classed as Submarginal require a substantially improved commodity price/cost ratio to render them economic.
- Total Inferred Resources in economic, subeconomic and undifferentiated categories.
- Accessible Economic Demonstrated Resources (AEDR) is the portion of total EDR that is accessible for mining. AEDR does not include resources that are inaccessible for mining because of environmental restrictions, government policies or military lands.
- Source: Geoscience Australia estimate based on company correspondence.
- Source: United States Geological Survey (Mineral Commodity Summaries).
Production
In 2018, the Kara mine in Tasmania, a magnetite skarn, produced scheelite (calcium tungstate) concentrates as a by-product of magnetite processing (Table 2). Kara has been the only operating tungsten mine in Australia since 2016 when Wolfram Camp (Queensland) suspended operations. Historical production in Queensland has also occurred at Mount Carbine and Bamford Hill, in New South Wales at Ardlethan and Torrington, in the Northern Territory at Hatches Creek and in Tasmania at King Island and Oakleigh Creek.
World Ranking
In 2018, world economic resources of tungsten were estimated to be around 3739 kt based on United States Geological Survey (USGS) data and updated by Geoscience Australia for Australia's resources (Table 4). According to the USGS, China holds approximately 51% of the world's resources (Table 4) and accounts for approximately 82% of world production (Table 5). Based on the USGS figures and those updated by Geoscience Australia, Australia has an 11% share of world resources of tungsten (Table 4) but production is minor (Table 5).
Table 4. World economic resources of tungsten 2018.
| Rank | Country | Economic Resources1 (kt W) | Percentage of world total2 |
|---|---|---|---|
| 1 | China | 1900 | 51% |
| 2 | Australia | 394 | 11% |
| 3 | Russia | 240 | 6% |
| 4 | Vietnam | 95 | 3% |
| 5 | Spain | 54 | 1% |
| 6 | UK | 43 | 1% |
| Others | 1013 | 27% | |
| Total | 3739 |
kt W = thousand tonnes of contained tungsten.
- Source: USGS 4 and Geoscience Australia. National figures other than Australia are rounded.
- Percentages are also rounded and might not add up to 100% exactly.
Table 5. World production of tungsten 2018.
| Rank | Country | Production1 (kt W) | Percentage of world total2 |
|---|---|---|---|
| 1 | China | 67.0 | 82% |
| 2 | Vietnam | 6.0 | 7% |
| 3 | Russia | 2.1 | 3% |
| 4 | Bolivia | 1.0 | 1% |
| 5 | Austria | 1.0 | 1% |
| 6 | UK | 0.9 | 1% |
| Others | 3.8 | 5% | |
| Total | 81.7 |
kt W = thousand tonnes of contained tungsten.
- Source: USGS5 and Geoscience Australia. National figures other than Australia are rounded.
- Percentages are also rounded and might not add up to 100% exactly.
Industry Developments
The price of tungsten rose sharply after the global financial crisis of 2007-2008, from less than US$200 per metric tonne unit (MTU)6 of APT in late-2008 to mid-2009 to reach a peak of US$480/MTU in 2011. The price rise is a result of growth in demand and tightening of supply by China. More recently, 2018 saw a high of US$350/MTU in June. However, as the year progressed, prices dropped to approximately US$280/MTU.
During 2019, the industry saw the sale of APT stockpiles held at the failed Fanya Metal Exchange in China to China Molybdenum Co Ltd. The 28.3 kt of APT stocks were estimated to be equivalent to 25-30% of 2018 world APT production, and sold at a premium to the spot price. China Molybdenum Co Ltd is a globally significant producer of molybdenum (Mo), tungsten, cobalt, niobium and copper (Cu), with assets including the Sandaozhuang scheelite mine. Although the company may not re-sell the stocks on the open market unless prices improve, it could potentially use a portion of the stocks in its own downstream manufacturing operations.
This section highlights recent company exploration and development-related activities. Companies use a range of units to report tonnage and grade and these have generally not been converted from the original source material. All reported reserves and resources are compliant with the JORC Code unless otherwise stated.
Exploration Expenditure
Exploration expenditure data for tungsten are not reported by the Australian Bureau of Statistics.
Hatches Creek: The historic Hatches Creek mineral field is located 375 km northeast of Alice Springs within Paleoproterozoic metasedimentary and igneous rocks of the Warramunga Province. The granite-related tungsten mineralisation occurs as wolframite-bearing, quartz-vein systems and is also associated with bismuth, copper, molybdenum, cobalt, lead, silver and minor tin and uranium mineralisation7. Between 1913 and 1977, Hatches Creek produced some 3065 t of 65% WO3 concentrate from shallow lodes grading at 1-3% WO3, along with by-product concentrates of copper (70 t) and bismuth (5.7 t)8.
In 2014, Arunta Resources Ltd published an Inferred Resource of 225 kt at 0.58% WO3 for the historical mine dumps and stockpiles9. In May 2019, GWR Group Ltd released the results of a 13-hole RC drilling campaign, reporting high-grade mineralisation that included individual 1-m intercepts of 4.68% WO3, 3.06% Cu and 3578 ppm Mo10. In June 2019, Tungsten Mining NL farmed into the project with an initial interest of 20%. Tungsten Mining has not yet progressed the project but must within five years of the farm-in date if it wishes to increase its share of the project to 51%11.
Molyhil and Bonya: Tungsten and molybdenum mineralisation was first encountered at Molyhil in 1973. The deposit is situated 220 km northeast of Alice Springs (320 km by road). It consists of two adjacent magnetite skarn bodies with scheelite, molybdenite and magnetite mineralisation. The skarns are hosted by the Marshall Granite in the Aileron Province.
Fama Mines Pty Ltd worked the deposit from 1973 to 1977, when Petrocarb Exploration NL acquired the project. Petrocarb continued open-cut operations, then placed the mine on care and maintenance in 1982 owing to low tungsten prices.
During 2018, Thor Mining Plc completed an upgraded Definitive Feasibility Study at Molyhil and finalised the purchase of a 40% interest in the nearby Bonya Project12. The Bonya Project is a joint venture with Arafura Resources Ltd, who own the remaining 60%, located approximately 30 km east of Molyhil.
During 2019, Thor continued marketing activities aimed at securing finance and offtake agreements for tungsten and molybdenum concentrates. In October 2019, the company reported a combined resource at Molyhil of 4.7 million tonnes (Mt) at 0.28% WO3, 0.14% Mo, 0.05% Cu and 18.0% Fe above a cut-off grade of 0.12% WO3 equivalent13. The revised estimate represents a 1.5% increase of contained tungsten trioxide, a 9.3% increase in contained molybdenum and a new copper resource.
In January 2020, the joint venture partners announced maiden resource estimates for the White Violet and Samarkand tungsten deposits at the Bonya Project14. For White Violet, this was an Inferred Resource of 495 kt, grading 0.22% WO3 and 0.06% Cu, containing 1.09 kt of tungsten trioxide and 0.3 kt of copper. For Samarkand, the Inferred Resource is 245 kt, grading 0.19% WO3 and 0.13% Cu, containing 465 t of tungsten trioxide and 320 t copper. For the Bonya copper deposit, the company previously announced an Inferred Resource of 230 kt, grading 2.0% Cu, containing 4.6 kt copper15.
Mount Carbine: Discovered in the late 19th century, 120 km northwest of Cairns, Mount Carbine comprises wolframite and scheelite in sheeted quartz veins within metasedimentary rocks of the Hodgkinson Formation. Mineralisation is thought to be related to the nearby Permian Mount Carbine Granite. The historic mine, which operated between 1973 and 1987, is owned by Specialty Metals International Ltd (formerly Carbine Tungsten Ltd). The tailings dams are estimated to contain approximately 2 Mt at 0.1% WO316.
Carbine announced a favourable feasibility study in August 2012 for the economic viability of re-establishing the Mount Carbine tungsten mine17. The study considered an open-cut, hard-rock resource along with processing previously stockpiled low-grade material in order to achieve a 15-year project life.
As a result of this study, resource upgrades were reported in June and August 2012. Using a 0.05% WO3 cut-off grade, the revised estimates were an Indicated Mineral Resource of 18.1 Mt at 0.14% WO3 and an Inferred Resource of 29.3 Mt at 0.12 % WO3 for 60.5 kt of tungsten trioxide (48 kt of contained tungsten), beneath and adjacent to the previous open-cut mine18. The company considered the Indicated Resource to also be a Probable Reserve, based on mining 3 Mt per annum (Mtpa) and receiving a price of US$290/MTU19. Hard-rock mining would only commence after processing of the low-grade stockpile had begun20.
In September 2012, Carbine Tungsten released an Indicated Resource of 12 Mt at 0.07% WO3 for the low-grade stockpile21. The company reported a production target of 15 000 MTU of tungsten trioxide in concentrate per month from the low-grade stockpile, suggesting an 8-year mine life.
In 2019, Specialty Metals International reported the first delivery of equipment to the Mount Carbine site, as well the engagement of sub-contractors for the installation of the newly arrived equipment22. The company commenced tailings retreatment in the fourth quarter of 201923, with planning for stockpile processing and open-cut mining continuing in 2020. The company has reported the presence of scheelite mineralisation at the nearby Iron Duke and Petersens Lode exploration permits, and a potential copper-zinc drilling target at Iron Duke.
Watershed: The deposit is located 115 km northwest of Cairns and was originally discovered by Utah Development Company Ltd in the early 1980s. It consists predominantly of quartz-scheelite vein swarms within metasedimentary rocks of the Hodgkinson Province.
Vital Metals Ltd completed a Definitive Feasibility Study in 2014 and identified an open-cut mining method using excavators and trucks, with the potential to produce 2 Mtpa over an initial mine life of 10 years24.
In July 2018, Vital Metals reported 70.4 kt of contained tungsten at a cut-off grade of 0.05%25. Mineral Resources are 49.3 Mt at a combined grade of 0.14% WO3 comprising Measured Resources of 9.47 Mt at 0.16% WO3, Indicated Resources of 28.36 Mt at 0.14% WO3 and Inferred Resources of 11.49 Mt at 0.15% WO3. Ore Reserves, originally published in 2014, remain at 21.3 Mt grading 0.15% WO3, comprising 6.4 Mt at 0.16% WO3 in the Proved category and 15.0 Mt at 0.14% WO3 as Probable26.
In August 2018, Vital Metals completed the sale of the project to Tungsten Mining27. No significant work has occurred since.
Dolphin: The deposit was discovered in 1911 and was mined intermittently until the 1990s, when low tungsten prices led to mine closure. Mining was originally open pit, until the 1970s, when operations transitioned to underground at both Bold Head and Dolphin. Bold Head, discovered in the 1960s, is a satellite deposit.
Located on King Island in Bass Strait, the deposits comprise tungsten and minor molybdenum mineralisation within scheelite skarns replacing dolomitic metasedimentary units of the Grassy Group. Mineralisation is related to the spatially associated Early Carboniferous granites.
In 2019, King Island Scheelite Ltd released a feasibility study and revised Ore Reserve and Mineral Resource estimates28. Combined total Inferred and Indicated resources for the Dolphin Project (including Bold Head) are 11.36 Mt grading 0.90% WO3.
Dolphin is a proposed open-cut mine with an Indicated Resource of 9.6 Mt at 0.90% WO3 containing 86.4 kt tungsten trioxide at a cut-off grade of 0.20% WO3. The Mineral Resource includes a Probable Reserve of 3.0 Mt at 0.73% WO3.
The Bold Head deposit is a proposed underground resource with reported Indicated Resources of 1.61 Mt at 0.92% WO3, containing 14.8 kt of tungsten trioxide at a cut-off grade of 0.5% WO3, and an Inferred Resource of 0.15 Mt at 0.85% WO3, containing 1.3 kt of tungsten trioxide at a cut-off grade of 0.5% WO3.
The company reported an offtake agreement for tungsten concentrate with Austrian-based Wolfram Bergbau und Hutton AG, pending the achievement of operational and financial milestones prior to 31 March 202129. The agreement is for approximately 20% of the expected annual production at Dolphin, with full production expected to be in the order of 2000 t WO3 per annum contained in 3100 t of concentrate.
Kara: Tasmania Mines Ltd produced 47 t of by-product tungsten concentrate in 2018 (almost 0.02 kt of contained tungsten) from its Kara No 1 magnetite mine (Table 2), 35 km south of Burnie in northwest Tasmania. The mine, which has been operating since 1977, produces magnetite and scheelite from skarn mineralisation that has replaced carbonates within Cambrian and Ordovician sediments close to the Devonian Housetop Granite.
In February 2017, Tasmania Mines released updated Ore Reserve figures for the mine including, at Kara No 1, total Ore Reserves of 9.97 Mt at 49.7% iron oxide (FeO) and 366 ppm WO3. The Reserves include 624 kt Probable at 51.1% FeO and 799 ppm WO3, and 9.3 Mt Proved at 49.6% FeO and 337 ppm WO330.
Tasmania Mines holds additional resources in the vicinity of current mining operations31. The Eastern Ridge magnetic skarn, located to the northeast of Kara No 1, has a total Mineral Resource of 6.5 Mt at 48.3% FeO and 1045 ppm WO3 which includes Indicated Resources of 5.24 Mt at 1200 ppm WO3 and Inferred Resources of 1.26 Mt at 400 ppm WO3. Kara North 266, located immediately to the north of Kara No 1, has a total Mineral Resource of 2.85 Mt at 47.3% FeO and 1891 ppm WO3, which includes Indicated Resources of 2.59 Mt at 2000 ppm WO3 and Inferred Resources of 0.260 Mt at 800 ppm WO3. The Kara North Magnetic Anomaly has an Inferred Resource of 11.96 Mt at 42.7% FeO and 160 ppm WO332.
Mount Mulgine: Located 350 km north-northeast of Perth, the mineralisation represents an Archean porphyry tungsten-molybdenum system (Mulgine Hill) and associated skarn (Mulgine Trench), related to the Neoarchean Mount Mulgine Granite.
In April 2019, Tungsten Mining commenced a prefeasibility study for mining and processing tungsten and molybdenum at the Mount Mulgine Project.33 The company commenced resource definition drilling in July 2019 and, in December 2019, reported an updated Inferred Resource estimate for the Mulgine Trench deposit of 207 Mt at 0.11% WO3, 272 ppm Mo, 0.13 ppm gold (Au) and 5 ppm silver (Ag) at a 0.05% WO3 cut-off grade.34 This was a maiden resource for gold and silver and a significant increase to the Inferred tungsten-molybdenum resource, making Mulgine Trench the largest Inferred tungsten resource in Australia and the second largest total resource in Australia (behind O'Callaghans, see below).
Tungsten Mining continued infill drilling at Mulgine Trench and in May 2020 reported an Indicated Resource35. The updated estimates are an Indicated Resource of 175 Mt at 0.11% WO3, 290 ppm Mo, 0.14 ppm Au and 6 ppm Ag; and an Inferred Resource of 72 Mt at 0.11% WO3, 250 ppm Mo, 0.10 ppm Au and 5 ppm Ag.
Mineral Resources for the Mulgine Hill deposit remained unchanged from March 2019 with total Indicated and Inferred Resources of 7.3 Mt, containing 16.1 kt tungsten trioxide and 942 t of molybdenum, reported above a 0.10% WO3 cut-off grade. The Indicated Resource is 5.6 Mt, at 0.23% WO3 and 133 ppm Mo. The Inferred Resource is 1.7 Mt at 0.19% WO3 and 113 ppm Mo36.
O'Callaghans: The polymetallic deposit is located approximately 400 km east-southeast of Port Hedland, and 10 km south of the processing plant at the operating Telfer copper-gold mine. Within the Telfer region of the Paterson Province, Newcrest Mining Ltd owns the Telfer mine, a group of gold deposits within a 30 km zone from Telfer and the O'Callaghans deposit. At O'Callaghans, skarn-hosted mineralization containing tungsten, copper, zinc and lead is found as a sub-horizontal layer at the contact between the limestone of the Proterozoic Puntapunta Formation and the Neoproterozoic O'Callaghans Granite. Although molybdenum and silver are present, they are not presently considered economically significant.
Newcrest states the O'Callaghans resource contains 0.26 Mt tungsten trioxide, 0.22 Mt copper, 0.38 Mt zinc, and 0.19 Mt lead. These comprise an Inferred Resource of 9 Mt at 0.25% WO3, 0.24% Cu, 0.19% Zn and 0.11% Pb and an Indicated Resource of 69 Mt at 0.34% WO3 0.29% Cu, 0.53% Zn and 0.26% Pb. Included in the Mineral Resource is a Probable Ore Reserve of 44 Mt at 0.36% WO3, 0.29% Cu, 0.65% Zn and 0.32% Pb, for a contained 0.16 Mt of tungsten trioxide, 0.13 Mt of copper, 0.29 Mt of zinc and 0.14 Mt of lead.37 These figures are unchanged since 201638.
O'Callaghans is Australia's largest reported tungsten resource, with almost half of Australia's Economic Demonstrated Resources contained within the deposit.
Citation
Bibliographical reference: Hughes, A., 2020. Australian Resource Reviews: Tungsten 2019. Geoscience Australia, Canberra.
References
1 European Commission, 2017. Study on the review of the list of Critical Raw Materials, Critical Materials Factsheets. Publication Office of the European Union. doi:10.2873/398823
2 British Geological Survey, Risk List 2015. An update to the supply risk index for elements or element groups that are of economic value, 11pp.
3 United States Government Federal Register, 2018. Final List of Critical Minerals 2018. A Notice by the Interior Department on 05/18/2018. Document 83 FR 23295.
4 United States Geological Survey, 2019. Mineral Commodities Summaries, Tungsten.
5 ibid.
6 1 MTU = 10 kg
7 Donnellan N, 2013. Chapter 9: Warramunga Province: in Ahmad M and Munson TJ (compilers). Geology and mineral resources of the Northern Territory. Northern Territory Geological Survey, Special Publication 5.
8 ibid.
9 Arunta Resources Ltd. ASX Announcement 23 September 2014.
10 GWR Group Ltd. ASX Announcement 22 May 2019.
11 Tungsten Mining NL. ASX Announcement 15 April 2020. Quarterly Report March 2020.
12 Thor Mining Plc. Annual Report 2019.
13 Thor Mining Plc. ASX Announcement 11 October 2019.
14 Thor Mining Plc. ASX Announcement 29 January 2020.
15 Thor Mining Plc. ASX Announcement 28 November 2018.
16 Icon Resources Ltd. Annual Report 2011.
17 Carbine Tungsten Ltd. ASX Announcement 28 August 2012.
18 Carbine Tungsten Ltd. ASX Announcement 30 August 2012.
19 ibid.
20 ibid.
21 Carbine Tungsten Ltd. ASX Announcement 5 September 2012.
22 Specialty Metals International Ltd. ASX Announcement 3 October 2019.
23 Specialty Metals International Ltd. ASX Announcement 30 December 2019.
24 Vital Metals Ltd. ASX Announcement 17 September 2014.
25 Vital Metals Ltd. ASX Announcement 4 July 2018.
26 ibid.
27 Vital Metals Ltd. ASX Announcement 10 August 2018.
28 King Island Scheelite Ltd. ASX Announcement 26 September 2019.
29 King Island Scheelite Ltd. ASX Announcement 8 April 2019.
30 Tasmania Mines Ltd. ASX Announcement 16 February 2017.
31 ibid.
32 ibid (Tasmania Mines Ltd. ASX Announcement 16 February 2017).
33 Tungsten Mining NL. ASX Announcement 16 April 2019.
34 Tungsten Mining NL. Quarterly Report December 2019.
35 Tungsten Mining NL. ASX Announcement 4 May 2020.
36 Tungsten Mining NL. ASX Announcement 12 April 2019.
37 Newcrest Mining Ltd. ASX Announcement 13 February 2020.
38 Newcrest Mining Ltd. ASX Announcement 13 February 2017.