Zinc-Lead-Silver
Page last updated:19 December 2023
Please note that this page is currently under review.
The last full review of zinc, lead and silver was part of Australia’s Identified Mineral Resources 2013. The purpose of this summary is to provide updated information on these metals including new developments related to production and exploration and new uses of zinc, lead and silver.
Resource figures are current as at 31 December 2018.
Zinc (Zn)
Zinc is the fourth most common metal in use after iron, aluminium and copper. Approximately 50% of zinc production is used to provide a protective coating on, or to galvanise, steel. Galvanised steel is used extensively in the construction and transport industries as sheet steel, steel beams, vehicle panels, chain-link fencing, guard rails and light posts. The widespread use of zinc as a protective coating is due to its resistance to weathering owing to an electrochemical reaction known as galvanic action. Zinc is more reactive than iron or steel and consequently attracts almost all local oxidation. A protective surface layer of oxide and carbonate forms as the zinc corrodes.
Zinc is also used in die-casts (17% of annual consumption), brass (~20% Zn; 17% of annual consumption), rolled zinc (6% of consumption), chemicals (6% of consumption; mostly as zinc oxide) and miscellaneous uses (4% of annual consumption). Other than the silvery sheen on steel produced by galvanization, the most obvious use of zinc is as zinc oxide, which gives sun cream its white coloration.
Zinc metal is produced in Australia at Sun Metals Corporation Pty Ltd’s refinery in Townsville, Queensland and at Nyrstar Australia Pty Ltd’s refinery in Hobart, Tasmania. Processing of zinc concentrates can also produce cadmium, gallium, germanium and indium as by-products, although the latter three elements are not currently recovered in Australia.
A potential major use of zinc in the future is production of zinc-based batteries, which have some advantages (and disadvantages) over lithium-based and other battery types. Advantages, which include low flammability and high energy densities, have led to the development of a number of different types of rechargeable batteries, including zinc-air, zinc-nickel, zinc-silver, zinc-water and zinc-gel batteries. However these are partly offset by the disadvantages, which include difficulties in recharging (zinc-air), high costs (zinc-silver) and lower power output (zinc-gel), among others. Although none of these have been developed to the point of commercial production, zinc potentially could become an important metal for battery technology.
Lead (Pb)
The widespread occurrence of lead, its relatively simple extraction and a combination of desirable properties have made it useful to humans since at least 5000 BC. In deposits mined today, lead, mainly in the form of the mineral galena (PbS), is usually associated with zinc, silver and sometimes copper and is extracted as a co-product alongside these metals.
Historically, lead has been used in pipes, pewter, paint and as an anti-knocking additive for petrol, but these and a few other minor uses have been discontinued owing to the toxicity of lead. The largest present-day use is in batteries for vehicles, which accounts for 80% of current lead usage. The remaining 20% includes underwater cable sheathing, solder, casting alloys, chemical compounds, ammunition, weighting, glassware and radiation protection.
Uses for lead could increase in the future in large storage batteries used for load-levelling of electrical power and in electric vehicles. The growing popularity of electric bikes, particularly in China, has led to the e-bike now consuming more than 8% of world lead production. More than half of the lead currently used is from recycling rather than from mining.
In Australia, lead recycling plants are operated by:
- HydroMet Corporation Pty Ltd (near Melbourne, Victoria and Wollongong, New South Wales);
- Enirgi Power Storage Pty Ltd (Sydney and Wagga Wagga, New South Wales); and
- Nyrstar Australia Pty Ltd at Port Pirie, South Australia. This smelter is one of the world’s largest primary lead smelting facilities and a leading global silver producer.
Silver (Ag)
The relative scarcity, attractive appearance and malleability of silver make it suitable for use in jewellery, ornaments and household silverware. In nature, silver can occur in its native form, and it was one of the first metals mined and used by humans. Its extensive use in coins throughout history has declined over the past 60 years. In Australia, the 1966 50-cent piece was the last coin in circulation to contain silver (80% silver, 20% copper (Cu)).
Silver is mined and produced mainly as a co-product of lead, zinc, copper and, to a lesser extent, gold (Au). Currently, jewellery, photographic paper and film, followed by electronics and tableware, are the most important uses of silver. Other applications include coatings for mirrors, for biocide and bacteriostatic activity in plastic and textiles formulations and as an anti-bacterial agent in areas such as water treatment, including, for example, as an ioniser with copper in domestic swimming pools.
Price Variations
Figure 1 shows price variations in Australian and United States dollars since 2000 for (a) lead, (b) zinc and (c) silver. Although the price trends for zinc and lead are similar, the price trend for silver is quite different.
Both zinc and lead show a broadly increasing price trend since late 2003 with major price peaks at ~AU$5700/t in 2006 for zinc and ~AU$4000/t in 2007 for lead. Subsequent to these peaks, by early 2009 the prices of both metals dropped to ~AU$1600/t and ~AU$1400/t, respectively. Since 2009 the prices of both metals have trended upwards although with a number of troughs along the way, the most recent of which was in August 2018. For August 2019, average zinc and lead prices were ~AU$3810/t and ~AU$3020/t. These prices represent three and fourfold increases, respectively, since the beginning of the upward price trend in late 2003.
In contrast, the price of silver did not have a major peak in 2006-2007. Rather, there was an increasing trend from late 2003 until late 2011 at which time the silver price peaked at ~AU$38/oz. Since late 2012, the silver price decreased and has fluctuated mostly between AU$20/oz and AU$25/oz.
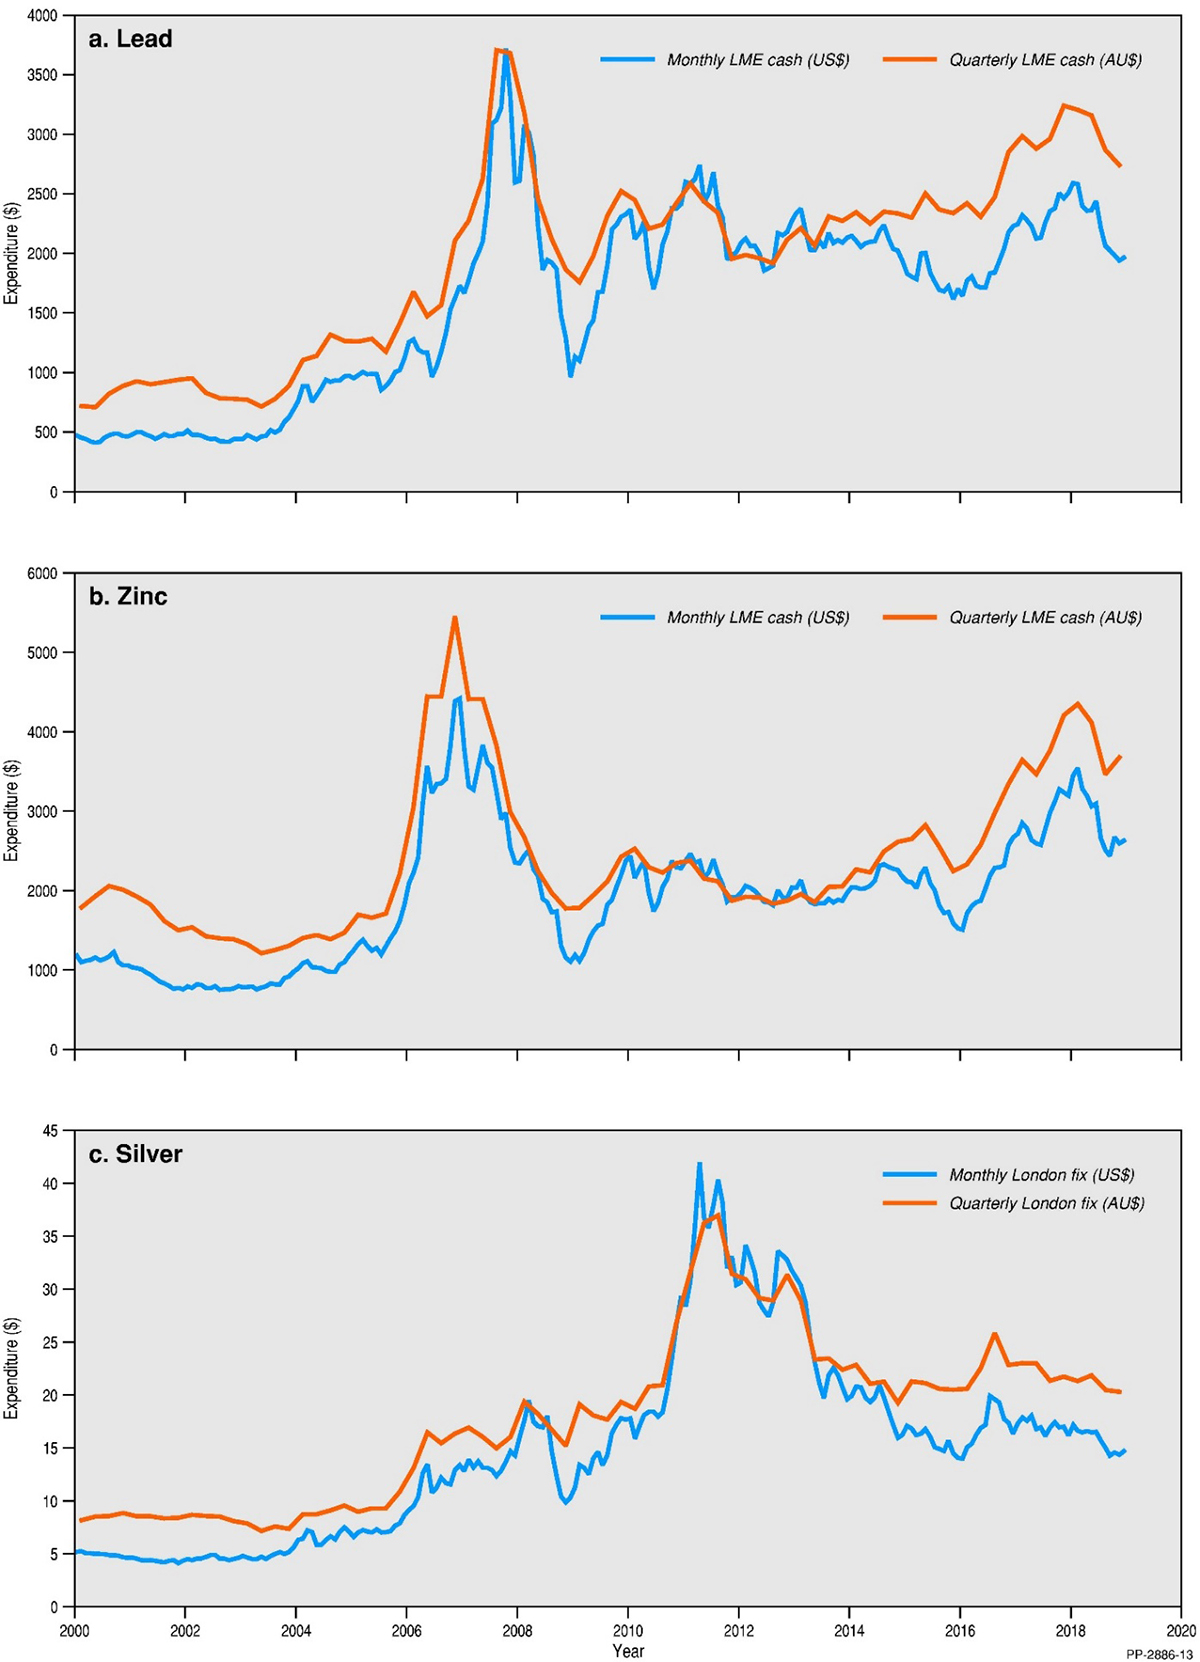
Figure 1. Variations in the quarterly average prices of (a) zinc (per tonne), (b) lead (per tonne), and (c) silver (per Troy ounce) in United States and Australian dollars, based on London Metals Exchange price.
JORC Ore Reserves
As at December 2018, Proved and Probable Ore Reserves of zinc, lead and silver reported in compliance with the JORC Code amounted to 23.94 Mt, 12.37 Mt and 25.40 kt, respectively. This represents a decrease of 4.8% for zinc, and increases of 8.1% and 4.0% for lead and silver, respectively, on 2017 values (Table 1). In addition Ore Reserves accounted for about 36%, 36% and 29% of Australia’s Economic Demonstrated Resources (EDR) for zinc, lead and silver, respectively. Zinc, lead and silver occur in all of Australia's states and the Northern Territory (Figure 2).
Zinc Ore Reserves were relatively constant from 2002 to 2011, but increased significantly in 2012. They declined in 2013 and 2014, and have since remained relatively constant (Figure 3).
Lead Ore Reserves were reasonably constant from 2002 to 2008 but increased from 2009 to 2012. They declined significantly between 2013 and 2014 and have since remained relatively constant (Figure 4).
Silver Ore Reserves peaked in 2012. They decreased in 2014 and 2015 but have been relatively constant since (Figure 5).
Table 1. Australia's Ore Reserves of zinc, lead and silver, production and potential reserve life, 2002-2018.
| Year | Zinc | Lead | Silver | ||||||
|---|---|---|---|---|---|---|---|---|---|
| P&P Ore Reserve1 (Mt Zn) | Production2 (Mt Zn) | Reserve Life3 (years) | P&P Ore Reserve1 (Mt Pb) | Production2 (Mt Pb) | Reserve Life3 (years) | P&P Ore Reserve1 (kt Ag) | Production2 (kt Ag) | Reserve Life3 (years) | |
| 2018 | 23.94 | 1.112 | 22 | 12.37 | 0.469 | 26 | 25.40 | 1.220 | 21 |
| 2017 | 25.30 | 0.841 | 30 | 11.60 | 0.459 | 25 | 24.82 | 1.120 | 22 |
| 2016 | 24.26 | 0.884 | 27 | 11.52 | 0.45 | 26 | 25.74 | 1.418 | 18 |
| 2015 | 23.68 | 1.611 | 15 | 11.30 | 0.65 | 17 | 26.07 | 1.373 | 19 |
| 2014 | 25.31 | 1.56 | 16 | 12.82 | 0.73 | 18 | 28.05 | 1.847 | 15 |
| 2013 | 28.9 | 1.5 | 19 | 14.6 | 0.7 | 21 | 30.1 | 1.8 | 16 |
| 2012 | 32.1 | 1.54 | 21 | 15.4 | 0.62 | 25 | 30.4 | 1.76 | 17 |
| 2011 | 22.8 | 1.51 | 15 | 12.4 | 0.62 | 20 | 27.8 | 1.73 | 16 |
| 2010 | 21.3 | 1.48 | 14 | 11.9 | 0.71 | 17 | 27.7 | 1.88 | 15 |
| 2009 | 19.6 | 1.29 | 15 | 11 | 0.57 | 19 | 26 | 1.63 | 16 |
| 2008 | 20.2 | 1 | 20 | 10.7 | 0.65 | 16 | 26.2 | 1.93 | 14 |
| 2007 | 22.2 | 1.52 | 15 | 10.6 | 0.641 | 17 | 26.2 | 1.879 | 14 |
| 2006 | 21.7 | 1.362 | 16 | 10.6 | 0.668 | 16 | 26.4 | 1.727 | 15 |
| 2005 | 22 | 1.367 | 16 | 10.5 | 0.767 | 14 | 26.2 | 2.407 | 11 |
| 2004 | 21.3 | 1.334 | 16 | 9.9 | 0.677 | 15 | 26 | 2.237 | 12 |
| 2003 | 22.6 | 1.479 | 15 | 10.5 | 0.688 | 15 | 26.8 | 1.868 | 14 |
| 2002 | 23.8 | 1.47 | 16 | 10.4 | 0.69 | 15 | 28.9 | 2 | 14 |
P&P = Proved and Probable; Mt Zn = million tonnes of zinc; Mt Pb = million tonnes of lead; kt Ag = thousand tonnes of silver.
- The majority of Australian Ore Reserves and Mineral Resources are reported in compliance with the JORC Code, however there are a number of companies that report to foreign stock exchanges using other reporting codes, which are largely equivalent. In addition, Geoscience Australia may hold confidential information for some commodities.
- Source: Office of the Chief Economist, Department of Industry, Innovation and Science, Resources and Energy Quarterly (September 2018). Production data often have a higher level of certainty than resource estimates and so may be presented with more significant figures.
- Reserve life is calculated by dividing the Ore Reserve by production. The resulting ratio is a snapshot in time that can only be used for general impressions because it is an average and it assumes (1) that production rates in the future will remain the same as those used in the calculation, (2) deposits deemed economic/uneconomic remain so in the future and (3) that depleted reserves are never replaced.
Identified Resources
Economic Demonstrated Resources (EDR) of zinc (Table 2), lead (Table 3) and silver (Table 4) were 66.96 Mt, 35.78 Mt and 88.36 kt, respectively, at the end of December 2018. In all cases, the values were lower than the previous year, but this was more than offset by an increase in Inferred Resources for each metal (up 14%, 7% and 7%, respectively).
Figure 2 shows that Queensland has by far the largest EDR for zinc, lead and silver (~60% of each), with significant EDR for zinc and lead in the Northern Territory (~25%). For silver, the Northern Territory, New South Wales and South Australia also had significant EDR (10-15%). All other states had small contributions to the national EDR for zinc, lead and silver.
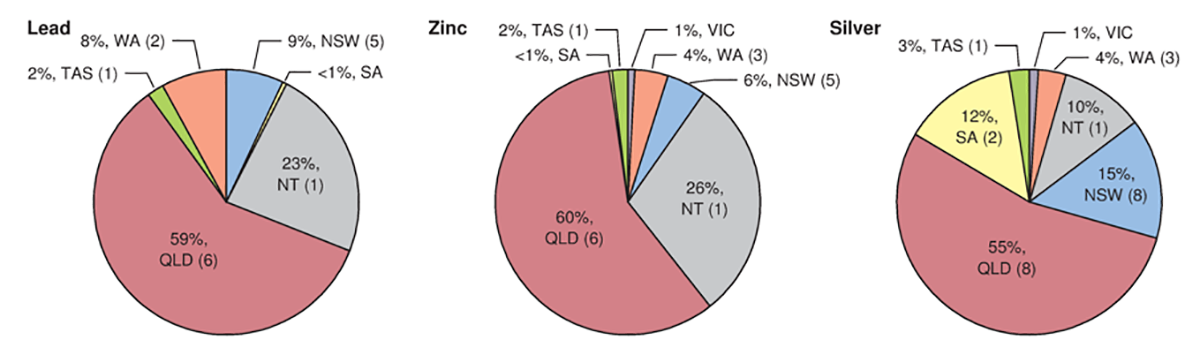
Figure 2. Distribution of lead, zinc and silver EDR by Australian jurisdiction as at December 2018. Where applicable, the number of mines in each jurisdiction is in brackets.
Accessible EDR
Some mineral resources are inaccessible for mining because of environmental restrictions, government policies or because they occur within military lands or national parks. All of Australia’s EDR of zinc, lead and silver are considered to be accessible.
Table 2. Australia's identified zinc resources (Mt Zn) and world figures for selected years from 1975-2018.
| Year | Demonstrated Resources | Inferred Resourcesb | Accessible EDRc | Australian Mine Productiond | World Economic Resourcese | World Mine Production | ||
|---|---|---|---|---|---|---|---|---|
| Economic (EDR)a | Paramarginal | Submarginal | ||||||
| 2018 | 66.96 | 0.45 | 0.75 | 42.17 | 66.96 | 1.112 | 230 | 13.0 |
| 2017 | 67.52 | 0.45 | 0.75 | 36.68 | 67.52 | 0.841 | 237 | 12.5 |
| 2016 | 63.5 | 0.59 | 0.75 | 38.44 | 63.5 | 0.884 | 220 | 11.9 |
| 2015 | 62.58 | 0.62 | 0.75 | 25.66 | 62.58 | 1.611 | 205 | 13.4 |
| 2014 | 62.57 | 0.97 | 0.75 | 28.44 | 62.57 | 1.56 | 230 | 13.3 |
| 2013 | 62.3 | 1 | 0.8 | 27.1 | 62.3 | 1.5 | 248 | 13.6 |
| 2012 | 64.1 | 1.1 | 0.8 | 25.8 | 64.1 | 1.54 | 247 | 13.1 |
| 2011 | 68.3 | 1 | 0.8 | 27 | 68.3 | 1.51 | 262 | 12.5 |
| 2010 | 65.2 | 3.4 | 1 | 24.4 | 65.2 | 1.48 | 260 | 12 |
| 2009 | 58.4 | 4.2 | 1 | 21.8 | 58.4 | 1.29 | 235 | 11.1 |
| 2008 | 53.1 | 7.2 | 1.4 | 21.9 | 53.1 | 1 | 193 | 11.3 |
| 2007 | 42.5 | 18.3 | 2.3 | 23.3 | 42.5 | 1.52 | 179 | 10.6 |
| 2006 | 40.6 | 17.1 | 2.5 | 27.2 | 40.6 | 1.362 | 228 | 10 |
| 2005 | 41.8 | 8.2 | 14.1 | 25 | 41.8 | 1.367 | 228 | 10.1 |
| 2004 | 41 | 8.5 | 14.9 | 25.2 | 41 | 1.334 | 222 | 9.1 |
| 2003 | 34.8 | 6.3 | 16 | 31.8 | 34.9 | 1.479 | 222 | 8.3 |
| 2002 | 33.2 | 8.7 | 16.2 | 21.1 | 33.2 | 1.47 | 200 | 8.9 |
| 2001 | 35.1 | 8.4 | 16 | 21.30 | 1.52 | 190 | 8.9 | |
| 2000 | 33 | 8 | 17 | 22.00 | 1.42 | 190 | 8 | |
| 1995 | 38.8 | 13.6 | 11.3 | 22.3 | 0.9 | 140 | 7.07 | |
| 1990 | 17.9 | 19.6 | 24.1 | 18.7 | 0.94 | 144 | 7.3 | |
| 1985 | 21.2 | 6.92 | 24.85 | 9.98 | 0.74 | 290 | 6.92 | |
| 1980 | 22.84 | 19.97 | 6.43 | 0.5 | 240 | 4.53 | ||
| 1975 | 19.3 | 21.6 | 0.5 | 118.8 | 6.02 | |||
Mt Zn = million tonnes of zinc.
- Economic Demonstrated Resources (EDR) predominantly comprise Ore Reserves and most Measured and Indicated Mineral Resources that have been reported in compliance with the Joint Ore Reserves Committee (JORC) Code to the Australian Securities Exchange (ASX). In addition, some reserves and resources may have been reported to foreign stock exchanges using other reporting codes, which are largely equivalent to the JORC Code. Geoscience Australia may also hold some confidential data.
- Total Inferred Resources in economic, subeconomic and undifferentiated categories.
- Accessible Economic Demonstrated Resources (AEDR) is the portion of total EDR that is accessible for mining. AEDR does not include resources that are inaccessible for mining because of environmental restrictions, government policies or military lands.
- Source: Office of the Chief Economist, Department of Industry, Innovation and Science, Resources and Energy Quarterly (September 2018). Production data often have a higher level of certainty than resource estimates and so may be presented with more significant figures.
- Source: United States Geological Survey (Mineral Commodity Summaries).
Table 3. Australia's identified lead resources (Mt Pb) and world figures for selected years from 1975-2018.
| Year | Demonstrated Resources | Inferred Resourcesb | Accessible EDRc | Australian Mine Productiond | World Economic Resourcese | World Mine Production | ||
|---|---|---|---|---|---|---|---|---|
| Economic (EDR)a | Paramarginal | Submarginal | ||||||
| 2018 | 35.78 | 2.70 | 0.14 | 25.20 | 35.78 | 0.469 | 95 | 4.45 |
| 2017 | 36.42 | 2.70 | 0.14 | 23.28 | 36.42 | 0.459 | 89 | 4.58 |
| 2016 | 35.09 | 3 | 0.14 | 24.09 | 35.09 | 0.45 | 88 | 4.82 |
| 2015 | 35.29 | 3 | 0.14 | 21.04 | 35.29 | 0.65 | 89 | 4.7 |
| 2014 | 34.72 | 3.35 | 0.14 | 20.21 | 34.72 | 0.73 | 87 | 5.46 |
| 2013 | 35 | 3.5 | 0.2 | 20 | 35 | 0.7 | 88 | 5.4 |
| 2012 | 34.4 | 3.4 | 0.2 | 20.2 | 34.4 | 0.62 | 89 | 5.2 |
| 2011 | 35.9 | 3.4 | 0.2 | 22.2 | 35.9 | 0.62 | 92 | 4.6 |
| 2010 | 34.7 | 4.3 | 0.2 | 21.2 | 34.7 | 0.71 | 88 | 4.2 |
| 2009 | 30.8 | 4.8 | 0.3 | 19.1 | 30.8 | 0.57 | 85 | 4 |
| 2008 | 26.8 | 6.6 | 0.5 | 18.6 | 26.8 | 0.65 | 82 | 3.9 |
| 2007 | 23.3 | 8.5 | 1.6 | 19.3 | 23.3 | 0.641 | 78 | 3.6 |
| 2006 | 23.5 | 7.9 | 2.6 | 19.6 | 23.5 | 0.668 | 75 | 3.36 |
| 2005 | 23.8 | 3.1 | 8.8 | 21.9 | 23.8 | 0.767 | 75 | 3.28 |
| 2004 | 22.9 | 2.9 | 9.3 | 21.6 | 22.9 | 0.677 | 70 | 3.15 |
| 2003 | 19.3 | 1.9 | 9.2 | 24.9 | 19.3 | 0.688 | 71 | 2.8 |
| 2002 | 17.2 | 3.1 | 9.3 | 20.9 | 17.2 | 0.69 | 70 | 2.9 |
| 2001 | 17.3 | 3.4 | 9.1 | 20.8 | 0.7 | 64 | 2.97 | |
| 2000 | 14.6 | 3.4 | 9.6 | 22.3 | 0.7 | 64 | 2.98 | |
| 1995 | 18.2 | 1.8 | 8.9 | 18.0 | 0.46 | 68 | 2.8 | |
| 1990 | 10.7 | 8.3 | 14.2 | 6.7 | 0.6 | 70 | 3.4 | |
| 1985 | 14.45 | 1.33 | 14.18 | 4.3 | 0.49 | 135 | 3.56 | |
| 1980 | 15.83 | 10.64 | 2.68 | 0.4 | 157 | 2.54 | ||
| 1975 | 13.9 | 8.5 | 0.3 | 0.41 | 145.2 | 3.55 | ||
Mt Pb = million tonnes of lead.
- Economic Demonstrated Resources (EDR) predominantly comprise Ore Reserves and most Measured and Indicated Mineral Resources that have been reported in compliance with the Joint Ore Reserves Committee (JORC) Code to the Australian Securities Exchange (ASX). In addition, some reserves and resources may have been reported to foreign stock exchanges using other reporting codes, which are largely equivalent to the JORC Code. Geoscience Australia may also hold some confidential data.
- Total Inferred Resources in economic, subeconomic and undifferentiated categories.
- Accessible Economic Demonstrated Resources (AEDR) is the portion of total EDR that is accessible for mining. AEDR does not include resources that are inaccessible for mining because of environmental restrictions, government policies or military lands.
- Source: Office of the Chief Economist, Department of Industry, Innovation and Science, Resources and Energy Quarterly (September 2018). Production data often have a higher level of certainty than resource estimates and so may be presented with more significant figures.
- Source: United States Geological Survey (Mineral Commodity Summaries).
Table 4. Australia's identified silver resources (kt Ag) and world figures for selected years from 1975-2018.
| Year | Demonstrated Resources | Inferred Resourcesb | Accessible EDR | Australian Mine Productiond | World Economic Resourcese | World Mine Production | ||
|---|---|---|---|---|---|---|---|---|
| Economic (EDR)a | Paramarginal | Submarginal | ||||||
| 2018 | 88.36 | 2.26 | 0.49 | 44.14 | 88.36 | 1.220 | 560 | 27.0 |
| 2017 | 90.31 | 2.31 | 0.49 | 40.53 | 90.31 | 1.120 | 535 | 26.8 |
| 2016 | 89.29 | 1.79 | 0.49 | 52 | 89.29 | 1.418 | 570 | 27 |
| 2015 | 88.68 | 1.79 | 0.49 | 41.14 | 88.68 | 1.373 | 575 | 27 |
| 2014 | 85.21 | 2.98 | 0.49 | 38.87 | 85.21 | 1.847 | 530 | 26.1 |
| 2013 | 85.2 | 3.3 | 0.5 | 36 | 85.2 | 1.8 | 517 | 26.1 |
| 2012 | 85.2 | 3.5 | 0.5 | 36 | 85.2 | 1.76 | 556 | 23.8 |
| 2011 | 87.9 | 2.9 | 0.6 | 39.9 | 87.9 | 1.73 | 549 | 23.6 |
| 2010 | 77.2 | 10.7 | 3.1 | 34.6 | 77.2 | 1.88 | 520 | 22.1 |
| 2009 | 70.3 | 11.9 | 2.9 | 33.7 | 70.3 | 1.63 | 438 | 21.2 |
| 2008 | 61.4 | 14.7 | 3.5 | 30 | 61.4 | 1.93 | 302 | 21 |
| 2007 | 50.1 | 20.4 | 8 | 31 | 50.1 | 1.879 | 289 | 20.4 |
| 2006 | 45.6 | 19.8 | 7.7 | 34.1 | 45.6 | 1.727 | 285 | 19.5 |
| 2005 | 44 | 15.3 | 14.8 | 32.3 | 44 | 2.407 | 283 | 20.5 |
| 2004 | 41.4 | 17.6 | 16.9 | 33.5 | 41.4 | 2.237 | 280 | 19.5 |
| 2003 | 42.9 | 9.8 | 11.8 | 42.7 | 42.9 | 1.868 | 284 | 18.8 |
| 2002 | 40.2 | 10.2 | 12 | 25.6 | 40.2 | 2 | 310 | 18.8 |
| 2001 | 41.4 | 9.7 | 10.9 | 25.3 | 2 | 280 | 18.3 | |
| 2000 | 32.1 | 11.1 | 11.5 | 30.8 | 2.1 | 280 | 17.9 | |
| 1995 | 41.5 | 9.8 | 11.1 | 26.1 | 0.9 | 280 | 14.0 | |
| 1990 | 20.7 | 16.6 | 13.1 | 12.6 | 1.17 | 280 | 14.6 | |
| 1985 | 30.55 | 3.31 | 17.07 | 14.6 | 1.09 | 335.9 | 13.4 | |
| 1980 | 29.34 | 13.97 | 2.91 | 0.767 | 252.7 | 10.58 | ||
| 1975 | 24.3 | 12 | 0.73 | 186.6 | 9.15 | |||
kt Ag = thousand tonnes of silver.
- Economic Demonstrated Resources (EDR) predominantly comprise Ore Reserves and most Measured and Indicated Mineral Resources that have been reported in compliance with the Joint Ore Reserves Committee (JORC) Code to the Australian Securities Exchange (ASX). In addition, some reserves and resources may have been reported to foreign stock exchanges using other reporting codes, which are largely equivalent to the JORC Code. Geoscience Australia may also hold some confidential data.
- Total Inferred Resources in economic, subeconomic and undifferentiated categories.
- Accessible Economic Demonstrated Resources (AEDR) is the portion of total EDR that is accessible for mining. AEDR does not include resources that are inaccessible for mining because of environmental restrictions, government policies or military lands.
- Source: Office of the Chief Economist, Department of Industry, Innovation and Science, Resources and Energy Quarterly (September 2018). Production data often have a higher level of certainty than resource estimates and so may be presented with more significant figures.
- Source: United States Geological Survey (Mineral Commodity Summaries)
Production and Reserve Life
Australian production of zinc, lead and silver was 1.112 Mt, 0.469 Mt and 1.220 kt, respectively, and increased for all three metals in 2018 (Table 1). Production levels of both zinc and lead are recovering from lows in 2016-2017 (Figure 3 and Figure 4). The production of silver increased in 2018, reversing a decreasing trend in production since 2014 (Figure 5).
Reserve life, the ratio of Ore Reserves to production, was 22, 26 and 21 years for zinc, lead and silver, respectively (Table 1).
The 2018 reserve life for zinc is significantly lower than that of 2017 and reverses a trend of increasing reserve life since 2015 (Figure 3). This is due mostly to increased production, but also to the small fall in reserves. For lead the reserve life is similar to 2016 and 2017 (Figure 4): changes in production and reserves were small and offsetting. For silver, 2018 reserve life is similar to 2017, and follows a broad trend of increasing reserve life since 2005 (Figure 5). The overall increase in reserve life for all three metals since 2015 is largely due to the decision to decrease production (and increase price) by Glencore at that time.
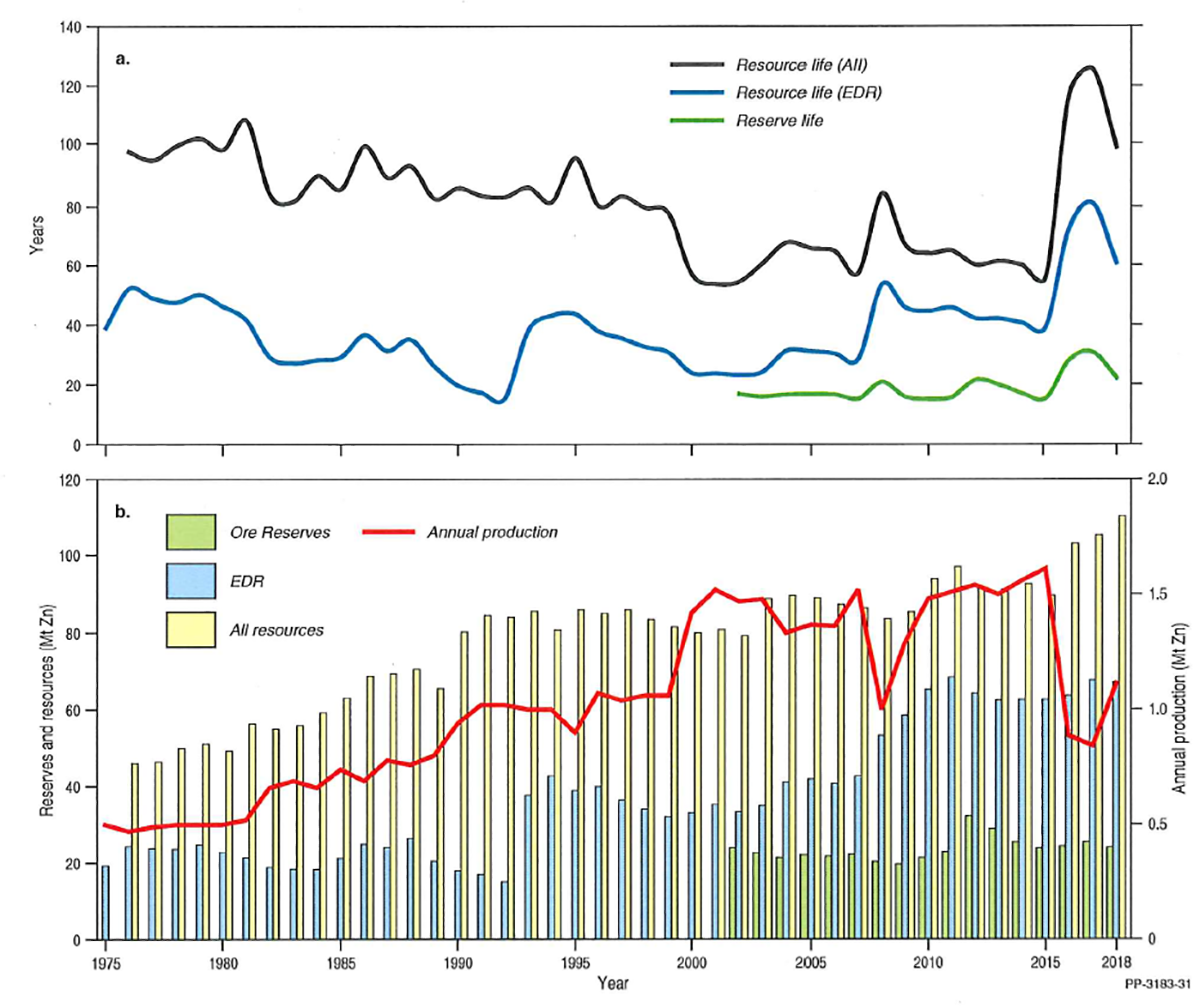
Figure 3. Trends in (a) zinc reserve and resource life. These ratios are derived from (b) Ore Reserves, Economic Demonstrated Resources (EDR), all resources (EDR + Subeconomic Demonstrated Resources + Inferred Resources) and annual production, 1975-2018.
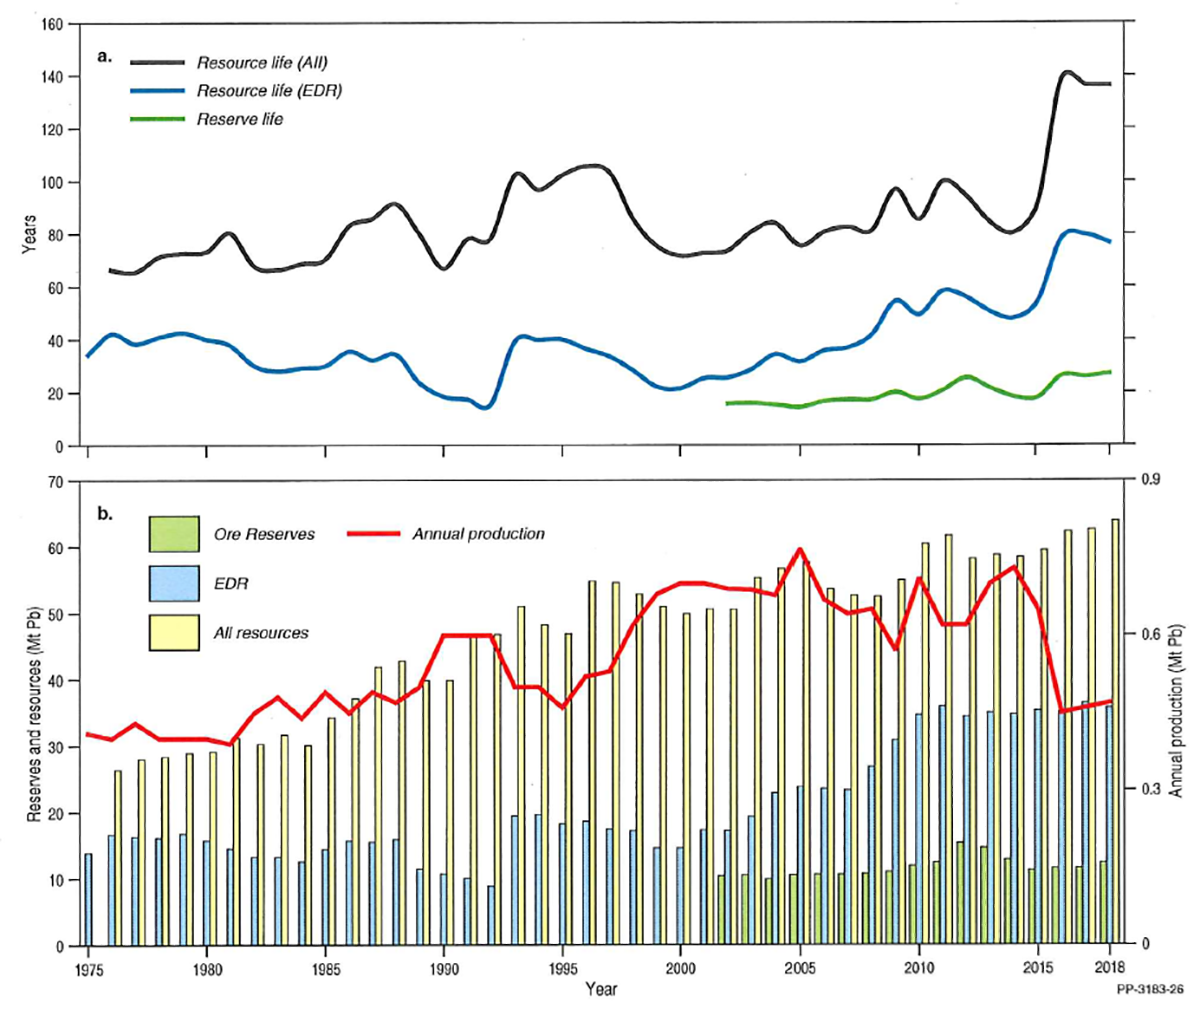
Figure 4. Trends in (a) lead reserve and resource life. These ratios are derived from (b) Ore Reserves, Economic Demonstrated Resources (EDR), all resources (EDR + Subeconomic Demonstrated Resources + Inferred Resources) and annual production, 1975-2018.
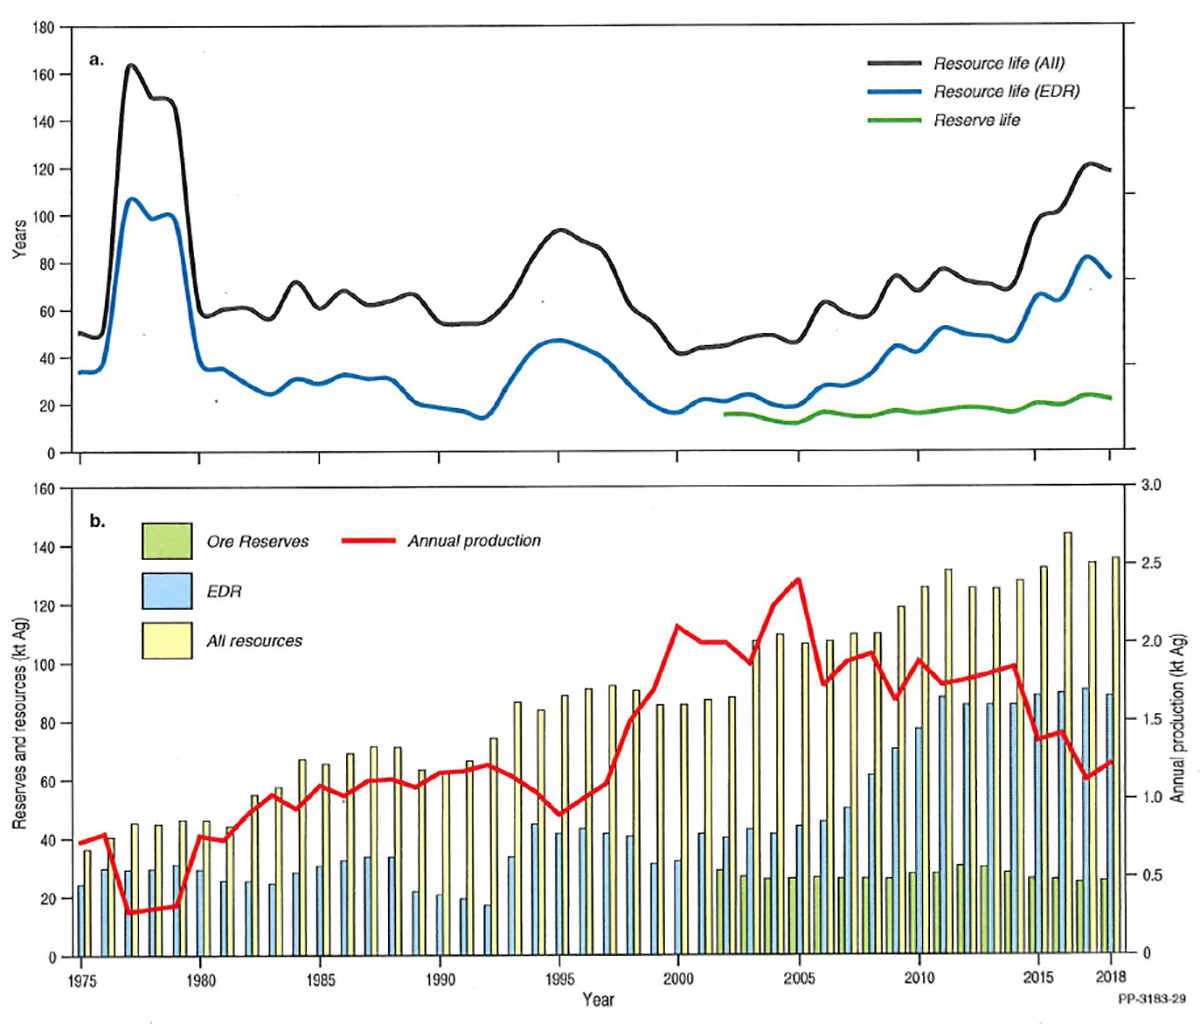
Figure 5. Trends in (a) silver reserve and resource life. These ratios are derived from (b) Ore Reserves, Economic Demonstrated Resources (EDR), all resources (EDR + Subeconomic Demonstrated Resources + Inferred Resources) and annual production, 1975-2018.
Table 5 summarises reserve life and resource life at operating mines. Reserve life for operating mines is significantly lower as undeveloped Ore Reserves are not included. However, as Ore Reserves are determined to provide confidence for short to medium term development, they generally understate the likely production life of a particular mine.
Table 5 also estimates the resource life for operating mines using Measured plus Indicated Resources (inclusive of Ore Reserves) and all resources (i.e. also including Inferred Resources). Estimates of resource lives are significantly longer than those of reserve lives and are probably a better indication of Australia’s overall remaining metal resources.
This is best illustrated by looking at cumulative production against past Ore Reserve estimates. Production of zinc since 2002 (22.9 Mt) accounts for 96% of the Ore Reserves delineated that year (23.8 Mt). Similarly, the cumulative production of lead since 2002 (10.8 Mt) is equal to 103% of the 2002 Ore Reserve (10.4 Mt) and the cumulative production of silver since 2002 (29.8 kt) is also 103% of the Ore Reserve estimated that year (28.9 kt). Conversion of resources to reserves and near-mine discovery of additional resources will likely continue to extend reserve lives into the future, as will short term shut-downs or production decreases at existing mines or the development of new mines.It is important to stress that the reserve and resource lives discussed here apply to Australia as a whole. The length of production at individual mines is dependent upon the amount of remaining resources and the discovery of additional near-mine resources. Moreover, mine life can be extended or renewed through the development of new technologies, including mine waste retreatment, as has been demonstrated by the reopening of the Century and Woodlawn mines to retreat tailings recently (see Industry Developments below).
Overall reserve and resource lives for Australia may also increase as new mines are developed and become producers, either replacing existing production as old mines close or introducing new production. This is illustrated by Table 6, which compares reserve and resource lives for only operating mines with those for all reserve and resources, which includes undeveloped deposits. As an example, when all deposits of zinc are considered, the life of all resources, at 100 years, is far longer than the reserve life at operating mines (20 years) or even all resources at operating mines (55 years). The all resources life for all deposits is larger than the reserve life of operating mines by a factor of nearly six. Similar relationships also apply to lead and silver (Table 6).
Table 5. Australia's Ore Reserves and Mineral Resources of zinc, lead and silver at operating mines in 2018.
| Commodity (unit) | No. of Operating Mines1 | Ore Reserves2 | Measured and Indicated Resources3 | Inferred Resources4 | Mine Production5 | Reserve Life6 (years) | Resource Life 17 (years) | Resource Life 28 (years) |
|---|---|---|---|---|---|---|---|---|
| Zinc | 16 | 22.44 Mt Zn | 49.46 Mt Zn | 11.86 Mt Zn | 1.112 Mt Zn | 20 | 44 | 55 |
| Lead | 17 | 9.90 Mt Pb | 28.95 Mt Pb | 8.39 Mt Pb | 0.469 Mt Pb | 23 | 52 | 61 |
| Silver | 28 | 18.99 kt Ag | 64.71 kt Ag | 20.86 kt Ag | 1.220 kt Ag | 16 | 44 | 54 |
Mt Zn = million tonnes of zinc; Mt Pb = million tonnes of lead; kt Ag = thousand tonnes of silver.
- The number of operating mines counts individual mines that operated during 2018 and thus contributed to production. Some of these mines may belong to larger, multi-mine operations and some may have closed during or since 2018.
- The majority of Australian Ore Reserves and Mineral Resources are reported in compliance with the JORC Code, however there are a number of companies that report to foreign stock exchanges using other reporting codes, which are largely equivalent. In addition, Geoscience Australia may hold confidential information for some commodities. NB: Not all operating mines report Ore Reserves. Ore Reserves are as at 31 December 2018.
- Measured and Indicated Mineral Resources are inclusive of the Ore Reserves. NB: Not all operating mines report Mineral Resources. Mineral Resources are as at 31 December 2018.
- Inferred Mineral Resources are as at 31 December 2018. NB: Not all operating mines report Mineral Resources.
- Source: Office of the Chief Economist, Department of Industry, Innovation and Science, Resources and Energy Quarterly (September 2018). Production data often have a higher level of certainty than resource estimates and so may be presented with more significant figures.
- Reserve Life = Ore Reserves ÷ Production.
- Resource Life 1 = Measured and Indicated Resources ÷ Production.
- Resource Life 2 = Measured, Indicated and Inferred Resources ÷ Production.
Table 6. Average reserve life and resource life (years) for zinc, lead and silver as at December 2017.
| Commodity | Operating Mines1 | All Deposits | ||||
|---|---|---|---|---|---|---|
| Ore Reserves2 | Demonstrated Resources3 | All Resources4 | Ore Reserves | AEDR5 | All Resources6 | |
| Zinc | 20 | 44 | 55 | 22 | 60 | 100 |
| Lead | 23 | 52 | 61 | 26 | 75 | 135 |
| Silver | 16 | 44 | 54 | 21 | 70 | 110 |
Reserve and resource life for each mineral commodity is calculated by dividing the inventory by production. The resulting ratio is a snapshot in time that can only be used for general impressions because it is an average and it assumes (1) that production rates in the future will remain the same as those used in the calculation, (2) deposits deemed economic/uneconomic remain so in the future and (3) that depleted resources are never replaced.
- Operating mines includes all mines that operated during 2018 and thus contributed to production.
- Ore Reserves as reported in compliance with the JORC Code, plus non-JORC Code equivalents.
- Demonstrated Resources = Measured and Indicated Mineral Resources, inclusive of Ore Reserves, as reported in compliance with the JORC Code, plus non-JORC Code-equivalents.
- All Resources for Operating Mines includes Measured, Indicated and Inferred Mineral Resources, inclusive of Ore Reserves, as reported in compliance with the JORC Code, plus non-JORC Code-equivalent
- AEDR = Accessible Economic Demonstrated Resources. All zinc, lead and silver EDR is AEDR. Figures rounded to nearest five years.
- All Resources for All Deposits includes EDR, Subeconomic Demonstrated Resources and Inferred Resources. Figures rounded to nearest five years.
World Ranking
Based on data provided by the United States Geological Survey1, supplemented by the data presented above, Australia ranks highly both in terms of production and economic resources (Table 7 and Table 8). For zinc, Australia ranked first for economic resources and third for production in 2018. For lead Australia ranked first for economic resources and second for production and for silver, Australia ranked third for economic resources and sixth for production.
Table 7. World economic resources of zinc, lead and silver 2018.
| Rank | Zinc | Lead | Silver | ||||||
|---|---|---|---|---|---|---|---|---|---|
| Country | Economic Resourcesa (Mt Zn) | Percentage of world totalb | Country | Economic Resourcesa (Mt Pb) | Percentage of world totalb | Country | Economic Resourcesa (kt Ag) | Percentage of world totalb | |
| 1 | Australia | 66.96 | 29% | Australia | 35.78 | 38% | Peru | 110 | 20% |
| 2 | China | 44 | 19% | China | 18.0 | 19% | Poland | 110 | 20% |
| 3 | Peru | 21 | 9% | Russia | 6.4 | 7% | Australia | 88.36 | 16% |
| 4 | Mexico | 20 | 9% | Turkey | 6.1 | 6% | Russia | 45 | 8% |
| 5 | Kazakhstan | 13 | 6% | Peru | 6.0 | 6% | China | 41 | 7% |
| 6 | USA | 11 | 5% | Mexico | 5.6 | 6% | Mexico | 37 | 7% |
| 7 | India | 10 | 4% | USA | 5.0 | 5% | Chile | 26 | 5% |
| 8 | Bolivia | 4.8 | 2% | India | 2.5 | 3% | USA | 25 | 4% |
| 9 | Canada | 3.0 | 1% | Kazakhstan | 2.0 | 2% | Bolivia | 22 | 4% |
| 10 | Sweden | 1.4 | 1% | Bolivia | 1.6 | 2% | |||
| Others | 33 | 14% | Others | 6.1 | 6% | Others | 57 | 10% | |
| Total | 230 | Total | 95.0 | Total | 560 | ||||
Mt Zn = million tonnes of zinc; Mt Pb = million tonnes of lead; kt Ag = thousand tonnes of silver.
- Source: USGS2 and Geoscience Australia. National figures other than Australia are rounded.
- Percentages are also rounded and might not add up to 100% exactly.
Table 8. World production of zinc, lead and silver 2018.
| Rank | Zinc | Lead | Silver | ||||||
|---|---|---|---|---|---|---|---|---|---|
| Country | Productiona (Mt Zn) | Percentage of world totalb | Country | Productiona (Mt Pb) | Percentage of world totalb | Country | Productiona (kt Ag) | Percentage of world totalb | |
| 1 | China | 4.30 | 33% | China | 2.1 | 47% | Mexico | 6.1 | 23% |
| 2 | Peru | 1.60 | 12% | Australia | 0.469 | 11% | Peru | 4.3 | 16% |
| 3 | Australia | 1.112 | 9% | Peru | 0.30 | 7% | China | 3.6 | 13% |
| 4 | India | 0.80 | 6% | USA | 0.26 | 6% | Chile | 1.3 | 5% |
| 5 | USA | 0.79 | 6% | Mexico | 0.24 | 5% | Poland | 1.3 | 5% |
| 6 | Mexico | 0.65 | 5% | Russia | 0.20 | 4% | Australia | 1.22 | 5% |
| 7 | Bolivia | 0.52 | 4% | India | 0.17 | 4% | Bolivia | 1.2 | 4% |
| 8 | Kazakhstan | 0.39 | 3% | Bolivia | 0.10 | 2% | Russia | 1.2 | 4% |
| 9 | Canada | 0.34 | 3% | Kazakhstan | 0.10 | 2% | Argentina | 1.1 | 4% |
| 10 | Sweden | 0.22 | 2% | Sweden | 0.07 | 2% | USA | 0.9 | 3% |
| Others | 2.30 | 14% | Others | 4.40 | 10% | Others | 4.8 | 18% | |
| Total | 13.0 | Total | 4.45 | Total | 27.0 | ||||
Mt Zn = million tonnes of zinc; Mt Pb = million tonnes of lead; kt Ag = thousand tonnes of silver.
- Source: USGS3 and Geoscience Australia. National figures other than Australia are rounded.
- Percentages are also rounded and might not add up to 100% exactly.
Industry Developments
Figure 6 shows changes in spending on zinc, lead and silver exploration from 2000 until 2018. The trend in exploration spend closely tracks the price fluctuations of zinc and lead, with the major peak in exploration spend coinciding with the 2006 and 2007 price spikes for zinc and lead, respectively. There was a second, more subdued peak in 2011 and 2012 with spend approximately 1.6 times the base level spend of about $50 million in constant 2018 dollars.
Exploration spend has increased over the last two years since the last trough in spending from 2014 to 2016 to a level about twice the constant-dollar base level spend. The peak in zinc-lead-silver exploration spend in 2007 corresponds to the overall peak in exploration spend just prior to Global Financial Crisis. Interestingly, the discovery and drill-out of the Teena deposit (see below) corresponded in time to the slow-down and trough in zinc-lead-silver exploration spend between 2013 and 2016.
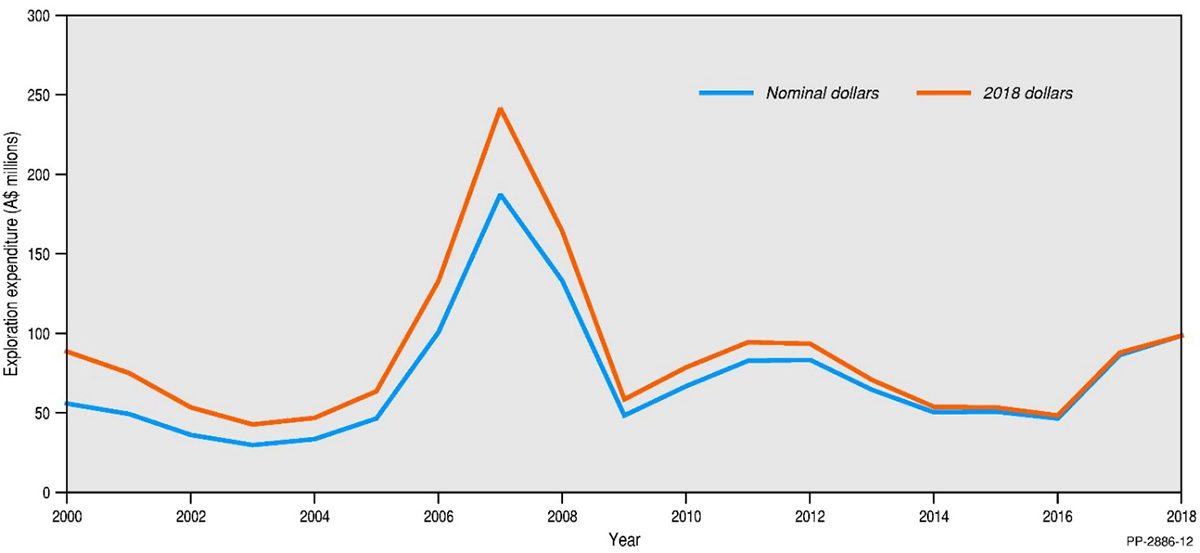
Figure 6. Changes in exploration spending on zinc, lead and silver from 2000 until 2018 in nominal and real (2018) Australian dollars.
Between 2012 and 2016, five major global zinc deposits, including the Century and Black Star (Mount Isa) deposits in Queensland, closed. In 2015, Glencore Pty Ltd decreased its global zinc production by a third, partly from deposits in northern Australia. The closures and decreased zinc (and lead) production initially resulted in increasing zinc and lead prices until mid-2018.
Exploration for zinc, lead and silver deposits in Australia since 2012 has been geographically targeted, with much of the exploration concentrated in the Carpentaria Zinc Belt in northwest Queensland and northeastern Northern Territory. Other areas that have produced significant results include other parts of the Northern Territory, western and central New South Wales and northeastern Queensland.
Figure 7 shows the location of zinc-lead-silver and Figure 8 shows the silver-only deposits in Australia for which resource data are available. They also shows the location of projects described below.
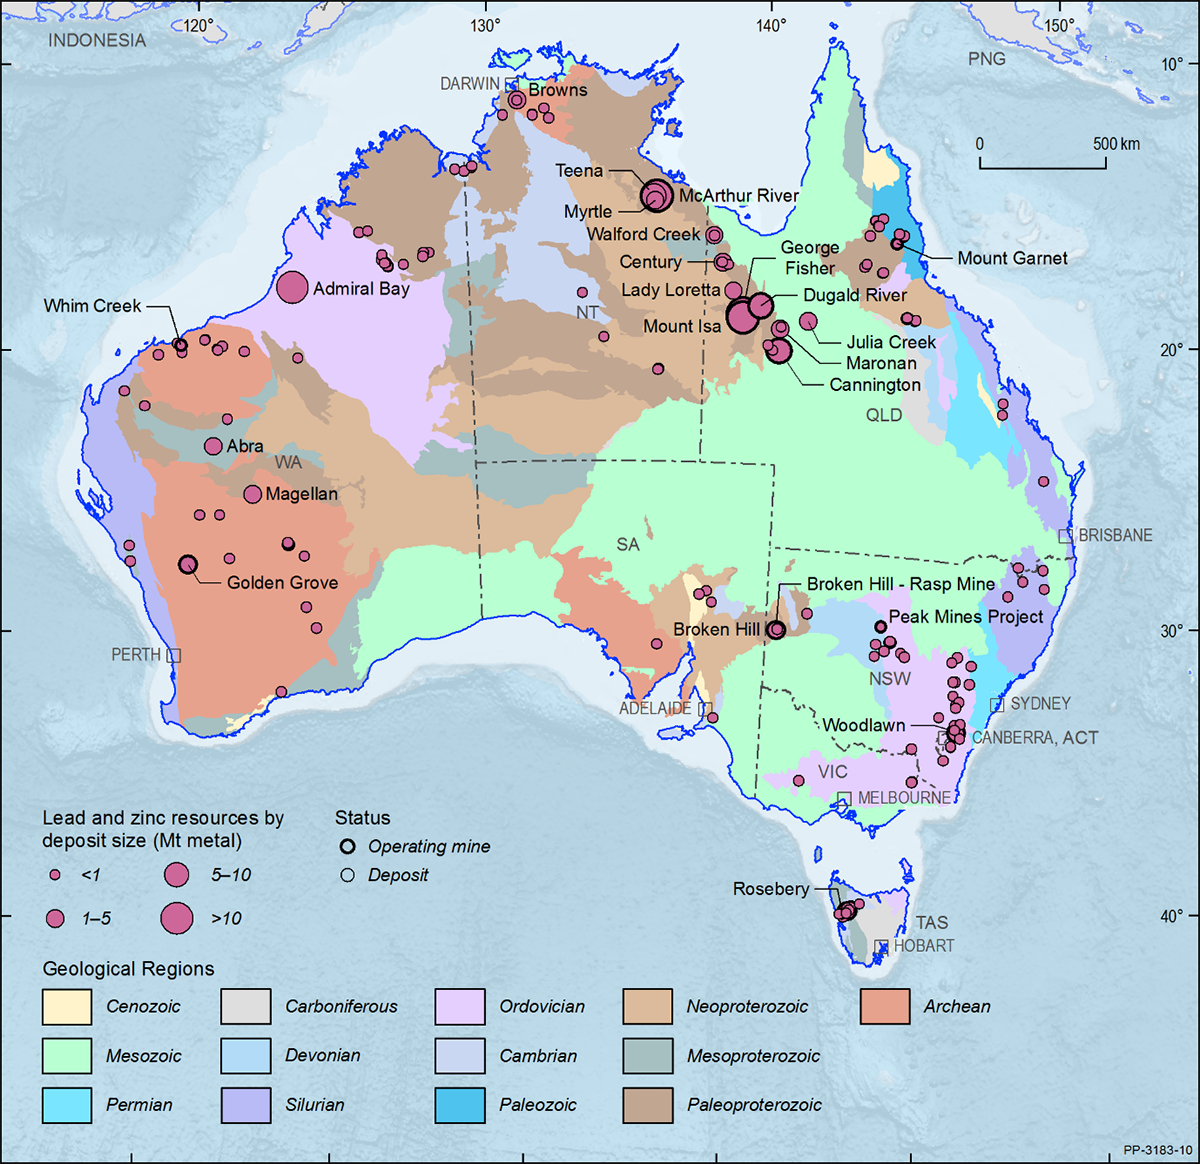
Figure 7. Australian lead-zinc deposits and operating mines as at 31 December 2018. Resource size is based on total resources (Measured + Indicated + Inferred, inclusive of Ore Reserves).
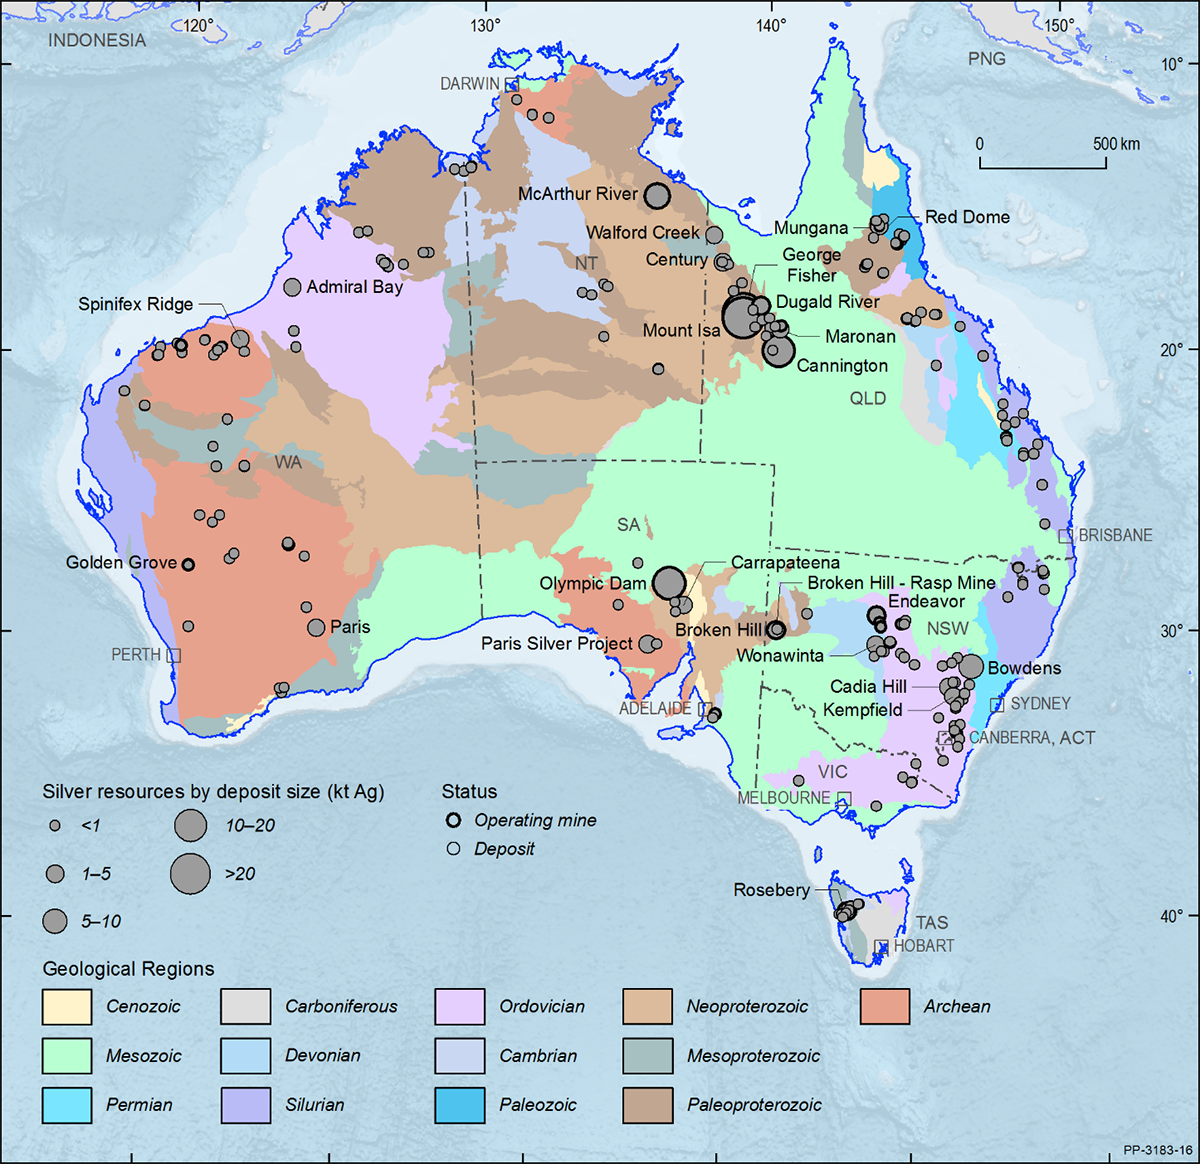
Figure 8. Major Australian silver deposits and operating mines as at 31 December 2018. Many other deposits, particularly gold deposits, also produce minor silver by-product. These mines are not shown here. Resource size is based on total resources (Measured + Indicated + Inferred, inclusive of Ore Reserves).
The Teena deposit, located in the northwestern part of the Carpentaria Zinc Belt in the Northern Territory, was (re-)discovered in 2013 by a joint venture between Rox Resources Ltd and Teck Australia Pty Ltd based on a re-interpretation of several holes drilled by Mount Isa Mines in the mid-1970s. This deposit, which is located about 10 km to the west of the McArthur River mine, is one of three major zinc-lead discoveries made globally in the 2010s. Total resources are 58 Mt grading 11.1% Zn and 1.6% Pb4. Although located near existing mine infrastructure, the depth of the mineralised body below the surface (600-1000 m) could provide challenges to the eventual development of the deposit.
The Walford Creek deposit in Queensland, located to the southeast of Teena, was discovered in 1990 by Western Mining Ltd. Aeon Metals Ltd acquired the property in 2014, and subsequent exploration has identified a total JORC-compliant resource of 33.7 Mt grading at 0.66% Cu, 0.93% Zn, 0.91% Pb, 27.3 g/t Ag and 0.13% cobalt (Co; calculated by combining separate Copper Lode and Cobalt Peripheral resources)5. This discovery is important as it shows a close spatial relationship between zinc-lead and copper-cobalt mineralisation in the Carpentaria Zinc Belt.
Further to the southeast of Walford Creek, Pursuit Minerals Ltd intersected long intervals of relatively low-grade zinc-lead mineralisation in 2018 at the Bluebush prospect, with the best intersection being 78 m grading 0.81% Zn and 0.25% Pb6.
Although MMG Ltd ceased mining at the Century deposit to the south of Walford Creek, New Century Resources Ltd started the retreatment of tailings on a 2012 JORC-compliant reserve base of 77.3 Mt grading at 3.0% Zn and 12 g/t Ag. Tailing retreatment commenced in 2018 with the first shipment of zinc concentrate in November that year. In addition to tailing resources, New Century has identified small in situ resources at Century and a small resource at the nearby Silver King deposit7.
In early 2019, Vendetta Mining Corp, based in Vancouver, Canada, announced an updated mineral resource and a preliminary economic assessment of the Pegmont deposit to the southeast of Mount Isa in the Carpentaria Zinc Belt8. The updated NI43-101-compliant mineral resources include 5.758 Mt grading 2.6% Zn, 6.5% Pb and 11 g/t Ag in the Indicated category and 8.227 Mt grading 2.8% Zn, 5.1% Pb and 8 g/t Ag in the Inferred category9.
Also to the southeast of Mount Isa, Red Metal Ltd released JORC (2012)-compliant Inferred Resources for the Maronan deposit of 30.8 Mt grading at 6.50% Pb and 106 g/t Ag and 19.2 Mt grading 1.24% Cu and 0.6 g/t Au. The Maronan deposit was discovered in 1987 and includes separate zinc-silver and copper-gold zones10.
In addition to discovery of the globally significant Teena deposit, exploration for zinc, lead and silver in the Northern Territory has also resulted in the discoveries of the better defined resources in known districts (e.g., Jervois, Hays Creek and Home of Bullion) and a new mineral province in the western Arunta.
In 2013, Independence Group NL entered into a joint venture with ABM Resources NL to explore a number of exploration leases in the under-explored greenfields of the western Arunta region. Follow-up of a surface geochemical program resulted in the discovery of the Bumblebee prospect. Drilling at this prospect has yielded a most significant intersection of 7 m averaging 3.3 g/t Au, 37.7 g/t Ag, 3.2% Cu, 0.9% Pb, 1.3% Zn and 0.08% Co11.
Subsequent exploration identified the Grapple prospect, with a best intersection of 11.4 m grading 7.9 g/t Au, 21 g/t Ag, 0.8% Cu, 1.1% Zn, 0.5% Pb and 0.1% Co. Although it is early days, the discovery of these two prospects highlights the potential of the under-explored western Arunta region for gold and base metal mineralisation12.
In the Jervois districtin the eastern Arunta, most attention has been directed at the Rockface and other nearby copper deposits. Significant advances, however, have also been made toward defining zinc-lead-silver resources in this district. Mineralisation in the Jervois district was discovered in 1929, and short-lived mining operations occurred in 1963 and 1982-1983. The latter period mined high-grade lead-zinc zones but was curtailed when the price of these commodities plummeted in 1983.
KGL Resources Ltd have explored this district since 2011. The company has identified total (Indicated plus Inferred) resources of 21.3 Mt grading at 1.67% Cu and 22.3 g/t Ag and 3.8 Mt grading 0.72% Cu, 1.2% Zn, 3.7% Pb and 67.5 g/t Ag13. Current plans have mine construction beginning in mid-2019, with mining to commence in 2020 (Mine construction to begin in June 2020)14.
At the Barrow Creek Project in the north-central Arunta, Kidman Resources Ltd defined a JORC-compliant Inferred Resource of 2.5 Mt grading 1.8% Cu, 2.0% Zn, 1.2% Pb, 36 g/t Ag and 0.14 g/t Au at the Home of Bullion deposit15. This deposit was mined intermittently between 1924 and 1958 with production of 1571 t of copper metal15.
PNX Metals Ltd owns the Hayes Creek Project in the Pine Creek province, which includes the Iron Blow and Mount Bonnie deposits. It has progressed towards development, with a positive prefeasibility study released in July 2017 based on JORC-compliant total resources (Indicated plus Inferred) of 4.077 Mt grading 4.35% Zn, 0.91% Pb, 0.25% Cu, 124 g/t Ag and 1.81 g/t Au17. Exploration continues at this project.
In New South Wales, two mines, Woodlawn and Hera, have been re‑opened since 2012, and exploration has advanced towards production at several other projects. The most significant development has been the re-opening of the Woodlawn volcanic-hosted massive sulfide deposit by Heron Resources Ltd. Woodlawn was discovered in 1969 and initially mined between 1978 and 1998. The project was acquired by Heron in 2014 following a merger with TriAusMin Ltd.
Heron has defined total Mineral Resources (Measured, Indicated and Inferred; inclusive of Ore Reserves) for underground at 7.2 Mt grading 6.3% Zn, 2.4% Pb, 1.9% Cu, 51 g/t Ag and 0.5 g/t Au and for tailing retreatment of 10.9 Mt grading 2.30% Zn, 1.29% Pb, 0.51% Cu, 32 g/t Ag and 0.30 g/t Au18.
Mine construction began in 2018, with first production of underground ore in May 201919. Commission of the hydraulic mining circuit for retreating tailings is well advanced, with full production to commence when the processing plant becomes available.
The Hera deposit, located approximately 70 km southeast of Cobar near Nymagee in north-central New South Wales, was acquired by Aurelia Metals Ltd (then YTC Resources Ltd) in 2009. A definitive feasibility study was delivered in late 2011, and mine construction commenced in January 2013, with commercial production in April 2015.
At the start of mining, total Mineral Resources (Measured, Indicated and Inferred; inclusive of Ore Reserves) amounted to 2.698 Mt grading 4.86% Zn, 3.67% Pb, 34.01 g/t Ag and 4.12 g/t Au. Production in fiscal year 2017-2018 totalled 0.407 Mt grading 3.6% Zn, 2.6% Pb, 13.4 g/t Ag and 5.10 g/t Au20.
Peel Mining Ltd has also had exploration success in the Cobar field over the last few years. The first discovery, at Mallee Bull, 100 km to the south of Cobar, was in 201121. A total (Indicated plus Inferred) JORC (2012)-compliant Mineral Resource of 6.76 Mt grading 0.6% Zn, 0.6% Pb, 1.8% Cu, 31 g/t Ag and 0.4 g/t Au was announced in 201722.
More recently, Peel Mining has concentrated on the Wagga Tank property 130 km south of Cobar, which they acquired in 2016. Since acquisition, the company has been drilling out the Wagga Tank-Southern Nights prospect, with better intersections including 142.1 m grading 7.39% Zn, 3.76% Pb, 0.15% Cu, 101 g/t Ag and 0.54 g/t Au and 19 m grading 10.9% Zn, 3.6% Pb, 0.13% Cu, 99 g/t Ag and 0.46 g/t Au23.
Approximately 4 km to the east of this prospect, Peel Mining have also been drilling out the Fenceline prospect, with better intersections including 18.9 m grading 0.28% Zn, 7.38% Pb, 35.3 g/t Ag and 1.21 g/t Au, and 27 m grading 11.26% Pb, 61 g/t Ag and 2.22 g/t Au24. Hera, Mallee Bull, Wagga Tank-Southern Nights and Fenceline appear to be Cobar-style, structurally-controlled deposits.
Exploration at the Collerina prospect, 130 km southeast of Cobar by Helix Resources Ltd has also yielded significant polymetallic intersections, including a recent intersection of 2 m grading 1.4% Zn, 5.1% Cu, 7g/t Ag and 0.5 g/t Au25. This prospect, unlike the Cobar-style deposits to the west, is interpreted as an older volcanic-hosted massive sulfide deposit. A maiden resource is expected later in 201926.
At the Commonwealth prospect, which is located 95 km north of Orange, Impact Minerals Ltd have recently extended known precious-metal-rich, volcanic-hosted massive sulfide zones, with a best intersection of 5.7 m grading 10.8% Zn, 3.7% Pb, 347 g/t Ag and 3.8 g/t Au27. In 2014, the company outlined a maiden JORC (2012)-compliant Inferred Mineral Resource of 0.72 Mt grading 48 g/t Ag and 2.8 g/t Au28.
Following the bankruptcy of Kagara Ltd, mining of the Thalanga project, 65 km southeast of Charters Towers, Queensland, ceased in 2012. In 2017, Red River Resources Ltd recommenced mining, initially of the West 45 lens, with future development of other zinc-lead-rich deposits (Far West, Orient, Waterloo, Liontown and Liontown East) in the region. As of 30 June 2018, total JORC-compliant Mineral Resources (Measured, Indicated and Inferred; inclusive of Ore Reserves) amounted to 7.075 Mt grading 6.8% Zn, 2.1% Pb, 0.9% Cu, 42 g/t Ag and 0.6 g/t Au29.
At the Peterlumbo Project, Investigator Resources Ltd continued exploration at the Paris silver prospect, releasing in 2017 a total (Indicated and Inferred) JORC-compliant Mineral Resource of 9.3 Mt grading 0.6% Pb and 139 g/t Ag30. Paris is moving towards a prefeasibility study.
At the end of 2017, Independence Group NL sold the Stockman Project (including the Currawong and Wilga deposits) near Benambra in east Victoria to CopperChem Ltd. At that time, the project, which had substantial recent exploration, had total (Measured, Indicated and Inferred) JORC-compliant Mineral Resources (inclusive of Ore Reserves) of 14.0 Mt grading 4.3% Zn, 2.1% Cu, 38 g/t Ag and 0.5 g/t Au31.
In western Victoria, Stavely Minerals Ltd drilled seven RC holes into the Mount Ararat volcanic-hosted massive sulfide deposit in 2014, and announced a total (Indicated and Inferred) JORC-compliant Mineral Resource of 1.4 Mt grading 0.4% Zn, 2.0% Cu, 6 g/t Ag and 0.5 g/t Au32. The best intersection during the drilling program was 5 m grading 0.48% Zn, 2.10% Cu, 9 g/t Ag and 0.56 g/t Au33.
In the Yeneena Basin in Western Australia, Encounter Resources Ltd discovered the Millenium prospect in 2010. This prospect, originally a copper target, has since returned mostly long-intersection, low-grade zinc mineralisation in gossan and in fresh rocks (e.g. 91.8 m grading 1.6% Zn, 45 m grading 0.4% Zn and 61 m grading 0.45% Zn) with a few intersections of high-grade zinc-rich sulfide mineralisation (e.g. 0.7 m grading 36.5% Zn and 7 m grading 4.8% Zn) 34. This prospect is a considered sediment-hosted massive Zn-Pb and Cu target.
Also in Western Australia, Musgrave Minerals Ltd produced several zinc-copper intersections at the Mount Eelya prospect in the Youanmi Terrane, including 7 m grading 9.3% Zn, 1.1% Cu and 11.3 g/t Ag35. At the Snake Well base metal project in the Youanmi Terrane, Kalamazoo Resources Ltd has re-assayed existing RC chips for zinc, lead, copper, silver and gold using portable XRF analysis. These analyses yielded indicative assays including 2 m grading 4.4% Zn and 2.9% Pb and 14 m grading 0.87% Zn, 0.76% Pb and 0.36% Cu at the A-Zone prospect36.
At the Salt Creek prospect, which was originally discovered in 1977, Venturex Resources Ltd reported a number of new intersections in early 2017, including 9.9 m grading 8.8% Zn, 1.4% Pb, 0.34% Cu, 15 g/t Ag and 0.2 g/t Au from 265 m37.
Venturex also continues to progress toward the development of the Sulphur Springs Project, also in the Pilbara Craton. The company completed a defensible feasiblity study with an upgrade in total resources (Measured, Indicated and Inferred) for the Sulphur Springs and Kangaroo Caves deposits to 17.4 Mt grading 4.3% Zn, 0.2% Pb, 1.4% Cu and 17 g/t Ag. This includes increased Ore Reserves of 8.494 Mt grading 3.1% Zn, 1.4% Cu and 14.3 g/t Ag38. Except for the Millenium prospect, all of these Western Australian prospects are considered volcanic-hosted massive sulfide deposits.
Citation
Bibliographical reference: Huston, D., 2020. Australian Resource Reviews: Zinc, Lead and Silver 2019. Geoscience Australia, Canberra.
References
3 ibid.
4 Taylor, M.I., McMillan, N.E., Dalrymple, I.J. and Hayward, N. 2017. Teena zinc-lead deposit. Australasian Institute of Mining and Metallurgy Monograph 32, 473-478.
5 Aeon Metals Ltd. ASX announcement 24 January 2018.
6 Pursuit Minerals Ltd. ASX announcement 25 September 2018.
7 New Century Resources Ltd. ASX announcement 28 November 2017.
8 Vendetta Mining Corp. Vendetta Corporate Update 29 March 2019.
9 This update is not included in the 2019 national inventory as the resource upgrade occurred after the 31 December 2018 cut-off for inclusion.
10 Red Metal Ltd. ASX Announcement 10 September 2018.
11 Independence Group NL/ABM Resources NL. ASX announcement 6 October 2015.
12 Independence Group NL/ABM Resources NL. ASX announcement 18 September 2017.
13 KGL Resources Ltd. ASX announcement 23 January 2019.
14 KGL Resources Ltd. ASX announcement 4 October 2019.
15 Kidman Resources Ltd. ASX announcement 29 July 2014.
16 Kidman Resources Ltd. Home of Bullion MMP July 2018
17 PNX Metals Ltd. ASX announcement 3 May 2017.
18 Heron Resources Ltd. ASX announcement 29 June 2016 & 13 November 2017.
19 Heron Resources Ltd. ASX announcement 8 May 2019.
20 Aurelia Metals Ltd. ASX announcement 28 June 2016 & 30 October 2018.
21 Peel Mining Ltd. ASX announcement 11 January 2012.
22 Peel Mining Ltd. ASX announcement 6 July 2017.
23 Peel Mining Ltd. ASX announcement 22 March 2018.
24 Peel Mining Ltd. ASX announcement 28 September 2018.
25 Helix Resources Ltd. ASX announcement 1 March 2019.
26 Helix Resources Ltd. ASX announcement 9 January 2019.
27 Impact Minerals Ltd. ASX announcement 18 September 2018.
28 Impact Minerals Ltd. ASX announcement 19 February 2015.
29 Red River Resources Ltd. ASX announcement 18 July 2018.
30 Investigator Resources Ltd. ASX announcement 19 April 2017.
31 Independence Group NL. ASX announcement 28 November 2014.
32 Stavely Minerals Ltd. ASX announcement 22 September 2014.
33 Stavely Minerals Ltd. ASX announcement 10 September 2014.
34 Encounter Resources Ltd. ASX announcement 29 January 2018.
35 Musgrave Minerals Ltd. ASX announcement 26 June 2017.
36 Kalamazoo Resources Ltd. ASX announcement 31 January 2018.
37 Venturex Resources Ltd. ASX announcement 12 January 2017.
38 Venturex Resources Ltd. ASX announcement 26 September 2019.