Australian Mineral Exploration Review 2025 Maiden Mineral Resources
Page last updated:3 August 2026
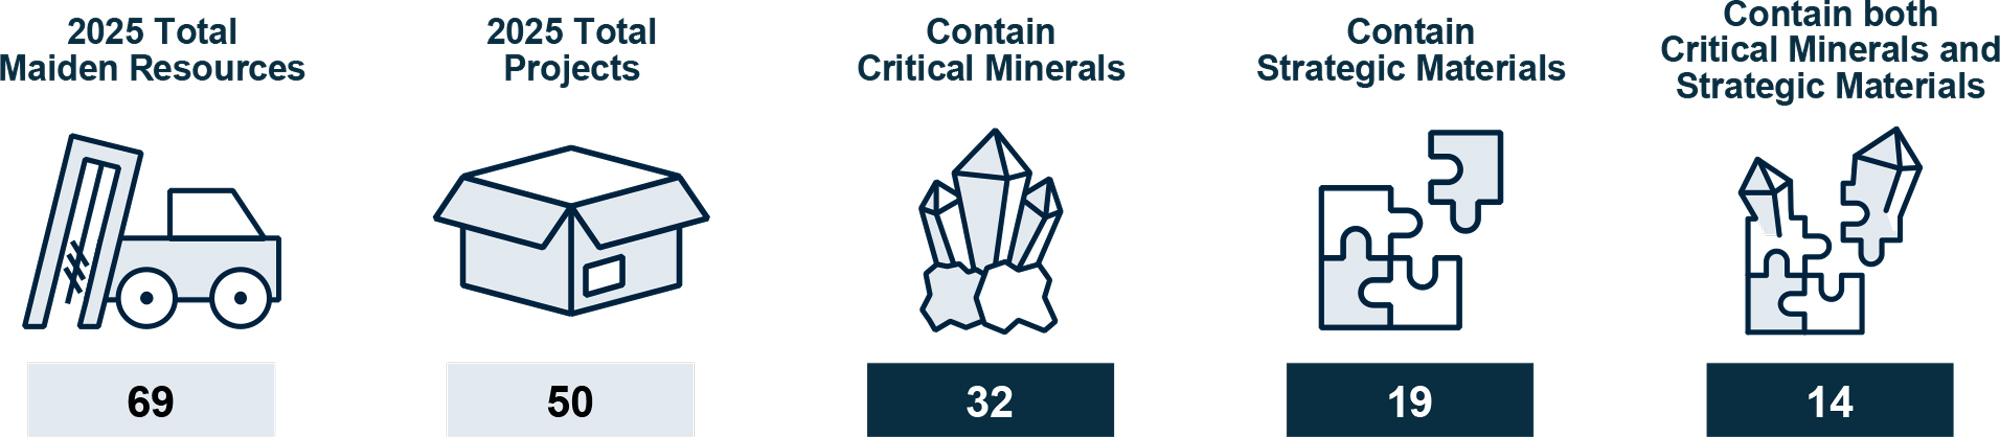
A maiden Mineral Resource is the first report of a Mineral Resource estimate for a new deposit or a new commodity at an existing deposit. They have not had any prior Mineral Resources or Ore Reserves defined under a reporting code recognised by the Committee for Mineral Reserves International Reporting Standards25 such as the JORC Code26. Maiden resources are usually reported in public announcements to stock exchanges such as the ASX and represent an important milestone for exploration projects as they provide an initial indication of the scale, grade and potential economic significance of a discovery. An expanded definition for maiden Mineral Resources can be found in Appendix E.
The discovery and definition of new mineral resources is fundamental to building Australia’s resource wealth and supporting a diverse mining sector. In 2025, 50 projects across Australia reported maiden Mineral Resources, comprising 69 individual maiden resource announcements at the deposit level (Table 1; Figure 4). Of these, 32 included a critical mineral,19 contained a strategic material, and 14 contained both critical minerals and strategic materials. Gold, a precious metal, was the most frequently reported commodity, occurring in 34 maiden resources, followed by copper in 13. Among critical minerals, tungsten and REE were the most frequently reported, occurring in 8 and 7 maiden Mineral Resources respectively, followed by gallium in 5 and titanium in 4 (Table 1).
Collectively, the 2025 maiden Mineral Resources made notable additions to Australia’s minerals inventory27, particularly for critical minerals that have relatively small existing resource bases. The largest proportional impacts were recorded for indium and gallium. Maiden Mineral Resources increased the Australia’s Economic Demonstrated Resource (EDR) of indium by over 300% and Inferred Mineral Resources by 13,000% and increased Inferred Mineral Resources of gallium by 413% (Table 2). Other substantial additions to Australia’s EDR included: antimony, with maiden Mineral Resources equivalent to 17% of the 2024 national EDR and 73% of Inferred Resources; bismuth, equivalent to 20% of EDR and 8% of Inferred Resources; cobalt, equivalent to 4% EDR and 15% of Inferred Resources; and nickel, equivalent to 6% of EDR and 21% of Inferred Resources. Maiden Mineral Resources also made meaningful increases to national Inferred Resources for high-purity silica (38%), niobium (21%) and tungsten (14%) (Table 2). Compared to 2024, the 2025 results indicate a modest rebound in project-level activity, with 50 projects reporting a maiden Mineral Resource compared to 45 in 2024, although still below the recent peak of 77 projects in 2023. This could reflect the decline in new deposit drilling since 2021 (Figure 2b), as exploration expenditure has shifted towards existing deposits and gold-focussed projects.
Despite this, Australia’s 2025 maiden Mineral Resources demonstrate the continued diversity and depth of the national minerals pipeline. Importantly, they include numerous significant critical mineral deposits that are essential to Australia’s future resource security, clean energy and advanced manufacturing capability. The scale of additional resource for commodities such as REE, gallium, titanium, nickel, tungsten, niobium, antimony and high-purity silica highlight the ongoing role of mineral resource discoveries in expanding Australia’s critical minerals endowment and supporting long-term economic and strategic priorities.
The size classifications for maiden Mineral Resources have been calculated using the method developed by Cassard et al. (2015) and applied to the primary commodity of the deposit28.
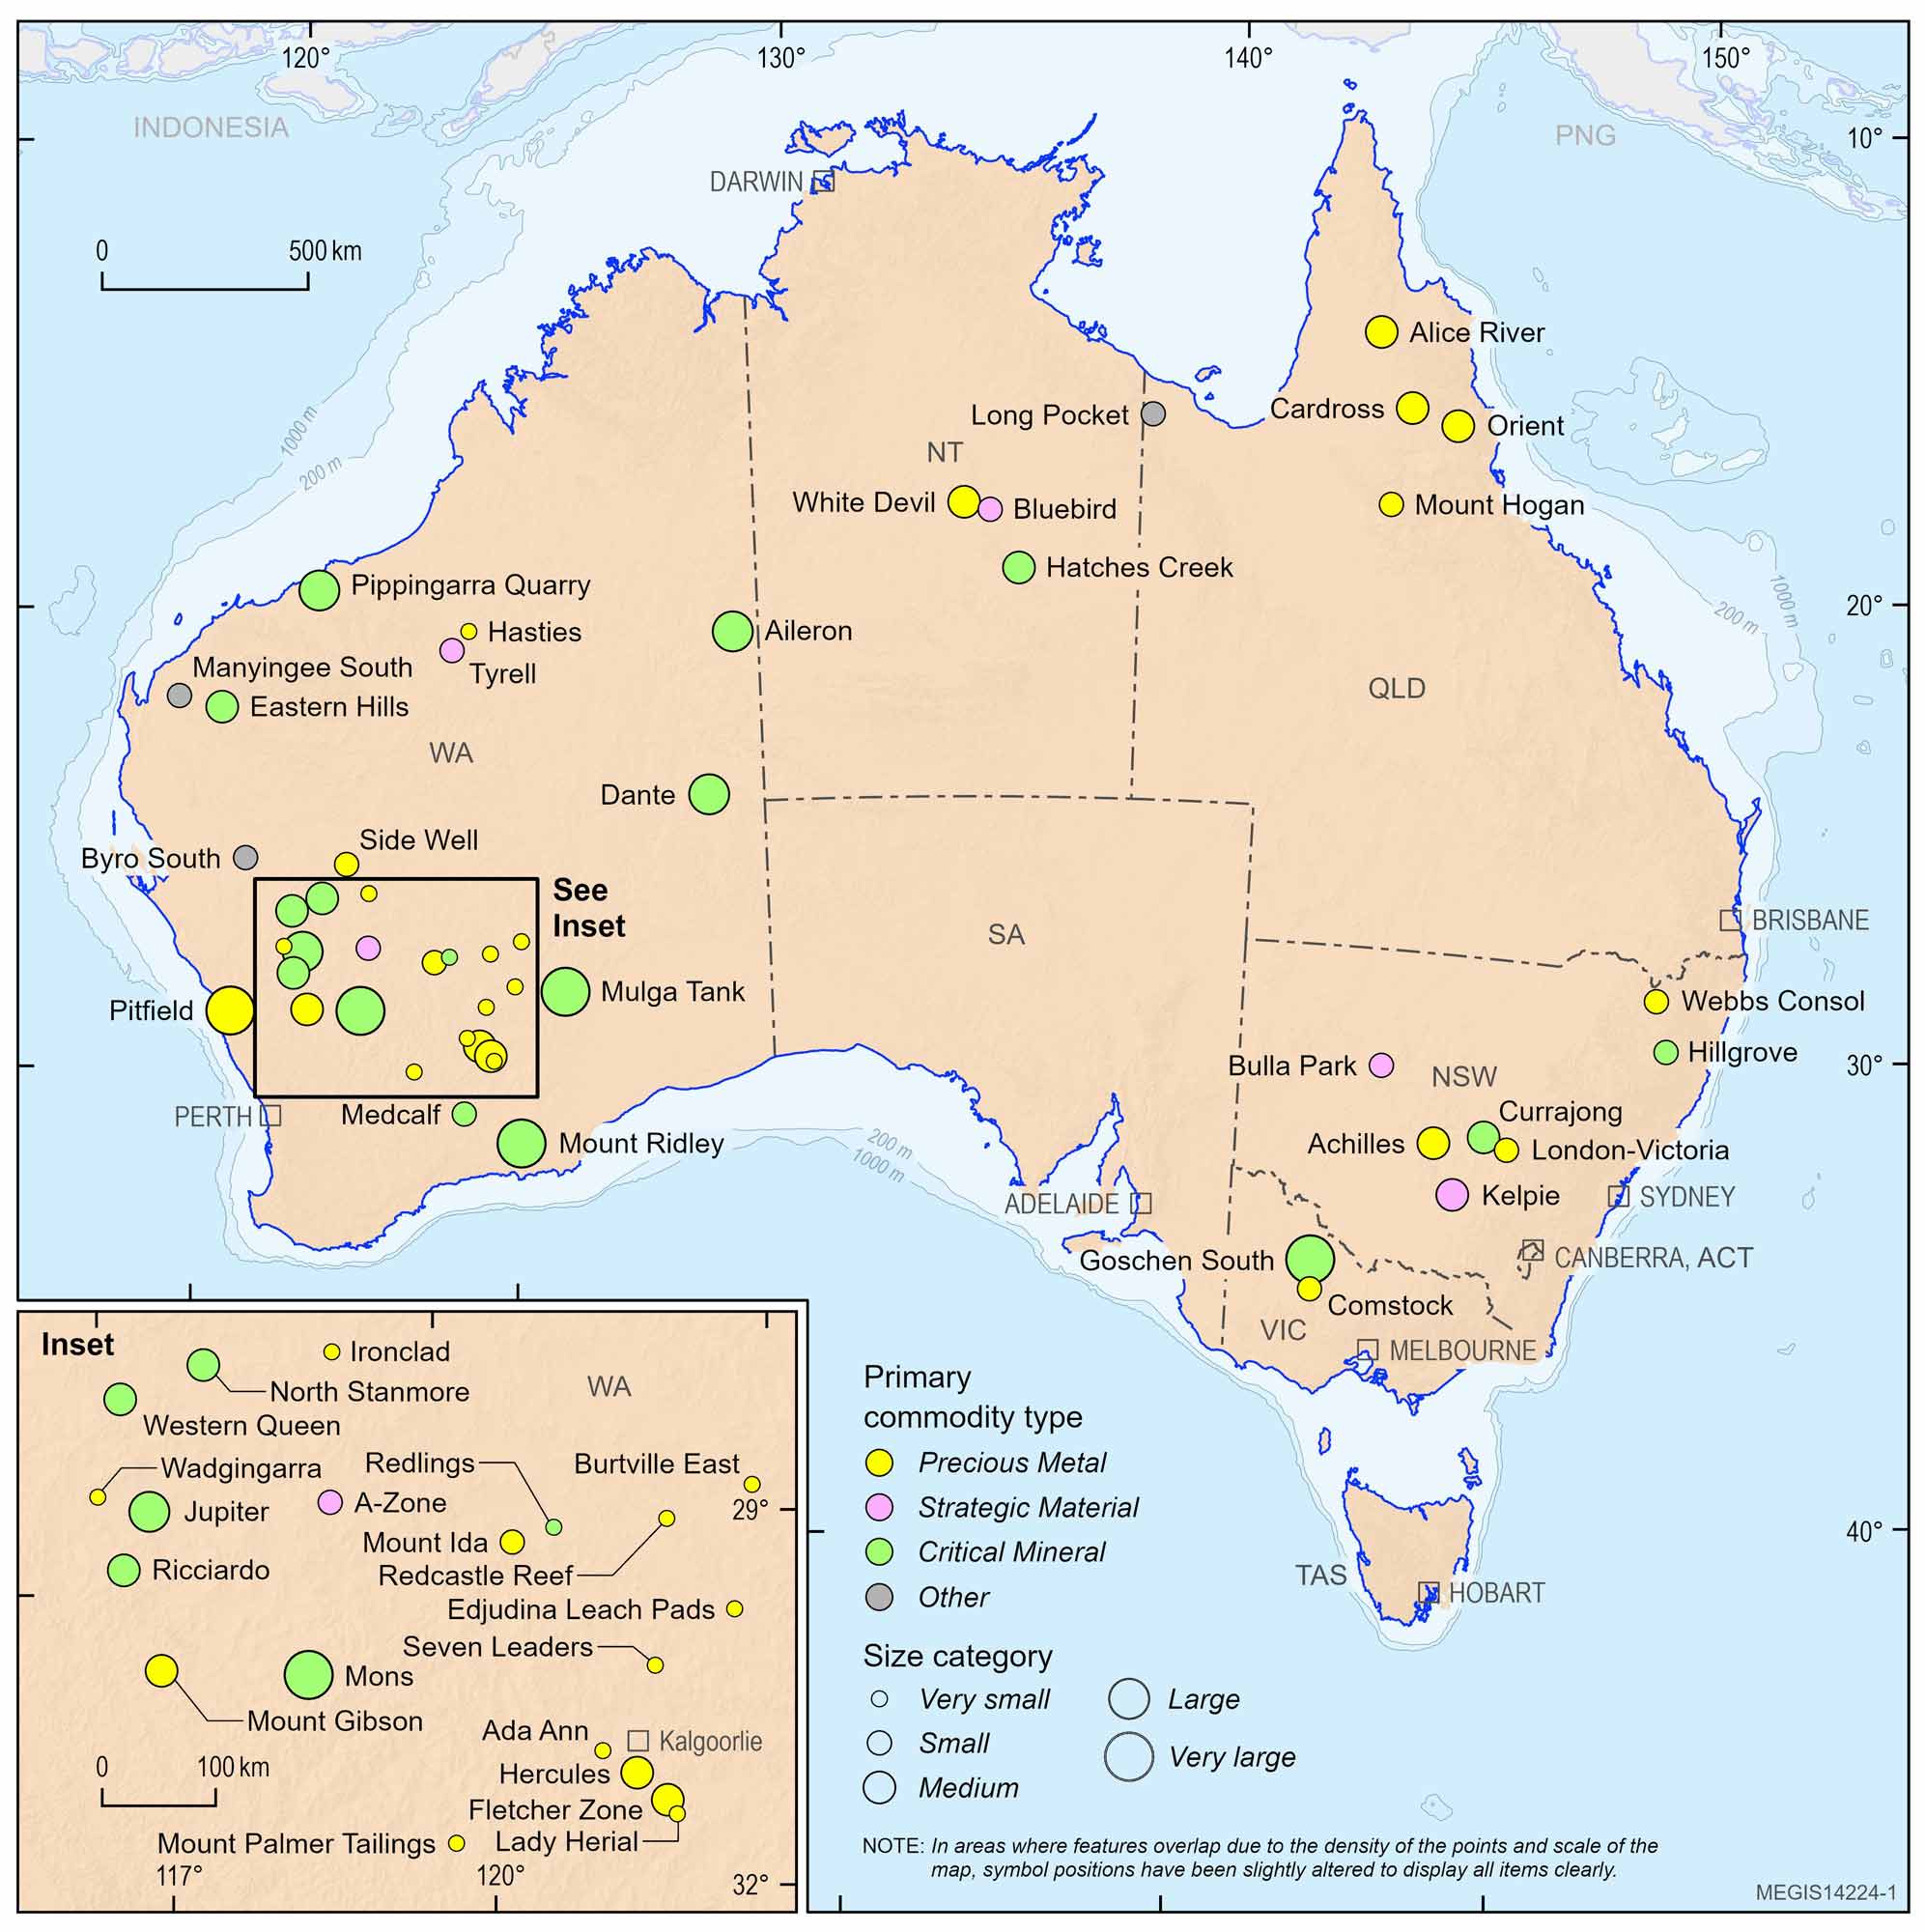
Figure 4. Location of Maiden Mineral Resources in Australia in 2025 by project. The 69 maiden resource announcements from 50 projects are listed in Table 1. Projects are coloured according to the primary commodity type of the project as described by the company. Symbol size indicated the project size category, classified using the mineral deposit size framework described by Cassard et al. (2015). The inset highlights the concentration of 2025 Maiden Mineral Resources in the Yilgarn region of Western Australia.
Table 1. Maiden Mineral Resource announcements in Australia reported through the ASX (or equivalent) in 2025. Company tickers are for the ASX unless otherwise stated. See acronyms, abbreviations and symbols for details.
| Company | Company Ticker | Deposit (Project) | State | Resource Category | Tonnage and Grade | Contained Material |
|---|---|---|---|---|---|---|
| Maiden Mineral Resources | ||||||
| ActivEX Ltd | AIV | Mount Hogan | QLD | Inferred | 8.5 Mt @ 1.13 g/t Au | Gold – 9.61 t (309 koz) |
| Adavale Resources Ltd | ADD | London-Victoria | NSW | Inferred | 3.14 Mt @ 1.06 g/t Au | Gold – 3.61 t (116 koz) |
| Athena Resources Ltd | AHN | Byro South | WA | Inferred | 47 Mt @ 29% Fe | Iron – 13.63 Mt |
| Aureka Ltd | AKA | Comstock | VIC | Inferred | 1.45 Mt @ 1.21 g/t Au | Gold – 1.75 t (56 koz) |
| Australian Gold and Copper Ltd | AGC | Achilles | NSW | Indicated, Inferred | 10.3 Mt @ 51 g/t Ag, 0.37 g/t Au, 0.7% Zn, 0.53% Pb | Silver – 525 t (17 Moz) Gold – 3.87 t (124 koz) Zinc – 71.3 kt Lead – 55.3 kt |
| Capricorn Metals Ltd | CMM | Orion South Underground (Mount Gibson) | WA | Inferred | 6.84 Mt @ 3.1 g/t Au | Gold – 21.2 t (682 koz) |
| Capricorn Metals Ltd | CMM | Highway (Mount Gibson) | WA | Inferred | 3.93 Mt @ 0.9 g/t Au | Gold – 3.33 t (107 koz) |
| Caspin Resources Ltd | CPN | Kelpie | NSW | Inferred | 3.94 Mt @ 0.5% Sn | Tin – 19.7 kt |
| Cauldron Energy Ltd | CXU | Manyingee South | WA | Inferred | 15.5 Mt @ 325 ppm eU3O8 | Uranium – 4.27 kt |
| Charger Metals NL | CHR | Medcalf | WA | Inferred | 8.2 Mt @ 1.0% Li2O | Lithium – 38.09 kt |
| Critica Ltd | CRI | Jupiter | WA | Inferred | 1,780 Mt @ 1,651 ppm TREO | TREO – 2.94 Mt |
| Delta Lithium Ltd/Ballard Mining Ltd | DLI / BM1 | Bombay (Mount Ida) | WA | Inferred | 0.74 Mt @ 1.4 g/t Au | Gold – 0.92 t (30 koz) |
| Delta Lithium Ltd/Ballard Mining Ltd | DLI / BM1 | West Knell (Mount Ida) | WA | Inferred | 0.42 Mt @ 2.9 g/t Au | Gold – 1.25 t (40 koz) |
| Delta Lithium Ltd/Ballard Mining Ltd | DLI / BM1 | Jupiter (Mount Ida) | WA | Inferred | 0.14 Mt @ 2.3 g/t Au | Gold – 0.33 t (11 koz) |
| Emmerson Resources Ltd | ERM | White Devil | NT | Indicated, Inferred | 3.63 Mt @ 4.2 g/t Au | Gold – 15.24 t (490 koz) |
| Empire Metals Ltd | EEE (LSE) | Cosgrove (Pitfield) | WA | Indicated, Inferred | 430 Mt @ 5.8% TiO2 | TiO2 – 24.51 Mt |
| Empire Metals Ltd | EEE (LSE) | Thomas (Pitfield) | WA | Indicated, Inferred | 1,770 Mt @ 5.0% TiO2 | TiO2 – 88.21 Mt |
| Empire Resources Ltd | ERL | A-Zone | WA | Inferred | 1.07 Mt @ 1.14% Cu, 0.4 g/t Au, 1.09 g/t Ag, 0.037% Zn | Copper – 12.2 kt Gold – 0.43 t (14 koz) Silver – 1.2 t (39 koz) Zinc – 4 kt |
| Encounter Resources Ltd | ENR | Tyrell | WA | Inferred | 2.9 Mt @ 0.8% Cu | Copper – 22.9 kt |
| Encounter Resources Ltd | ENR | Green (Aileron) | WA | Inferred | 48 Mt @ 0.81% Nb2O5, 0.36% TREO, 6.04% P2O5 | Niobium – 271.79 kt TREO – 172.8 kt Phosphate – 2.9 Mt |
| Encounter Resources Ltd | ENR | Emily (Aileron) | WA | Inferred | 13.9 Mt @ 0.93% Nb2O5, 0.32% TREO, 7.44% P2O5 | Niobium – 90.36 kt TREO – 44.5 kt Phosphate – 1.03 Mt |
| Encounter Resources Ltd | ENR | Crean (Aileron) | WA | Inferred | 5.7 Mt @ 1.38% Nb2O5, 0.84% TREO, 7.42% P2O5 | Niobium – 54.99 kt TREO – 47.9 kt Phosphate – 422.9 kt |
| Forrestania Resources Ltd | FRS | Ada Ann | WA | Inferred | 231,600 t @ 1.67 g/t Au | Gold – 0.39 t (12 koz) |
| Gibb River Diamonds Ltd | GIB | Edjudina Leach Pads | WA | Inferred | 24,800 t @ 1.51 g/t Au | Gold – 0.04 t (1 koz) |
| Great Boulder Resources Ltd | GBR | Golden Bracelet (Side Well) | WA | Inferred | 2.58 Mt @ 0.9 g/t Au | Gold – 2.32 t (75 koz) |
| Great Boulder Resources Ltd | GBR | Saltbush (Side Well) | WA | Indicated, Inferred | 292,000 t @ 2.4 g/t Au | Gold – 0.71 t (23 koz) |
| Great Boulder Resources Ltd | GBR | Eaglehawk (Side Well) | WA | Indicated, Inferred | 2.96 Mt @ 1.5 g/t Au | Gold – 4.26 t (137 koz) |
| Great Boulder Resources Ltd | GBR | Flagpole (Side Well) | WA | Inferred | 494,000 t @ 1.6 g/t Au | Gold – 0.79 t (25 koz) |
| Iltani Resources Ltd | ILT | Orient West (Orien) | QLD | Indicated, Inferred | 21.6 Mt @ 26.9 g/t Ag, 21.1 g/t In, 0.59% Pb, 0.85% Zn | Silver – 584.1 t (19 Moz) Indium – 458.2 t Lead – 129 kt Zinc – 184.5 kt |
| Iltani Resources Ltd | ILT | Orient East (Orient) | QLD | Indicated, Inferred | 12.6 Mt @ 39 g/t Ag, 9.7 g/t In, 0.98% Pb, 0.99% Zn | Silver – 514.3 t (17 Moz) Indium – 121.3 t Lead – 125.5 kt Zinc – 124 kt |
| Iluka Resources Ltd | ILU | Goschen South | VIC | Indicated, Inferred | 630 Mt @ 3.7% HM | HMS – 23.52 Mt |
| Industrial Minerals Ltd | IND | Pippingarra Quarry | WA | Inferred | 6.2 Mt @ 98% SiO2 | HPSi – 6.08 Mt |
| Kula Gold Ltd | KGD | Mount Palmer Tailings | WA | Inferred | 98,500 t @ 0.63 g/t Au | Gold – 0.06 t (2 koz) |
| Laramide Resources Ltd | LAM | Long Pocket | QLD | Indicated, Inferred | 4 Mt @ 390 ppm U3O8 | Uranium – 1.13 kt |
| Lode Resources Ltd | LDR | Webbs Consol | NSW | Indicated, Inferred | 1.57 Mt @ 151 g/t Ag, 0.1% Cu, 2.6% Pb, 6.3% Zn | Silver – 236.7 t (8 Moz) Copper – 2.2 kt Lead – 40.7 kt Zinc – 98.9 kt |
| Lunnon Metals Ltd | LM8 | Lady Herial | WA | Measured, Indicated, Inferred | 573,000 t @ 1.6 g/t Au | Gold – 0.91 t (29 koz) |
| Marquee Resources Ltd | MQR | Eastern Hills | WA | Inferred | 1.14 Mt @ 0.5% Sb, 0.7% Pb, 7.0 g/t Ag, 0.1 g/t Au | Antimony – 5.98 kt Lead – 8.3 kt Silver – 8.3 t (267 koz) Gold – 0.11 t (4 koz) |
| Marquee Resources Ltd | MQR | Redlings | WA | Inferred | 11 Mt @ 1,130 ppm TREO | TREO – 12.5 kt |
| Metal Bank Ltd | MBK | Seven Leaders | WA | Indicated, Inferred | 138,000 t @ 1.4 g/t Au | Gold – 0.19 t (6 koz) |
| Mount Ridley Mines Ltd | MRD | Winston (Mount Ridley) | WA | Inferred | 372.2 Mt @ 30.3 ppm Ga | Gallium – 11.28 kt |
| Mount Ridley Mines Ltd | MRD | Keith (Mount Ridley) | WA | Inferred | 164.1 Mt @ 29.8 ppm Ga | Gallium – 4.89 kt |
| Mount Ridley Mines Ltd | MRD | Mia (Mount Ridley) | WA | Inferred | 302.5 Mt @ 27.8 ppm Ga | Gallium – 8.41 kt |
| Neometals Ltd | NMT | Ironclad | WA | Inferred | 250,000 t @ 1.6 g/t Au | Gold – 0.4 t (13 koz) |
| Nimy Resources Ltd | NIM | Mons | WA | Inferred | 7.23 Mt @ 102 ppm Ga2O3, 538 ppm TREO | Gallium – 548.6 t TREO – 3.9 kt |
| Northern Star Resources Ltd | NST | Hercules | WA | Probable, Indicated, Inferred | 13.38 Mt @ 2.1 g/t Au | Gold – 28.69 t (922 koz) |
| Pacgold Ltd | PGO | Central Zone (Alice River) | QLD | Indicated, Inferred | 14.3 Mt @ 1.03 g/t Au | Gold – 14.6 t (469 koz) |
| Pacgold Ltd | PGO | Southern Zone (Alice River) | QLD | Indicated, Inferred | 11.1 Mt @ 0.89 g/t Au | Gold – 9.91 t (318 koz) |
| Pacgold Ltd | PGO | Northern Zone (Alice River) | QLD | Indicated, Inferred | 1.4 Mt @ 1.49 g/t Au | Gold – 2.12 t (68 koz) |
| Panther Metals Ltd | PNT | Burtville East | WA | Indicated, Inferred | 62,300 t @ 4.24 g/t Au | Gold – 0.31 t (10 koz) |
| PLC Resources Ltd | PLC | Wadgingarra | WA | Inferred | 150,000 t @ 2.7 g/t Au | Gold – 0.41 t (13 koz) |
| Redcastle Resources Ltd | RC1 | Redcastle Reef | WA | Indicated, Inferred | 224,000 t @ 1.8 g/t Au | Gold – 0.41 t (13 koz) |
| Rimfire Pacific Mining Ltd | RIM | Currajong | NSW | Inferred | 15.1 Mt @ 137 ppm Sc | Scandium – 2.07 kt |
| Rincon Resources Ltd | RCR | Hasties | WA | Indicated, Inferred | 870,000 t @ 0.96 g/t Au, 0.26% Cu | Gold – 0.83 t (27 koz) Copper – 2.3 kt |
| Tartana Minerals Ltd | TAT | Cardross | QLD | Inferred | 50.4 Mt @ 0.31 g/t Au | Gold – 15.62 t (502 koz) |
| Tennant Minerals Ltd | TMS | Bluebird | NT | Indicated, Inferred | 1.58 Mt @ 1.3% Cu, 1.04 g/t Au, 2.67 g/t Ag, 839 g/t Bi | Copper – 20.5 kt Gold – 1.64 t (53 koz) Silver – 4.2 t (135 koz) Bismuth – 1.33 kt |
| Terra Metals Ltd | TM1 | Dante | WA | Indicated, Inferred | 148 Mt @ 14.8% TiO2, 0.54% V2O5, 0.18% Cu, 0.33 g/t 3E PGE | TiO2 – 21.8 Mt Vanadium – 445 kt Copper – 263 kt Gold – 12.68 t PGE – 37.4 t |
| Tungsten Mining NL | TGN | Hit or Miss (Hatches Creek) | NT | Inferred | 7.6 Mt @ 0.17% WO3, 0.12% Cu and 4.6 Mt @ 0.31% Cu | Tungsten – 10.25 kt Copper – 23.4 kt |
| Tungsten Mining NL | TGN | Treasure (Hatches Creek) | NT | Inferred | 1.4 Mt @ 0.17% WO3, 0.08% Cu and 0.41 Mt @ 0.17% Cu | Tungsten – 1.89 kt Copper – 9.5 kt |
| Tungsten Mining NL | TGN | Green Diamond (Hatches Creek) | NT | Inferred | 1.8 Mt @ 0.18% WO3, 0.18% Cu and 1.1 Mt @ 0.3% Cu | Tungsten – 2.57 kt Copper – 6.5 kt |
| Tungsten Mining NL | TGN | Black Diamond (Hatches Creek) | NT | Inferred | 550,000 t @ 0.17% WO3, 0.03% Cu | Tungsten – 741.4 t Copper – 200 t |
| Tungsten Mining NL | TGN | Bonanza (Hatches Creek) | NT | Inferred | 690,000 t @ 0.16 WO3, 0.01% Cu | Tungsten – 875.4 t Copper – 100 t |
| West Cobar Metals Ltd | WC1 | Bulla Park | NSW | Inferred | 19.7 Mt @ 0.3% Cu, 0.1% Sb, 4.7 g/t Ag | Antimony – 19.7 kt Copper – 59.1 kt Silver – 92.6 t (3 Moz) |
| Western Mines Group Ltd | WMG | Mulga Tank | WA | Indicated, Inferred | 1,968 Mt @ 0.27% Ni, 131 ppm Co, 82 ppm Cu, 17 ppb Pt+Pd | Nickel – 5.37 Mt Cobalt – 256.7 kt Copper – 161.2 kt PGE – 34.02 t (1 Moz) |
| Westgold Resources Ltd | WGX | Fletcher Zone | WA | Indicated, Inferred | 31 Mt @ 2.3 g/t Au | Gold – 71.3 t (2.3 Moz) |
| Maiden Commodity (within an Existing Deposit) | ||||||
| Larvotto Resources Ltd | LRV | Clarks Gully (Hillgrove) | NSW | Measured, Indicated, Inferred | 647,000 t @ 0.05% WO3 | Tungsten – 0.27 kt |
| Larvotto Resources Ltd | LRV | Garibaldi (Hillgrove) | NSW | Indicated, Inferred | 2.708 Mt @ 0.01% WO3 | Tungsten – 0.21 kt |
| Rumble Resources Ltd | RTR | Western Queen | WA | Inferred | 4.31 Mt @ 0.31% WO3 | Tungsten – 10.41 kt |
| Victory Metals Ltd | VTM | North Stanmore | WA | Indicated, Inferred | 247.5 Mt @ 26 ppm Ga2O3 | Gallium – 4.75 kt |
| Warriedar Resources Ltd | WA8 | Ricciardo | WA | Indicated, Inferred | 12.2 Mt @ 0.5% Sb | Antimony – 59.99 kt |
Table 2. Contained resources in maiden resource announcements by commodity in 2025. The resource data has been sourced from company reports on the ASX (or equivalent). Percentage increases are based on data from Australia's Identified Mineral Resources as of December 2024.29
| Commodity | Maiden EDR1 | Percentage Increase to Australian EDR | Maiden Inferred Resources | Percentage increase to Australian Inferred Resources |
|---|---|---|---|---|
| Antimony | 20.82 kt | 17% | 64.85 kt | 73% |
| Bismuth | 0.88 kt | 20% | 0.44 kt | 8% |
| Cobalt | 75.71 kt | 4% | 180.99 kt | 15% |
| Copper | 0.16 Mt | <1% | 0.419 Mt | <1% |
| Gallium | 3.42 kt | n.a. | 26.46 kt | 413% |
| Gold | 110 t | <1% | 203.04 t | 3% |
| Heavy Mineral Sands | 12.3 Mt | n.a. | 11.22 Mt | n.a. |
| High-purity Silica | 0 Mt | 0% | 6.08 Mt | 38% |
| Indium | 0.33 kt | 316% | 0.25 kt | 13,026% |
| Iron | 0 Mt | 0% | 13.63 Mt | <1% |
| Lead | 0.22 Mt | <1% | 0.14 Mt | <1% |
| Lithium | 0 kt | 0% | 38.09 kt | <1% |
| Nickel | 1.58 Mt | 6% | 3.79 Mt | 21% |
| Niobium | 0 kt | 0% | 417.14 kt | 21% |
| PGE | 31.07 t | 6% | 40.35 t | 7% |
| Phosphate | 0 Mt | 0% | 4.36 Mt | 1% |
| Titanium Dioxide | 44.21 Mt | n.a. | 90.35 Mt | n.a. |
| Scandium | 0 kt | 0% | 2.07 kt | 5% |
| Silver | 1.074 kt | 1% | 0.89 kt | 2% |
| Tin | 0 kt | 0% | 19.7 kt | 6% |
| TREO | 0 Mt | 0% | 3.22 Mt | 10% |
| Tungsten | 0.38 kt | <1% | 26.83 kt | 14% |
| Uranium | 0.39 kt | <1% | 5.01 kt | <1% |
| Vanadium | 155.34 kt | 2% | 289.52 kt | 1% |
| Zinc | 0.28 Mt | <1% | 0.21 Mt | <1% |
Notes
- EDR – Economic Demonstrated Resources.
25 Committee for Mineral Reserves International Reporting Standards, 2026. Promoting international best practicing in the reporting of Mineral Exploration, Mineral Resources and Mineral Reserves.
26 Joint Ore Reserves Committee of The Australasian Institute of Mining and Metallurgy, Australian Institute of Geoscientists and Minerals Council of Australia, 2012. Australasian Code for Reporting of Exploration Results, Mineral Resources and Ore Reserves (The JORC Code).
27 Hughes, A., Britt, A., Pheeney, J., Kucka, C., Morfiadakis, A., Munns, C., Boyd, J., Senior, A., Cross, A., Thorne, J., 2026. Australia’s Identified Mineral Resources 2025. Commonwealth of Australia (Geoscience Australia).
28 Cassard D., Bertrand G., Billa M., Serrano J.J., TourliËre B., Angel J.M. & Gaal C. 2015. ProMine Mineral Databases: New Tools to Assess Primary and Secondary Mineral Resources in Europe. In: Weihed P. (eds) 3D, 4D and predictive modelling of major mineral belts in Europe. Mineral Resource Reviews. Society for Geology Applied to Mineral Deposits, Genève, 9-58..
29 Hughes et al., 2026. Australia’s Identified Mineral Resources 2025.