Australian Mineral Exploration Review 2025 Significant drill results – critical minerals
Page last updated:3 August 2026
Exploration drill results are an important indicator of the mineral potential of a project and, together with other geological and technical information, can confirm a new discovery, demonstrate the size and grade potential of a mineral deposit, or extend an existing resource.
This section focuses on critical minerals, which are minerals or elements essential to modern technologies, economies or national security and that have supply chains at risk of disruption. Critical mineral lists vary between countries because they reflect different industrial needs and strategic assessments of supply risk, and they can change over time as market and geopolitical conditions evolve. The Australian Government currently considers 31 commodities to be critical minerals30, of which Australia has reported mineral resources for 27 (Figure 1).
The following tables (Tables 3 to 7) and maps (Figures 5 to 9) present a selection of publicly reported significant drill results from exploration programs undertaken across Australia in 2025, grouped by commodity. Because some commodities commonly occur together within the same mineral systems, certain drill intercepts may be included in more than one map and table. Within each table, significant drill results are organised by the stage of exploration of the project and listed alphabetically.
Additional information for each significant drill result is available in downloadable tables, with the tables in this publication a subset of the information provided.

A smartphone is an example of the importance of critical minerals in everyday life, combining more than 30 different minerals to enable the battery to hold power, connectivity and performance, and to ensure the touch screen works. Continuing exploration for critical minerals, as well as increasing processing capacity in Australia, is vital for securing reliable critical mineral supply chains that will support future technologies and economic resilience. Image courtesy of Geoscience Australia Creative Production Team.
Antimony

*Data from Australian Bureau of Statistics, Mineral and Petroleum Exploration Australia (December 2025), Antimony is included in the ‘other minerals’ category. # Data from Geoscience Australia, Australian Critical Minerals Map 2025 (see Appendix B).
Antimony is a critical mineral that is essential for energy, defence and advanced manufacturing applications. The element’s traditional uses include flame retardants and lead‑acid batteries; however, antimony use in these products is declining due to material substitution, modern alloying practices and the shift to lithium-ion batteries. In addition, increasing recycling rates of antimony are meeting most of the metallurgical demand (e.g. lead-acid batteries). Despite these trends, there is renewed demand for antimony supply largely due to non-metallurgical, technology-driven uses. Antimony use in solar photovoltaic glass has expanded rapidly, and it continues to play an important role in electronics and certain semiconductor applications.
In 2024, Australia supplied around 1% of global antimony, ranking seventh globally31. Australia is well-positioned to expand its role in diversified global antimony supply chains, supported by a strong resource base, established mining and processing capability and a stable, transparent operating environment. As of January 2026, Australia hosts a pipeline of 26 antimony projects across exploration, development and production stages, providing a robust pipeline for future supply growth32.
Selected significant drill results containing antimony from 2025 are shown in Figure 5 and listed in Table 3. The drill results are concentrated in Victoria and Western Australia with additional results from Queensland, New South Wales and Tasmania (Figure 5). Most significant drill results are from projects in the early stage of exploration which do not yet have a published Mineral Resource. Two intercepts are from projects at the resource expansion stage and one from the resource upgrade stage (Table 3).
Antimony, along with gallium and REE, are an initial focus of the Australian Government’s Critical Minerals Strategic Reserve, which is being led out of the Department of Industry, Science and Resources33. The reserve, which will become operational in the second half of 2026, will safeguard an allocation of these critical minerals to secure supply for Australia and key international partners.
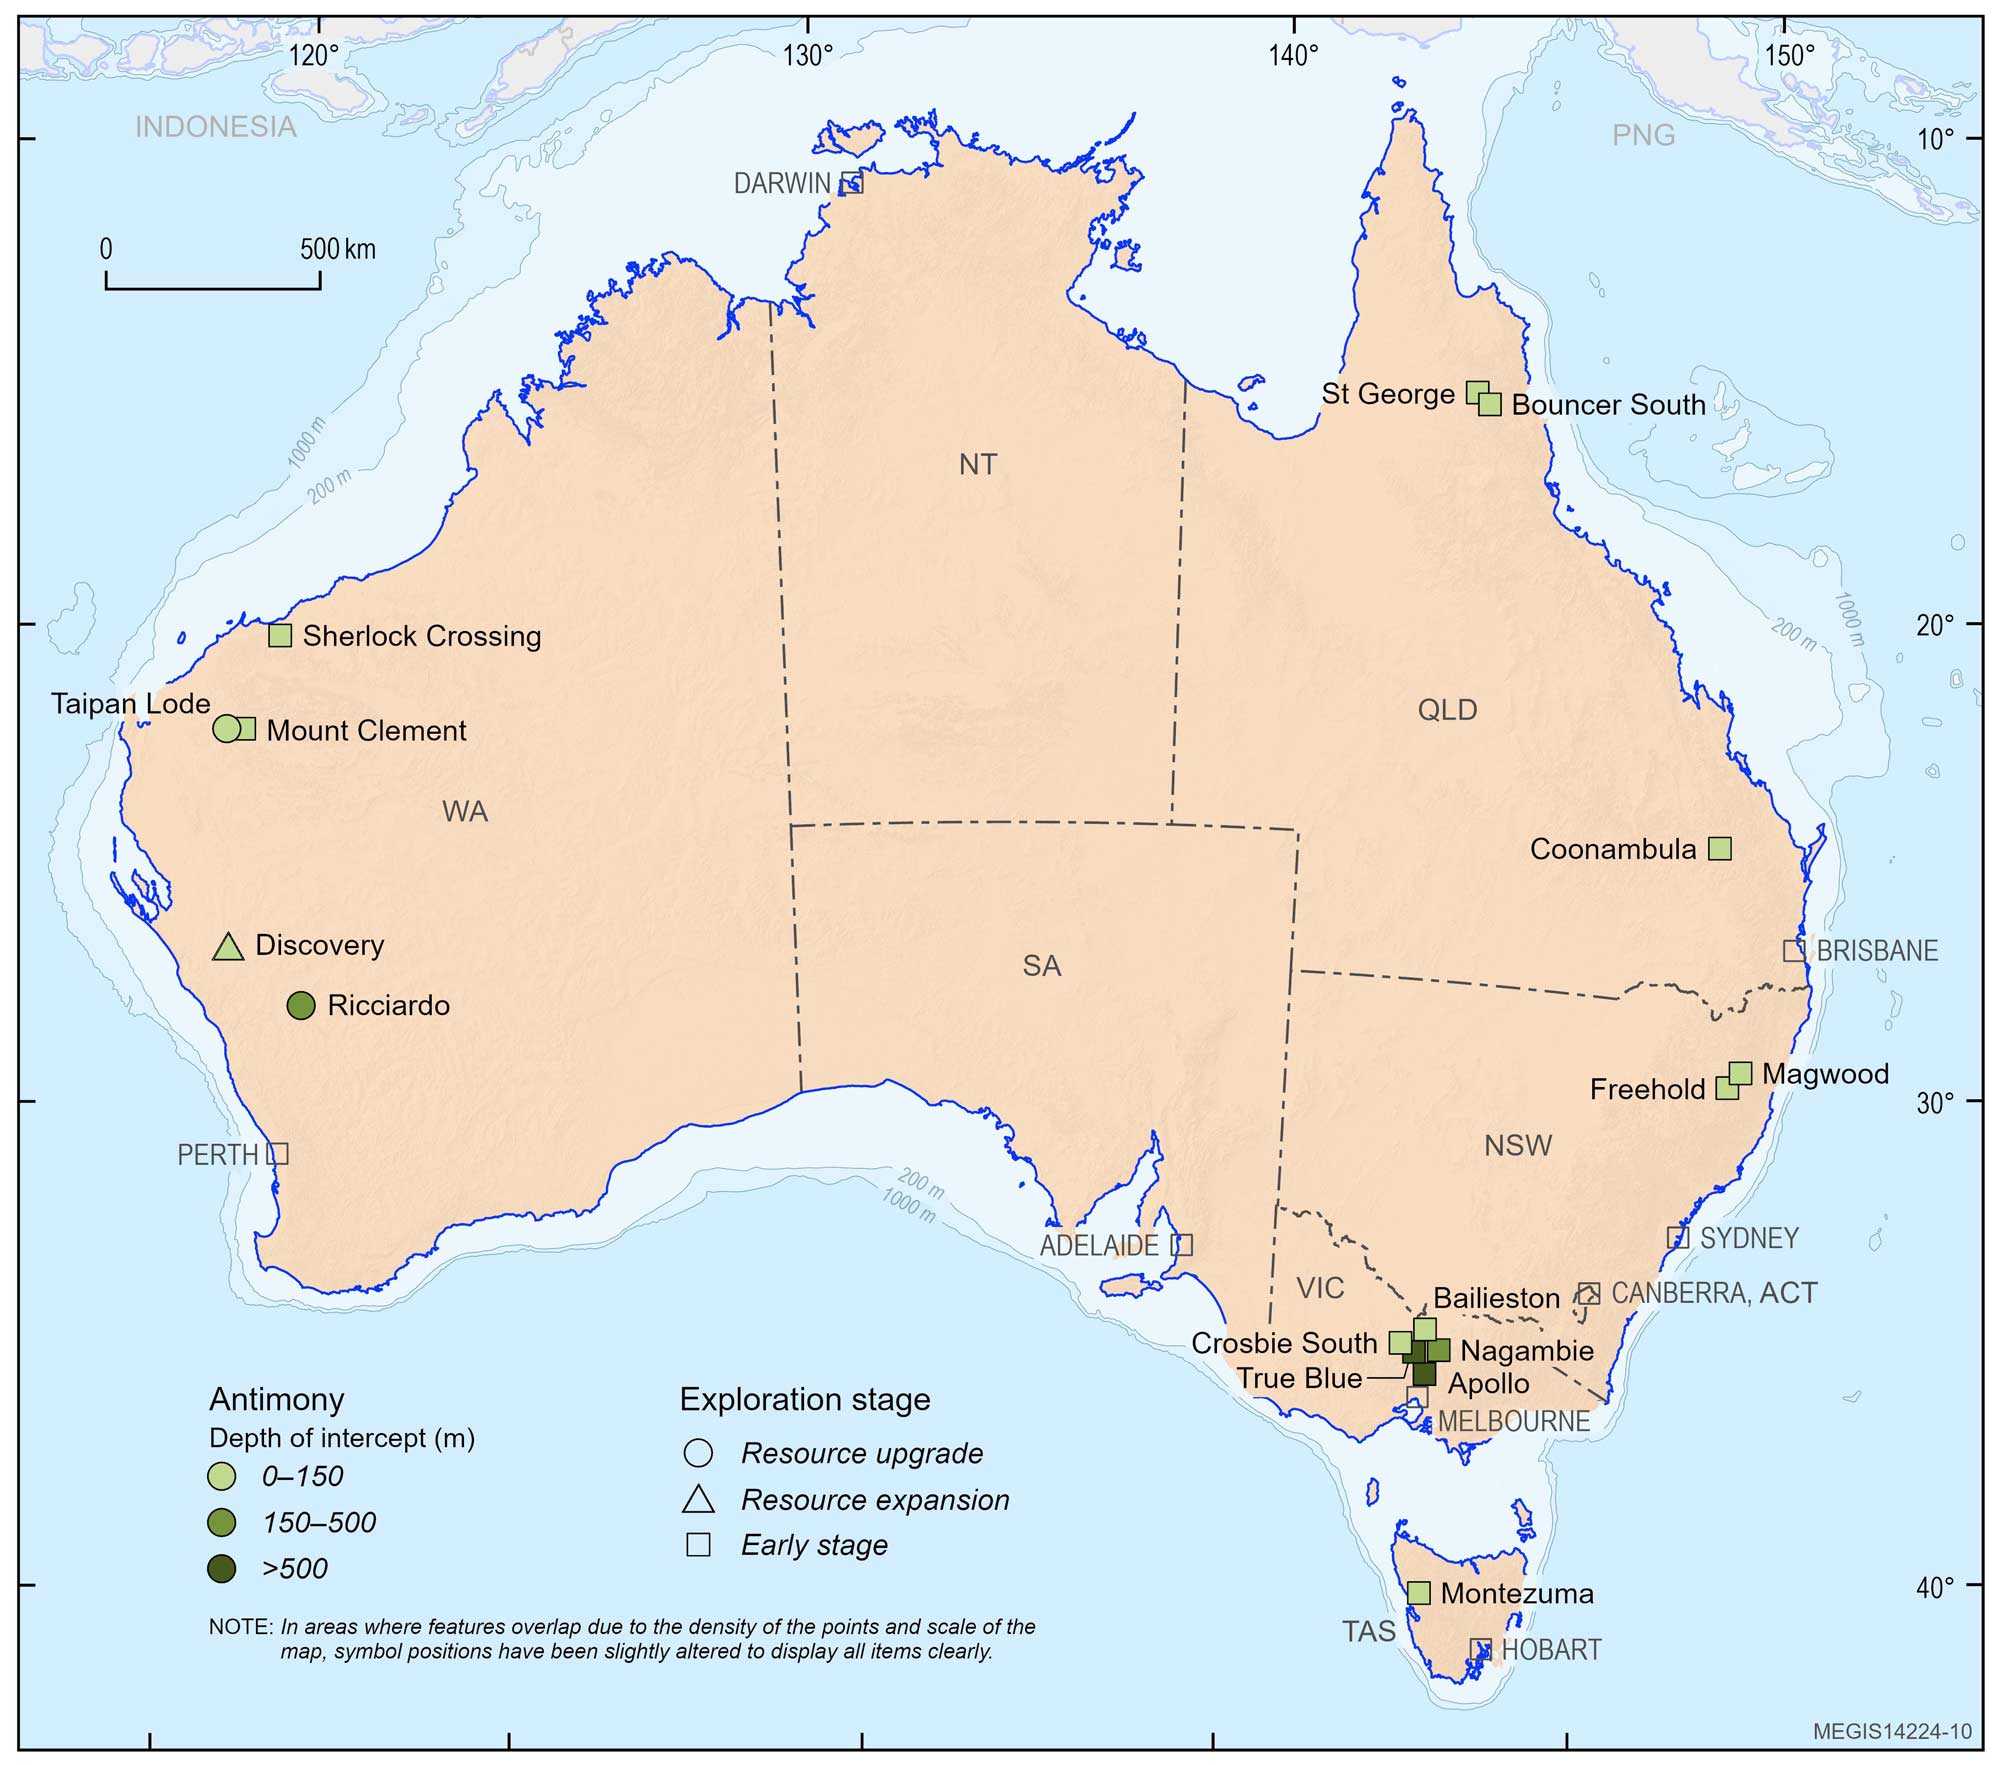
Figure 5. Location of significant drill results containing antimony reported through the ASX (or equivalent) in 2025. Significant drill results are classified by exploration stage: Early stage refers to first-pass or follow-up drilling without a Mineral Resource estimate; Resource expansion refers to step-out or extensional drilling with a Mineral Resource estimate; and Resource upgrade includes infill drilling with a Mineral Resource estimate.
Table 3. Significant drill results containing antimony reported through the ASX (or equivalent) in 2025. Company tickers are for the ASX unless otherwise stated.
| Company | Company Ticker | Deposit or Prospect | State | Intercept |
|---|---|---|---|---|
| Early-stage exploration drilling | ||||
| Bubalus Resources Ltd | BUS | Crosbie South | VIC | 6.6 m at 0.4 g/t Au, 1,839 ppm Sb from 40.6 m |
| Dart Mining NL | DTM | Coonambula | QLD | 5 m at 4.33% Sb, 1.69 g/t Au, 23.65 g/t Ag from 41.5 m |
| ECR Minerals plc | ECR (LSE) | Bailieston | VIC | 0.2 m at 3.86 g/t Au, 1.41% Sb from 133.5 m |
| Larvotto Resources Ltd | LRV | Freehold | NSW | 14 m at 1.22 g/t Au, 0.73% Sb, 0.01% WO3 from 89 m |
| Lode Resources Ltd | LDR | Magwood | NSW | 4.8 m at 9.92% Sb from 81.5 m |
| Lode Resources Ltd | LDR | Montezuma | TAS | 8.6 m at 5.02% Sb, 738 g/t Ag, 0.7 g/t Au, 7.28% Pb, 0.32% Cu, 0.16% Sn from surface |
| Mandalay Resources Corp | MND (TSX) | True Blue | VIC | 0.33 m at 578.0 g/t Au, 20.5% Sb from 525.01 m |
| Marquee Resources Ltd | MQR | Mount Clement | WA | 8 m at 1.05% Sb, 2.85% Pb from 137 m |
| Nagambie Resources Ltd | NAG | Nagambie | VIC | 7.3 m at 1.74 g/t Au, 6.19% Sb from 154 m |
| Novo Resources Corp | NVO (TSX) | Sherlock Crossing | WA | 3 m at 2.96 g/t Au, 1.86% Sb from 108 m |
| Pacgold Ltd | PGO | St George | QLD | 8 m at 2.3% Sb, 0.4 g/t Au from 16 m |
| Rokeby Resources Ltd | RKB | Bouncer South | QLD | 4 m at 0.57% Sb from 11 m |
| Southern Cross Gold Consolidated Ltd | SX2 | Apollo (Sunday Creek) | VIC | 100.5 m at 3.1 g/t Au, 0.1% Sb from 820.8 m |
| Resource expansion drilling | ||||
| Octava Minerals Ltd | OCT | Discovery | WA | 10 m at 1.11% Sb from 12 m |
| Resource upgrade drilling | ||||
| Black Cat Syndicate Ltd | BC8 | Taipan Lode | WA | 12.45 m at 1.15% Sb, 1.51% Pb, 16.1 g/t Ag from 80 m |
| Warriedar Resources Ltd | WA8 | Ricciardo | WA | 32 m at 4.64 g/t Au, 0.33% Sb from 170 m |
Battery commodities – lithium, nickel, cobalt, manganese and graphite

*Data from Australian Bureau of Statistics, Mineral and Petroleum Exploration Australia (December 2025). Data are combined ‘cobalt-nickel’ and ‘other minerals’ categories. # Data from Geoscience Australia, Australian Critical Minerals Map 2025 (see Appendix B).
Battery metals, such as lithium, nickel, cobalt, manganese and graphite, are a group of metals that are essential to the manufacture of rechargeable batteries, including those used to power EVs and store renewable energy. The demand for these metals is driven largely by the rapid growth in manufacturing lithium-ion batteries as well as the industries that require them34.
Beyond batteries, each metal has broader industrial uses: lithium in glass, ceramics and alloys; nickel in stainless steel and high-performance alloys; cobalt in superalloys and industrial applications; and graphite in refractories, lubricants and battery anodes35. As electrification accelerates, demand for these commodities is expected to remain strong.
Australia is a global powerhouse for battery metals, containing some of the world's largest hard-rock lithium deposits and vast resources of nickel, cobalt and graphite. Australia has 28% of the world’s lithium resources, 19% of nickel, 16% of cobalt, 7% of graphite and 9% of manganese36. Despite the vast resources of these commodities, extraction and processing capabilities in Australia are still emerging. There are currently no graphite mines operating in Australia, although there are two in development and an operating processing facility in Queensland37. Lithium has a strong mining sector with 6 operating mines and one developing mine, while there are only a small number of operating mining projects extracting nickel (3), cobalt (1) and manganese ore (2)38.
The majority of significant drilling results reported for battery commodities have occurred in Western Australia; these include nickel, lithium and manganese (Figure 6). Single significant drill results also occurred in the Northern Territory (graphite), Queensland (cobalt), New South Wales (nickel) and Victoria (lithium). Table 4 shows the polymetallic nature of the mineralisation that often hosts battery commodities.
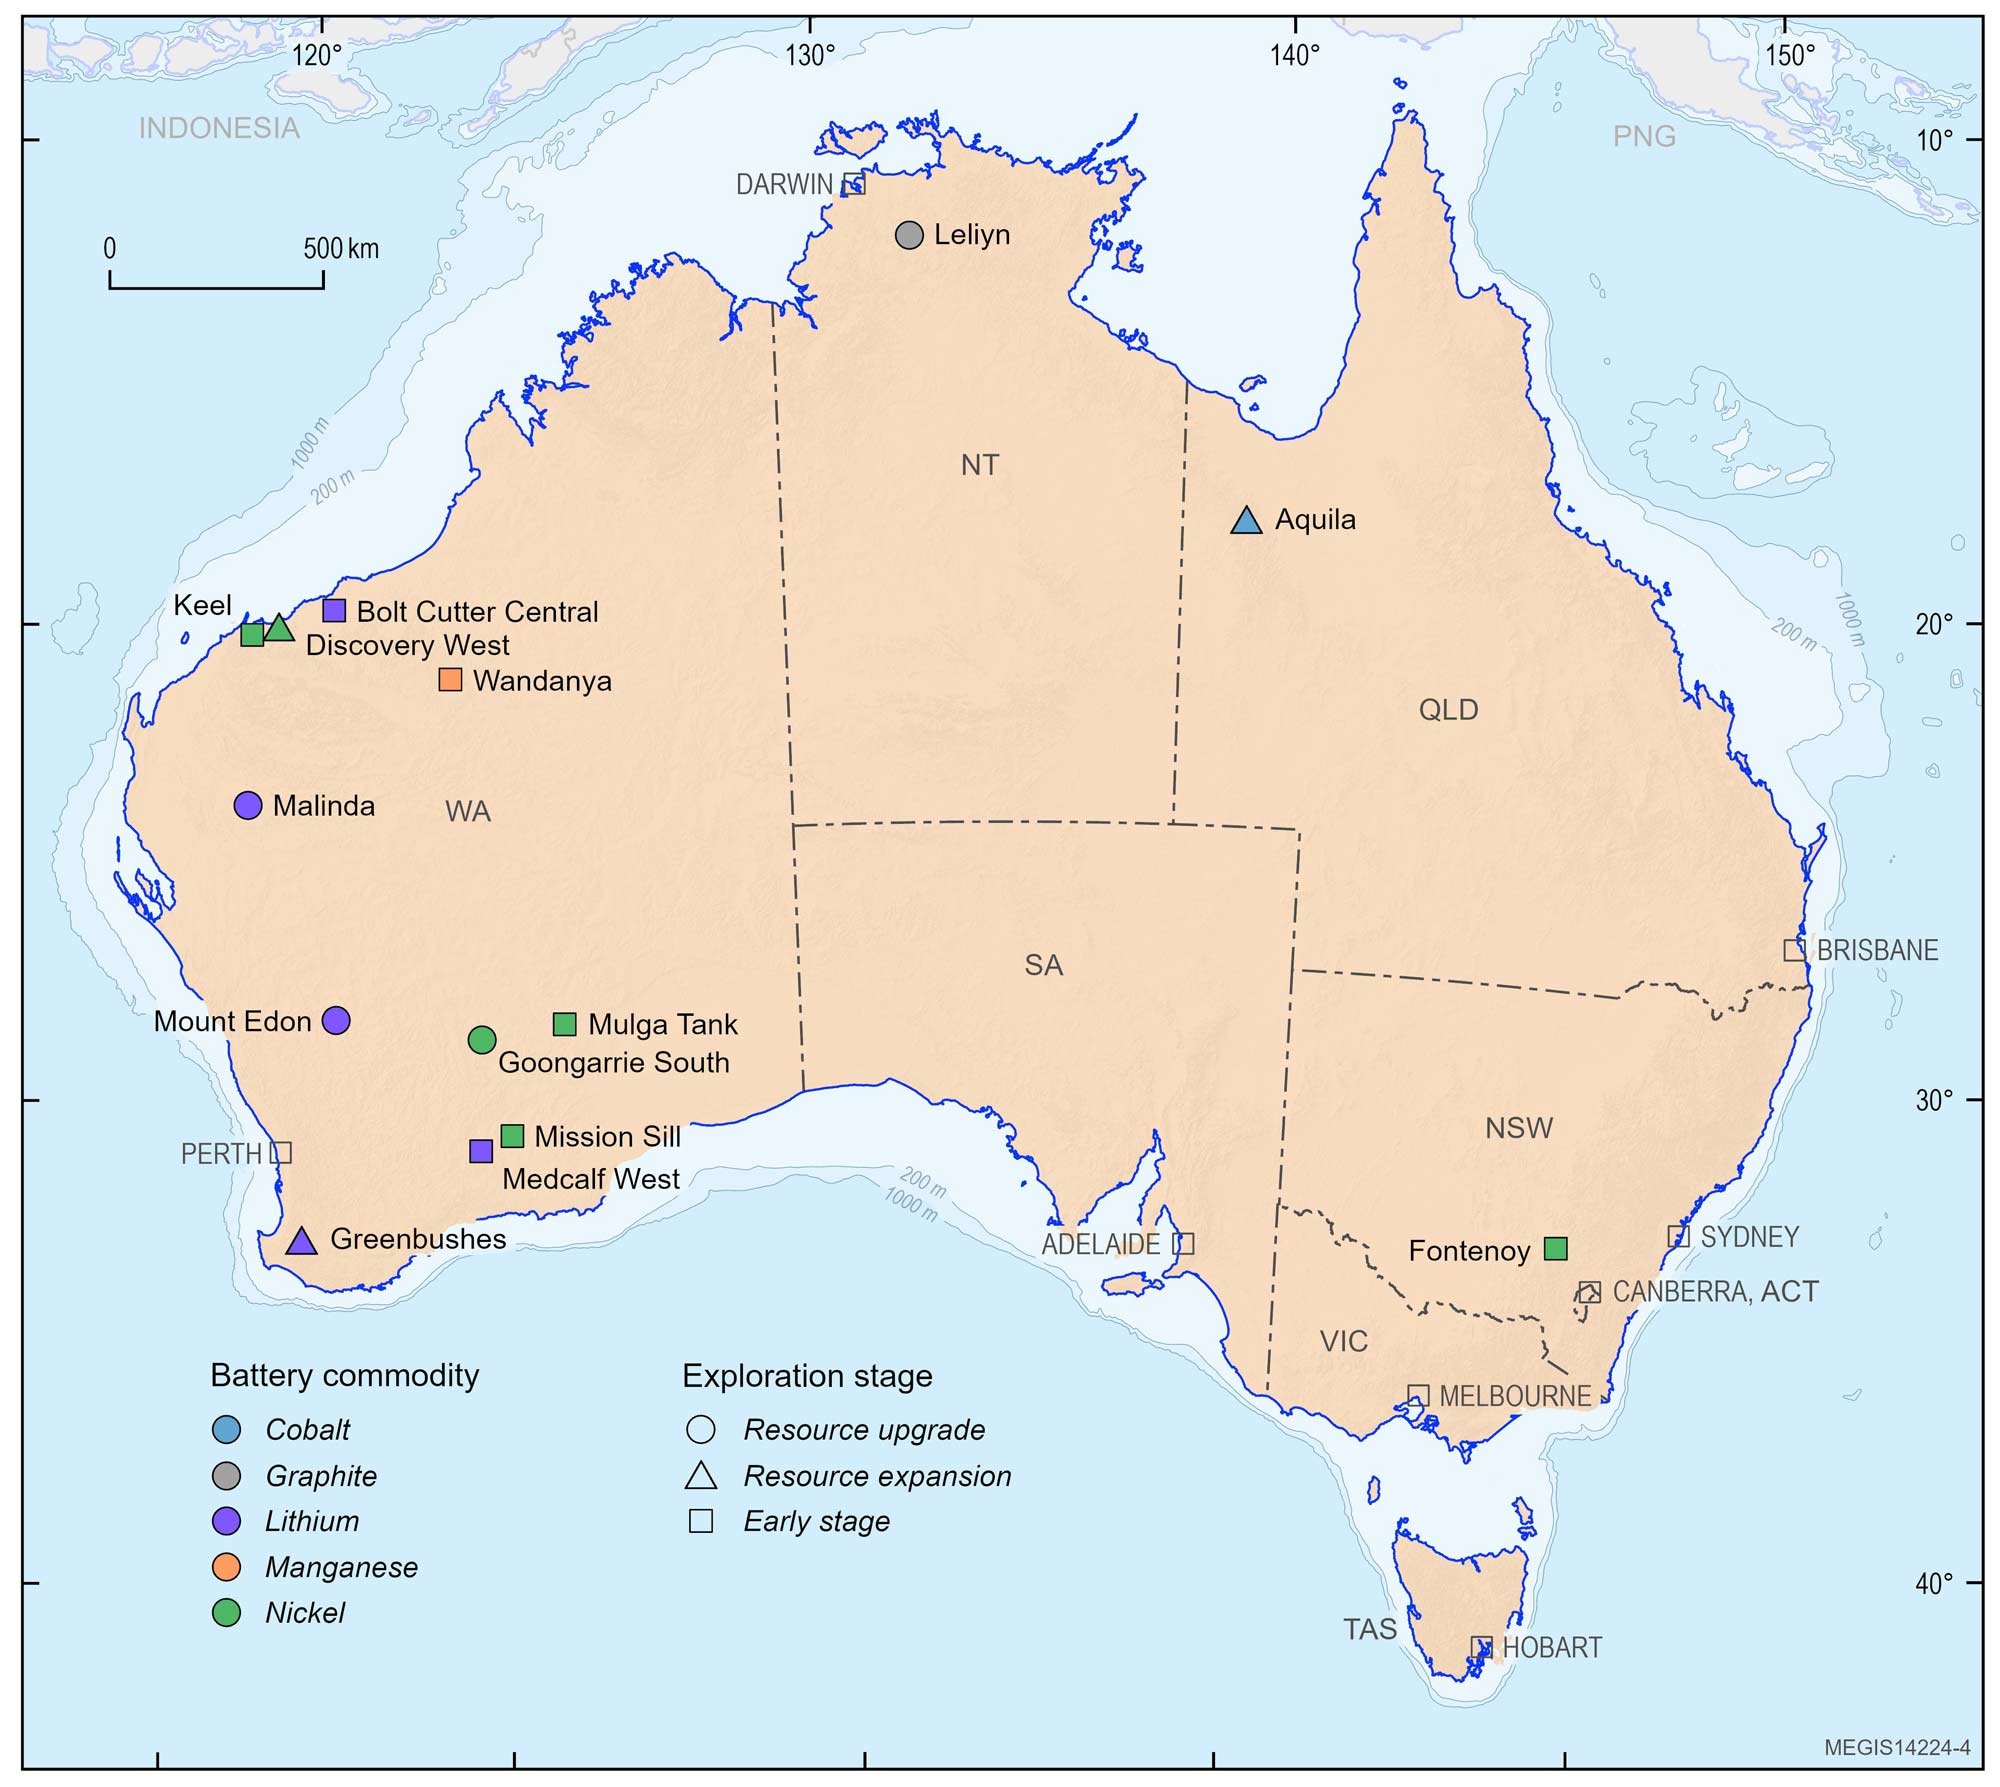
Figure 6. Location of significant drill results containing battery commodities—lithium, nickel, cobalt, manganese and graphite—reported through the ASX (or equivalent) in 2025. Significant drill results are classified by exploration stage: Early stage refers to first-pass or follow-up drilling without a Mineral Resource estimate; Resource expansion refers to step-out or extensional drilling with a Mineral Resource estimate; and Resource upgrade includes infill drilling with a Mineral Resource estimate.
Table 4. Significant drill results containing battery commodities reported through the ASX (or equivalent) in 2025. Company tickers are for the ASX unless otherwise stated.
| Company | Company Ticker | Deposit or Prospect | State | Intercept |
|---|---|---|---|---|
| Early-stage exploration drilling | ||||
| Black Canyon Ltd | BCA | Wandanya | WA | 8 m at 42.2% Mn from surface |
| Charger Metals NL | CHR | Medcalf West | WA | 11 m at 1.8% Li2O, 132 ppm Cs, 125 ppm Ta from 111 m |
| Galileo Mining Ltd | GAL | Mission Sill | WA | 52 m at 0.37 g/t Pd, 0.15 g/t Pt, 0.29 g/t Au, 0.16% Ni, 0.08% Cu from surface |
| Legacy Minerals Holdings Ltd | LGM | Fontenoy | NSW | 374.6 m at 0.1 ppm Pd, 90 ppm Co, 1,736 ppm Cr, 1,143 ppm Ni from surface |
| Raiden Resources Ltd | RDN | Keel | WA | 43 m at 0.22% Ni, 0.13% Cu, 136.35 ppm Co, 0.66 g/t Ag from 12 m |
| Western Mines Group Ltd | WMG | Mulga Tank | WA | 1,247 m at 0.32% Ni, 134 ppm Co, 76 ppm Cu, 24 ppb Pt+Pd from 108 m |
| Wildcat Resources Ltd | WC8 | Bolt Cutter Central | WA | 12.8 m at 2.02% Li2O from 45.3 m |
| Resource expansion drilling | ||||
| IGO Ltd | IGO | Greenbushes | WA | 84.35 m at 2.1% Li2O from 556.9 m |
| Sabre Resources Ltd | SBR | Discovery West | WA | 18 m at 0.25% Cu, 0.03 g/t Au, 133 ppm Co, 178 ppm Ni from 6 m |
| True North Copper Ltd | TNC | Aquila | QLD | 59 m at 1.77% Cu, 0.04% Co, 5.2 g/t Ag from 134 m |
| Resource upgrade drilling | ||||
| Ardea Resources Ltd | ARL | Goongarrie South | WA | 34 m at 1.75% Ni, 0.434% Co, 30 ppm Sc from 12 m |
| Delta Lithium Ltd | DLI | Malinda | WA | 22.67 m at 2.16% Li2O, 106 ppm Ta2O5, from 310 m |
| Everest Metals Corporation Ltd | EMC | Mount Edon | WA | 120 m at 0.22% Rb2O, 0.09% Li2O from surface |
| Kingsland Minerals Ltd | KNG | Leliyn | NT | 120 m at 9.2% TGC from surface |
Rare earth elements and niobium

*Data from Australian Bureau of Statistics, Mineral and Petroleum Exploration Australia (December 2025). Data are the combined ‘other minerals’ and ‘mineral sands’ categories. # Data from Geoscience Australia, Australian Critical Minerals Map 2025 (see Appendix B).
Rare earth elements comprise the 15 lanthanides plus yttrium (Figure 1), which shares similar chemical properties. Niobium commonly occurs in the same geological deposits as REE and is grouped with REE in this review. Both commodities are important for advanced technologies, defence and clean energy applications. Scandium is also sometimes grouped with REE because it shares similar chemical properties and sometimes occurs in similar geological settings. However, because scandium is also commonly associated with nickel-cobalt mineral systems, Geoscience Australia assesses it separately from REE (see section 4.5).
Rapid technological advances have resulted in REE growing in importance in many domestic, medical, industrial and strategic applications because of their unique catalytic, metallurgical, electrical, magnetic and luminescent properties. Examples of the many applications for REE are their use in magnets and super magnets, motors, metal alloys, defence technologies, electronic and computing equipment, batteries, catalytic converters, petroleum refining, medical imaging, colouring agents in glass and ceramics, phosphors, lasers and special glass39.
Niobium is combined with iron to form a microalloy for use in the construction and automotive industries. It is also used to make superalloys for use in aerospace and energy industries, magnetic resonance imaging scanners, nuclear magnetic resonance equipment, glass, jewellery, prosthetics and medical implants40.
Australia has a pipeline of more than 100 REE projects at varying stages of exploration, development and operation. In 2024 there was an 18% increase to Australia’s REE resource inventory in 202441, and will again increase in 2025 with the definition of 7 maiden resources (Figure 4) and the 12 significant drill results shown in Figure 7 and Table 5. Most significant drilling results are from early-stage projects with no defined Mineral Resources. Most early-stage exploration projects are in the southern part of South Australia and the projects with defined REE mineral resources are concentrated in Western Australia. This is reflective of exploration in areas with known REE mineralisation in the case of Western Australia42 or extension of the geology with known mineralisation such as in South Australia43.
Rare earth elements, along with gallium and antimony, are an initial focus of the Australian Government’s Critical Minerals Strategic Reserve, which is being led out of the Department of Industry, Science and Resources44. The reserve, which will become operational in the second half of 2026, will safeguard an allocation of these critical minerals to secure supply for Australia and key international partners.
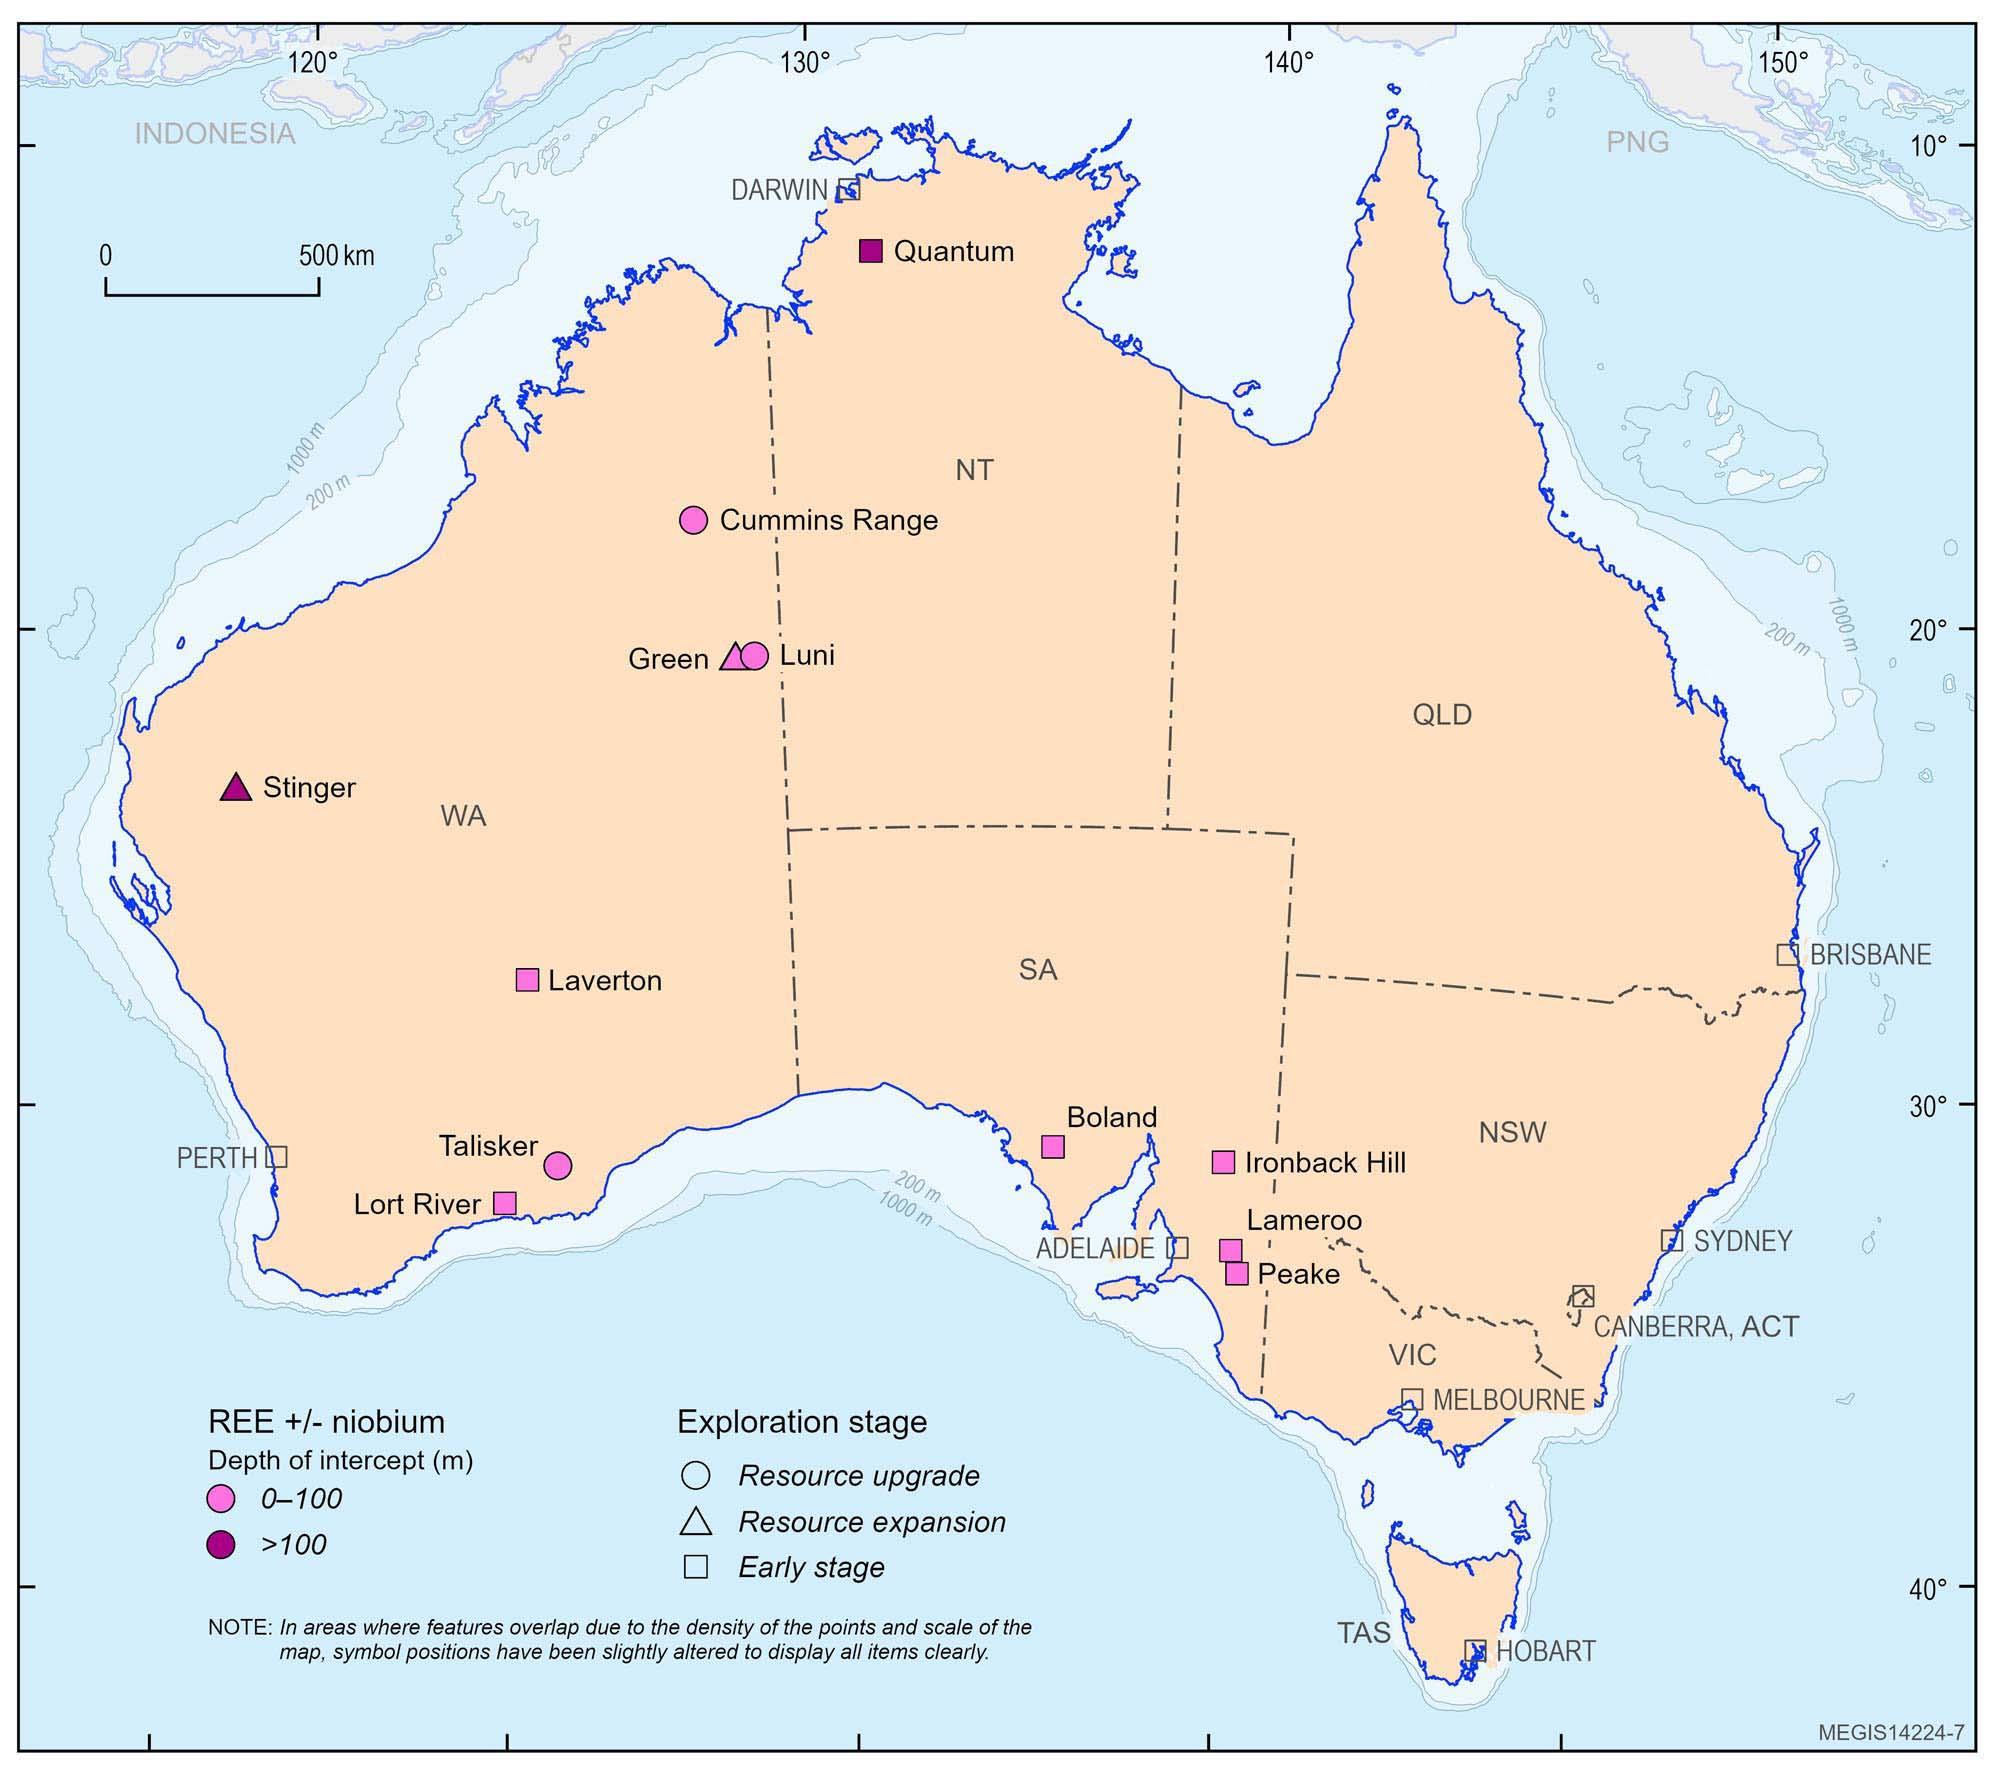
Figure 7. Location of significant drill results containing rare earth elements and niobium reported through the ASX (or equivalent) in 2025. Significant drill results are classified by exploration stage: Early stage refers to first-pass or follow-up drilling without a Mineral Resource estimate; Resource expansion refers to step-out or extensional drilling with a Mineral Resource estimate; and Resource upgrade includes infill drilling with a Mineral Resource estimate.
Table 5. Significant drill results containing rare earth elements and niobium reported through the ASX (or equivalent) in 2025. Company tickers are for the ASX unless otherwise stated.
| Company | Company Ticker | Deposit or Prospect | State | Intercept |
|---|---|---|---|---|
| Early-stage exploration drilling | ||||
| Ausmon Resources Ltd | AOA | Peake | SA | 1 m at 2,192 ppm TREO from 11 m |
| Catalina Resources Ltd | CTN | Laverton | WA | 12 m at 5,828 ppm TREO from 64 m |
| Cobra Resources Plc | COBR (LSE) | Boland | SA | 13 m at 1,735 ppm TREO from 38 m |
| DeSoto Resources Ltd | DES | Quantum | NT | 6.4 m at 1.45% TREO from 399 m |
| Kaili Resources Ltd | KLR | Lameroo | SA | 1 m at 517.02 ppm TREO from 8 m |
| Magnetite Mines Ltd | MGT | Ironback Hill | SA | 24 m at 1,048 ppm TREO from 10 m |
| Terrain Minerals Ltd | TMX | Lort River | WA | 8 m at 4,037 ppm TREO from 23 m |
| Resource expansion drilling | ||||
| Dreadnought Resources Ltd | DRE | Stinger | WA | 140 m at 0.9% TREO, 0.1% Nb2O5 from 307 m |
| Encounter Resources Ltd | ENR | Green | WA | 18 m at 1.28% Nb2O5, 0.49% TREO, 6.6% P2O5 from 45 m |
| Resource upgrade drilling | ||||
| MinRex Resources Ltd | MRR | Talisker | WA | 27 m at 718 ppm TREO from 27 m |
| RareX Ltd | REE | Cummins Range | WA | 115 m at 146.0 g/t Ga2O3, 3.4% TREO, 369.0 g/t Sc2O3, 0.42% Nb2O5, 8% P2O5 from 22 m |
| WA1 Resources Ltd | WA1 | Luni | WA | 67.3 m at 5.4% Nb2O5, 1.43% TREO, 12.6% P2O5 from 70.4 m |
Tungsten

*Data from Australian Bureau of Statistics, Mineral and Petroleum Exploration Australia (December 2025). Tungsten is included in the ‘other minerals’ category. # Data from Geoscience Australia, Australian Critical Minerals Map 2025 (see Appendix B).
Tungsten is a critical mineral essential to defence, advanced manufacturing and high-performance industrial applications. Its exceptional hardness, density and high melting point make it difficult to substitute in cemented carbides, cutting and drilling tools, wear-resistant components, high-temperature alloys and specialised electronics and semiconductor applications45. Demand for tungsten remains closely tied to industrial activity, but supply security has become increasingly important as downstream manufacturers seek reliable and available sources for this important critical mineral.
Geoscience Australia reports that Australia ranks second globally for tungsten resources, with around 15% of the world total, yet supplied only about 1% of global production in 202446. Interest in tungsten exploration is up in 2025, with 8 maiden resources announced (see section 3, Figure 4) compared with none in the previous year47. In addition, there was continued reporting of significant drill results in 2025 including from three early-stage exploration projects (Table 6; Figure 8). Tightening overseas supply, due to export controls48, declining grades and limited new mine development, combined with strong and growing demand from defence, aerospace, EVs, semiconductors and industrial tooling appear to be creating persistent supply‑demand imbalance.
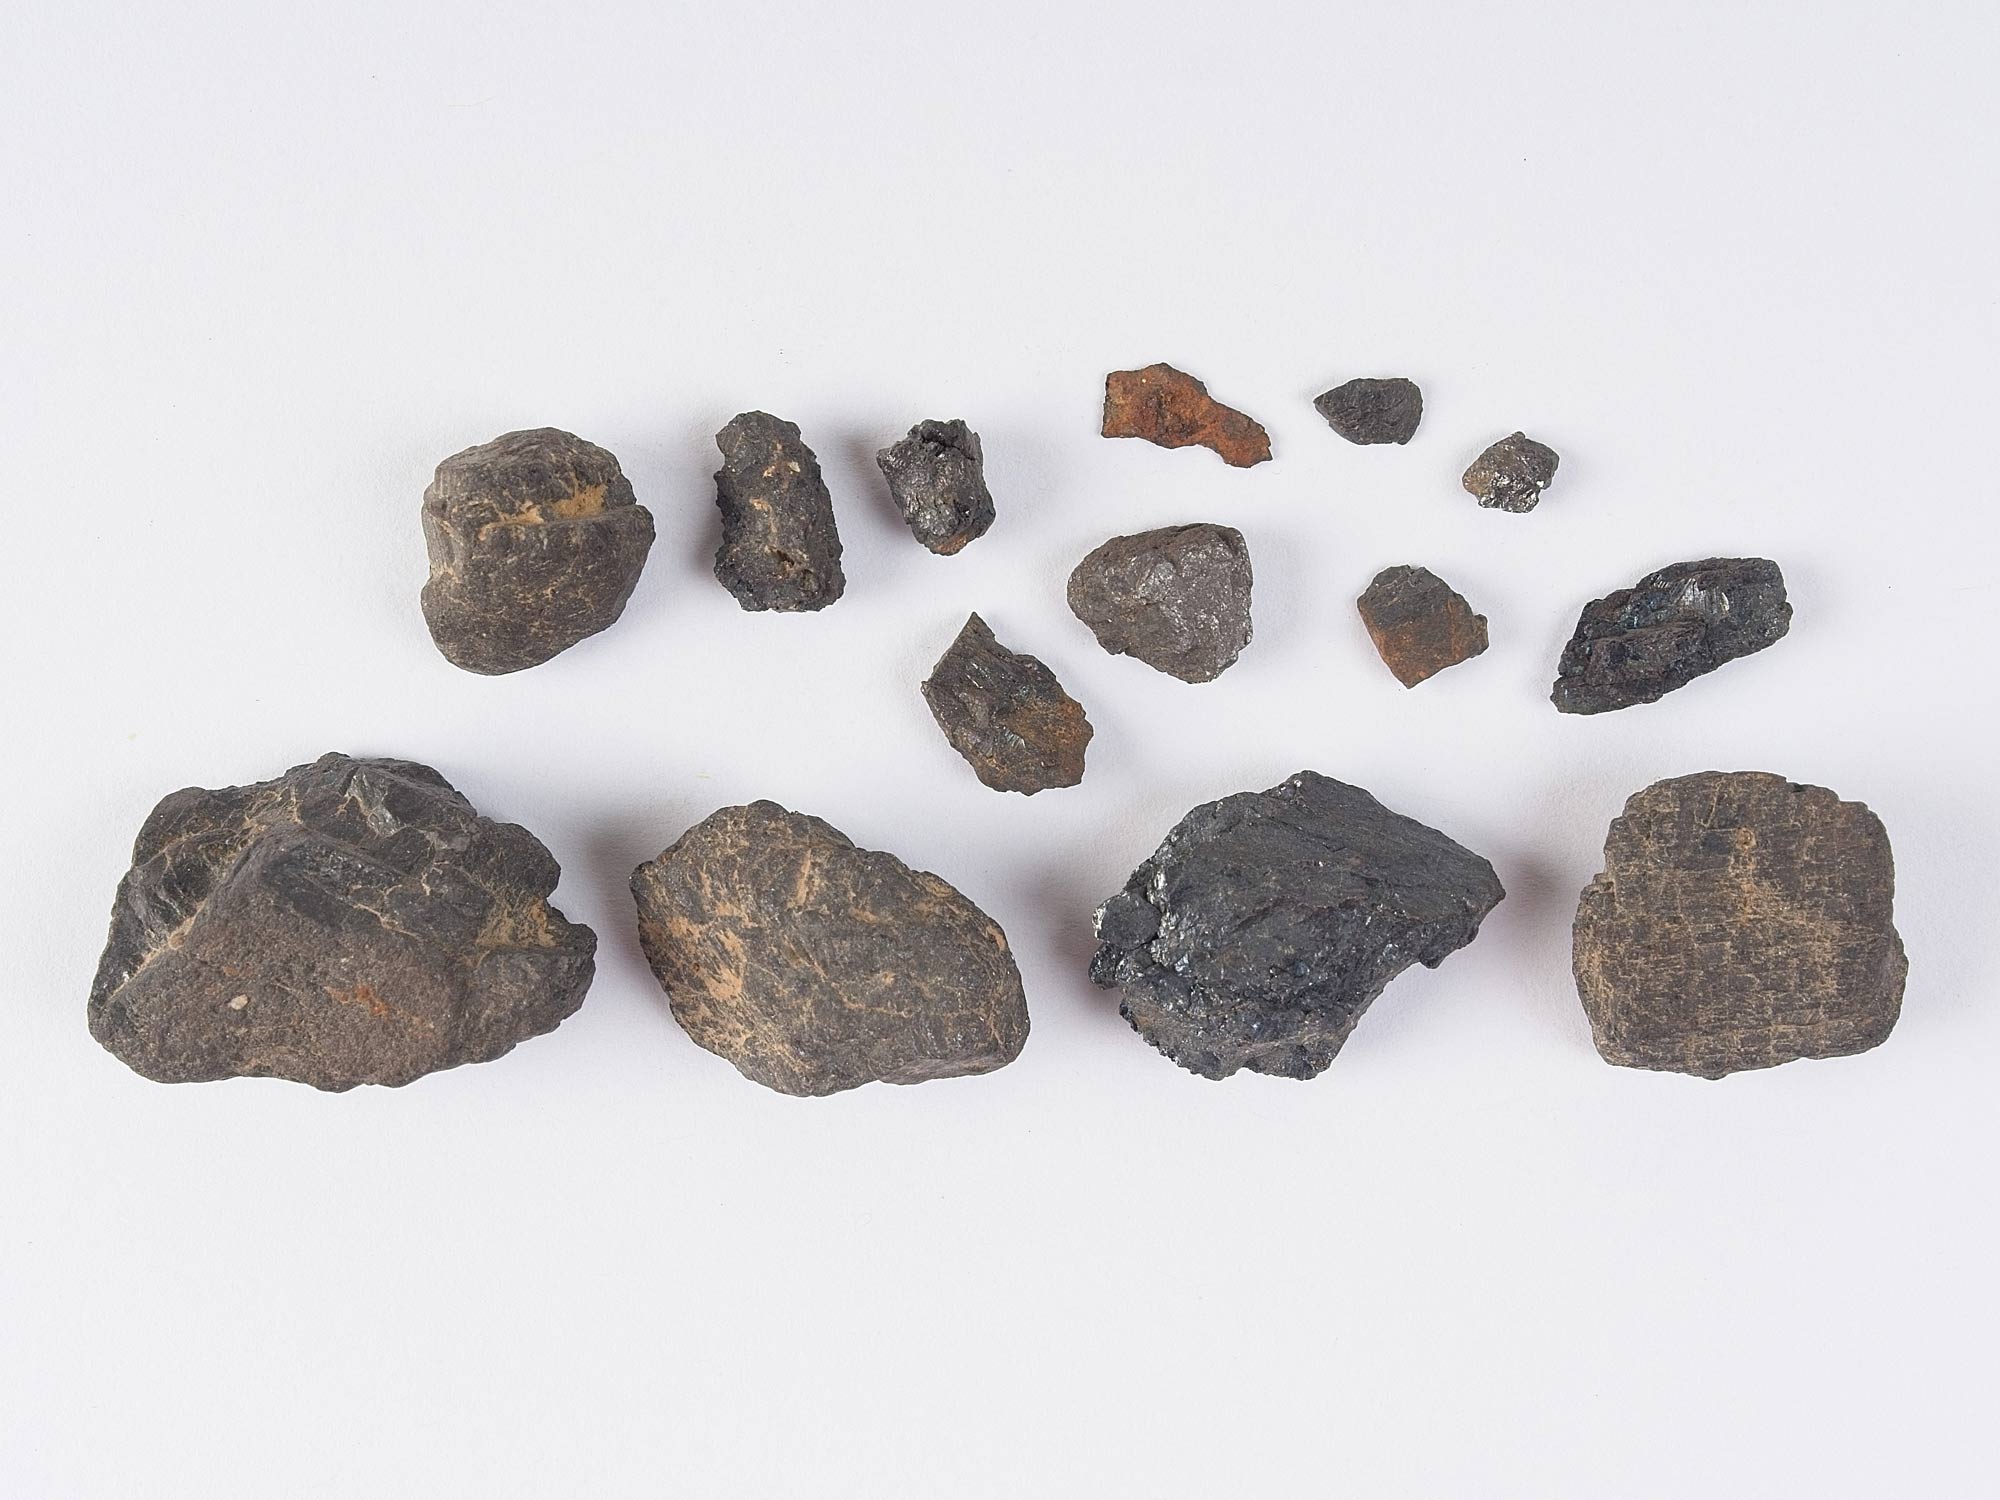
Wolframite, an iron-manganese tungstate mineral, is the primary tungsten ore. The mineral is typically dark grey to black, with magnetic properties. These samples are from the Torrington Region, New South Wales, where tungsten mining has occurred for over a century. The lowermost sample is approximately 3 cm long. Image courtesy of Geoscience Australia National Mineral and Fossil Collection.
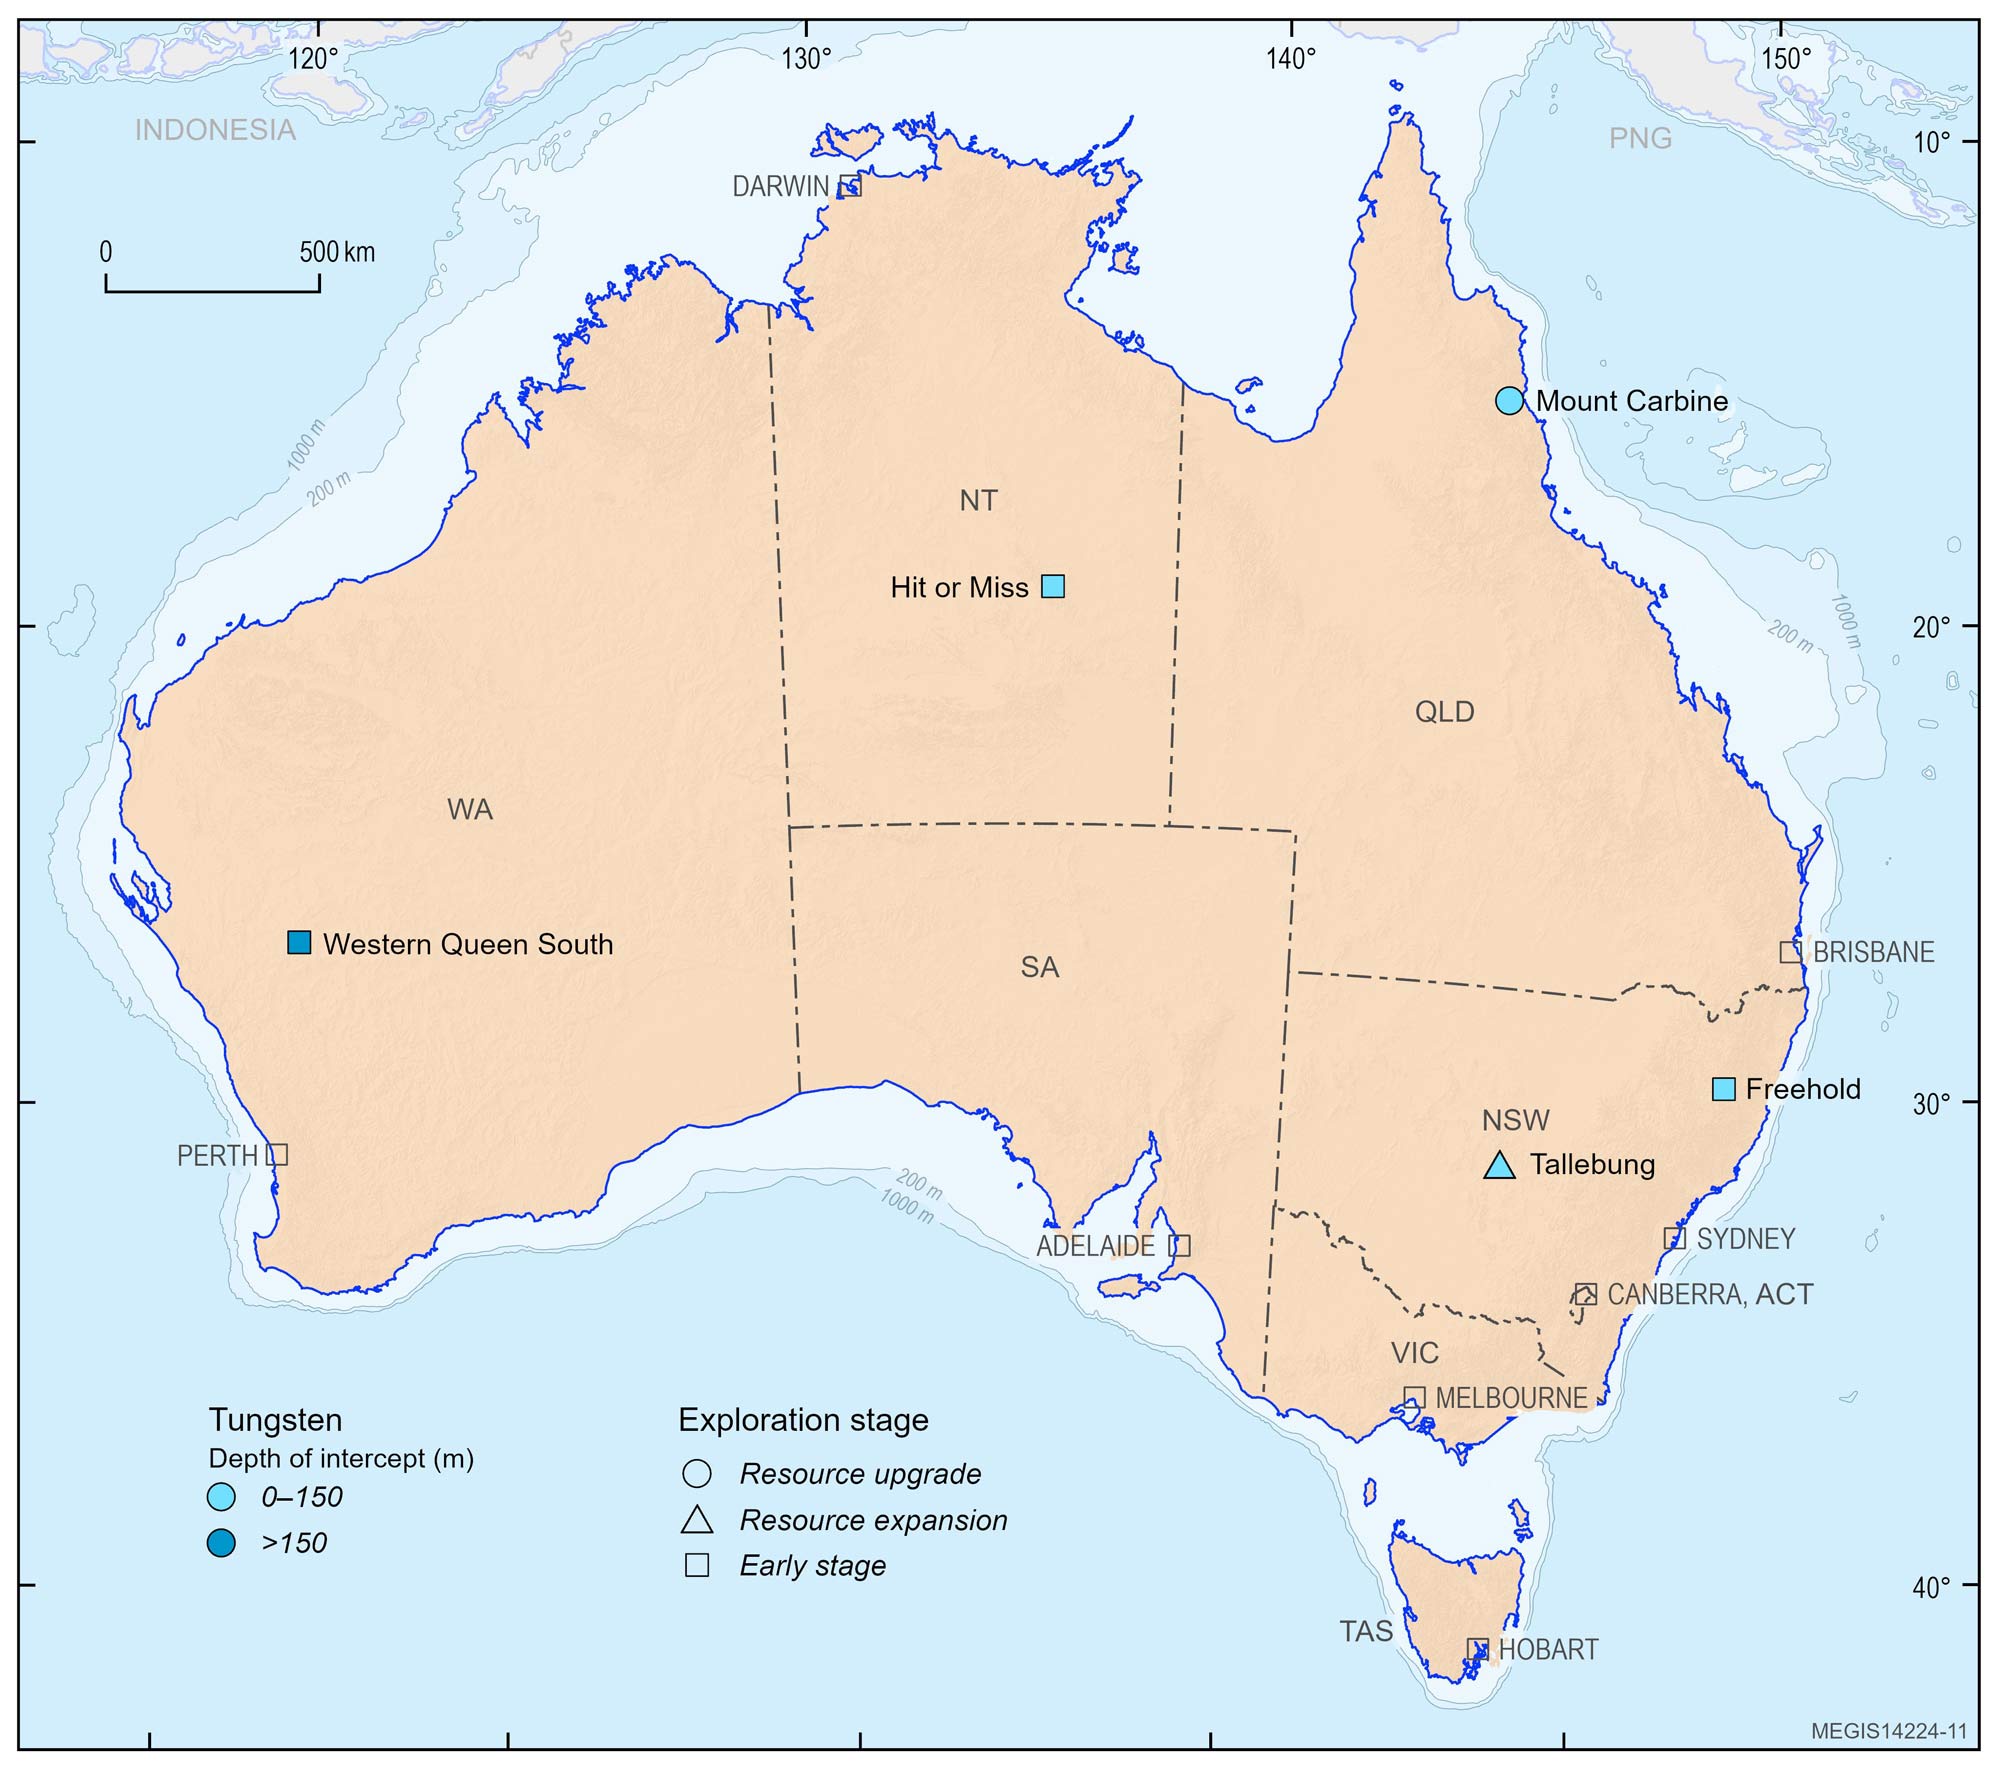
Figure 8. Location of significant drill results containing tungsten reported through the ASX (or equivalent) in 2025. Significant drill results are classified by exploration stage: Early stage refers to first-pass or follow-up drilling without a Mineral Resource estimate; Resource expansion refers to step-out or extensional drilling with a Mineral Resource estimate; and Resource upgrade includes infill drilling with a Mineral Resource estimate.
Table 6. Significant drill results containing tungsten reported through the ASX (or equivalent) in 2025. Company tickers are for the ASX unless otherwise stated.
| Company | Company Ticker | Deposit or Prospect | State | Intercept |
|---|---|---|---|---|
| Early-stage exploration drilling | ||||
| Larvotto Resources Ltd | LRV | Freehold | NSW | 14 m at 1.22 g/t Au, 0.73% Sb, 0.01% WO3 from 89 m |
| Rumble Resources Ltd | RTR | Western Queen South | WA | 24.6 m at 0.62% WO3 from 292.5 m |
| Tungsten Mining NL | TGN | Hit or Miss | NT | 17 m at 0.43% WO3, 0.03% Cu from 1 m |
| Resource expansion drilling | ||||
| Sky Metals Ltd | SKY | Tallebung | NSW | 40 m at 0.24% Sn, 0.04% W, 26.6 g/t Ag from 31 m |
| Resource upgrade drilling | ||||
| EQ Resources Ltd | EQR | Eastern Cut Back | QLD | 6 m at 1.62% WO3 from 9 m |
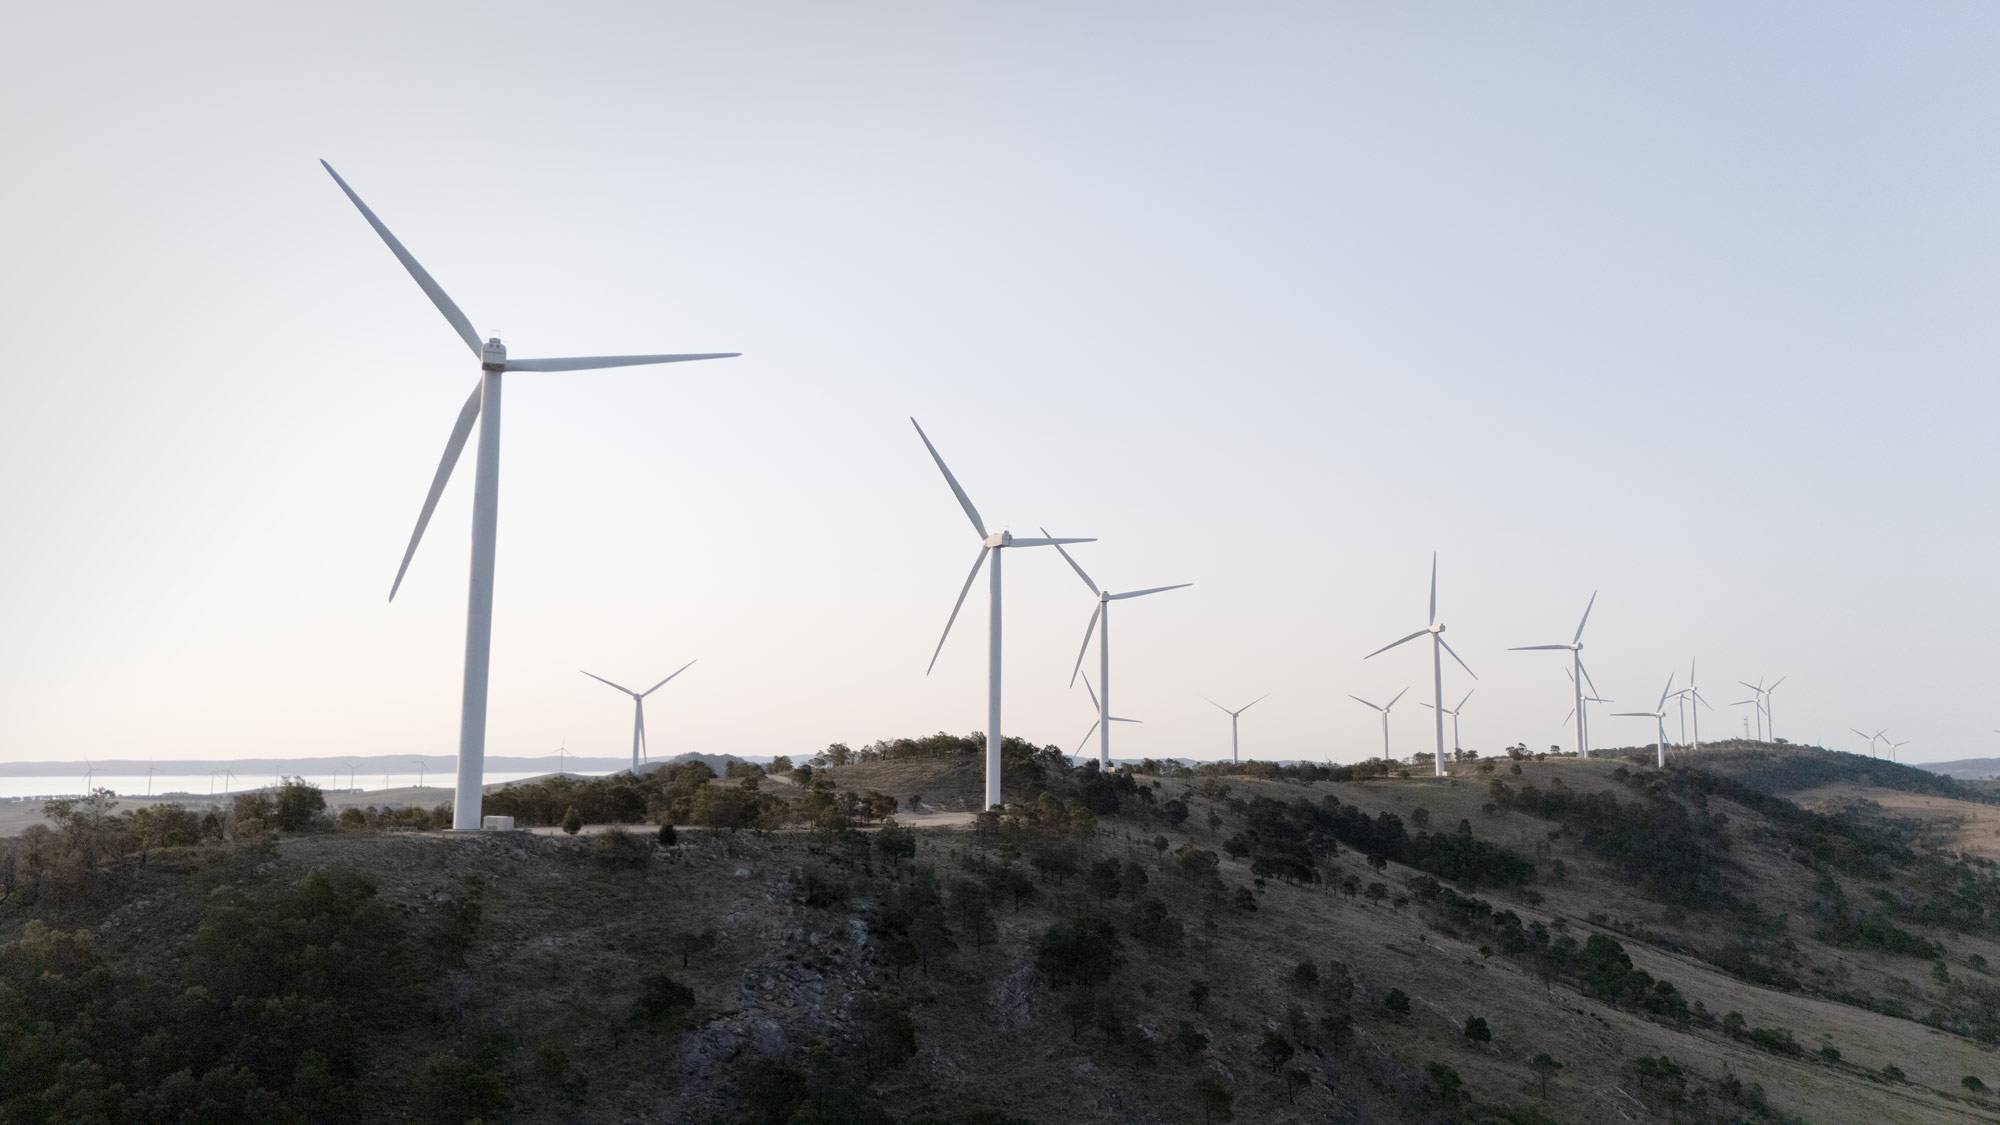
Capital Wind Farm overlooking Lake George, New South Wales. Wind turbines use rare earth elements, particularly neodymium and dysprosium, in high-strength permanent magnets that improve generator efficiency and reliability. Reliable rare earth element supply is important for expanding renewable energy infrastructure and supporting the net zero transition. Image courtesy of Geoscience Australia Creative Production Team.
Other critical minerals

*Data from Australian Bureau of Statistics, Mineral and Petroleum Exploration Australia (December 2025). Data are from the ‘other minerals’ category. # Data from Geoscience Australia, Australian Critical Minerals Map 2025 (see Appendix B).
In addition to the critical minerals listed in Tables 3 to 6, a range of other critical minerals featured in significant drill results reported in Australia in 2025. These include gallium, indium, molybdenum, PGE, tantalum, titanium and vanadium (Table 7; Figure 9), demonstrating Australia’s geological potential to supply a broad range of commodities essential for modern technologies.
Many of these commodities occur in very small amounts and are typically produced as a by-product through the processing of other commodities. The relevant commodity and by-product relationships include:
- Gallium: bauxite processing and, to a lesser extent, from zinc residue processing
- Indium: zinc refining
- Molybdenum: copper processing
- PGE: nickel sulphide and gold processing
- Tantalum: lithium and coltan (niobium-tantalum) mining
- Vanadium: iron ore and steel processing.
These critical minerals are used in alloys, magnets and electronics components critical for telecommunications, defence and aerospace applications. They are also crucial for batteries used in EV and renewable energy systems49.
Titanium is also included in this grouping. It is a critical material with two distinct markets: titanium dioxide (TiO₂) pigments, for use in paints, plastics and paper; and titanium metal, used in high‑performance applications such as aerospace, defence and medical implants due to its exceptional strength‑to‑weight ratio and corrosion resistance. Australia plays a strategically important upstream role, holding some of the world’s largest titanium mineral resources and being a major producer of ilmenite and rutile feedstocks, but with limited downstream production50.
Exploration drilling for critical minerals yielded significant results in southern Western Australia, particularly for titanium and PGE. Other titanium results were reported in central Western Australia and South Australia (Figure 9), where they occur as both hard rock mineralisation (often with vanadium) and as heavy mineral sand deposits. Molybdenum and indium results occur in Queensland, PGE and scandium results were reported in New South Wales and bismuth occurs in the Northern Territory (Figure 9). Many of these results are polymetallic as shown in Table 7.
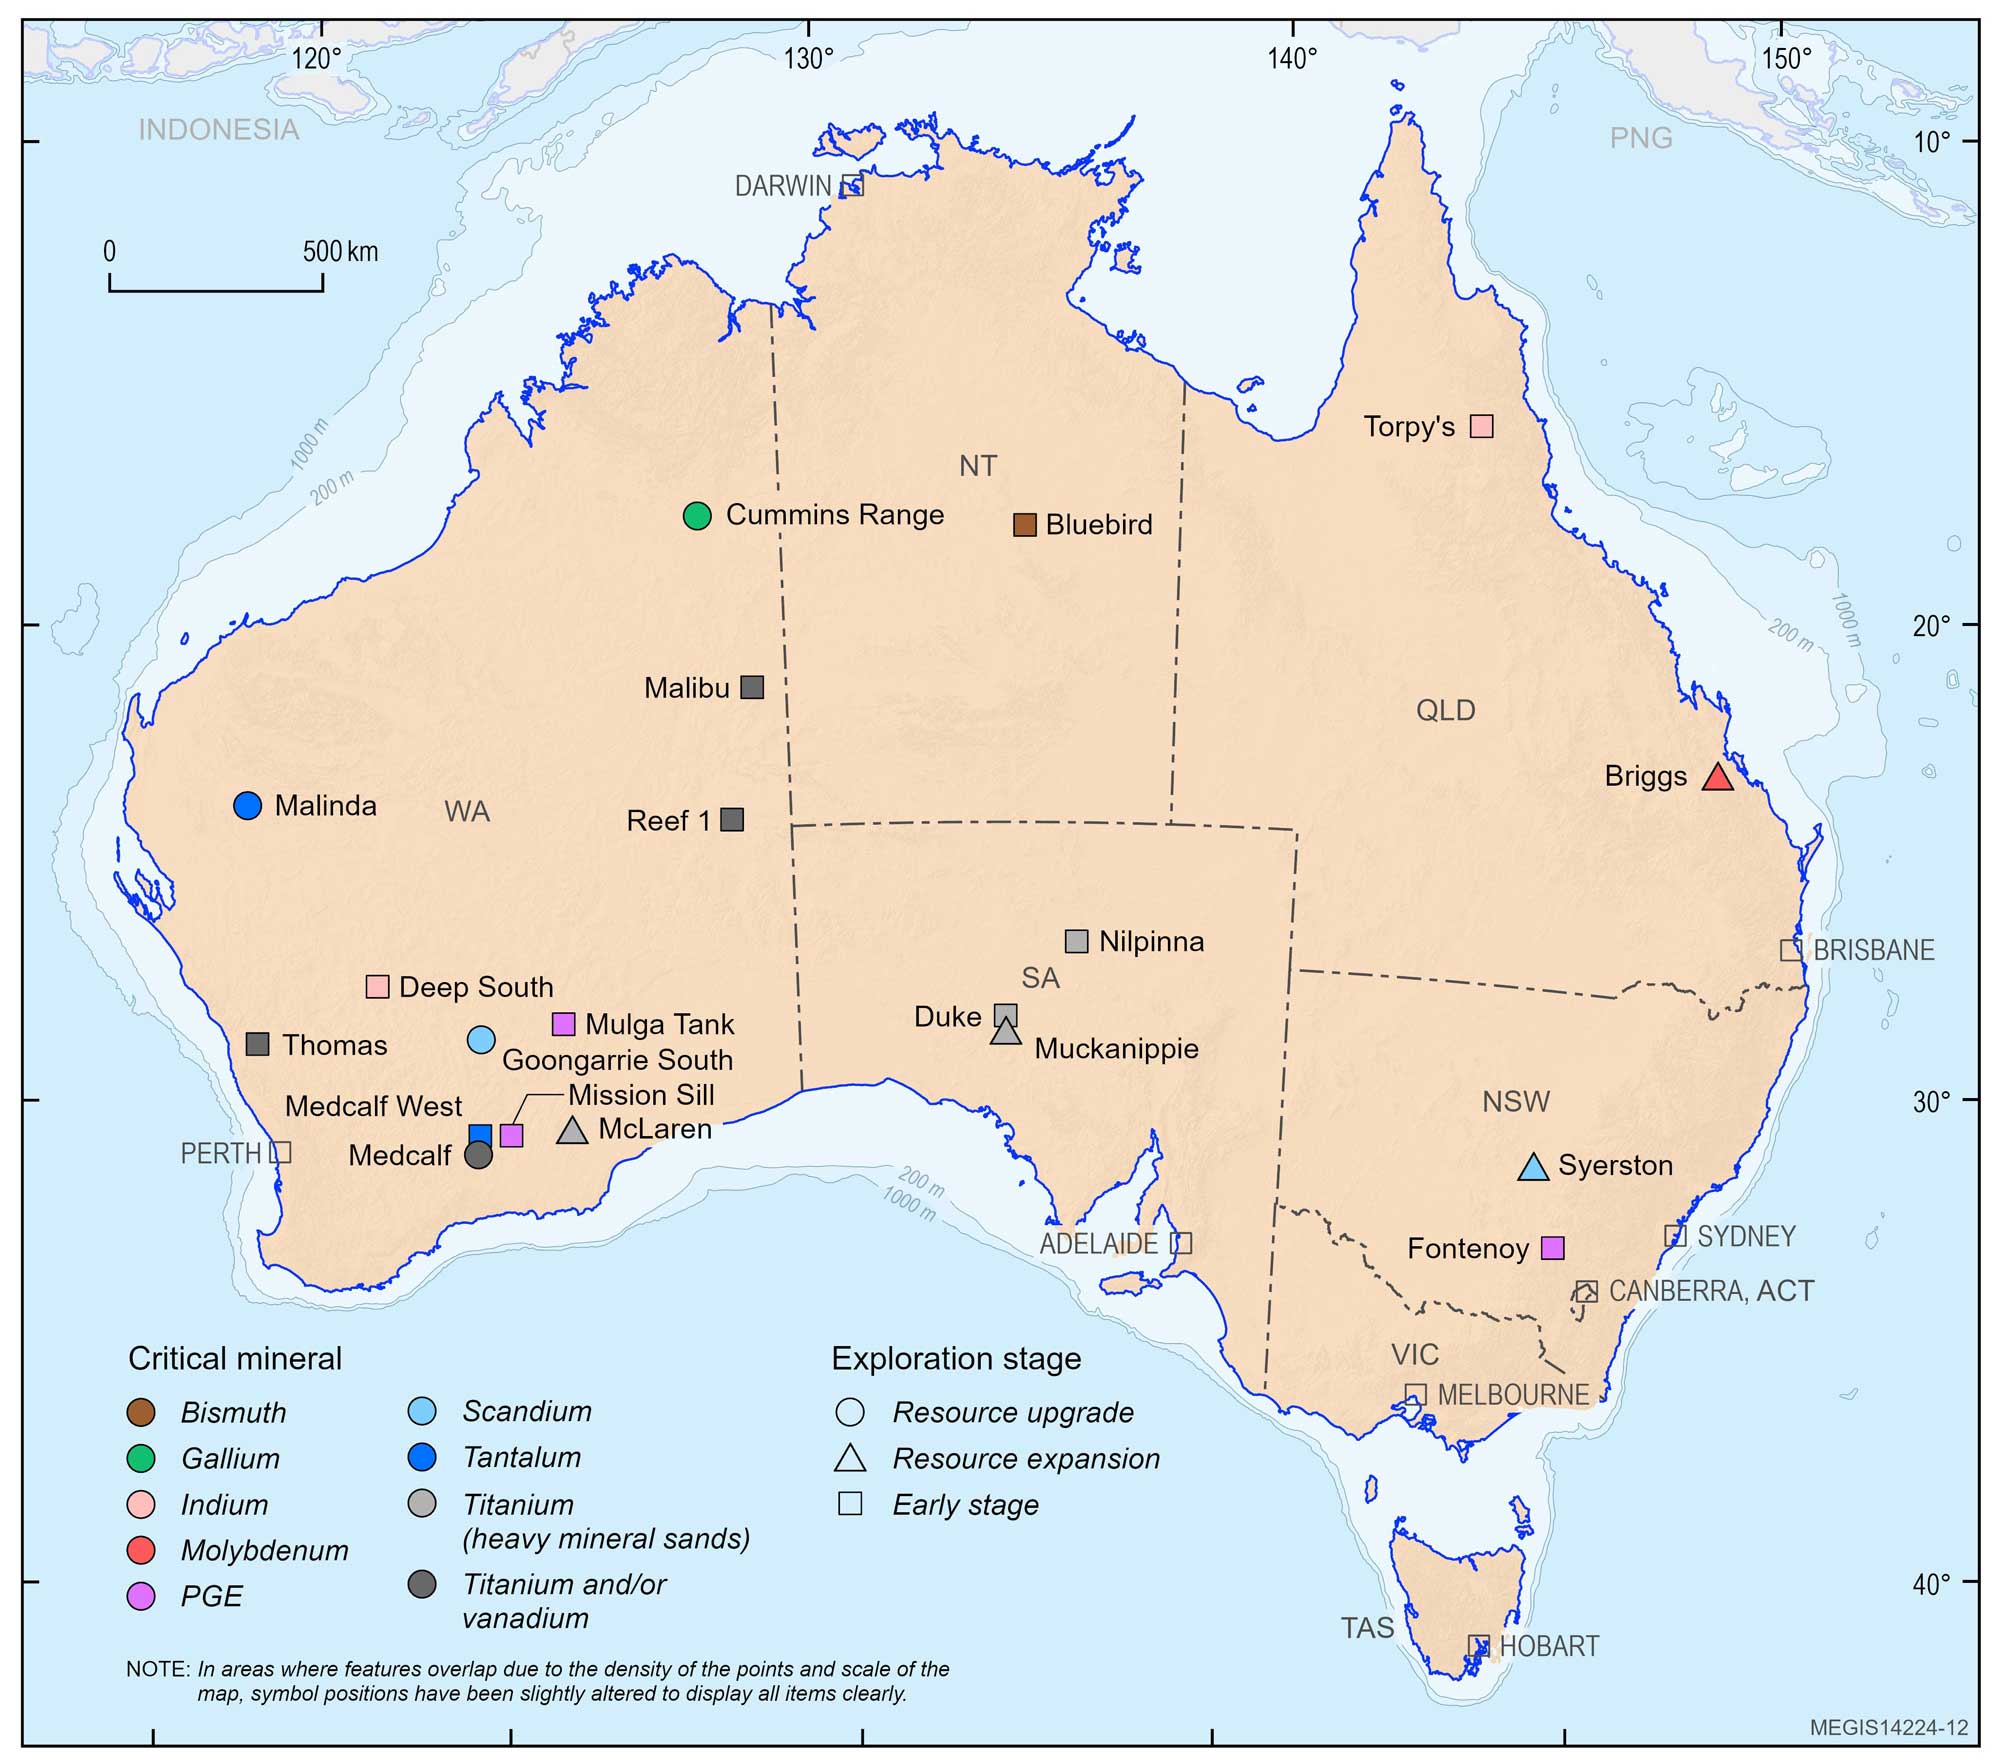
Figure 9. Location of significant drill results in 2025 containing critical minerals (not listed elsewhere in this review) reported through the ASX (or equivalent) in 2025. Significant drill results are classified by exploration stage: Early stage refers to first-pass or follow-up drilling without a Mineral Resource estimate; Resource expansion refers to step-out or extensional drilling with a Mineral Resource estimate; and Resource upgrade includes infill drilling with a Mineral Resource estimate.
Table 7. Significant drill results containing the critical minerals not listed elsewhere in this review, reported through the ASX (or equivalent) in 2025. Company tickers are for the ASX unless otherwise stated.
| Company | Company Ticker | Deposit or Prospect | State | Intercept |
|---|---|---|---|---|
| Early-stage exploration drilling | ||||
| Altitude Minerals Ltd | ATT | Nilpinna | SA | 1.5 m at 12.13% HM from 6 m |
| Ballymore Resources Ltd | BMR | Torpy's | QLD | 6 m at 226.7 g/t Ag, 8.73% Pb, 7.58% Zn, 0.05% Cu, 6.51 g/t In from 87 m |
| Charger Metals NL | CHR | Medcalf West | WA | 11 m at 1.8% Li2O, 132 ppm Cs, 125 ppm Ta from 111 m |
| Empire Metals Ltd | EEE (LSE) | Thomas | WA | 98 m at 7.05% TiO2 from 2 m |
| Galileo Mining Ltd | GAL | Mission Sill | WA | 52 m at 0.37 g/t Pd, 0.15 g/t Pt, 0.29 g/t Au, 0.16% Ni, 0.08% Cu from surface |
| Legacy Minerals Holdings Ltd | LGM | Fontenoy | NSW | 376.4 m at 0.1 g/t 3E PGE, 90 ppm Co, 1,736 ppm Cr, 1,143 ppm Ni from surface |
| Norwest Minerals Ltd | NWM | Malibu | WA | 33 m at 1.95% TiO2 from 39 m |
| PTR Minerals Ltd | PTR | Duke | SA | 60 m at 39.3% HM from surface |
| Tennant Minerals Ltd | TMS | Bluebird | NT | 13 m at 0.15% Cu, 0.05 g/t Au, 45.5 g/t Bi from 381 m |
| Terra Metals Ltd | TM1 | Reef 1 | WA | 10 m at 17.96% TiO2, 0.11 g/t Au, 0.32 g/t Pt, 0.09 g/t Pd, 0.13% Cu, 42.1% Fe2O3, 0.65% V2O5, 0.1 g/t Ag, 0.01% Co, 0.03% Ni from surface |
| Venus Metals Corporation Ltd | VMC | Deep South | WA | 19 m at 2.63% Zn, 19.32 g/t In from 49 m |
| Western Mines Group Ltd | WMG | Mulga Tank | WA | 1,247 m at 0.32% Ni, 134 ppm Co, 76 ppm Cu, 24 ppb Pt+Pd from 108 m |
| Resource expansion drilling | ||||
| Canterbury Resources Ltd | CBY | Briggs | QLD | 222.2 m at 0.26% Cu, 48 ppm Mo, 0.72 g/t Ag from 9 m |
| Marmota Ltd | MEU | Muckanippie | SA | 28 m at 19.2% HM from surface |
| McLaren Minerals Ltd | MML | McLaren | WA | 27 m at 8% HM from surface |
| Sunrise Energy Metals Ltd | SRL | Syerston | NSW | 26 m at 503 ppm Sc from 3 m |
| Resource upgrade drilling | ||||
| Ardea Resources Ltd | ARL | Goongarrie South | WA | 34 m at 1.75% Ni, 0.434% Co, 30 ppm Sc from 12 m |
| Audalia Resources Ltd | ACP | Medcalf | WA | 60 m at 7.71% TiO2, 0.4% V2O5, 41.92% Fe2O3 from surface |
| Delta Lithium Ltd | DLI | Malinda | WA | 22.67 m at 2.16% Li2O, 106 ppm Ta2O5, from 310 m |
| RareX Ltd | REE | Cummins Range | WA | 115 m at 146.0 g/t Ga2O3, 3.4% TREO, 369.0 g/t Sc2O3, 0.42% Nb2O5, 8% P2O5 from 22 m |
30 Department of Industry Science and Resources 2024 Australia’s Critical Minerals List and Strategic Materials List.
31 Hughes et al., 2026. Australia’s Identified Mineral Resources 2025. Geoscience Australia.
32 ORourke, A., Boyd, J., Pheeney, J., 2026. Australia's Antimony Supply Chain.
33 Department of Industry, Science and Resources, 2025. Strategic reserve to secure Australia’s critical mineral supply.
34 Export Finance Australia, 2025. Australia—Higher lithium exports supported by strong mine output.
35 Hughes et al., 2026. Australia’s Identified Mineral Resources 2025.
36 ibid.
37 Boyd, J., Pheeney, J., ORourke, A., 2026. Australia's Graphite Supply Chain.
38 Pheeney et al., 2026. Australian Critical Minerals Map 2025.
39 ORourke, A., Pheeney, J., Boyd, J., 2026. Australia's Rare Earth Element Supply Chain.
40 Hughes et al., 2026. Australia’s Identified Mineral Resources 2025.
41 ORourke et al., 2026. Australia's Rare Earth Element Supply Chain.
42 Government of Western Australia, 2023. Western Australia: A Global Battery and Critical Minerals Industry Hub.
43 Keller P., Krapf C.B.E., 2024. South Australia’s geological potential for selected critical minerals – a review. Departmental Publication; MESA Journal. Government of South Australia.
44 Department of Industry, Science and Resources, 2025. Strategic reserve to secure Australia’s critical mineral supply.
45 Hughes et al., 2026. Australia’s Identified Mineral Resources 2025.
46 ibid.
47 Pheeney, J., Colclough, H., Boyd, J., 2025. Australian Mineral Exploration Review 2024.
48 International Energy Agency, 2025. Decision to implement export controls on tungsten, tellurium, bismuth, molybdenum and indium related items.
49 Hughes et al., 2026. Australia’s Identified Mineral Resources 2025. https://dx.doi.10.26186/150676.
50 ibid.