Australian Mineral Exploration Review 2025 Mineral Exploration expenditure and drilling trends
Page last updated:3 August 2026
The Australian Bureau of Statistics conducts its Mineral Exploration and Evaluation Survey throughout the year, gathering information through an online form from the business sector, specifically companies involved in exploration. The purpose of the survey is to understand what expenditure (capitalised and non-capitalised) is spent during the exploratory or evaluation stages of mineral exploration across Australia.
This section provides a longitudinal overview (since 2000) of exploration spending across the Australian minerals sector including for some individual commodities or groups of commodities. This provides an overview of trends within the mineral exploration sector, including the commodities targeted, exploration activities across states and territories, and whether exploration is focused on existing or new deposits. The data presented in this section are further explored in Appendix D and the raw data can be downloaded from the Australian Bureau of Statistics website11.
The Australian Bureau of Statistics categorises mineral exploration into two types: existing deposit exploration and new deposit exploration, which broadly aligns with the common industry parlance of brownfields and greenfields exploration, respectively12. Existing deposit exploration refers to work undertaken to further define or prove up a deposit that has previously been classified with a Mineral Resource estimate (Inferred or higher), including extension and infill drilling. New deposit exploration refers to exploration targeting previously unknown mineralisation or known mineralisation that has not yet been classified with any Mineral Resource estimate.
Yearly exploration expenditure and drilling
In 2025, mineral exploration expenditure totalled $3.9 billion, increasing marginally by 0.2% from 2024. This was accompanied by an increase of 11.4% in total metres drilled (10,659,000 metres) for the 2025 calendar year (Figure 2). Sixty-nine maiden Mineral Resources from 50 projects were announced in 2025, which is an increase from 45 projects in 2024, although less than the peak of 77 projects in 2023 (Figure 2a). The continued high number of maiden resource announcements demonstrates the strong link between exploration expenditure and the discovery of new resources. For further information on maiden Mineral Resources see Section 3 (Maiden Mineral Resources).
Of the total yearly exploration expenditure for 2025, 25.8% ($1.0 billion) was spent on new deposit exploration, a decrease of 9.6% on 2024. There was also a decrease of 3.5% in metres drilled in new deposit exploration, which was 2,365,900 metres in 2025 compared to 2,450,900 metres in 2024. The remainder was spent on exploration in areas with existing deposits, for a total of $2.9 billion, which was an increase of 4.1% on 2024. Drilling in existing deposits increased 16.5% to 8,293,700 metres, compared to the 7,119,800 metres in 2024 (Figure 2).
The decline in expenditure and drilling associated with new deposits was likely due to several factors, including the rising costs of exploration in areas that are not established mining regions, as well as investor and corporate preference for operating mines and optimising existing operations over relatively high-risk exploration projects. The high gold price, for example, is driving increased exploration in lower risk areas with well-understood geology and existing infrastructure.
The slight increase in 2025 exploration expenditure shows that, amongst global uncertainty, Australia remains one of the most attractive destinations in the world for mineral exploration13, reflecting Australia’s vast resource endowment, world-class mining industry, mature and transparent regulatory environment and strongly supportive federal and jurisdictional governments.
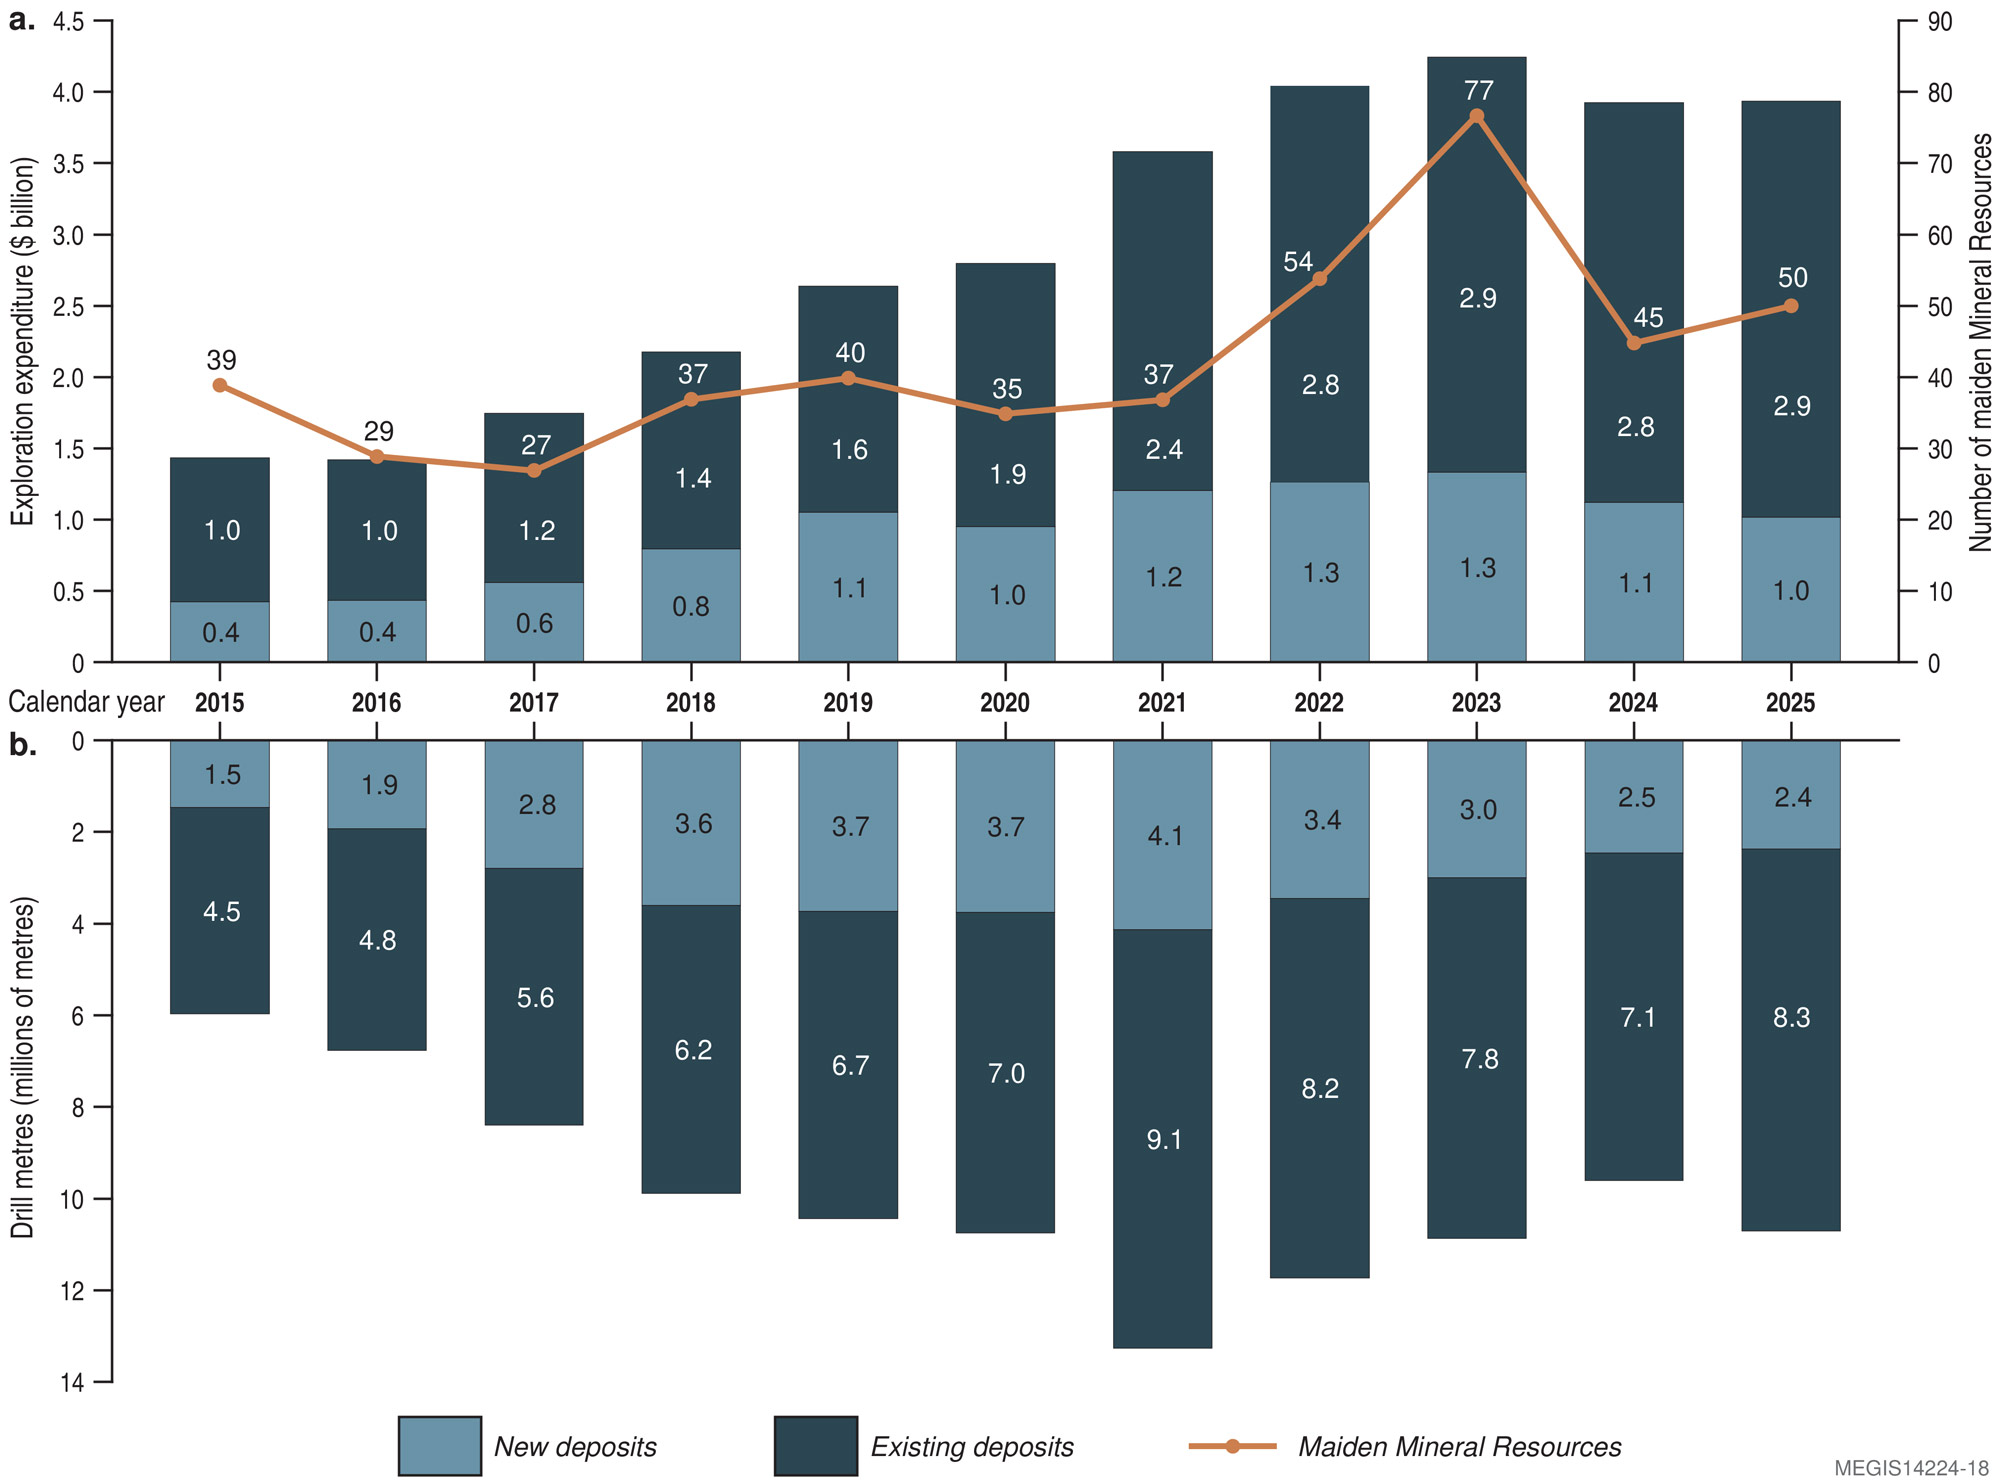
Figure 2. a) Mineral exploration expenditure at new and existing deposits, plus the number of maiden Mineral Resources by project, 2015–2025. b) Number of metres drilled at new and existing deposits, 2015–2025. The numbers within the columns of the upper graph refer to exploration expenditure for new deposits (light blue) and existing deposits (dark blue). The numbers within the columns of the lower graph refer to metres drilled at new deposits (light blue) and existing deposits (dark blue).
Exploration expenditure by commodity
Exploration expenditure by commodity in 2025 reflects differing market conditions across Australia’s minerals sector, with expenditure increasing for some commodities and declining for others. Changes in expenditure were influenced by a range of factors, including commodity prices, investor sentiment, global demand and broader strategic considerations. The following discussion outlines the main changes in expenditure across key commodities in 2025.
The continued high level of total exploration expenditure in 2025 was likely due to the increase in the price of gold, leading to increased gold exploration, which largely offset decreased exploration expenditure for commodities such as nickel-cobalt and copper. Other factors, such as increased transport costs, falling prices for some commodities and challenges in securing funding and approvals, also likely contributed to this trend. World growth of the mineral sector in 2025 was relatively slow partly due to increased trade barriers, including tariffs and export bans. It is expected that global economic growth and increased demand for commodities will continue due to the ongoing need for materials to support the energy transition and also for emerging technological sectors such as artificial intelligence data centres. Easing monetary and fiscal policies may encourage greater investment in commodity projects that help meet increasing demand14.
In 2025, 40% of the total mineral exploration expenditure was spent on gold, which remains the leading commodity of exploration interest in Australia. This signifies a 34% increase in gold expenditure to $1.5 billion, up from $1.2 billion in 2024 (Figure 3a). This is only slightly lower than the highest exploration expenditure on record for gold, which occurred in 2021 at a high of $1.6 billion. Drivers include the gold price, which hit a new record of US$4,300 an ounce (approximately A$6,000 an ounce) in 2025, as well as cuts to the US official interest rates, leading investors to seek gold as a perceived safe havens from inflation and fiscal uncertainty15.
Mineral sands (+59%), silver-lead-zinc (+20%) and iron ore (+3%) also experienced increased exploration expenditure in 2025 (Figure 3). Despite the price of zircon and ilmenite declining in 2025, mineral sands, which contains these minerals, had the highest increase in exploration expenditure, up 59% on 2024 figures to $71.5 million, noting that this was just 1.8% of total mineral exploration expenditure in 2025. The increase in exploration expenditure for mineral sands was likely stimulated by China’s curbs on a range of REE exports as well as bilateral agreements between Australia and other countries to support the development of diversified supply chains, such as the United States–Australia Framework for Securing of Supply in the Mining and Processing of Critical Minerals and Rare Earths16.
The 20% increase in silver-lead-zinc exploration expenditure to $489.4 million in 2025 is the first positive increase for this industry since 2022 (Figure 3d). The increase could be attributed to rising zinc prices in 2025; however, predictions are that these higher commodity prices will lead to demand softening in 2026 and 202717. Exploration expenditure for iron ore increased from 3% in 2024 to $793.8 million in 2025, contributing 20% of the 2025 total exploration expenditure of $3.9 billion (Figure 3b). In 2025, iron ore prices held steady despite reduced global steel output, largely due to decreased Chinese steel production. However, it is predicted that other manufacturing centres such as India and Southeast Asia will increase market share in coming years, potentially increasing demand18.
In contrast, diamonds, other minerals, nickel-cobalt, copper, uranium and coal all saw decreased exploration expenditure in 2025 (Figure 3). Diamonds had the sharpest decrease of 73.1% compared to 2024, with just $0.7 million spent on exploration in 2025, representing less than 1% of overall expenditure. Diamond exploration has been steadily decreasing over the past 20 years as the profitability of natural diamonds decreases19.
The ‘other minerals’ category includes bauxite as well as critical minerals such as lithium, REE, tungsten, manganese, platinum group elements (PGE) and niobium. In 2025, exploration expenditure for this grouping decreased by 32.3% compared to 2024, to $448.8 million and made up 11.4% of total mineral exploration expenditure (Figure 3f). The Department of Industry, Science and Resources expects demand for these commodities will likely increase20 due to the establishment of the Australia-United States Critical Minerals Framework21 as well as the continued electric vehicles (EVs)22.
Nickel and cobalt represented 4.1% of all exploration expenditure in 2025 with $162.5 million being spent (Figure 3c). This is a decrease of 22.1% from 2024, reflective of weak global nickel prices and a decline in Australian nickel production despite raised cobalt prices towards the end of 2025. Global demand for nickel and cobalt is expected to increase in the coming year as feedstock for nickel sulphate, a key component in nickel-manganese-cobalt batteries, increases in demand23.
Copper also decreased in exploration expenditure to $469.7 million in 2025 (Figure 3c). This was a decrease of 11.9% from 2024 figures and continued downward trend from the previous year, notwithstanding a strong copper market in 2025 and a price increase forecast for the coming year24.
Whilst expenditure for coal exploration was $242.2 million in 2025, this was a drop of 24.8% compared to 2024. Coal exploration expenditure has steadily decreased since 2013 (Figure 3b). The 2025 calendar year also saw a decrease of 17.8% in uranium exploration expenditure compared to 2024. Uranium exploration expenditure was $58.8 million in 2025, which was 1.5% of total mineral exploration expenditure (Figure 3e).
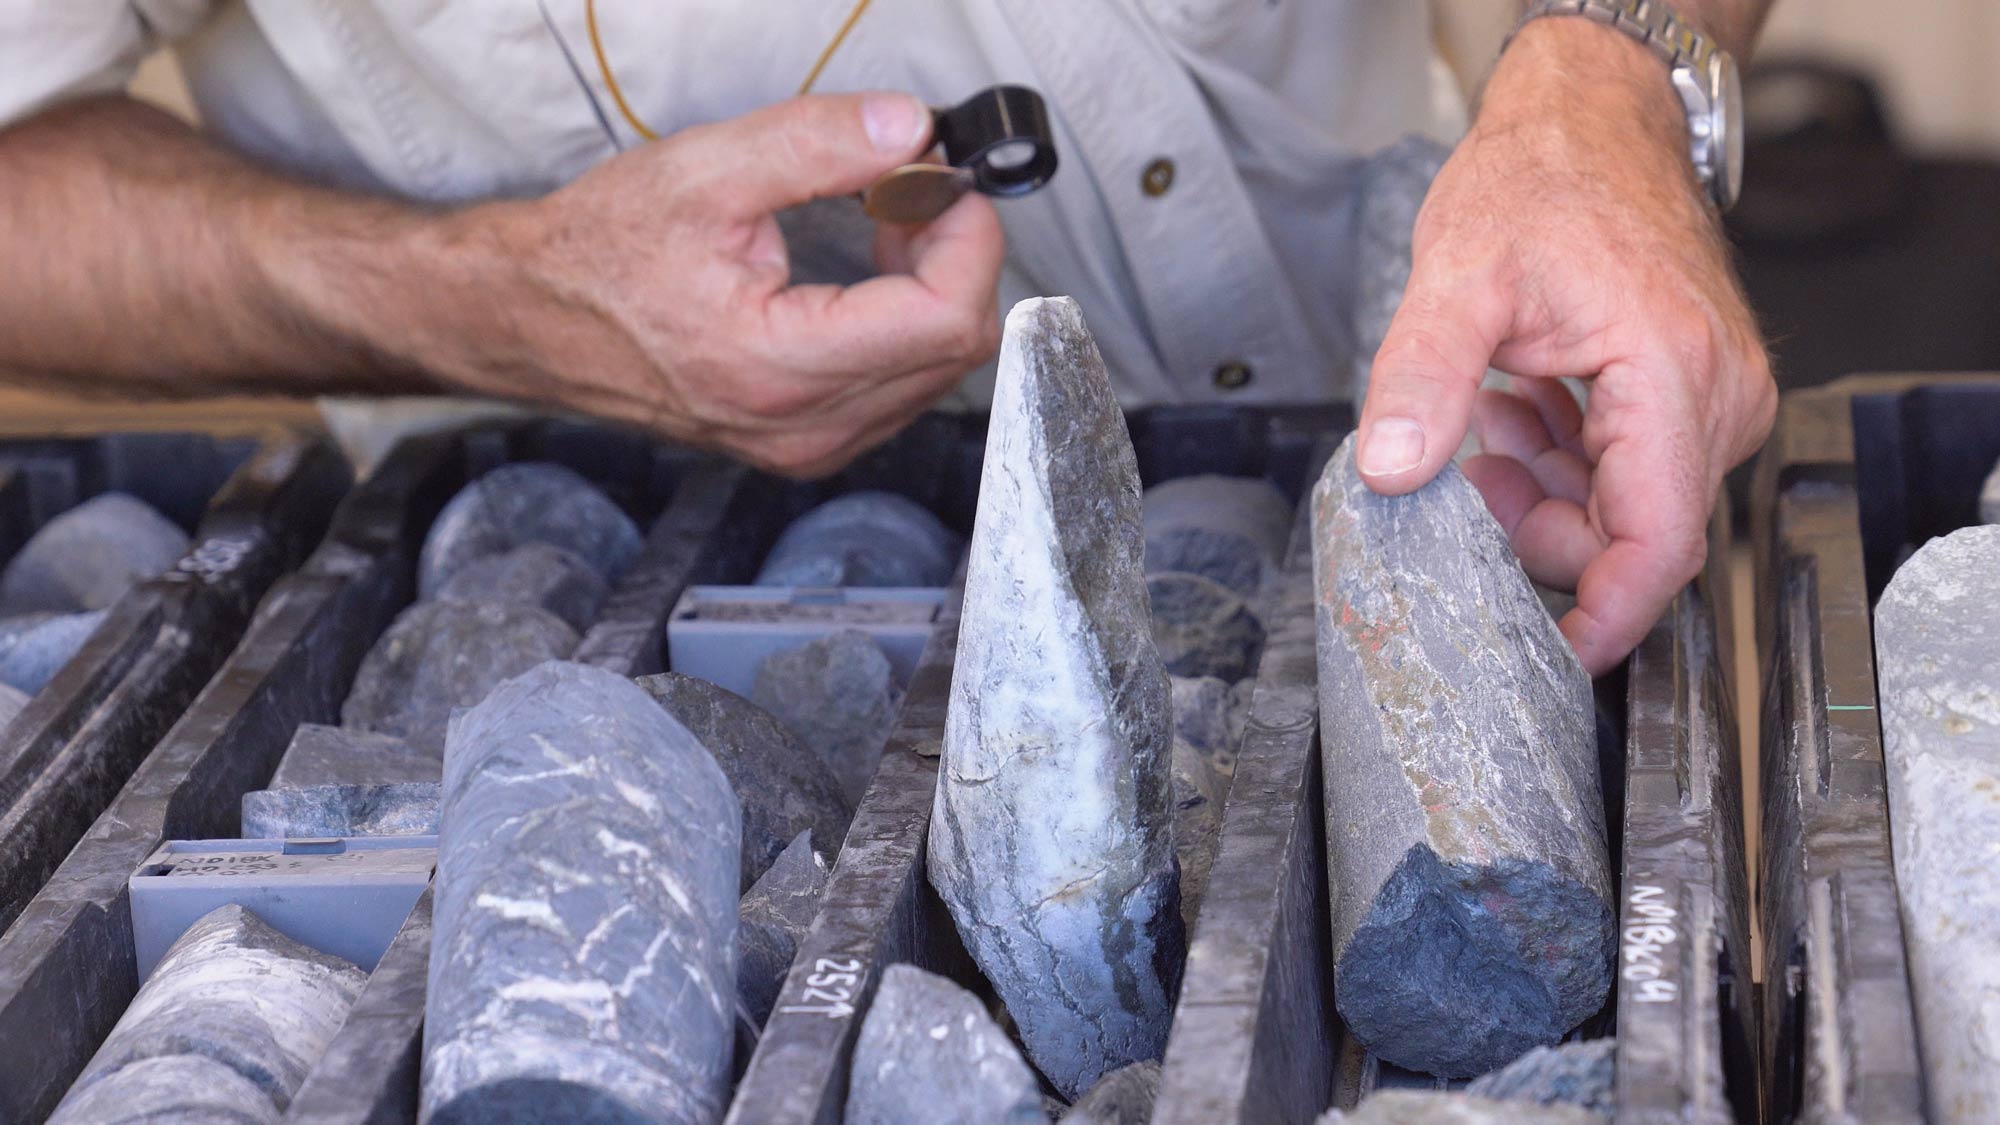
Exploration drilling allows geoscientists to access and study rocks beneath the Earth’s surface, helping them understand both the rocks themselves and the mineralisation systems they host. This understanding provides evidence for where further drilling campaigns should concentrate for the best possibility to intercept mineralisation. Core from diamond drilling preserves a continuous and undisturbed record of subsurface rocks, allowing geoscientists to directly observe geological structures and mineralisation in their true context. Image by Michael O’Rourke, Geoscience Australia.
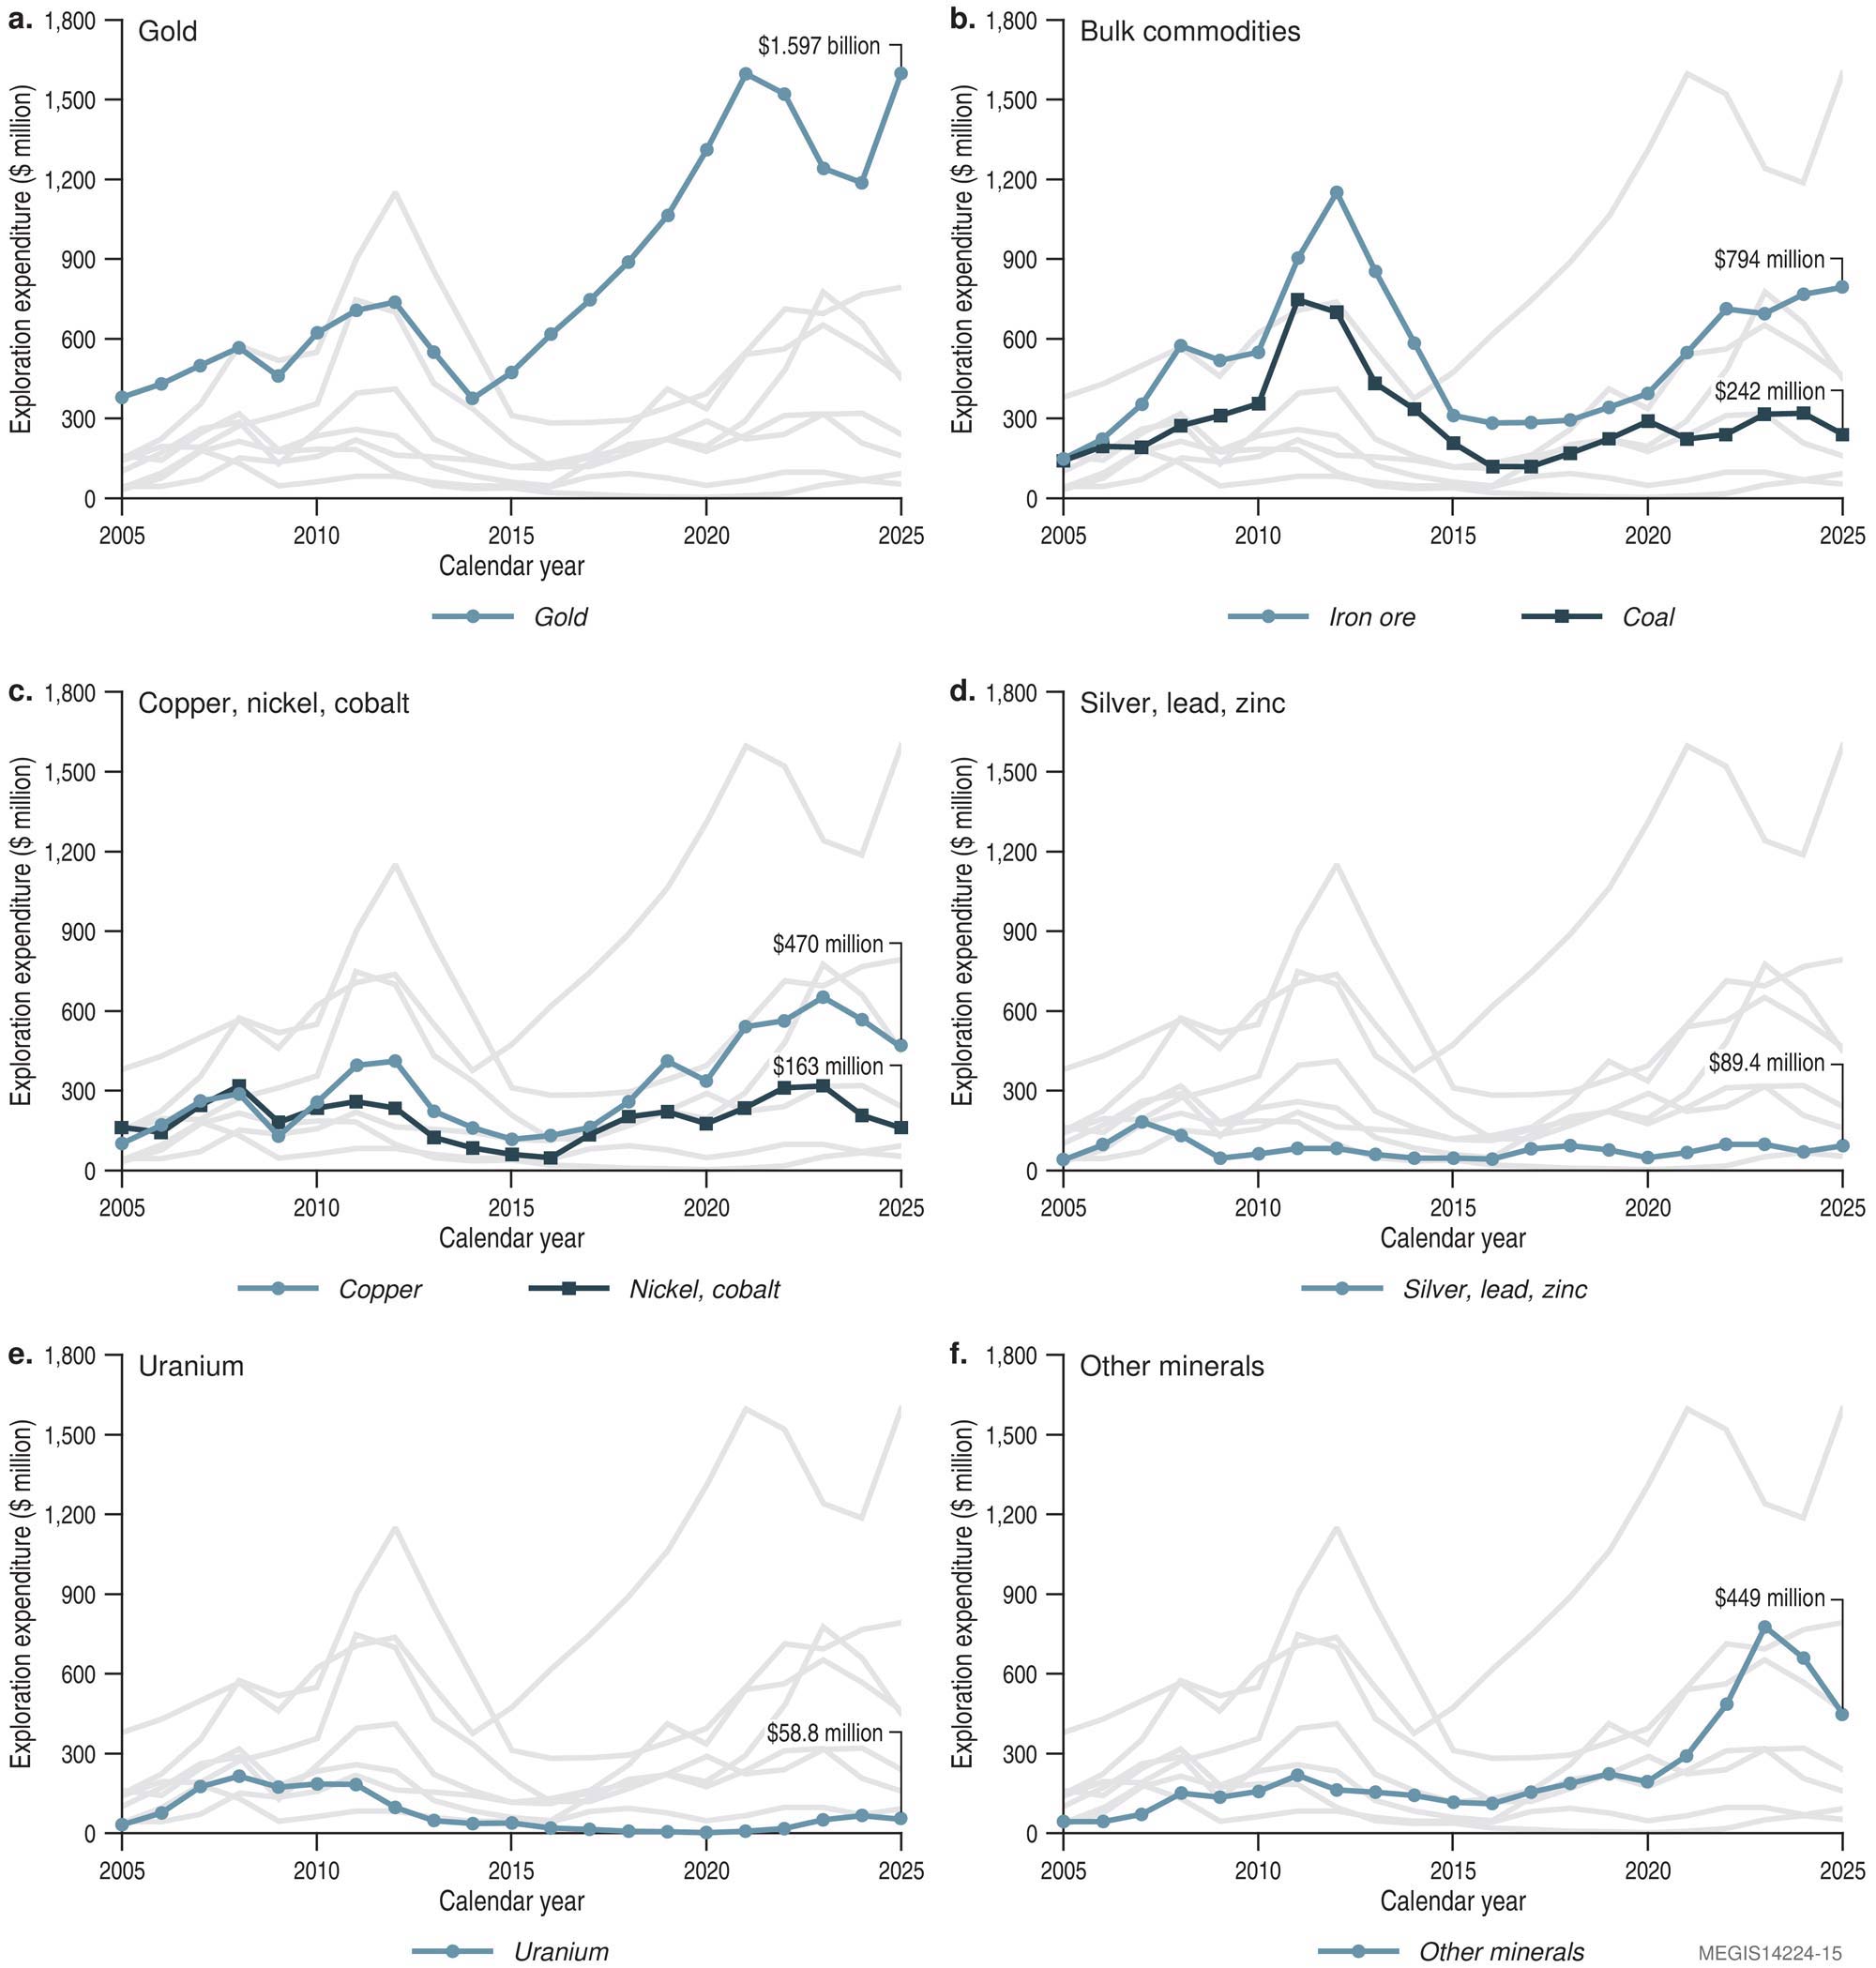
Figure 3. Trends in mineral exploration expenditure by commodity, 2005–2025, showing a) gold; b) bulk commodities, iron ore and coal; c) copper and nickel-cobalt; d) silver-lead-zinc; e) uranium and f) other minerals. The other minerals category includes bauxite as well as critical minerals like lithium, REE, vanadium, manganese, PGE and niobium. The pale grey lines in each graph are consistent across all Figure 3, with each commodity group highlighted in corresponding individual graphs. Data from Australian Bureau of Statistics (December 2025).
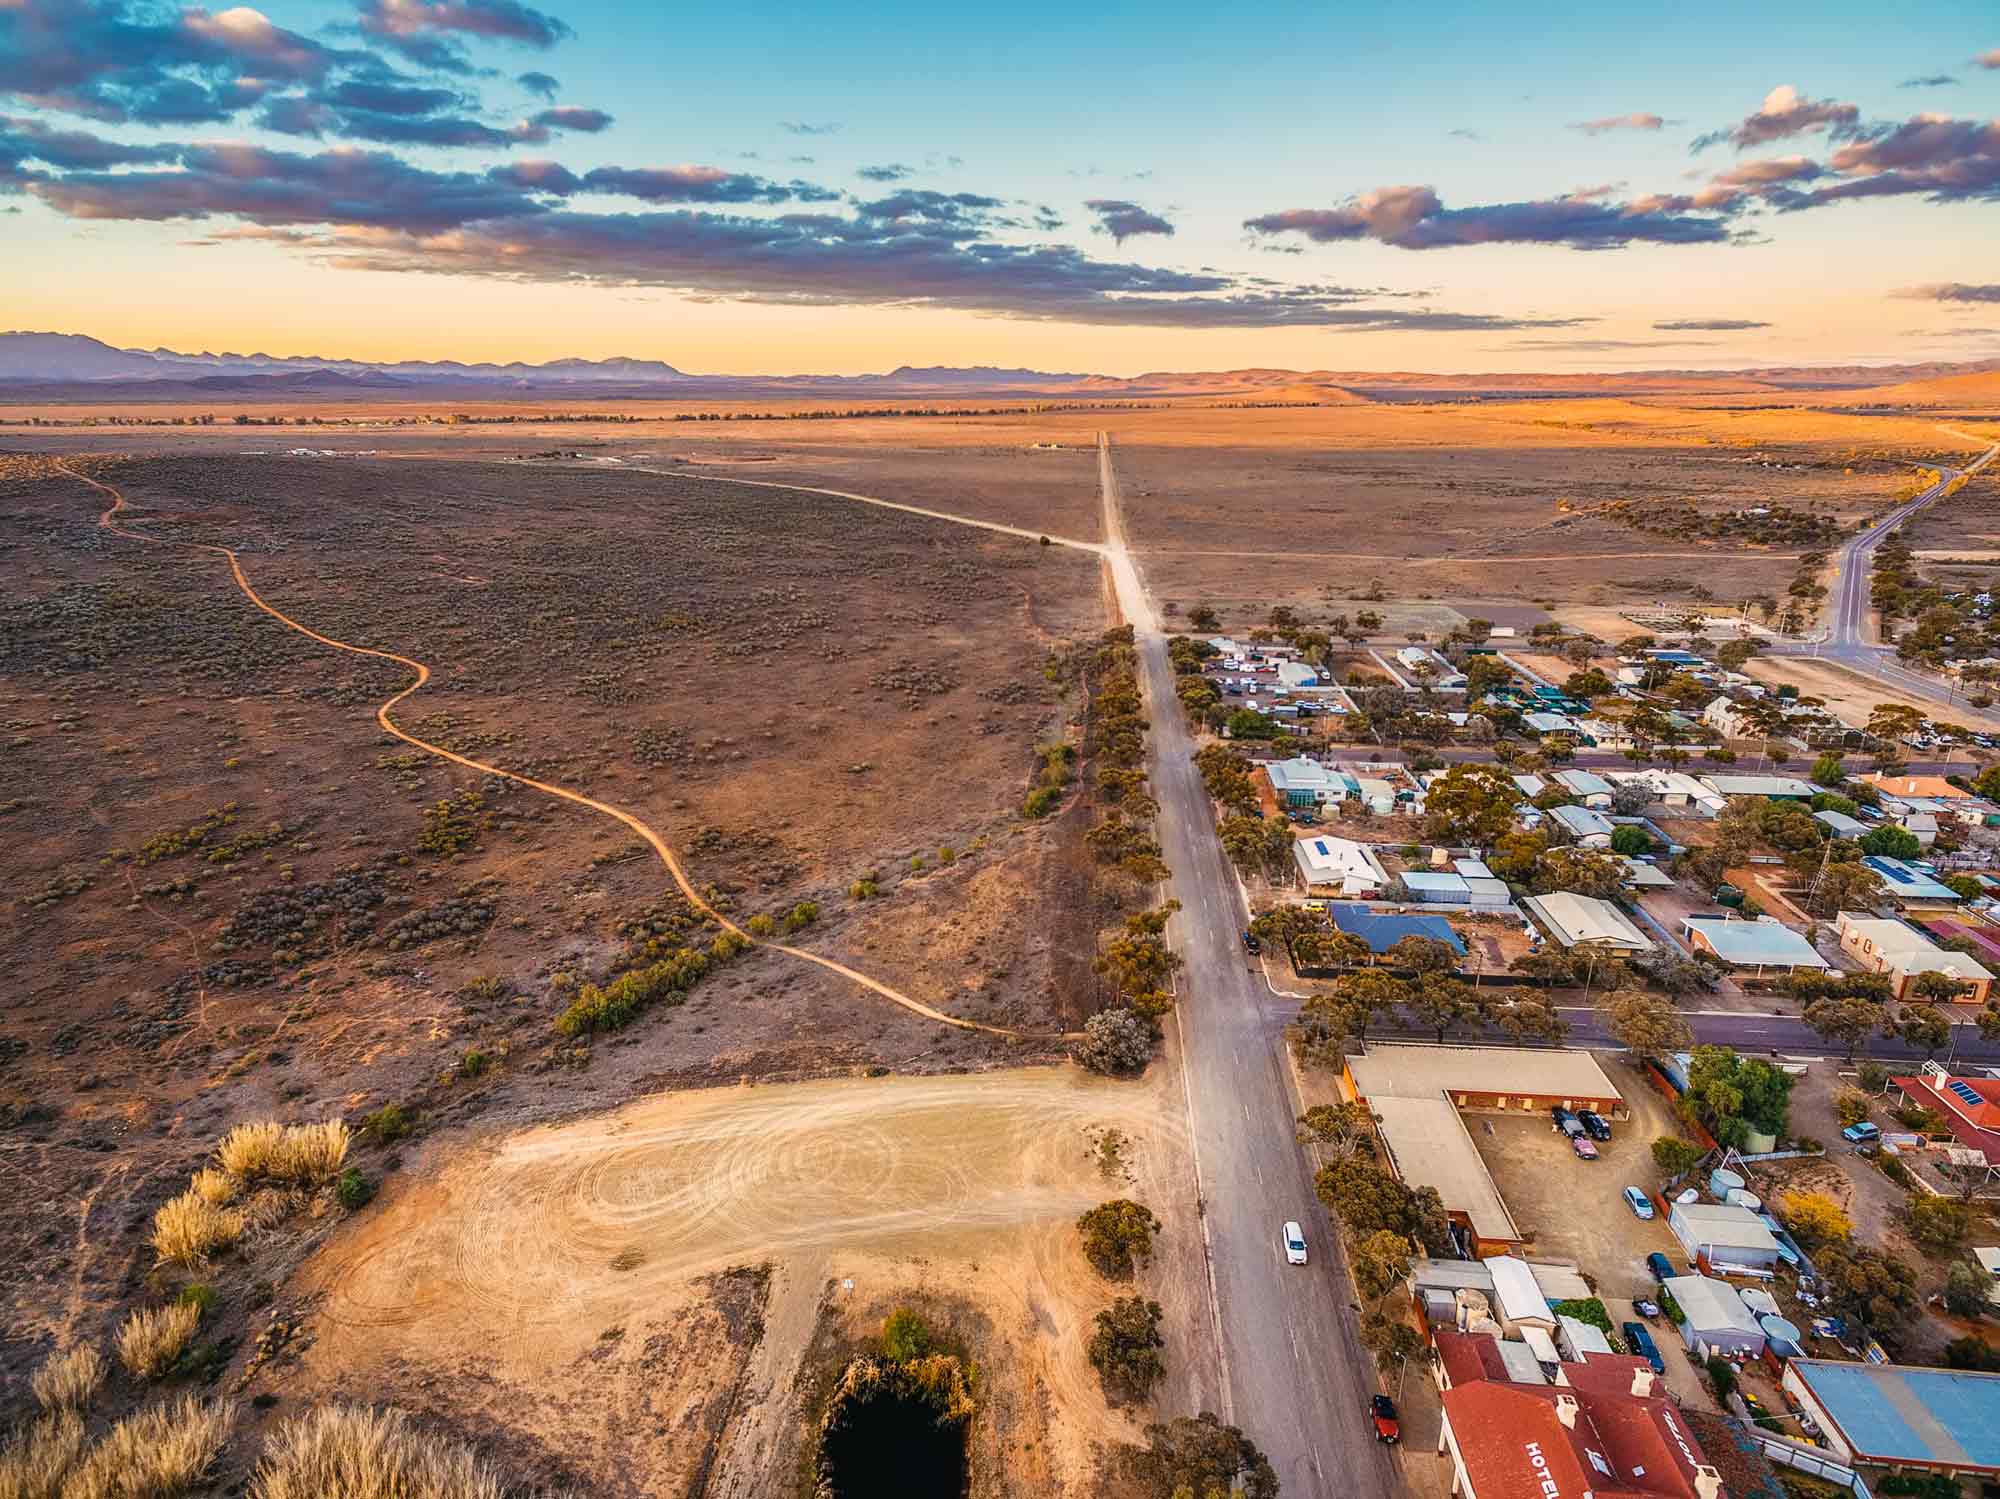
By identifying future resource opportunities, mineral exploration helps bring new infrastructure, employment, and economic activity to rural regions, supporting stronger and more productive communities. Hawker in South Australia is one of the few towns on the southern edge of the highly prospective Curnamona Province. Image Sourced from Greg Brave via Adobe Stock.
11 Throughout this section all data regarding expenditure and drilling metres is from the Australian Bureau of Statistics (December 2025), Mineral and Petroleum Exploration, Australia, ABS Website, unless otherwise referenced.
12 In previous versions of the Australian Mineral Exploration Review, the terms brownfields and greenfield have been used as a proxy for existing deposits and new deposits, respectively. The change in terminology brings this year’s review in line with the data being collected by the Australian Bureau of Statistics.
13 Mejía J., and Aliakbari E., 2026. Annual Survey of Mining Companies 2025, Fraser Institute.
14 Department of Industry, Science and Resources, 2025. Commonwealth of Australia Resources and Energy Quarterly December 2025. www.industry.gov.au/req.
15 ibid.
16 Department of Industry, Science and Resources, 2025. United States–Australia Framework for Securing of Supply in the Mining and Processing of Critical Minerals and Rare Earths. .
17 DISR, 2025. Commonwealth of Australia Resources and Energy Quarterly December 2025.
18 ibid.
19 Jiang S. and Wang S., 2024. The environmental impacts and sustainable pathways of the global diamond industry. Humanity and Social Sciences Communications11, 671 (2024).
20 DISR, 2025. Commonwealth of Australia Resources and Energy Quarterly December 2025.
21 DISR, 2025. United States–Australia Framework for Securing of Supply in the Mining and Processing of Critical Minerals and Rare Earths.
22 DISR, 2025. Commonwealth of Australia Resources and Energy Quarterly December 2025.
23 ibid.
24 ibid.