Australian Mineral Exploration Review 2025 Significant drill results – strategic materials
Page last updated:3 August 2026
This section highlights selected significant exploration drill results for strategic materials, with drill intercepts providing an early indication of a project’s mineral potential. When considered alongside broader geological and technical information, these results can point to new discoveries, support interpretations of deposit size and grade, or show where known resources may be extended.
The Australian Government lists aluminium, copper, phosphorus, tin and zinc as strategic materials51, recognising these elements as important to economic resilience, industrial capability and emerging supply chains. However, at last assessment, supply chains of these materials were considered less vulnerable than those for critical minerals. Australia hosts substantial resources of the strategic materials (Figure 1) and continued exploration for these commodities will help support future demand and the net zero transition.
The tables and maps in this section present a selection of publicly reported significant drill results from exploration programs carried out across Australia in 2025, organised by commodity. As some commodities occur together within the same mineral systems, certain intercepts appear in more than one table. Within each table, results are arranged by exploration stage and then listed alphabetically by company.
Additional information for each significant drill result is available in downloadable tables, with the tables in this publication a subset of the information provided.
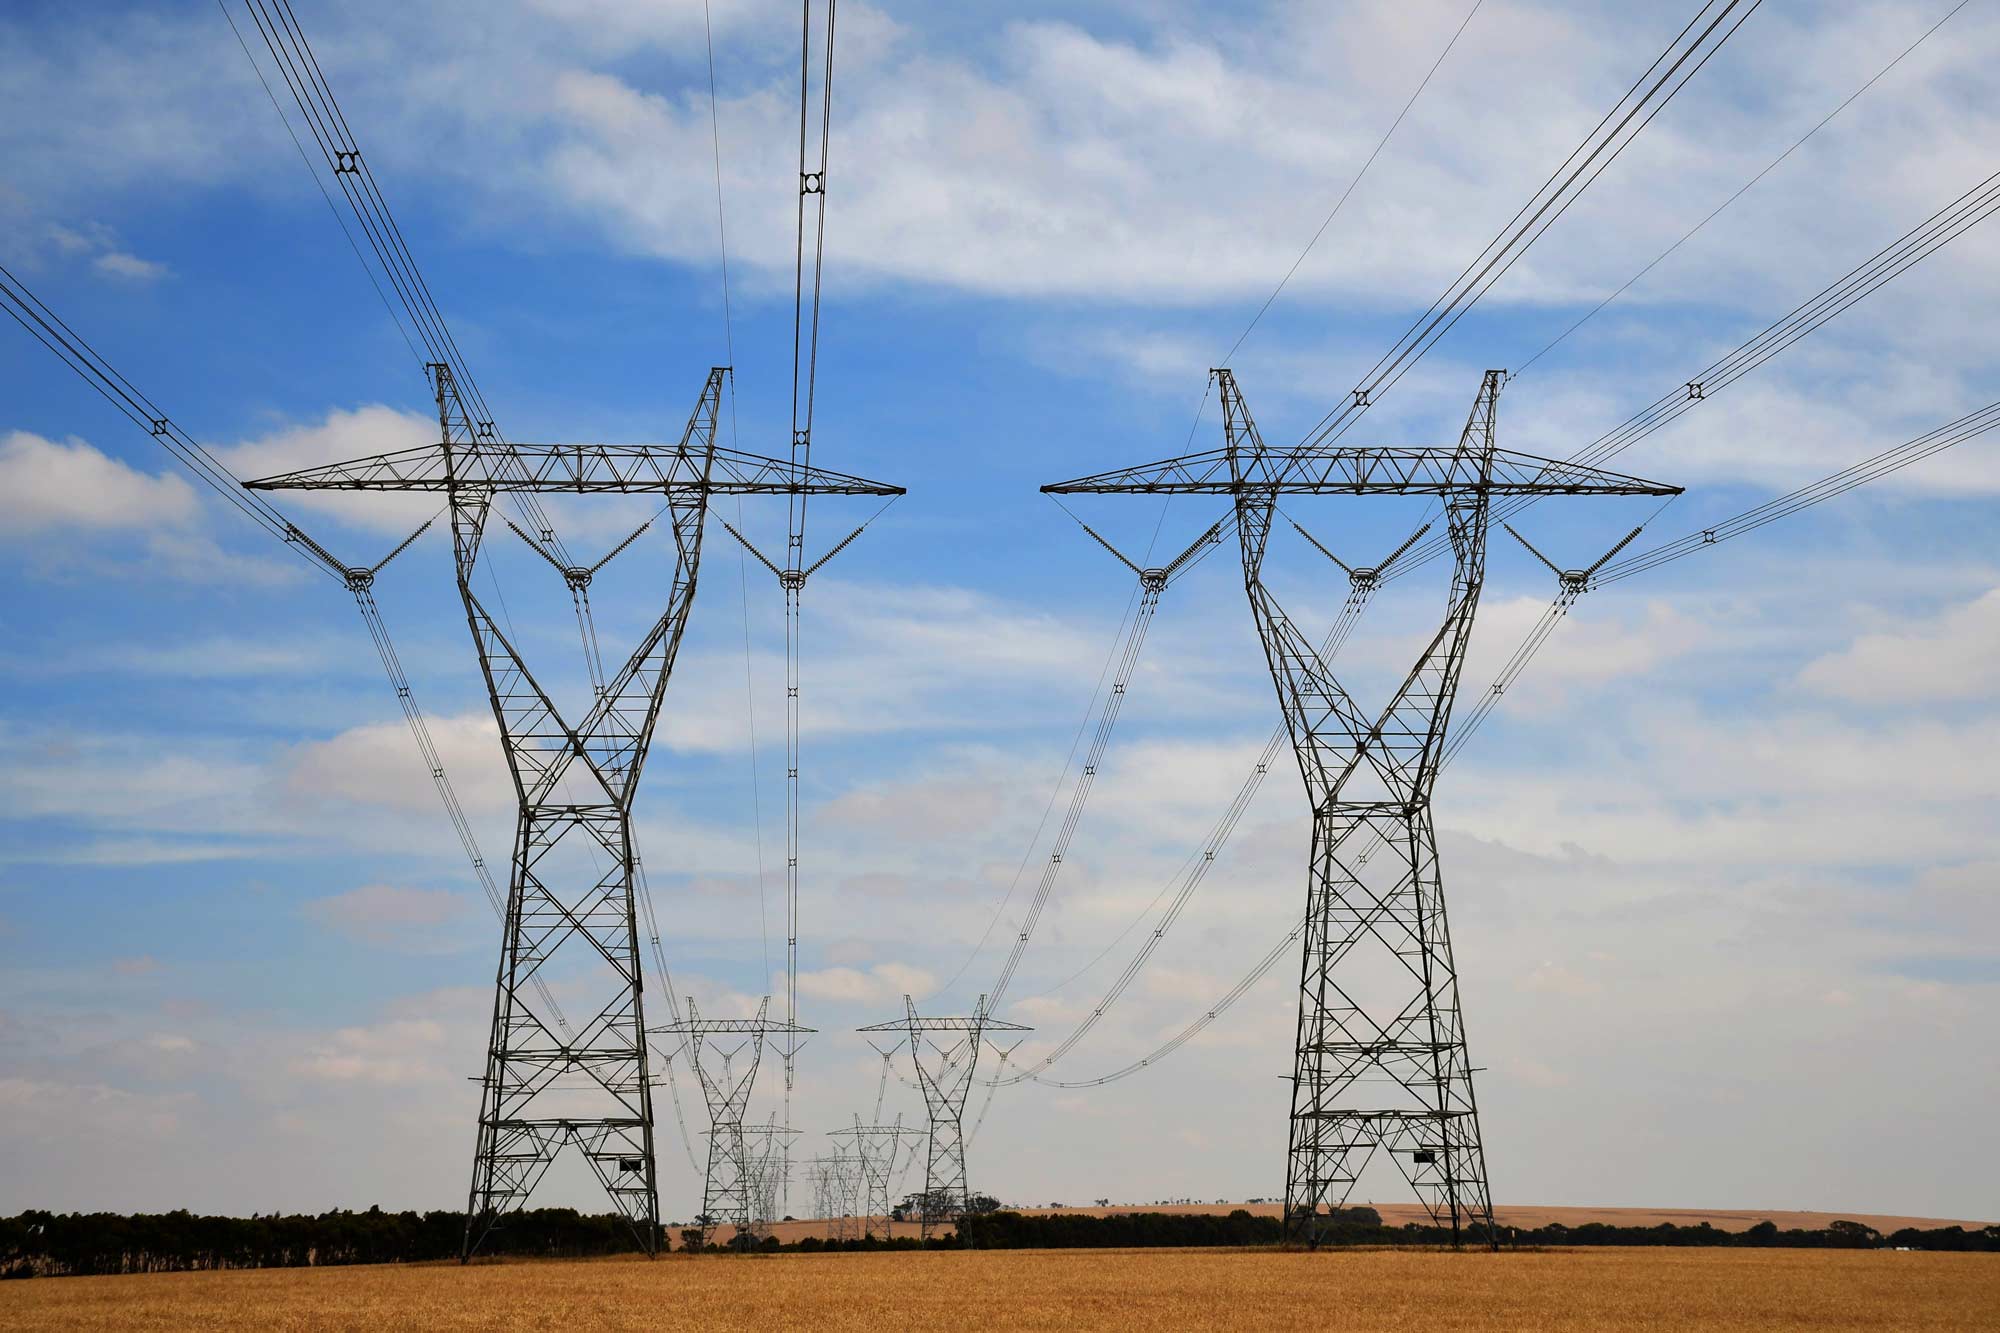
Power transmission networks depend on strategic materials, including copper for electrical conductivity, aluminium for lightweight conductors and zinc for galvanised steel structures that resist corrosion. These materials are essential to electricity infrastructure and the broader transition to net zero. Image Sourced from Outback to Coast via iStock.
Copper

*Data from Australian Bureau of Statistics, Mineral and Petroleum Exploration Australia (December 2025). Data are the ‘copper’ category. #Data from Geoscience Australia, Australia’s Identified Mineral Resources 2025.
Copper and copper-rich alloys are used extensively across a range of industries including electrical equipment, plumbing and industrial machinery manufacturing. Australian copper exploration activity decreased in 2025, despite an increase in global demand52. In 2024, Australia accounted for a 3% share of global copper production and 11% of known copper resources53.
Copper is listed as a strategic material by the Australian Government (Figure 1). In Australia, it is usually found and produced with other commodities in polymetallic deposits, some of which also contain critical minerals, such as antimony, cobalt and PGE, and/or other strategic materials such as tin and zinc. Australian exploration and production are dominated by four types of deposit: iron-oxide-copper-gold deposits, sediment-hosted copper-cobalt deposits, porphyry copper deposits and volcanic-hosted massive sulphide deposits54. The polymetallic nature of the significant drill results that contain copper is evident by the results (Table 8) in that they show not only copper intercepts but also critical minerals such as cobalt and nickel as well as precious metals gold and silver.
Clusters of significant drill results are in regions well known for copper mineralisation. These include the Mount Isa-Cloncurry region in Queensland, the Cobar-central west region in New South Wales, together with the emerging Pilbara region in Western Australia and the historic Tennant Creek region in the Northern Territory (Figure 10). There are limited drill results in the Gawler Craton region in South Australia, however, this could be due to most of the drilling being used to expand known resources and, therefore, not being reported as exploration drilling results. This observation is also consistent with the maiden resources containing copper that were announced in 2025 (Figure 4). More early-stage and expansion projects were reported in 2025 than upgrade projects. This could be reflective of the strong copper mining sector in Australia with limited exploration reports coming from resource upgrades at operating mines.
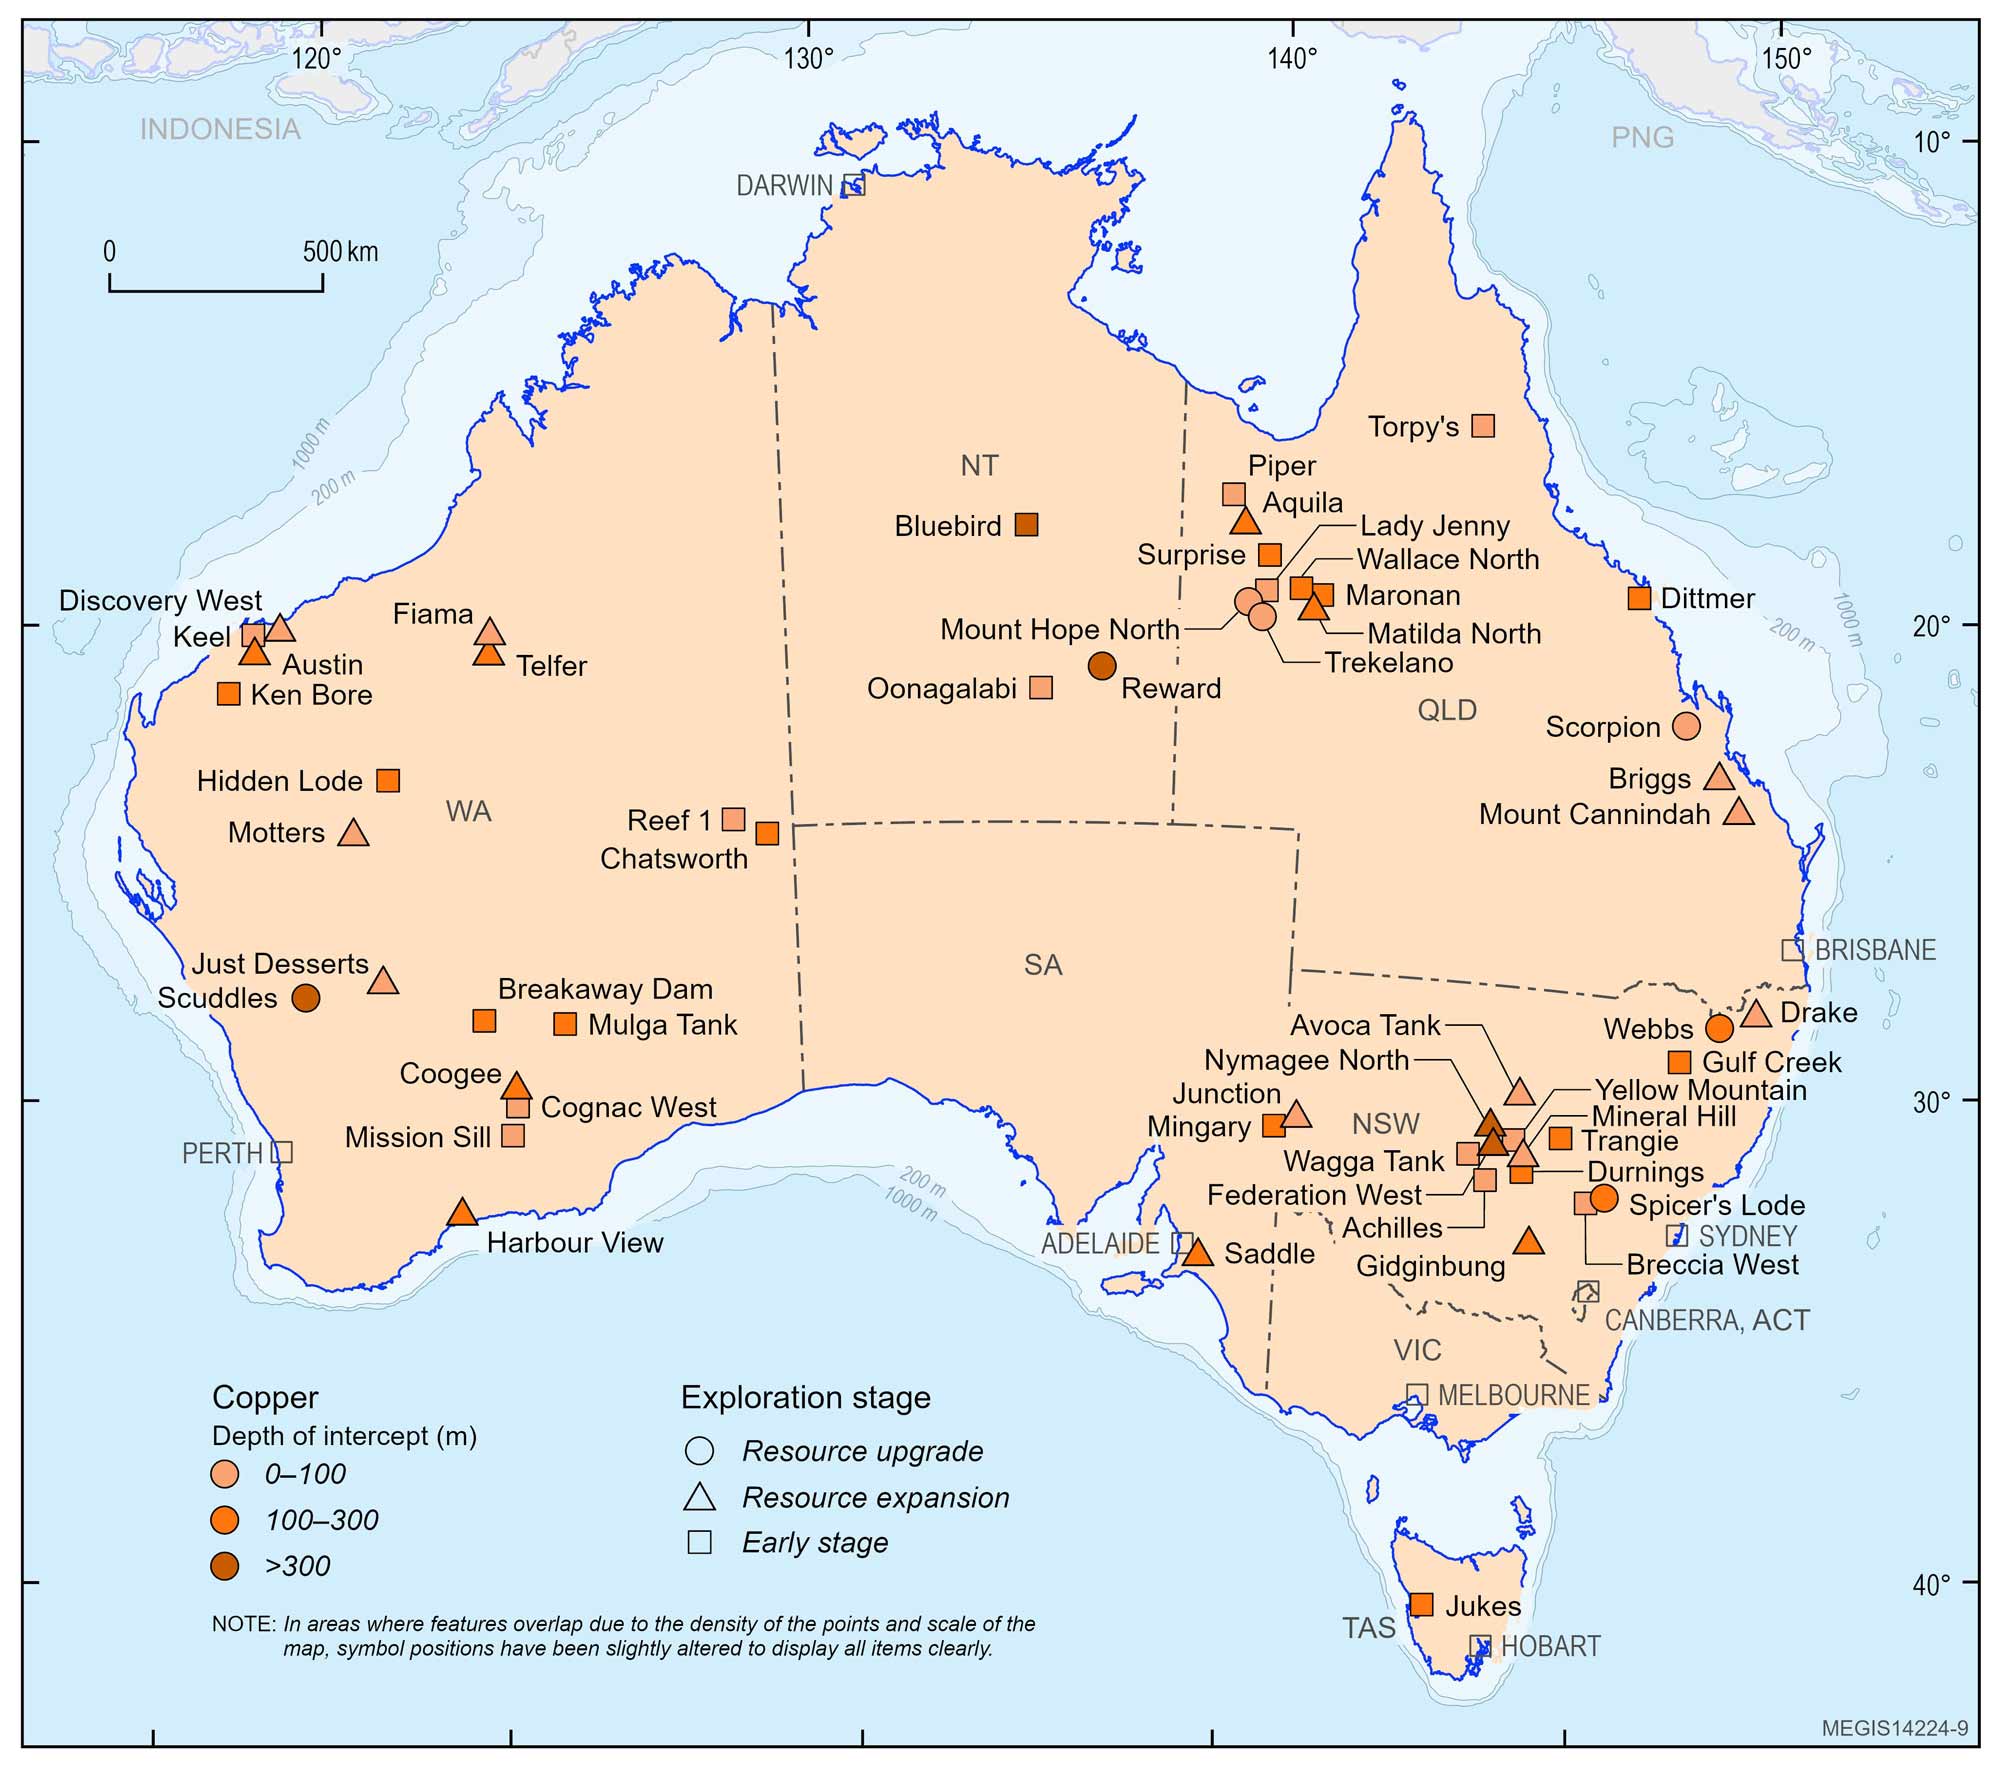
Figure 10. Location of significant drill results containing copper reported through the ASX (or equivalent) in 2025. Significant drill results are classified by exploration stage: Early stage refers to first-pass or follow-up drilling without a Mineral Resource estimate; Resource expansion refers to step-out or extensional drilling with a Mineral Resource estimate; and Resource upgrade includes infill drilling with a Mineral Resource estimate.
Table 8. Significant drill results containing copper reported through the ASX (or equivalent) in 2025. Company tickers are for the ASX unless otherwise stated.
| Company | Company Ticker | Deposit or Prospect | State | Intercept |
|---|---|---|---|---|
| Early-stage exploration drilling | ||||
| Alchemy Resources Ltd | ALY | Yellow Mountain | NSW | 113 m at 0.37 g/t Au, 24.3 g/t Ag, 0.33% Cu, 0.86% Pb, 1.23% Zn from 43 m |
| Antares Metals Ltd | AM5 | Surprise | QLD | 11 m at 1.8% Cu, 1.3g.t Au from 68 m |
| Aruma Resources Ltd | AAJ | Piper | QLD | 2 m at 1.67% Cu from 74 m |
| Australian Gold and Copper Ltd | AGC | Achilles | NSW | 42 m at 2.6 g/t Au, 12 g/t Ag, 0.1% Cu, 0.6% Pb, 0.1% Zn from 26 m |
| Ballymore Resources Ltd | BMR | Dittmer | QLD | 6.6 m at 13.67 g/t Au, 4.4 g/t Ag, 0.18% Cu from 139.4 m |
| Ballymore Resources Ltd | BMR | Torpy's | QLD | 6 m at 226.7 g/t Ag, 8.73% Pb, 7.58% Zn, 0.05% Cu, 6.51 g/t In from 87 m |
| CopperCorp Resources Inc. | CPER (TSXV) | Jukes | TAS | 12.6 m at 0.78% Cu, 0.15 g/t Au, 3.43 g/t Ag from 109.9 m |
| Dynamic Metals Ltd | DYM | Cognac West | WA | 5 m at 0.44% Cu from 60 m |
| Forrestania Resources Ltd | FRS | Breakaway Dam | WA | 8.7 m at 0.48% Cu, 0.02% Zn from 181.4 m |
| Galileo Mining Ltd | GAL | Mission Sill | WA | 52 m at 0.37 g/t Pd, 0.15 g/t Pt, 0.29 g/t Au, 0.16% Ni, 0.08% Cu from surface |
| Hammer Metals Ltd | HMX | Lady Jenny | QLD | 25 m at 1.05% Cu, 0.22 g/t Au from 14 m |
| Havilah Resources Ltd | HAV | Mingary | SA | 49 m at 0.69 g/t Au, 0.87 g/t Ag, 0.33% Cu from 122 m |
| Inflection Resources Ltd | AUCU (CSE) | Trangie | NSW | 54.37 m at 0.37 g/t Au, 0.07% Cu from 194.63 m |
| Litchfield Minerals Ltd | LMS | Oonagalabi | NT | 91 m at 0.9% Cu, 1.3% Zn, 0.1% Pb, 7 g/t Ag, 0.1 g/t Au from 8 m |
| Lord Resources Ltd | LRD | Hidden Lode | WA | 10 m at 0.59% Cu from 156 m |
| Maronan Metals Ltd | MMA | Maronan | QLD | 9.9 m at 0.51% Cu, 2.26 g/t Au, 7 g/t Ag from 237 m |
| OD6 Metals Ltd | OD6 | Gulf Creek | NSW | 8 m at 1.41% Cu, 1.26% Zn, 7.08 g/t Ag, 386 ppm Co from 108 m |
| Peel Mining Ltd | PEX | Wagga Tank | NSW | 119 m at 3.17% Cu, 0.38% Pb, 0.11% Zn, 15 g/t Ag, 1.49 g/t Au from 57 m |
| Raiden Resources Ltd | RDN | Keel | WA | 43 m at 0.22% Ni, 0.13% Cu, 136.35 ppm Co, 0.66 g/t Ag from 12 m |
| Red Hill Minerals Ltd | RHI | Ken Bore | WA | 2 m at 3.5% Cu from 260 m |
| Redstone Resources Ltd | RDS | Chatsworth | WA | 10 m at 1.37% Cu from 193 m |
| Talisman Mining Ltd | TLM | Durnings | NSW | 28 m at 0.32 g/t Au, 0.07% Cu, 0.1% Pb, 0.17% Zn, 1.06 g/t Ag from 156 m |
| Tennant Minerals Ltd | TMS | Bluebird | NT | 13 m at 0.15% Cu, 0.05 g/t Au, 45.5 g/t Bi from 381 m |
| Terra Metals Ltd | TM1 | Reef 1 | WA | 10 m at 17.96% TiO2, 0.11 g/t Au, 0.32 g/t Pt, 0.09 g/t Pd, 0.13% Cu, 42.1% Fe2O3, 0.65% V2O5, 0.1 g/t Ag, 0.01% Co, 0.03% Ni from surface |
| True North Copper Ltd | TNC | Wallace North | QLD | 15 m at 2.18% Cu, 1.76 g/t Au from 106 m |
| Waratah Minerals Ltd | WTM | Breccia West | NSW | 196 m at 0.35% Cu, 0.23 g/t Au from 1 m |
| Western Mines Group Ltd | WMG | Mulga Tank | WA | 1,247 m at 0.32% Ni, 134 ppm Co, 76 ppm Cu, 24 ppb Pt+Pd from 108 m |
| Resource expansion drilling | ||||
| Aeris Resources Ltd | AIS | Avoca Tank | NSW | 9.4 m at 8.87% Cu, 1.15 g/t Au, 38.1 g/t Ag from 63.5 m |
| AIC Mines Ltd | A1M | Matilda North | QLD | 9.75 m at 6.35% Cu, 1.0 g/t Au, 5.21 g/t Ag from 271 m |
| Antipa Minerals Ltd | AZY | Fiama | WA | 33 m at 15.76 g/t Au, 2,820 ppm Cu, 0.4 g/t Ag, 47 ppm Co from 96 m |
| Aurelia Metals Ltd | AMI | Nymagee North | NSW | 2.4 m at 2.7% Cu, 1.8 g/t Au, 3.6% Zn, 1.7% Pb, 95 g/t Ag from 567.1 m |
| Aurelia Metals Ltd | AMI | Federation West | NSW | 1.7 m at 25.3% Zn, 11% Pb, 0.2% Cu, 0.3 g/t Au, 54 g/t Ag from 425.5 m |
| Broken Hill Mines Ltd | BHM | Junction | NSW | 7.9 m at 921 g/t Ag, 18.8% Pb, 6.8% Zn, 0.1% Cu, 0.7 g/t Au from 57 m |
| Cannindah Resources Ltd | CAE | Mount Cannindah | QLD | 274 m at 0.35% Cu, 0.14 g/t Au, 5.9 g/t Ag from 82 m |
| Canterbury Resources Ltd | CBY | Briggs | QLD | 222.2 m at 0.26% Cu, 48 ppm Mo, 0.72 g/t Ag from 9 m |
| Empire Resources Ltd | ERL | Just Desserts | WA | 36 m at 1.16% Cu, 0.42 g/t Au from 20 m |
| Greatland Resources Ltd | GGP | Telfer | WA | 30 m at 5.6 g/t Au, 0.25% Cu from 281 m |
| GreenTech Metals Ltd | GRE | Austin | WA | 7.14 m at 1.46% Cu, 1.23% Zn, 0.08 g/t Au from 277.16 m |
| Hillgrove Resources Ltd | HGO | Saddle | SA | 14 m at 2.67% Cu, 0.36 g/t Au, 2.46 g/t Ag from 136 m |
| Horseshoe Metals Ltd | HOR | Motters | WA | 41 m at 1.23% Cu from surface |
| Javelin Minerals Ltd | JAV | Coogee | WA | 5 m at 14.22 g/t Au, 2.31% Cu from 143 m |
| Kingston Resources Ltd | KSN | Mineral Hill | NSW | 7.87 m at 30.8 g/t Au, 7 g/t Ag, 1.39% Cu, 0.07% Pb, 0.03% Zn from 58.65 m |
| Legacy Minerals Holdings Ltd | LGM | Drake | NSW | 95 m at 0.9 g/t Au, 1 g/t Ag, 504 ppm Cu, 59 ppm Pb, 3,462 ppm Zn from 2 m |
| LinQ Minerals Ltd | LNQ | Gidginbung | NSW | 31 m at 2.31 g/t Au, 0.12% Cu from 176 m |
| Medallion Metals Ltd | MM8 | Harbour View | WA | 6.5 m at 20.2 g/t Au, 5% Cu, 15.4 g/t Ag from 139.2 m |
| Sabre Resources Ltd | SBR | Discovery West | WA | 18 m at 0.25% Cu, 0.03 g/t Au, 133 ppm Co, 178 ppm Ni from 6 m |
| True North Copper Ltd | TNC | Aquila | QLD | 59 m at 1.77% Cu, 0.04% Co, 5.2 g/t Ag from 134 m |
| Resource upgrade drilling | ||||
| 29Metals Ltd | 29M | Scuddles | WA | 80.4 m at 3.9% Cu, 0.2% Zn, 0.5 g/t Au, 22 g/t Ag from 600.3 m |
| Carnaby Resources Ltd | CNB | Trekelano | QLD | 50 m 0.9% Cu, 0.2 g/t Au from surface |
| Carnaby Resources Ltd | CNB | Mount Hope North | QLD | 15 m at 2.1% Cu, 0.2 g/t Au from 33 m |
| Godolphin Resources Ltd | GRL | Spicer's Lode | NSW | 39.9 m at 1.08 g/t Au, 52.8 g/t Ag, 0.11% Cu, 1.19% Pb, 2.18% Zn from 135.3 m |
| KGL Resources Ltd | KGL | Reward | NT | 7.5 m at 2.24% Cu, 15.4 g/t Ag, 0.17 g/t Au, 0.14% Pb, 0.65% Zn from 376.48 m |
| QMines Ltd | QML | Scorpion | QLD | 114 m at 1.64% Cu, 0.86% Zn, 0.3 g/t Au, 13.1 g/t Ag from 11 m |
| Rapid Critical Metals Ltd | RCM | Webbs | NSW | 17.4 m at 205 g/t Ag, 0.13% Cu, 1.43% Pb, 1.49% Zn from 115.8 m |
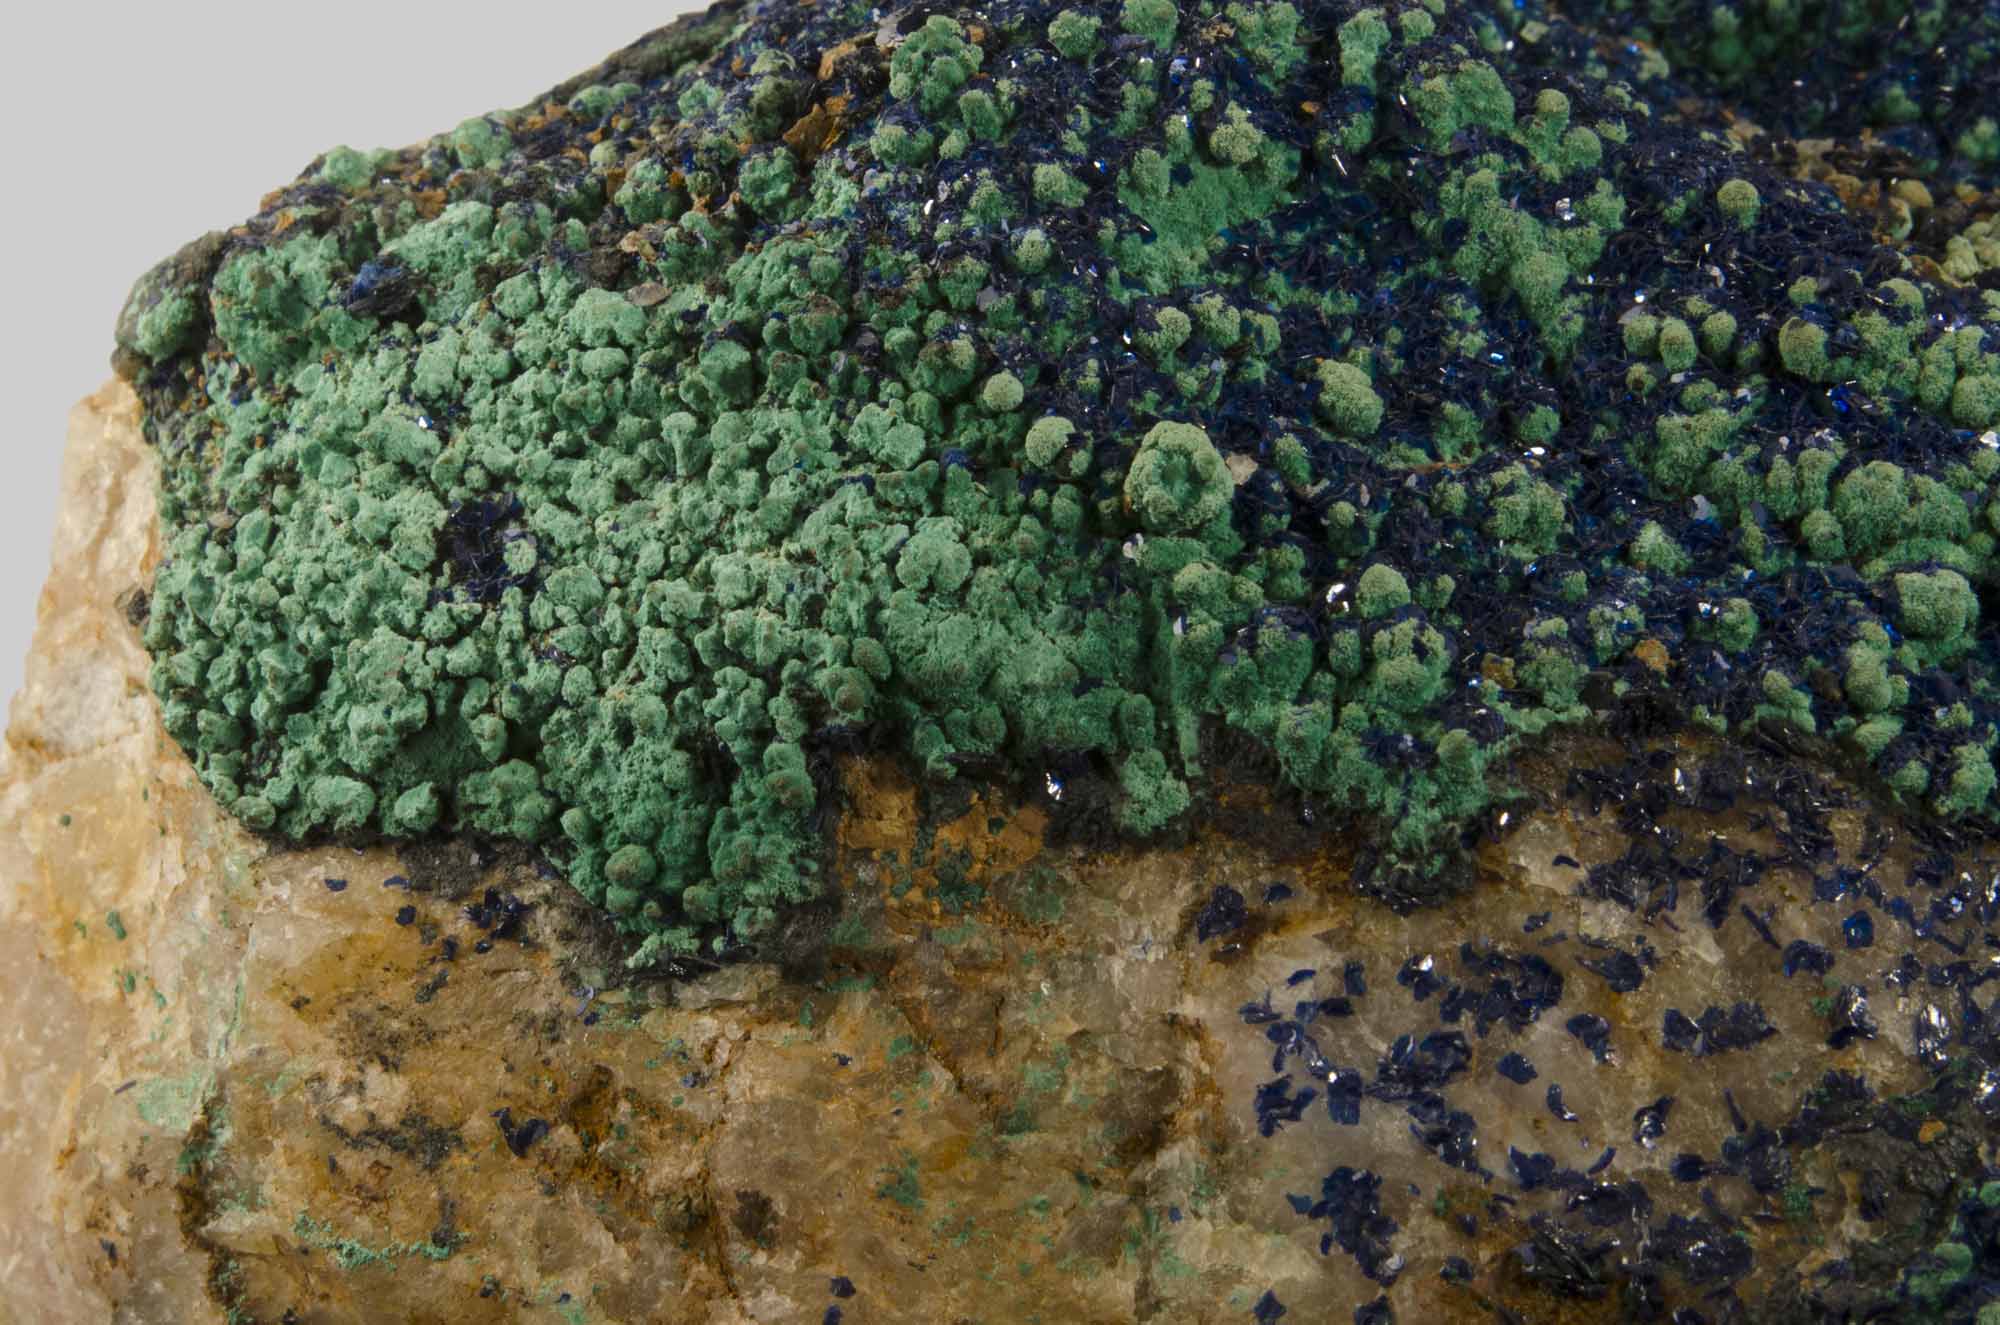
Malachite (green) and azurite (blue) -bearing copper mineral specimen from near Cloncurry, Queensland. Copper commonly occurs in minerals such as these, and is an imporant strategic material used in electrical equipment, plumbing, industrial machinery and renewable energy infrastructure. Continued exploration for copper supports the supply of materials needed for electrification, construction and advanced technologies. Image courtesy of Geoscience Australia National Mineral and Fossil Collection.
Lead and zinc

*Data from Australian Bureau of Statistics, Mineral and Petroleum Exploration Australia (December 2025. All data are the ‘lead-zinc-silver’ category. #Data from Geoscience Australia, Australia’s Identified Mineral Resources 2025.
Lead and zinc are key base metals with distinct but complementary uses across industry and the energy transition. Lead is primarily used in batteries, with over 80% of global lead consumption going into lead–acid batteries55 for vehicles and energy storage, alongside smaller uses in shielding, cables and construction materials. In contrast, zinc is mainly used for galvanising steel, where it protects infrastructure, including renewable energy technologies, from corrosion. This accounts for roughly half to over 50% of global zinc demand56 as well as in alloys (e.g. brass), chemical production and emerging battery technologies.
In Australia, lead and zinc occur in several deposit types including sediment-hosted base metal deposits and volcanic-hosted massive sulphide deposits. Australia is a major global producer and exporter of both lead and zinc, with production concentrated in a few world-class provinces. The industry is centred on northwest Queensland (Mount Isa region) and Broken Hill in New South Wales. Australia holds 36% of the world’s lead resources and 27% of world zinc resources57. Lead, mainly in the form of the mineral galena, is usually associated with zinc, silver and sometimes copper, and is extracted as a co-product alongside these metals.
The significant drill results containing lead and zinc shown in Figure 11 reveal that there is limited reported exploration in the world-class Broken Hill and Mount Isa provinces. Projects at varying stages are clustered in central New South Wales in the Cobar Region which has historically produced lead and zinc as well as copper, gold and silver. Most of these significant drill results are polymetallic as shown in Table 9. New discoveries of lead and zinc occurrences dominate the results with early-stage projects occurring in four jurisdictions.
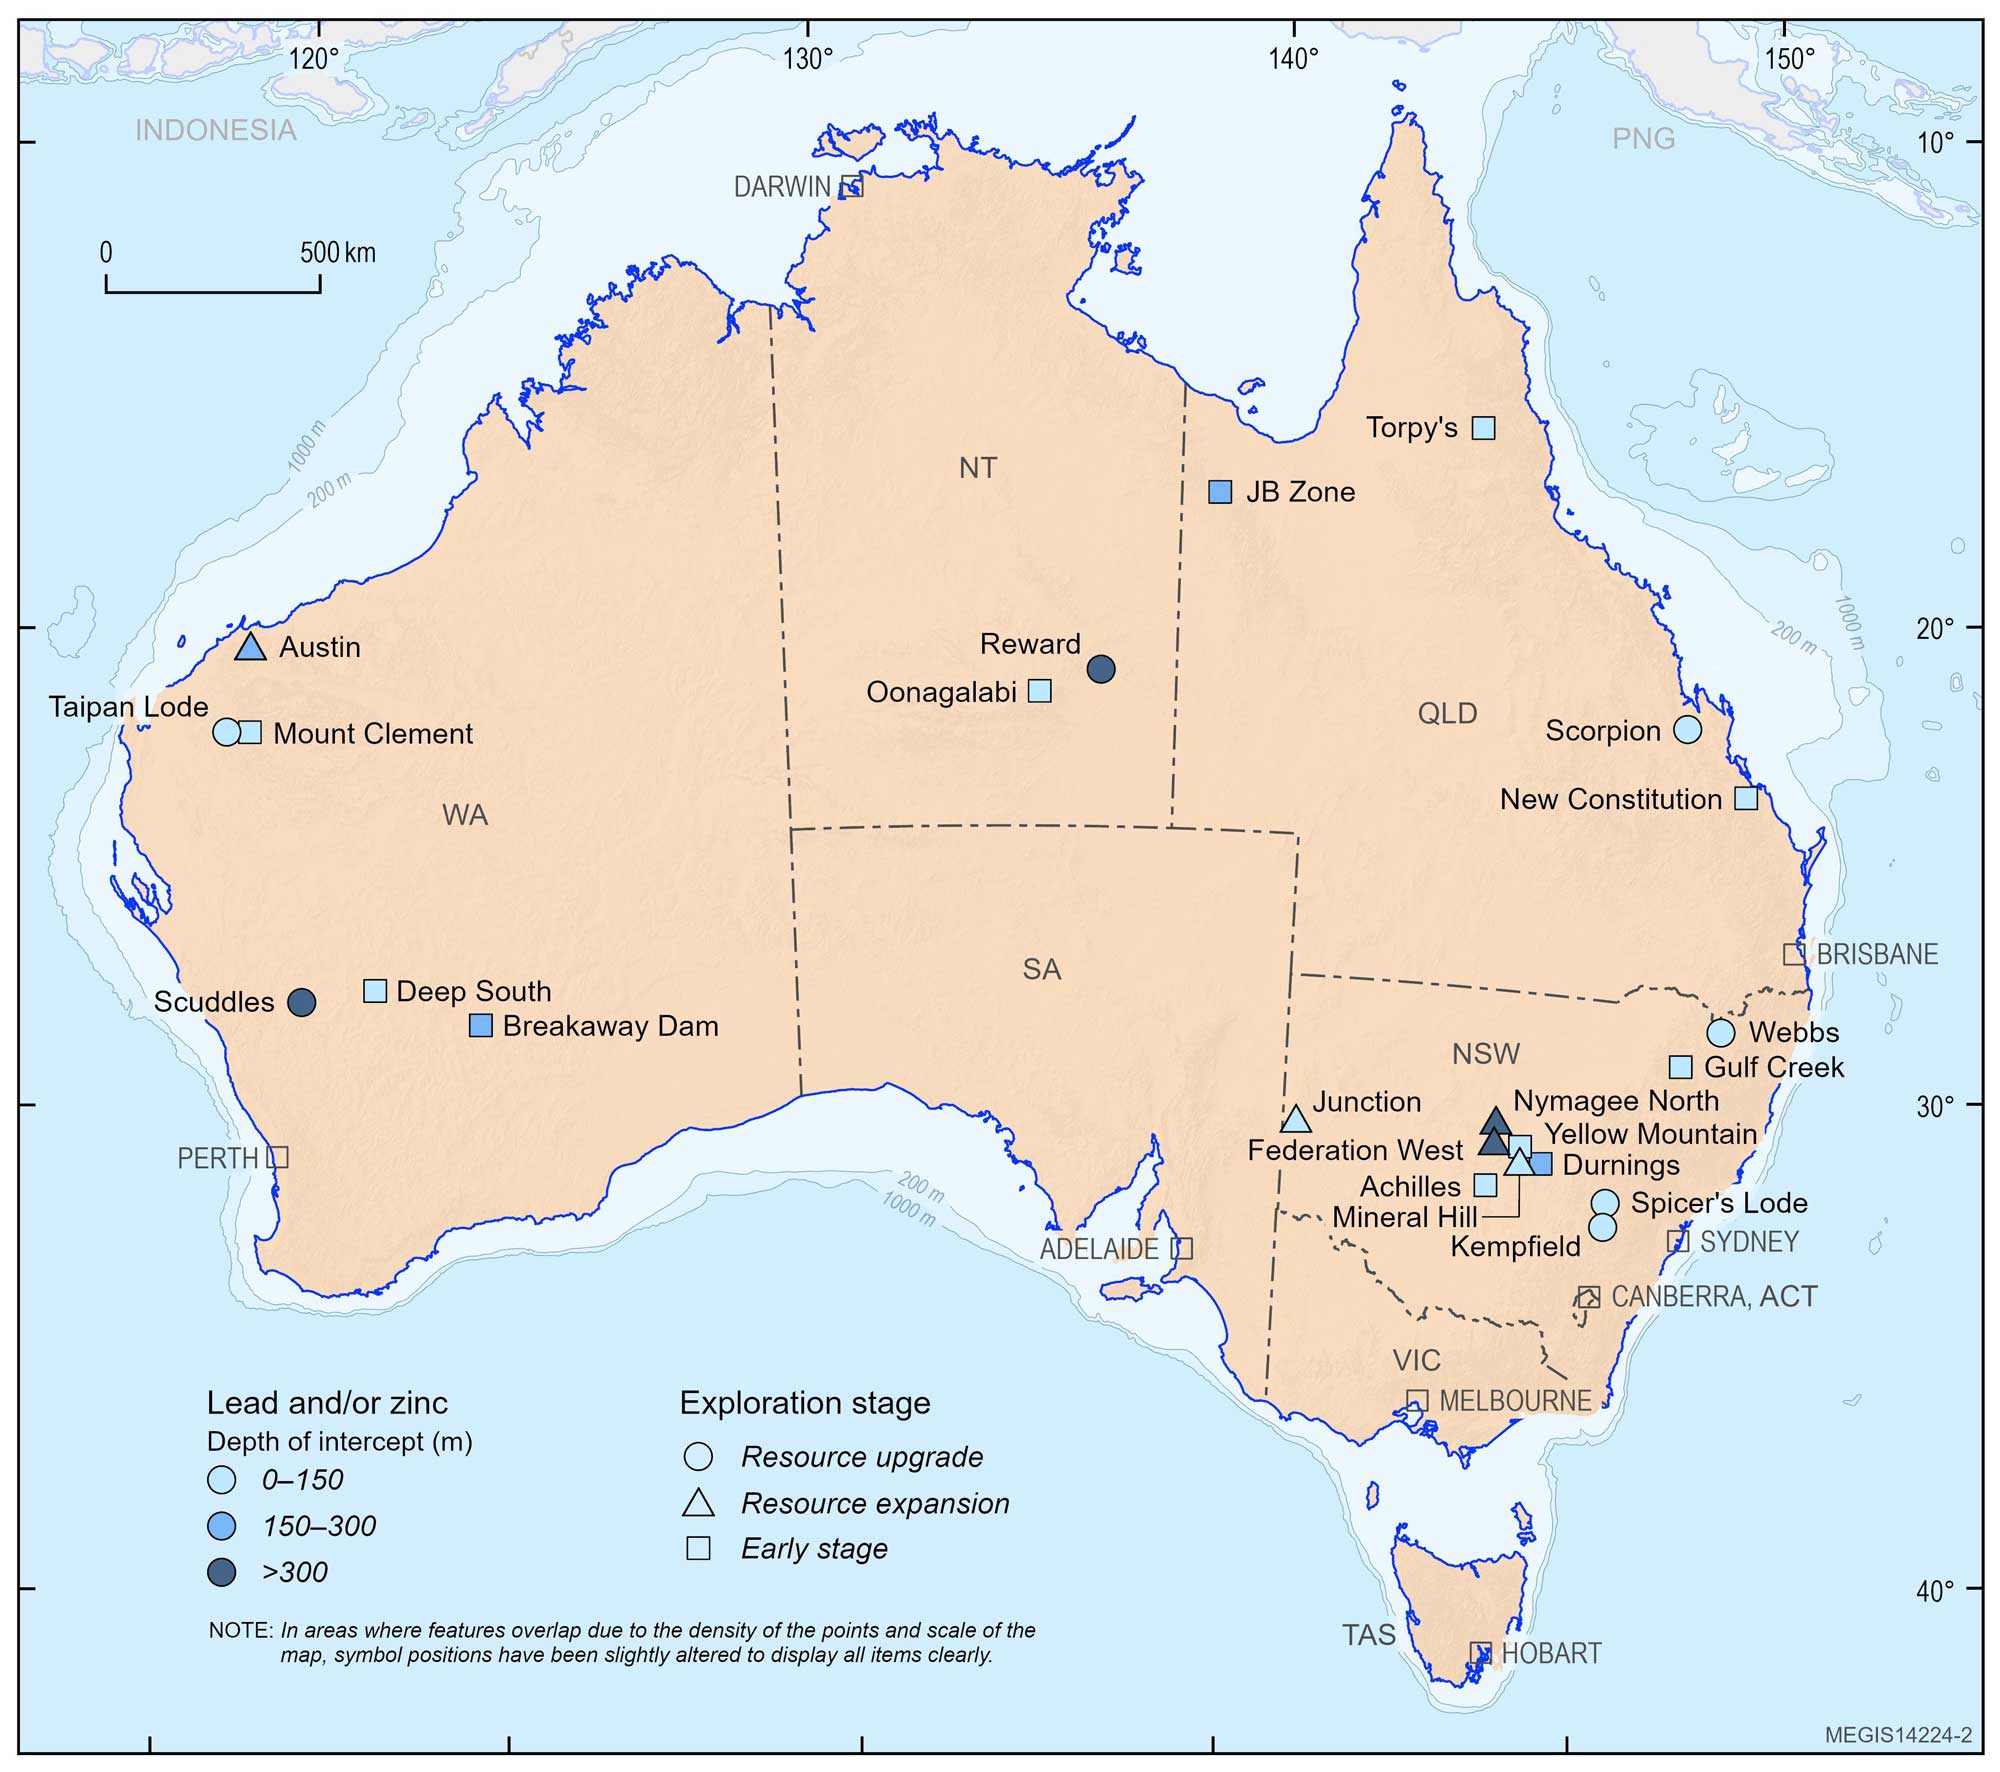
Figure 11. Significant drill results containing lead and zinc reported through the ASX (or equivalent) in 2025. Significant drill results are classified by exploration stage: Early stage refers to first-pass or follow-up drilling without a Mineral Resource estimate; Resource expansion refers to step-out or extensional drilling with a Mineral Resource estimate; and Resource upgrade includes infill drilling with a Mineral Resource estimate.
Table 9. Significant drill results containing lead and zinc reported through the ASX (or equivalent) in 2025. Company tickers are for the ASX unless otherwise stated.
| Company | Company Ticker | Deposit or Prospect | State | Intercept |
|---|---|---|---|---|
| Early-stage exploration drilling | ||||
| Alchemy Resources Ltd | ALY | Yellow Mountain | NSW | 113 m at 0.37 g/t Au, 24.3 g/t Ag, 0.33% Cu, 0.86% Pb, 1.23% Zn from 43 m |
| Australian Gold and Copper Ltd | AGC | Achilles | NSW | 42 m at 2.6 g/t Au, 12 g/t Ag, 0.1% Cu, 0.6% Pb, 0.1% Zn from 26 m |
| Ballymore Resources Ltd | BMR | Torpy's | QLD | 6 m at 226.7 g/t Ag, 8.73% Pb, 7.58% Zn, 0.05% Cu, 6.51 g/t In from 87 m |
| Dart Mining NL | DTM | New Constitution | QLD | 10.5 m at 2.63 g/t Au, 12.21 g/t Ag, 1.94% Zn from 68.6 m |
| Forrestania Resources Ltd | FRS | Breakaway Dam | WA | 8.7 m at 0.48% Cu, 0.02% Zn from 181.4 m |
| Litchfield Minerals Ltd | LMS | Oonagalabi | NT | 91 m at 0.9% Cu, 1.3% Zn, 0.1% Pb, 7 g/t Ag, 0.1 g/t Au from 8 m |
| Marquee Resources Ltd | MQR | Mount Clement | WA | 8 m at 1.05% Sb, 2.85% Pb from 137 m |
| OD6 Metals Ltd | OD6 | Gulf Creek | NSW | 8 m at 1.41% Cu, 1.26% Zn, 7.08 g/t Ag, 386 ppm Co from 108 m |
| Rubix Resources Ltd | RB6 | JB Zone | QLD | 70.5 m at 1.35% Zn, 0.38% Pb, 4.23 g/t Ag from 173.5 m |
| Talisman Mining Ltd | TLM | Durnings | NSW | 28 m at 0.32 g/t Au, 0.07% Cu, 0.1% Pb, 0.17% Zn, 1.06 g/t Ag from 156 m |
| Venus Metals Corporation Ltd | VMC | Deep South | WA | 19 m at 2.63% Zn, 19.32 g/t In from 49 m |
| Resource expansion drilling | ||||
| Aurelia Metals Ltd | AMI | Nymagee North | NSW | 2.4 m at 2.7% Cu, 1.8 g/t Au, 3.6% Zn, 1.7% Pb, 95 g/t Ag from 567.1 m |
| Aurelia Metals Ltd | AMI | Federation West | NSW | 1.7 m at 25.3% Zn, 11% Pb, 0.2% Cu, 0.3 g/t Au, 54 g/t Ag from 425.5 m |
| Broken Hill Mines Ltd | BHM | Junction | NSW | 7.9 m at 921 g/t Ag, 18.8% Pb, 6.8% Zn, 0.1% Cu, 0.7 g/t Au from 57 m |
| GreenTech Metals Ltd | GRE | Austin | WA | 7.14 m at 1.46% Cu, 1.23% Zn, 0.08 g/t Au from 277.16 m |
| Kingston Resources Ltd | KSN | Mineral Hill | NSW | 7.87 m at 30.8 g/t Au, 7 g/t Ag, 1.39% Cu, 0.07% Pb, 0.03% Zn from 58.65 m |
| Resource upgrade drilling | ||||
| 29Metals Ltd | 29M | Scuddles | WA | 80.4 m at 3.9% Cu, 0.2% Zn, 0.5 g/t Au, 22 g/t Ag from 600.3 m |
| Argent Minerals Ltd | ARD | Kempfield | NSW | 200.8 m at 61.9 g/t Ag, 0.1 g/t Au, 0.43% Pb, 1.55% Zn from 33.4 m |
| Black Cat Syndicate Ltd | BC8 | Taipan Lode | WA | 12.45 m at 1.15% Sb, 1.51% Pb, 16.1 g/t Ag from 80 m |
| Godolphin Resources Ltd | GRL | Spicer's Lode | NSW | 39.9 m at 1.08 g/t Au, 52.8 g/t Ag, 0.11% Cu, 1.19% Pb, 2.18% Zn from 135.3 m |
| KGL Resources Ltd | KGL | Reward | NT | 7.5 m at 2.24% Cu, 15.4 g/t Ag, 0.17 g/t Au, 0.14% Pb, 0.65% Zn from 376.48 m |
| QMines Ltd | QML | Scorpion | QLD | 114 m at 1.64% Cu, 0.86% Zn, 0.3 g/t Au, 13.1 g/t Ag from 11 m |
| Rapid Critical Metals Ltd | RCM | Webbs | NSW | 17.4 m at 205 g/t Ag, 0.13% Cu, 1.43% Pb, 1.49% Zn from 115.8 m |

Lead and zinc have played major, albeit vastly different, roles in the protection of the Sydney Harbour Bridge as well as the roofs in Sydney. Lead was heavily used in the bridge's original 1930s paint but is currently undergoing a massive, sealed removal due to the paint’s toxicity, while zinc is actively used in modern coatings as a sacrificial primer to protect the structure's steelwork from rusting. While lead is traditionally favoured for heritage restorations, box gutters, and flashings, while zinc is an increasingly popular, premium roofing and cladding material. Image Sourced from Belle Co via pexels.com.
Other strategic materials

*Data from Australian Bureau of Statistics, Mineral and Petroleum Exploration Australia (December 2025). Data are from combined ‘copper’ and ‘silver-lead-zinc’ categories. #Data from Geoscience Australia, Australian Operating Mines Map 2025 (see Appendix C).
Significant drill results for strategic materials, other than copper, lead and zinc, were also reported in Australia in 2025. These included bauxite (the major ore for aluminium), tin and phosphorus. These were in small numbers and, as such, are grouped together in Figure 12. Further information about each significant drill result is detailed in Table 10. The continued exploration for these strategic materials is important to industrial capability and emerging supply chains, while also demonstrating Australia’s continued commitment to foundational commodities.
Bauxite is refined to alumina and then smelted into aluminium. Aluminium is an essential component of modern life, widely used in construction, transport, packaging, electrical systems and renewable energy technologies due to its lightweight, corrosion resistance and recyclability. Australia plays a critical role in global aluminium supply as one of the world’s largest producers of bauxite, contributing around a quarter of global production58.
Phosphate rock (a phosphorus ore) is mainly mined to produce fertilisers for agriculture, but it is also an important source of phosphorus used in lithium-iron-phosphate batteries, which are common in electric vehicles. Phosphate is generally sourced from phosphorite, a marine sedimentary deposit, or from guano, which is an accumulation of bird or bat excrement. Australia contributes more modestly to global phosphate supply, producing around 1% of phosphate annually and ranking outside the major global producers59.
Tin is primarily used in solders for electronics and joining metals and pipes, as a coating for steel cans and in metal alloys. Australia plays a relatively small but notable role in global tin supply, producing around 4% of the world’s tin60. It typically occurs in granite-related deposits or carbonate-replacement systems, such as those found in western Tasmania.
Exploration for tin in New South Wales yielded three significant drilling results in 2025, with projects of all stages present. A resource upgrade project in Tasmania also yielded a significant tin result. There was one aluminium result in a resource upgrade project and two phosphorus projects in northern Western Australia (Figure 12). Six of the seven drilling results described in Table 10, have a Mineral Resource identified.
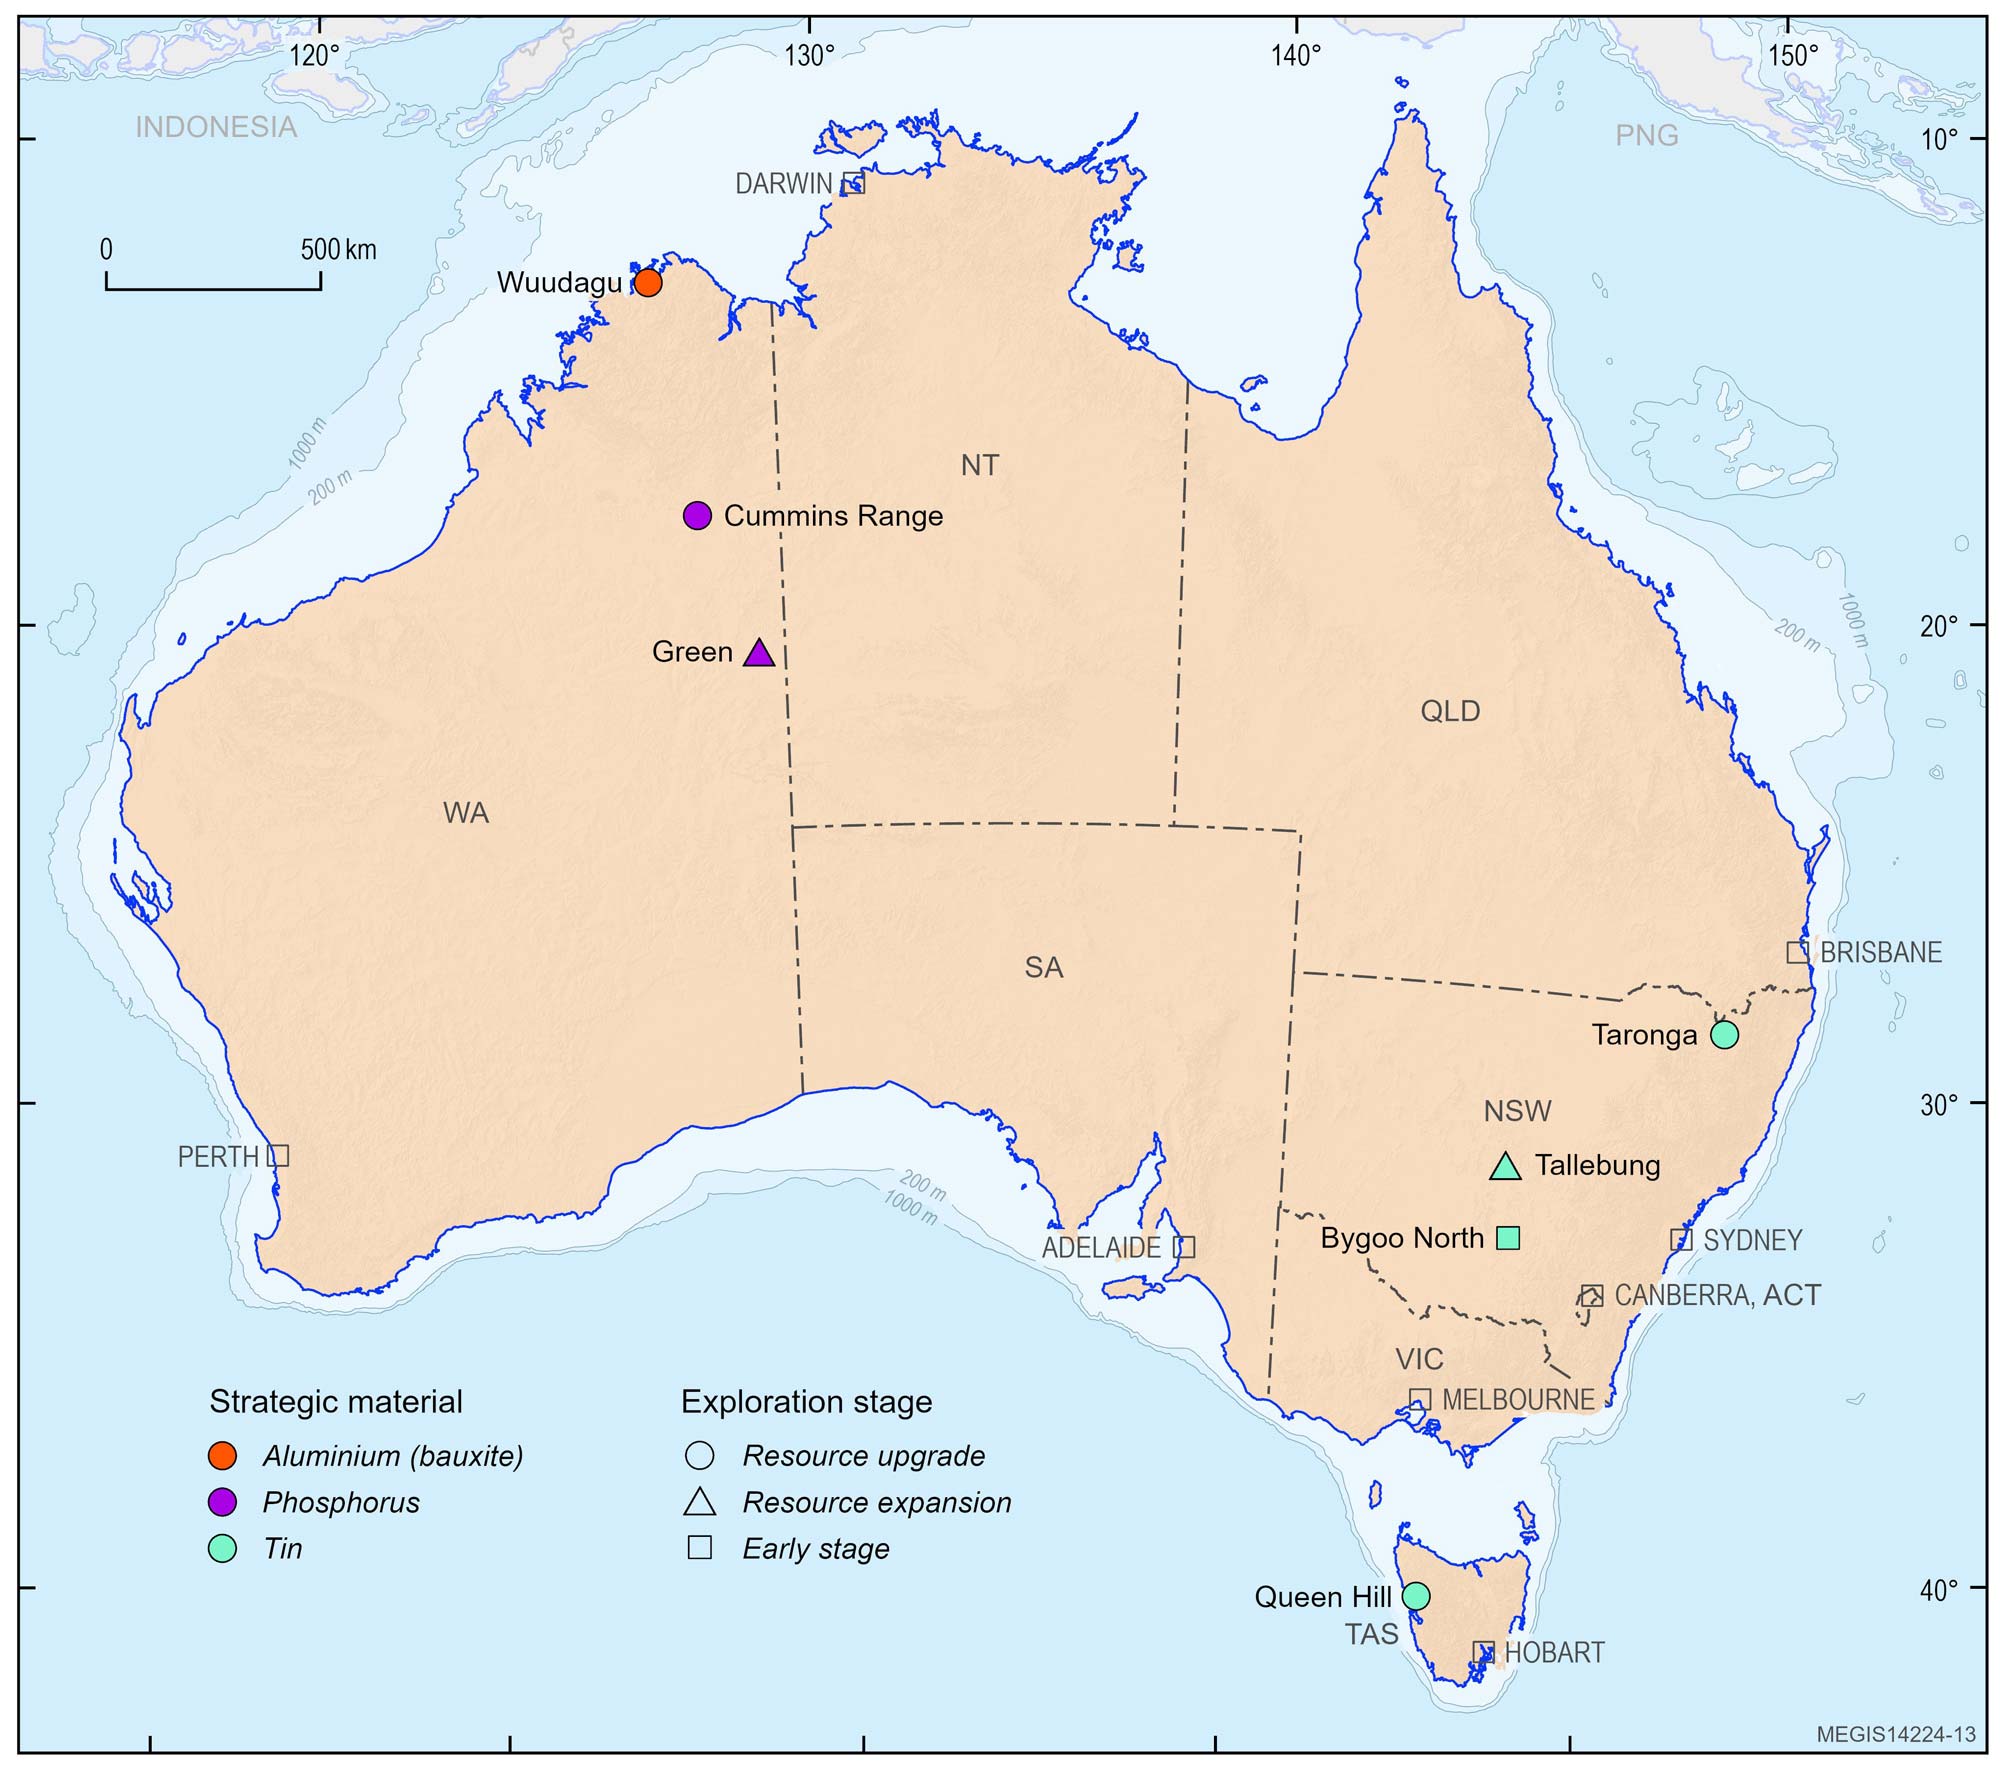
Figure 12. Location of significant drill results in 2025 containing strategic materials (not listed elsewhere in this report) reported through the ASX (or equivalent) in 2025. Significant drill results are classified by exploration stage: Early stage refers to first-pass or follow-up drilling without a Mineral Resource estimate; Resource expansion refers to step-out or extensional drilling with a Mineral Resource estimate; and Resource upgrade includes infill drilling with a Mineral Resource estimate.
Table 10. Significant drill results containing the strategic materials not listed elsewhere in this review, reported through the ASX (or equivalent) in 2025. Company tickers are for the ASX unless otherwise stated.
| Company | Company Ticker | Deposit or Prospect | State | Intercept |
|---|---|---|---|---|
| Early-stage exploration drilling | ||||
| Caspin Resources Ltd | CPN | Bygoo North | NSW | 118 m at 0.32% Sn from 44 m |
| Resource expansion drilling | ||||
| Sky Metals Ltd | SKY | Tallebung | NSW | 40 m at 0.24% Sn, 0.04% W, 26.6 g/t Ag from 31 m |
| Encounter Resources Ltd | ENR | Green | WA | 18 m at 1.28% Nb2O5, 0.49% TREO, 6.6% P2O5 from 45 m |
| Resource upgrade drilling | ||||
| VBX Ltd | VBX | Wuudagu C | WA | 7 m at 50.6% Al2O3, 8.9% SiO2 from 1 m |
| RareX Ltd | REE | Cummins Range | WA | 115 m at 146.0 g/t Ga2O3, 3.4% TREO, 369.0 g/t Sc2O3, 0.42% Nb2O5, 8% P2O5 from 22 m |
| First Tin Plc | 1SN (LSE) | Taronga | NSW | 71 m at 0.09% Sn from surface |
| Stellar Resources Ltd | SRZ | Queen Hill | TAS | 8 m at 1.42% Sn, 0.01% Cu from 341 m |
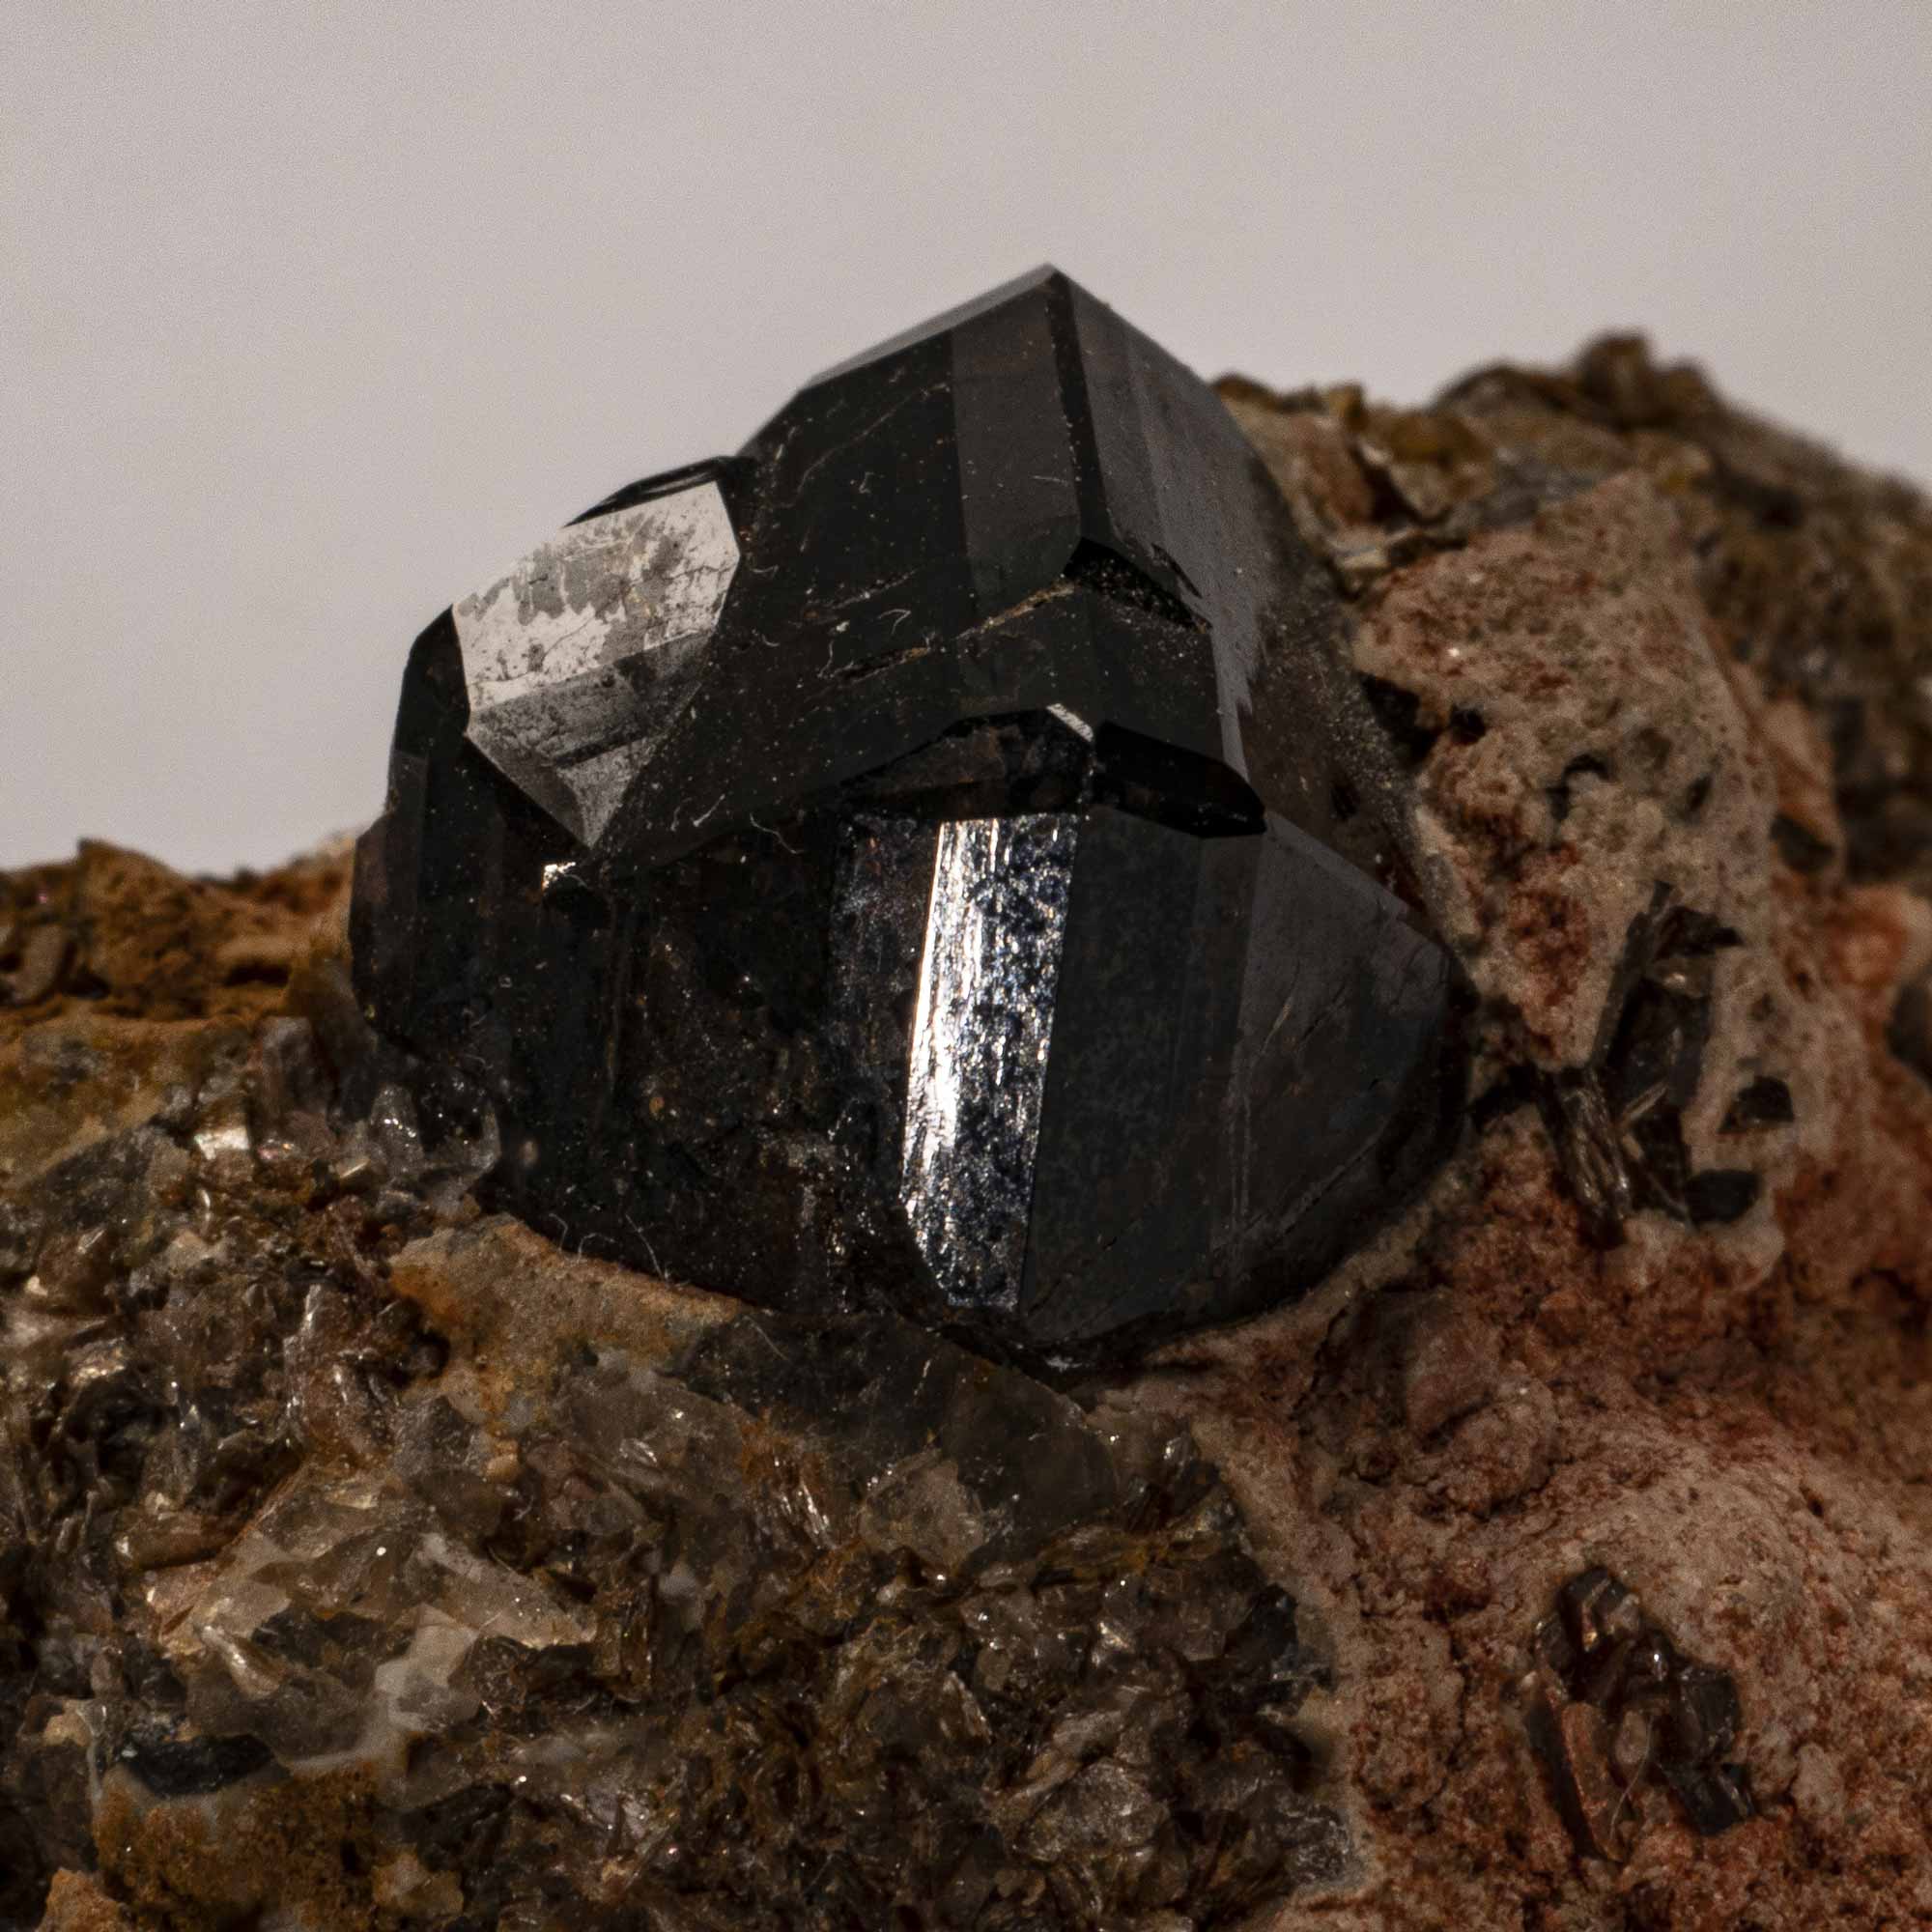
Cassiterite (dark mineral) from Queensland. Cassiterite is the principal ore mineral of tin, a strategic material used in solder, electronic circuits, protective coating and industrial alloys. Continued exploration for tin supports supply chains for electronics, advanced manufacturing and clean-energy technologies. Image courtesy of Geoscience Australia National Mineral and Fossil Collection.
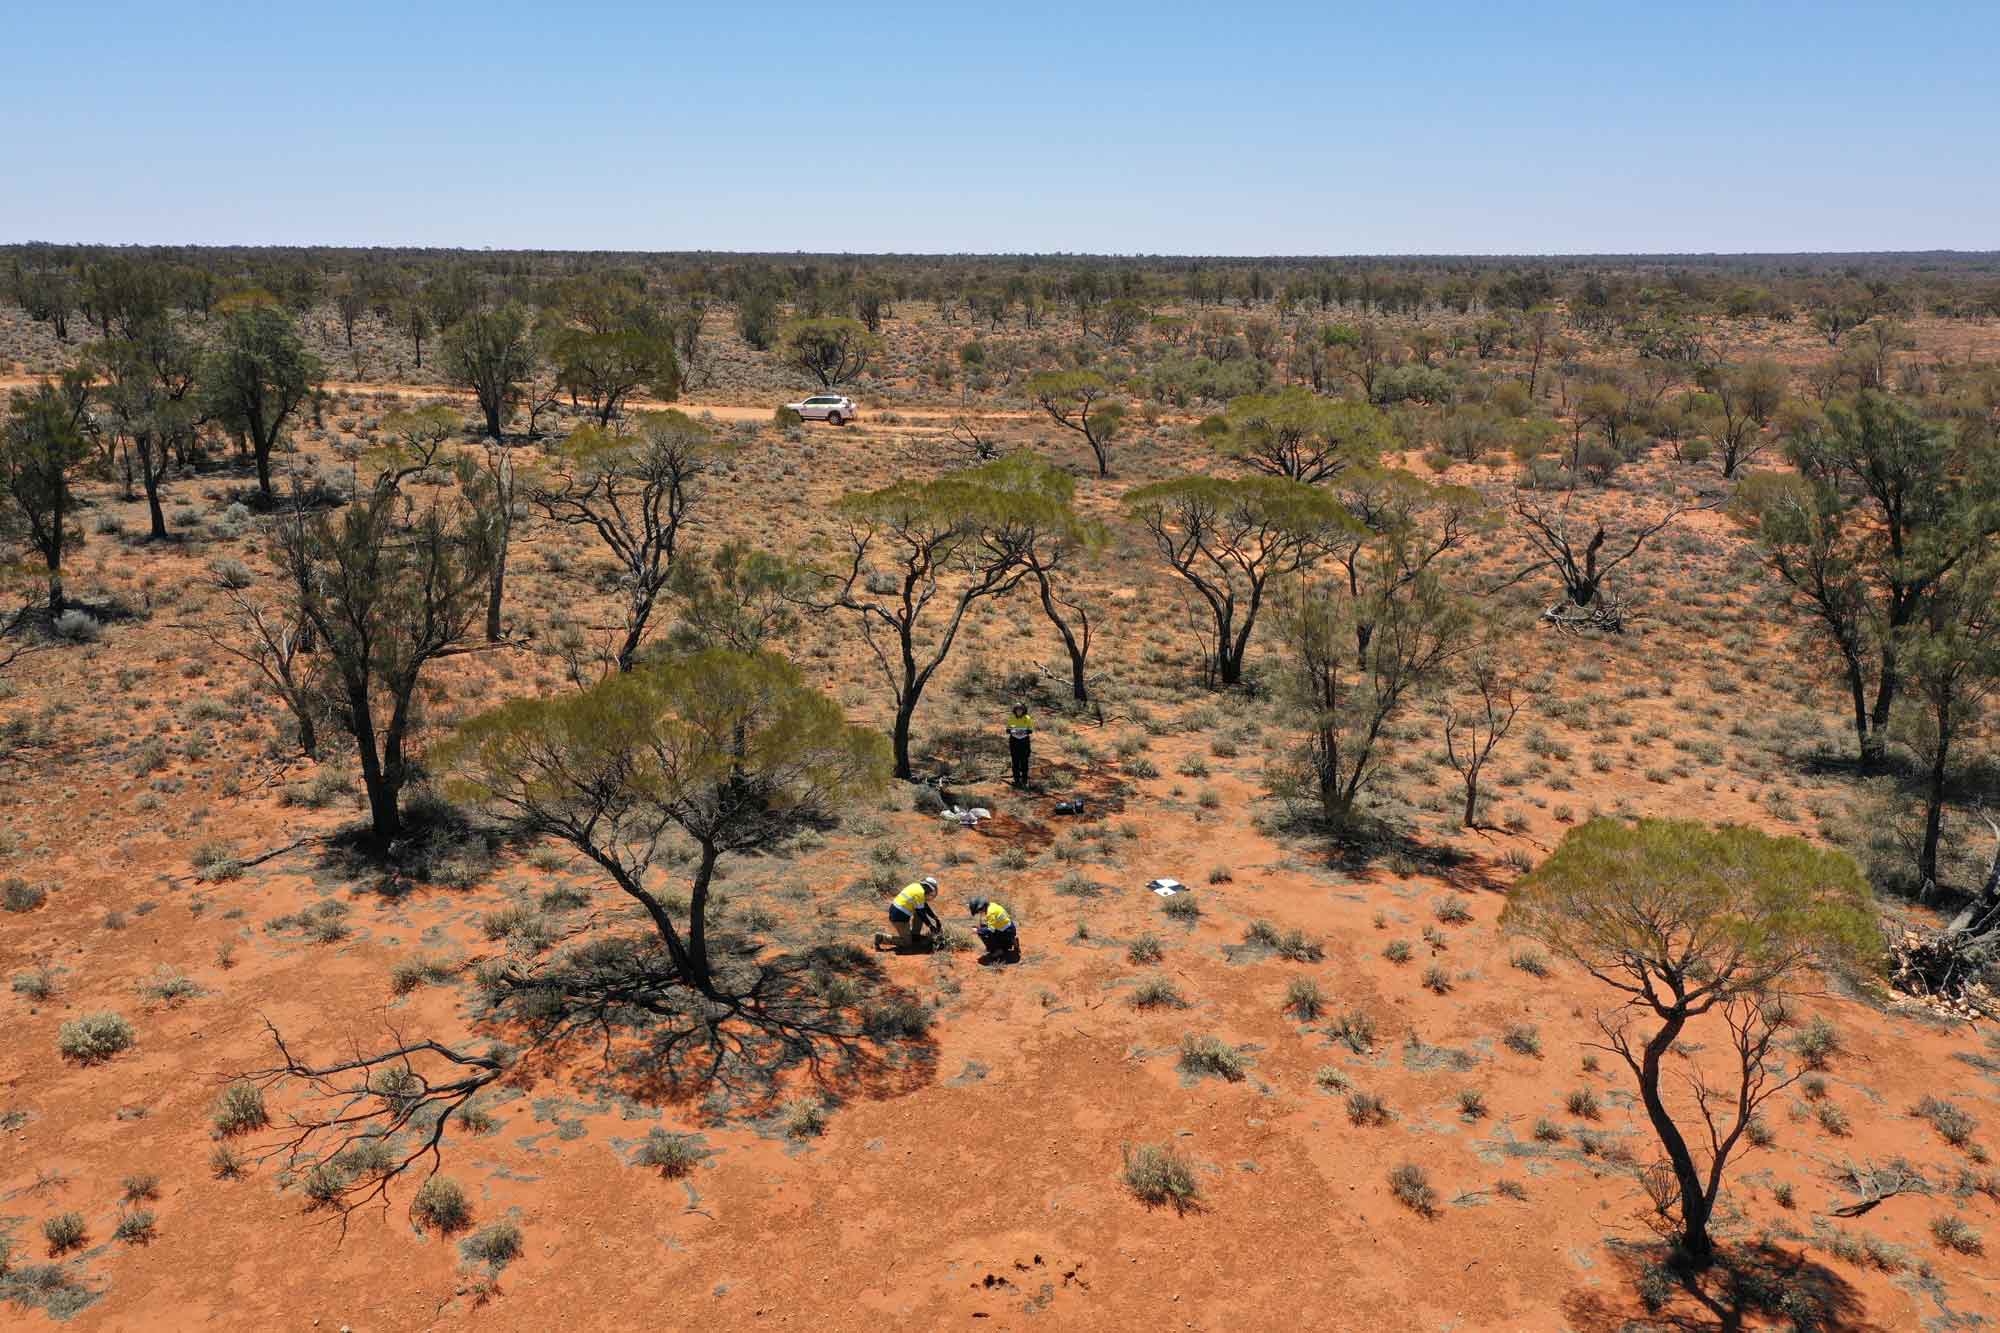
Field mapping and sampling provide the essential ground-truth foundation for mineral exploration. By combining direct observation of rock outcrops with physical sampling, geologists accurately delineate ore-bearing host rocks, identify hydrothermal alteration zones, and reduce drilling risks before committing to high-cost resource assessments. Here geoscientists are collecting plant samples for biogeochemical investigations in the South Australian outback. Image courtesy of Geoscience Australia Creative Production Team.
51 DISR, 2024. Australia’s Critical Minerals List and Strategic Materials List.
52 Simon C., Cathles L., Wood D, Braxilian M, 2026. The widening gap between copper supply and demand will have an impact on economic development and energy futures. Energy Research and Social Science 133, March 2026, 104581
53 Hughes et al., 2026. Australia’s Identified Mineral Resources 2025.
54 McQueen, K.G., 2005. ‘Ore Deposit Types and their Primary Expressions’. Regolith Expression of Australian Ore Systems: A Compilation of Exploration Case Histories with Conceptual Dispersion, Process and Exploration Models (Cornelius, S.M. and Robertson, I.D.M., Eds.), CRC LEME, Australia, pp. 1-14.
55 United States Geological Survey, nd. Lead Statistics and Information.
56 USGS, nd. Zinc Statistics and Information.
57 Hughes et al., 2026. Australia’s Identified Mineral Resources 2025..
58 Hughes et al., 2026. Australia’s Identified Mineral Resources 2025.
59 ibid.
60 ibid.