Australian Mineral Exploration Review 2025 Significant drill results – precious metals and other commodities
Page last updated:3 August 2026
Although not included on the Australian Government’s critical minerals or strategic materials lists, commodities such as gold, silver, iron ore and uranium remain central to Australia’s resources sector (Figure 1). These commodities continue to support export income, regional employment and exploration activity, and they remain important to global supply chains for energy, infrastructure and advanced technologies61.
Gold remained the leading commodity for exploration in Australia in 2025, accounting for 40% of total mineral exploration expenditure (see Section 2.2). Silver also remained significant due to its industrial and clean energy applications, while uranium exploration continued to attract interest in response to growing global attention on nuclear energy as a low-emission power source. Iron ore, although a mature industry, also continued to attract substantial exploration expenditure and remains a major contributor to Australia’s export earnings62.
Together, these commodities illustrate the breadth of Australia’s exploration activity beyond critical minerals and strategic materials, spanning established export commodities as well as minerals linked to evolving energy and industrial systems.
The following tables (Tables 11 to 14) and maps (Figures 13 to 16) present a selection of publicly reported significant drill results from exploration programs undertaken across Australia in 2025, grouped by commodity. Because some commodities commonly occur together within the same mineral systems, certain drill intercepts may be included in more than one table. Within each table, significant drill results are organised by the stage of exploration of the project and listed alphabetically by company.
Additional information for each significant drill result is available in downloadable tables, with the tables in this publication a subset of the information provided.
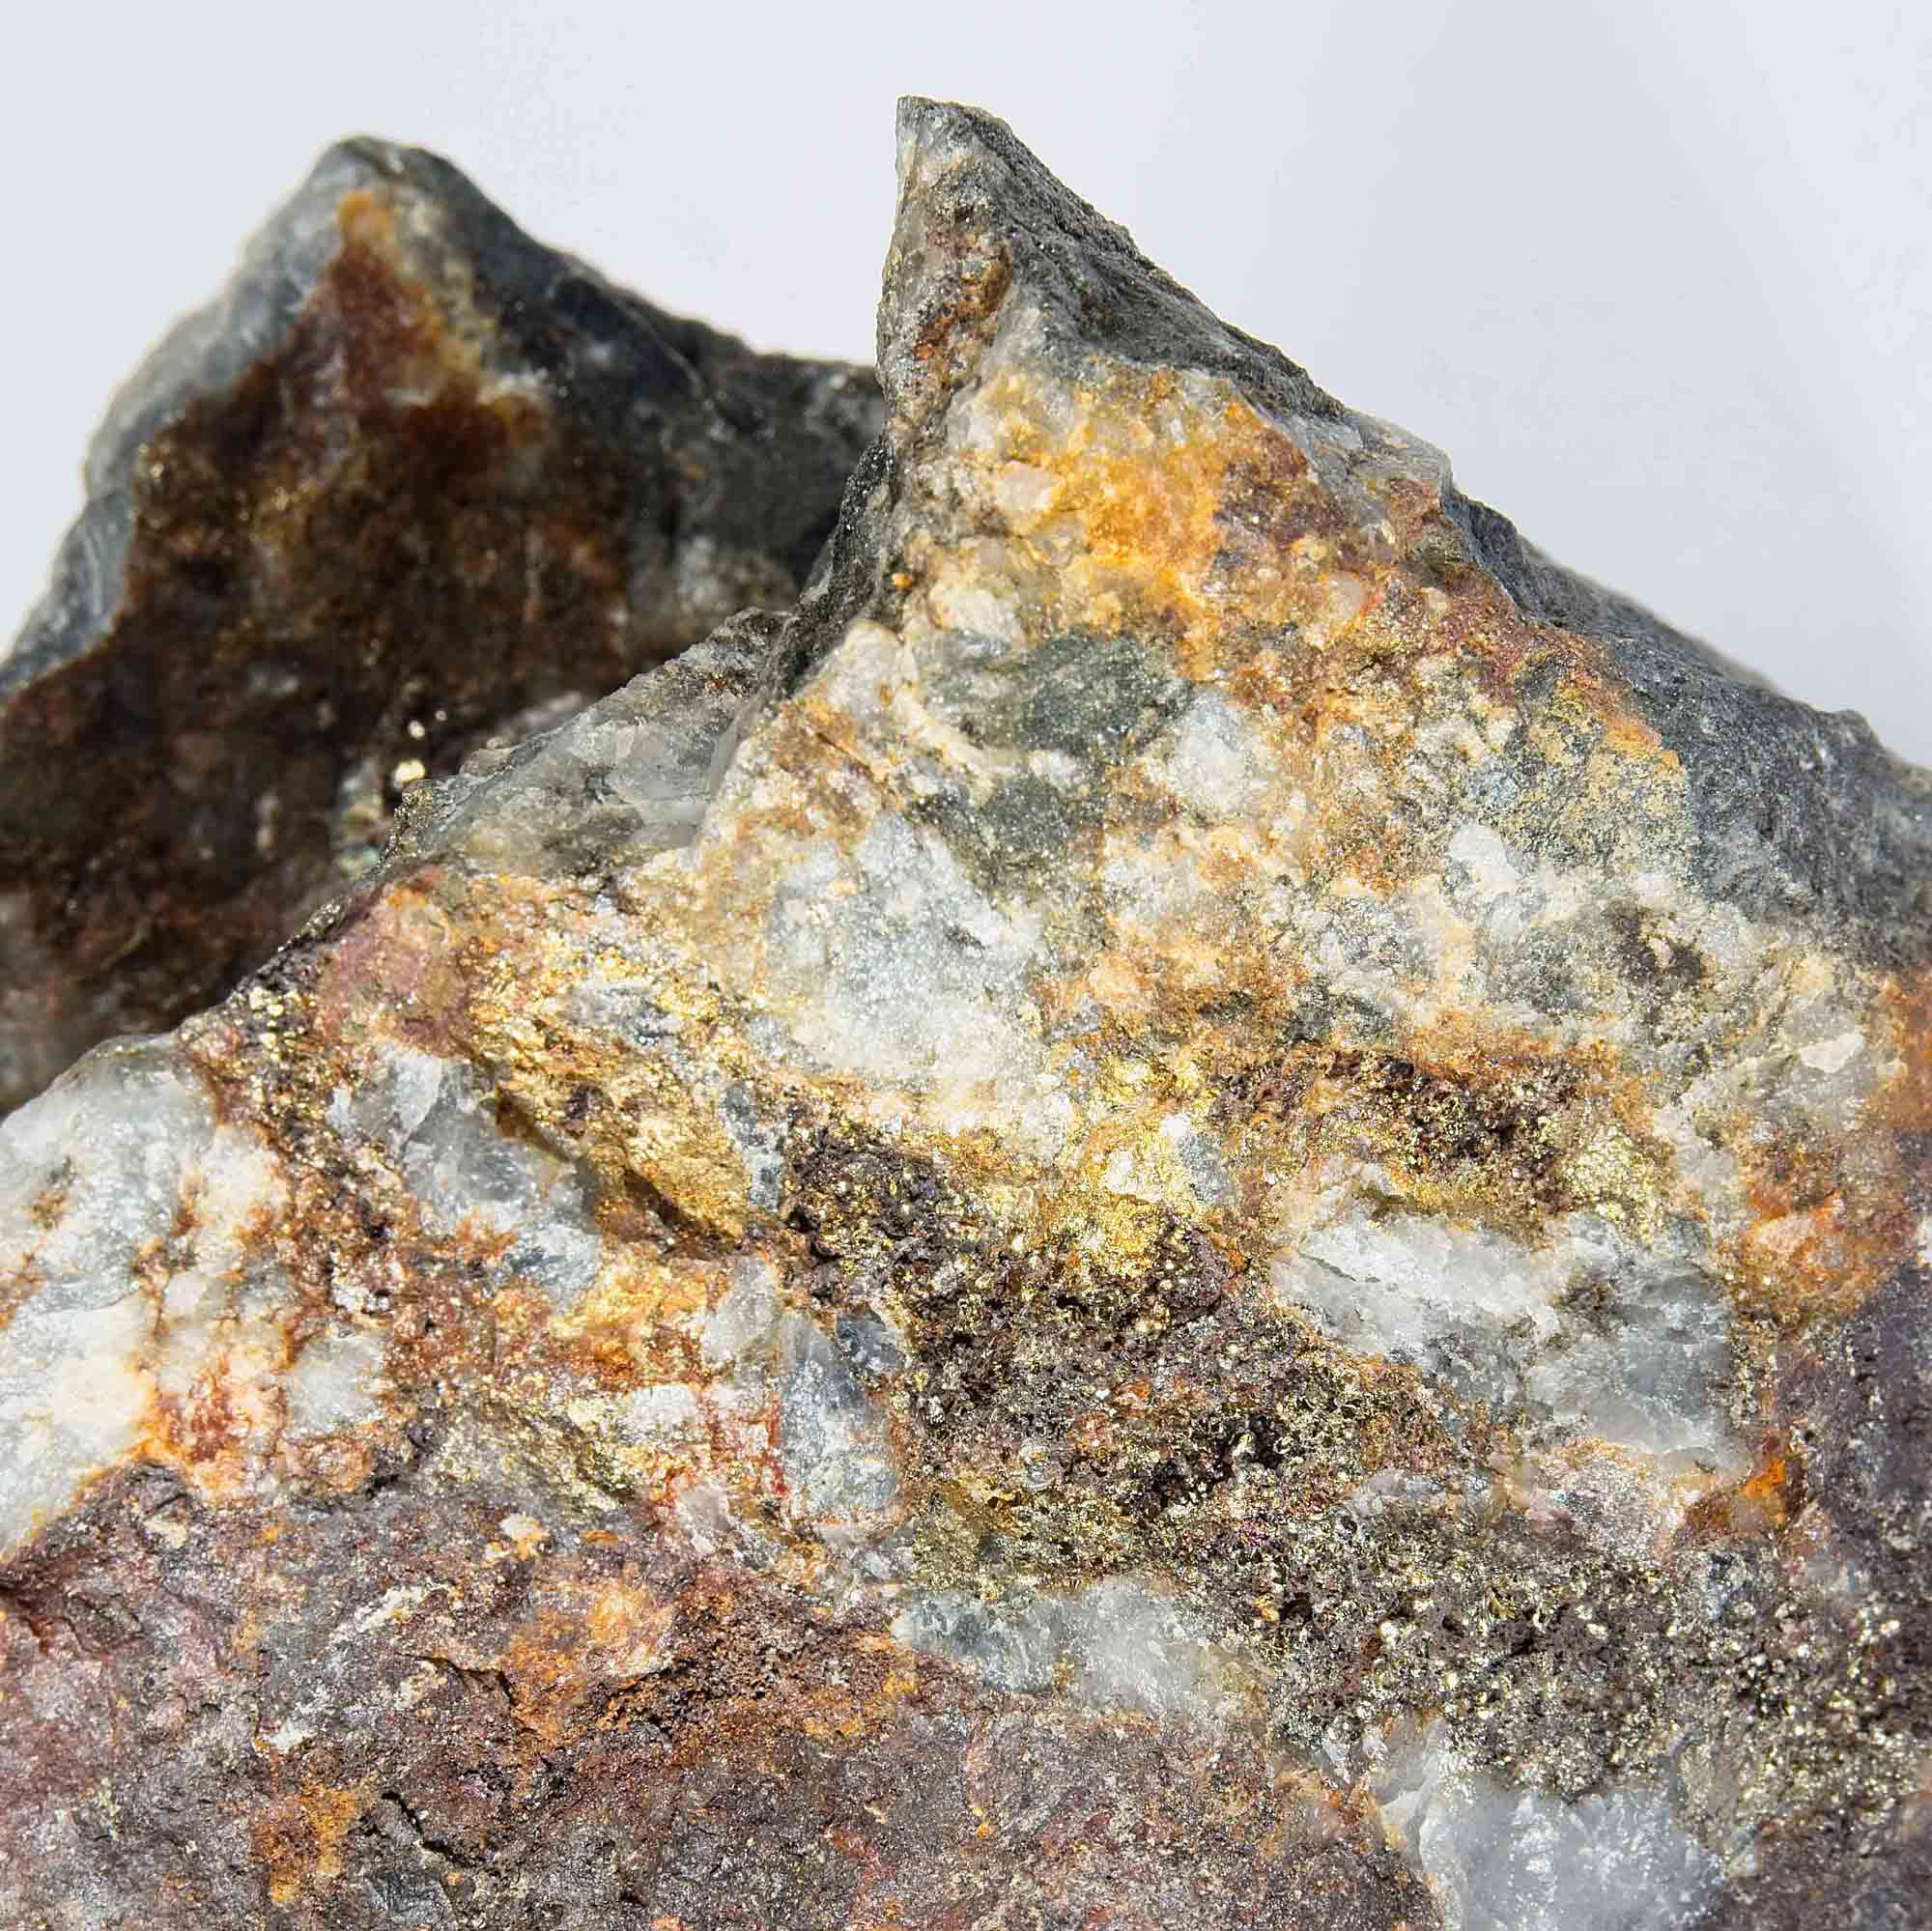
Gold ore, such as this specimen from Pine Creek Mine, Northern Territory, has long been central to mineral exploration in Australia and remains the largest exploration commodity by expenditure in 2025. Image courtesy of Geoscience Australia National Mineral and Fossil Collection.
Gold

*Data from Australian Bureau of Statistics, Mineral and Petroleum Exploration Australia (December 2025). Data are the ‘gold’ category. #Data from Geoscience Australia, Australia’s Identified Mineral Resources 2025.
Gold is primarily used as a store of value and investment asset by governments, central banks and private investors. In addition, jewellery fabrication accounts for a significant share of annual gold consumption. Industrial applications represent a smaller but important component of demand, with gold widely used in the electronics industry due to its high electrical conductivity and resistance to corrosion63.
Gold exploration continues to dominate mineral exploration activity in Australia. In 2025, it accounted for approximately 40% of total national mineral exploration expenditure, reflecting strong ongoing interest in the gold sector (Figure 2a).
In Australia, gold typically occurs in association with a range of deposit types such as iron oxide copper–gold deposits, porphyry systems and orogenic gold deposits. While all three major deposit types contribute significantly to the country’s resource base, it is orogenic deposits, that account for the largest proportion of Australia’s gold production64.
The high volume of significant drilling results (Table 11) reflects the increase in gold exploration expenditure in 2025. There is a concentration of results in known gold regions such as Kalgoorlie-Boulder in Western Australia, Bendigo-Ballarat in Victoria and the Cobar region in New South Wales (Figure 13).
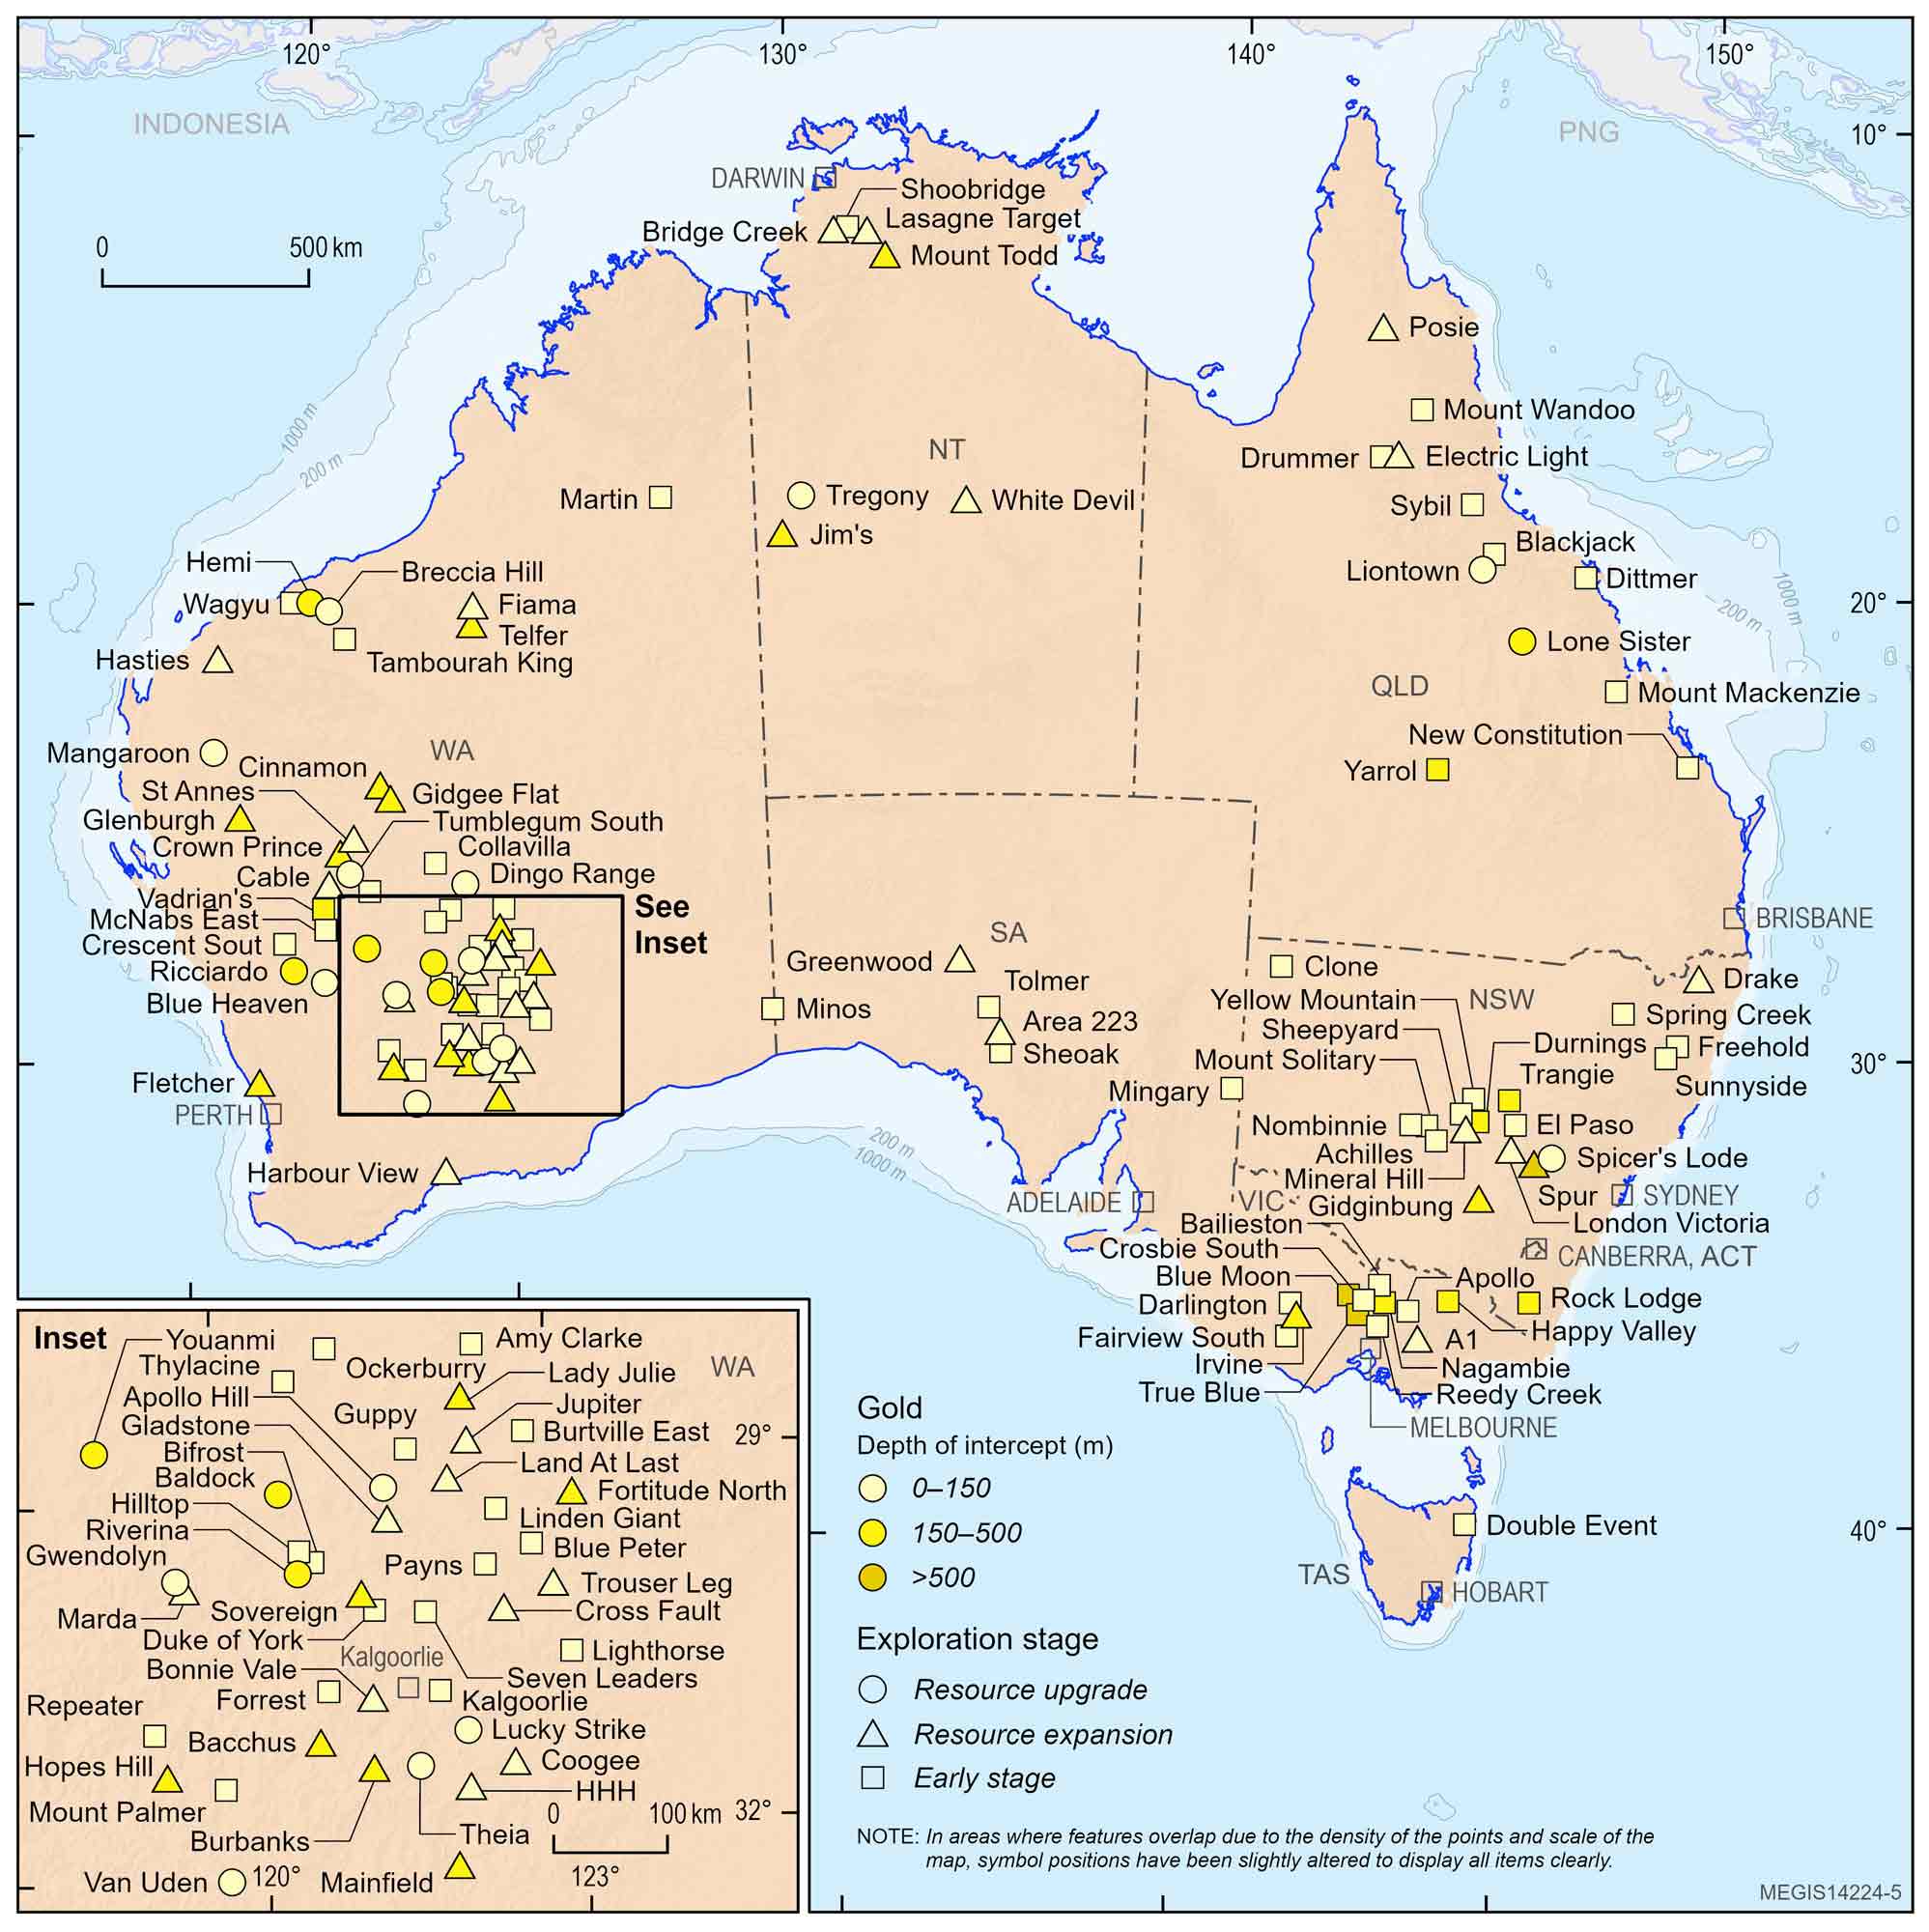
Figure 13. Location of significant drill results containing gold reported through the ASX (or equivalent) in 2025. Significant drill results are classified by exploration stage: Early stage refers to first-pass or follow-up drilling without a Mineral Resource estimate; Resource expansion refers to step-out or extensional drilling with a Mineral Resource estimate; and Resource upgrade includes infill drilling with a Mineral Resource estimate.
Table 11. Significant drill results containing gold reported through the ASX (or equivalent) in 2025. Company tickers are for the ASX unless otherwise stated.
| Company | Company Ticker | Deposit or Prospect | State | Intercept |
|---|---|---|---|---|
| Early-stage exploration drilling | ||||
| Advance Metals Ltd | AVM | Happy Valley | VIC | 7.5 m at 47.9 g/t Au from 178.1 m |
| Albion Resources Ltd | ALB | Collavilla | WA | 11 m at 20.0 g/t Au from 17 m |
| Alchemy Resources Ltd | ALY | Yellow Mountain | NSW | 113 m at 0.37 g/t Au, 24.3 g/t Ag, 0.33% Cu, 0.86% Pb, 1.23% Zn from 43 m |
| Alkane Resources Ltd | ALK | El Paso | NSW | 32.1 m at 1.65 g/t Au from 66.9 m |
| Amara Minerals Ltd | AM3 | Dig Fault Zone | VIC | 10.9 m at 3.26 g/t Au from 69.1 m |
| Auravelle Metals Ltd | AUV | Sheoak | SA | 16 m at 5.6 g/t Au from 68 m |
| Australian Gold and Copper Ltd | AGC | Achilles | NSW | 42 m at 2.6 g/t Au, 12 g/t Ag, 0.1% Cu, 0.6% Pb, 0.1% Zn from 26 m |
| Ballymore Resources Ltd | BMR | Dittmer | QLD | 6.6 m at 13.67 g/t Au, 4.4 g/t Ag, 0.18% Cu from 139.40 m |
| Barton Gold Holdings Ltd | BGD | Tolmer | SA | 15.25 m at 4.84 g/t Au from 139.75 m |
| Brightstar Resources Ltd | BTR | Linden Giant | WA | 10 m at 9.83 g/t Au from 57 m |
| Bubalus Resources Ltd | BUS | Crosbie South | VIC | 6.6 m at 0.4 g/t Au, 1,839 ppm Sb from 40.6 m |
| Caprice Resources Ltd | CRS | Vadrian's | WA | 11 m at 17.3 g/t Au from 170 m |
| Catalina Resources Ltd | CTN | Rock Lodge | NSW | 11 m at 0.88 g/t Au from 193 m |
| Cazaly Resources Ltd | CAZ | Duke of York | WA | 6 m at 10.3 g/t Au from 27 m |
| Core Lithium Ltd | CXO | Shoobridge | NT | 46 m at 0.75 g/t Au from 3 m |
| Cosmo Metals Ltd | CMO | Spring Creek | NSW | 6 m at 9.99 g/t Au from 11 m |
| Dart Mining NL | DTM | New Constitution | QLD | 10.5 m at 2.63 g/t Au, 12.21 g/t Ag, 1.94% Zn from 68.6 m |
| ECR Minerals Plc | ECR (LSE) | Bailieston | VIC | 0.2 m at 3.86 g/t Au, 1.41% Sb from 133.5 m |
| Falcon Metals Ltd | FAL | Blue Moon | VIC | 1.2 m at 543 g/t Au from 544.2 m |
| Flynn Gold Ltd | FG1 | Double Event | TAS | 2.5 m at 6.3 g/t Au from 37.3 m |
| Golden Cross Resources Ltd | GCR | Reedy Creek | VIC | 10.8 m at 2.08 g/t Au from 28 m |
| Great Southern Mining Ltd | GSN | Amy Clarke | WA | 2 m at 23.9 g/t Au from 10 m |
| Green & Gold Minerals Ltd | GG1 | Mount Wandoo | QLD | 12 m at 5.9 g/t Au from 59 m |
| Hastings Technology Metals Ltd | HAS | Seven Leaders | WA | 5 m at 15.17 g/t Au from 27 m |
| Havilah Resources Ltd | HAV | Mingary | SA | 49 m at 0.69 g/t Au, 0.87 g/t Ag, 0.33% Cu from 122 m |
| Indiana Resources Ltd | IDA | Minos | SA | 8 m at 11.6 g/t Au from 78 m |
| Inflection Resources Ltd | AUCU (CSE) | Trangie | NSW | 54.37 m at 0.37 g/t Au, 0.07% Cu from 194.63 m |
| Kalgoorlie Gold Mining Ltd | KAL | Lighthorse | WA | 17 m at 4.81 g/t Au from 48 m |
| Koonenberry Gold Ltd | KNB | Sunnyside | NSW | 170 m at 1.75 g/t Au from 77 m |
| Kula Gold Ltd | KGD | Mount Palmer | WA | 3 m at 35.9 g/t Au from 17 m |
| Larvotto Resources Ltd | LRV | Freehold | NSW | 14 m at 1.22 g/t Au, 0.73% Sb, 0.01% WO3 from 89 m |
| Legacy Iron Ore Ltd | LEG | Blue Peter | WA | 3 m at 13.61 g/t Au from 48 m |
| Lightning Minerals Ltd | L1M | Drummer | QLD | 20.4 m at 2.4 g/t Au, 14.3 g/t Ag from 62 m |
| Magmatic Resources Ltd | MAG | Ockerburry | NSW | 12 m at 5.13 g/t Au from 66 m |
| Mandalay Resources Corp | MND (TSX) | True Blue | VIC | 0.33 m at 578 g/t Au, 20.5% Sb from 525.01 m |
| Metal Hawk Ltd | MHK | Thylacine | WA | 2.3 m at 15.28 g/t Au from 28.1 m |
| Mila Resources Plc | MILA (LSE) | Yarrol | QLD | 5 m at 2.78 g/t Au from 183 m |
| Mount Hope Mining Ltd | MHM | Mount Solitary | NSW | 19 m at 4.5 g/t Au from 39 m |
| Nagambie Resources Ltd | NAG | Nagambie | VIC | 7.3 m at 1.74 g/t Au, 6.19% Sb from 154 m |
| Native Mineral Resources Holdings Ltd | NMR | Blackjack | QLD | 3 m at 8.51 g/t Au from 52 m |
| Neometals Ltd | NMT | Ironclad | WA | 3 m at 95.7 g/t Au from 20 m |
| New Age Exploration Ltd | NAE | Wagyu | WA | 8 m at 5 g/t Au from 44 m |
| Nexus Minerals Ltd | NXM | Payns | WA | 24 m at 2.8 g/t Au from 40 m |
| North Stawell Minerals Ltd | NSM | Darlington | VIC | 2.3 m at 29.2 g/t Au from 108.2 m |
| Novo Resources Corp | NVO (TSX) | Clone | NSW | 12 m at 5.9 g/t Au from 16 m |
| Ordell Minerals Ltd | ORD | McNabs East | WA | 22.70 m at 4.09 g/t Au from 71.3 m |
| Ore Resources Ltd | OR3 | Forrest | WA | 12 m at 12.18 g/t Au from 48 m |
| Panther Metals Ltd | PNT | Burtville East | WA | 6 m at 11.99 g/t Au from 28 m |
| Patronus Resources Ltd | PTN | Guppy | WA | 12 m at 12.41 g/t Au from 20 m |
| Peel Mining Ltd | PEX | Nombinnie | NSW | 33 m at 2.47 g/t Au from 21 m |
| Premier1 Lithium Ltd | PLC | Crescent South | WA | 3 m at 31.5 g/t Au from 97 m |
| QMines Ltd | QML | Mount Mackenzie | QLD | 11 m at 4.63 g/t Au, 59.76 g/t Ag from 47 m |
| Riversgold Ltd | RGL | Northern Zone | WA | 10 m at 8.89 g/t Au from 46 m |
| Southern Cross Gold Consolidated Ltd | SX2 | Apollo | VIC | 100.5 m at 3.1 g/t Au, 0.1% Sb from 820.8 m |
| Stavely Minerals Ltd | SVY | Fairview South | VIC | 40 m at 1.96 g/t Au from surface |
| Sunshine Metals Ltd | SHN | Sybil | QLD | 4.4 m at 57.51 g/t Au from 23.6 m |
| Talisman Mining Ltd | TLM | Sheepyard | NSW | 42 m at 0.44 g/t Au from 4 m |
| Talisman Mining Ltd | TLM | Durnings | NSW | 28 m at 0.32 g/t Au, 0.07% Cu, 0.1% Pb, 0.17% Zn, 1.06 g/t Ag from 156 m |
| Tambourah Metals Ltd | TMB | Tambourah King | WA | 2 m at 49.7 g/t Au from 50 m |
| Trek Metals Ltd | TKM | Martin | WA | 4 m at 14.18 g/t Au from 43 m |
| Venus Metals Corporation Ltd | VMC | Hilltop | WA | 4 m at 10.3 g/t Au from 24 m |
| Viking Mines Ltd | VKA | Bifrost | WA | 2 m at 23.6 g/t Au from 124 m |
| WIN Metals Ltd | WIN | Repeater | WA | 2 m at 30.58 g/t Au from 25 m |
| Resource expansion drilling | ||||
| Adavale Resources Ltd | ADD | London Victoria | NSW | 48 m at 0.82 g/t Au from 133 m |
| Antipa Minerals Ltd | AZY | Fiama | WA | 33 m at 15.76 g/t Au, 2,820 ppm Cu, 0.4 g/t Ag, 47 ppm Co from 96 m |
| Arika Resources Ltd | ARI | Land at Last | WA | 4 m at 41.56 g/t Au from 52 m |
| Aureka Ltd | AKA | Irvine | VIC | 5.66 m at 6.13 g/t Au from 489.34 m |
| Barton Gold Holdings Ltd | BGD | Area 223 | SA | 5 m at 9.7 g/t Au from 128 m |
| Benz Mining Corp | BNZ | Glenburgh | WA | 11 m at 19.9 g/t Au from 274 m |
| Catalyst Metals Ltd | CYL | Cinnamon | WA | 6 m at 39.4 g/t Au from 317 m |
| Emmerson Resources Ltd | ERM | White Devil | NT | 15 m at 6.78 g/t Au from 49 m |
| Far Northern Resources Ltd | FNR | Bridge Creek | NT | 3 m at 36.82 g/t Au from 12 m |
| Forrestania Resources Ltd | FRS | Bonnie Vale | WA | 4 m at 16.3 g/t Au from 72 m |
| Genesis Minerals Ltd | GMD | Jupiter | WA | 69 m at 3.92 g/t Au from 79 m |
| GoldArc Resources Ltd | GA8 | Gladstone | WA | 2 m at 18.31 g/t Au from 60 m |
| Golden Horse Minerals Ltd | GHM | Hopes Hill | WA | 3 m at 23.8 g/t Au from 193 m |
| Gorilla Gold Mines Ltd | GG8 | Sovereign | WA | 5 m at 66.3 g/t Au from 399 m |
| Greatland Resources Ltd | GGP | Telfer | WA | 30 m at 5.6 g/t Au, 0.25% Cu from 281 m |
| Hawthorn Resources Ltd | HAW | Trouser Leg | WA | 4 m at 22.92 g/t Au from 93 m |
| Horizon Minerals Ltd | HRZ | Burbanks | WA | 0.96 m at 1,762 g/t Au from 259.17 m |
| Javelin Minerals Ltd | JAV | Coogee | WA | 5 m at 14.22 g/t Au, 2.31% Cu from 143 m |
| Kaiser Reef Ltd | KAU | A1 | VIC | 0.80 m at 32.7 g/t Au from 28.4 m |
| Kingston Resources Ltd | KSN | Mineral Hill | NSW | 7.87 m at 30.8 g/t Au, 7 g/t Ag, 1.39% Cu, 0.07% Pb, 0.03% Zn from 58.65 m |
| Leeuwin Metals Ltd | LM1 | Marda | WA | 9 m at 5.23 g/t Au from 57 m |
| Legacy Minerals Holdings Ltd | LGM | Drake | NSW | 95 m at 0.9 g/t Au, 1 g/t Ag, 504 ppm Cu, 59 ppm Pb, 3,462 ppm Zn from 2 m |
| LinQ Minerals Ltd | LNQ | Gidginbung | NSW | 31 m at 2.31 g/t Au, 0.12% Cu from 176 m |
| Lodestar Minerals Ltd | LSR | Gidgee Flat | WA | 13 m at 4.38 g/t Au from 229 m |
| Magnetic Resources NL | MAU | Lady Julie | WA | 51 m at 3.48 g/t Au from 444 m |
| Marmota Ltd | MEU | Greenwood | SA | 24 m at 12.0 g/t Au from 20 m |
| Matsa Resources Ltd | MAT | Fortitude North | WA | 22.4 m at 9.19 g/t Au from 329.7 m |
| Medallion Metals Ltd | MM8 | Harbour View | WA | 6.5 m at 20.2 g/t Au, 5% Cu, 15.4 g/t Ag from 139.2 m |
| Meeka Metals Ltd | MEK | St Annes | WA | 23 m at 26.73 g/t Au from 38 m |
| Minerals 260 Ltd | MI6 | Bacchus | WA | 10.2 m at 18.5 g/t Au from 236.2 m |
| New Murchison Gold Ltd | NMG | Crown Prince | WA | 3 m at 43.1 g/t Au from 239.65 m |
| Odyssey Gold Ltd | ODY | Cable | WA | 17.2 m at 7.1 g/t Au from 47 m |
| OzAurum Resources Ltd | OZM | Cross Fault | WA | 48 m at 1.66 g/t Au from surface |
| Pacgold Ltd | PGO | Posie | QLD | 1.46 m at 25.2 g/t Au from 70.54 m |
| Pantoro Gold Ltd | PNR | Mainfield | WA | 2.01 m at 43.19 g/t Au from 331.45 m |
| PC Gold Ltd | PC2 | Lasagne Target | NT | 0.7 m at 459.08 g/t Au from 89.47 m |
| Rincon Resources Ltd | RCR | Hasties | WA | 23 m at 1.05 g/t Au, 0.14% Cu from 64 m |
| Savannah Goldfields Ltd | SVG | Electric Light | QLD | 17.3 m at 2.35 g/t Au, 7 g/t Ag, 121 ppm Cu, 0.36% Pb, 0.51% Zn from 28 m |
| Tanami Gold NL | TAM | Jim's | NT | 3.80 m at 268.34 g/t Au from 317 m |
| Torque Metals Ltd | TOR | HHH | WA | 5 m at 15.2 g/t Au from 149 m |
| Vista Gold Corp | VGZ (TSX) | Mount Todd | NT | 29 m at 1.55 g/t Au from 156.0 m |
| Waratah Minerals Ltd | WTM | Spur | NSW | 208.7 m at 1.17 g/t Au from 514 m |
| Westgold Resources Ltd | WGX | Fletcher | WA | 41 m at 7.99 g/t Au from 426 m |
| Resource upgrade drilling | ||||
| Astral Resources NL | AAR | Theia | WA | 32 m at 10.78 g/t Au from 50 m |
| Aurumin Ltd | AUN | Gwendolyn | WA | 6 m at 16.5 g/t Au from 65 m |
| Ballard Mining Ltd | BM1 | Baldock | WA | 3 m at 64.2 g/t Au from 277 m |
| De Grey Mining Ltd/Northern Star Ltd | DEG | Hemi | WA | 78.1 m at 7.9 g/t Au from 457 m |
| Dreadnought Resources Ltd | DRE | Mangaroon | WA | 7 m at 46.7 g/t Au from 27 m |
| Emerald Resources NL | EMR | Dingo Range | WA | 8 m at 15.69 g/t Au from 51 m |
| GBM Resources Ltd | GBZ | Lone Sister | QLD | 52 m at 2.77 g/t Au from 299 m |
| Godolphin Resources Ltd | GRL | Spicer's Lode | NSW | 39.9 m at 1.08 g/t Au, 52.8 g/t Ag, 0.11% Cu, 1.19% Pb, 2.18% Zn from 135.3 m |
| Kairos Minerals Ltd | KAI | Breccia Hill | WA | 67 m at 1.92 g/t Au from 140 m |
| Lefroy Exploration Ltd | LEX | Lucky Strike | WA | 2 m at 64.37 g/t Au from 37 m |
| Ora Banda Mining Ltd | OBM | Riverina | WA | 3.4 m at 51.7 g/t Au from 228.6 m |
| Prodigy Gold NL | PRX | Tregony | NT | 7 m at 14.1 g/t Au from 58 m |
| Reach Resources Ltd | RR1 | Blue Heaven | WA | 41 m at 2.01 g/t Au from surface |
| Rox Resources Ltd | RXL | Youanmi | WA | 4.94 m at 84.55 g/t Au from 312.7 m |
| Saturn Metals Ltd | STN | Apollo Hill | WA | 27 m at 4.05 g/t Au from 53 m |
| Star Minerals Ltd | SMS | Tumblegum South | WA | 5 m at 30.91 g/t Au from 21 m |
| Sunshine Metals Ltd | SHN | Liontown | QLD | 15 m at 21.45 g/t Au, 26.6 g/t Ag from 38 m |
| TG Metals Ltd | TG6 | Van Uden | WA | 15 m at 4.06 g/t Au from 17 m |
| Warriedar Resources Ltd | WA8 | Ricciardo | WA | 32 m at 4.64 g/t Au, 0.33% Sb from 170 m |
Silver

*Data from Australian Bureau of Statistics, Mineral and Petroleum Exploration Australia (December 2025). Data are from the ‘silver-lead-zinc’ category. #Data from Geoscience Australia, Australia’s Identified Mineral Resources 2025.
Silver is mined and refined into a highly versatile metal used across both traditional and advanced industries. It is an essential component of modern economies, widely used in electronics, solar panels, medical applications, jewellery and coinage due to its unmatched electrical conductivity, reflectivity and antimicrobial properties. It underpins rapidly growing sectors such as renewable energy and digital technologies, with critical applications in photovoltaic cells, circuit boards and electrical systems that support electrification and decarbonisation. Australia plays a moderate role in global silver supply, producing around 4% of world output65 .
Significant silver drill results occurred in the central New South Wales region where polymetallic mineralisation is well known (Figure 14). Queensland also had numerous significant exploration results in 2025, particularly along the eastern coast of the state. While results from other states were sparse, many were from early-stage projects with varying depths (Table 12).
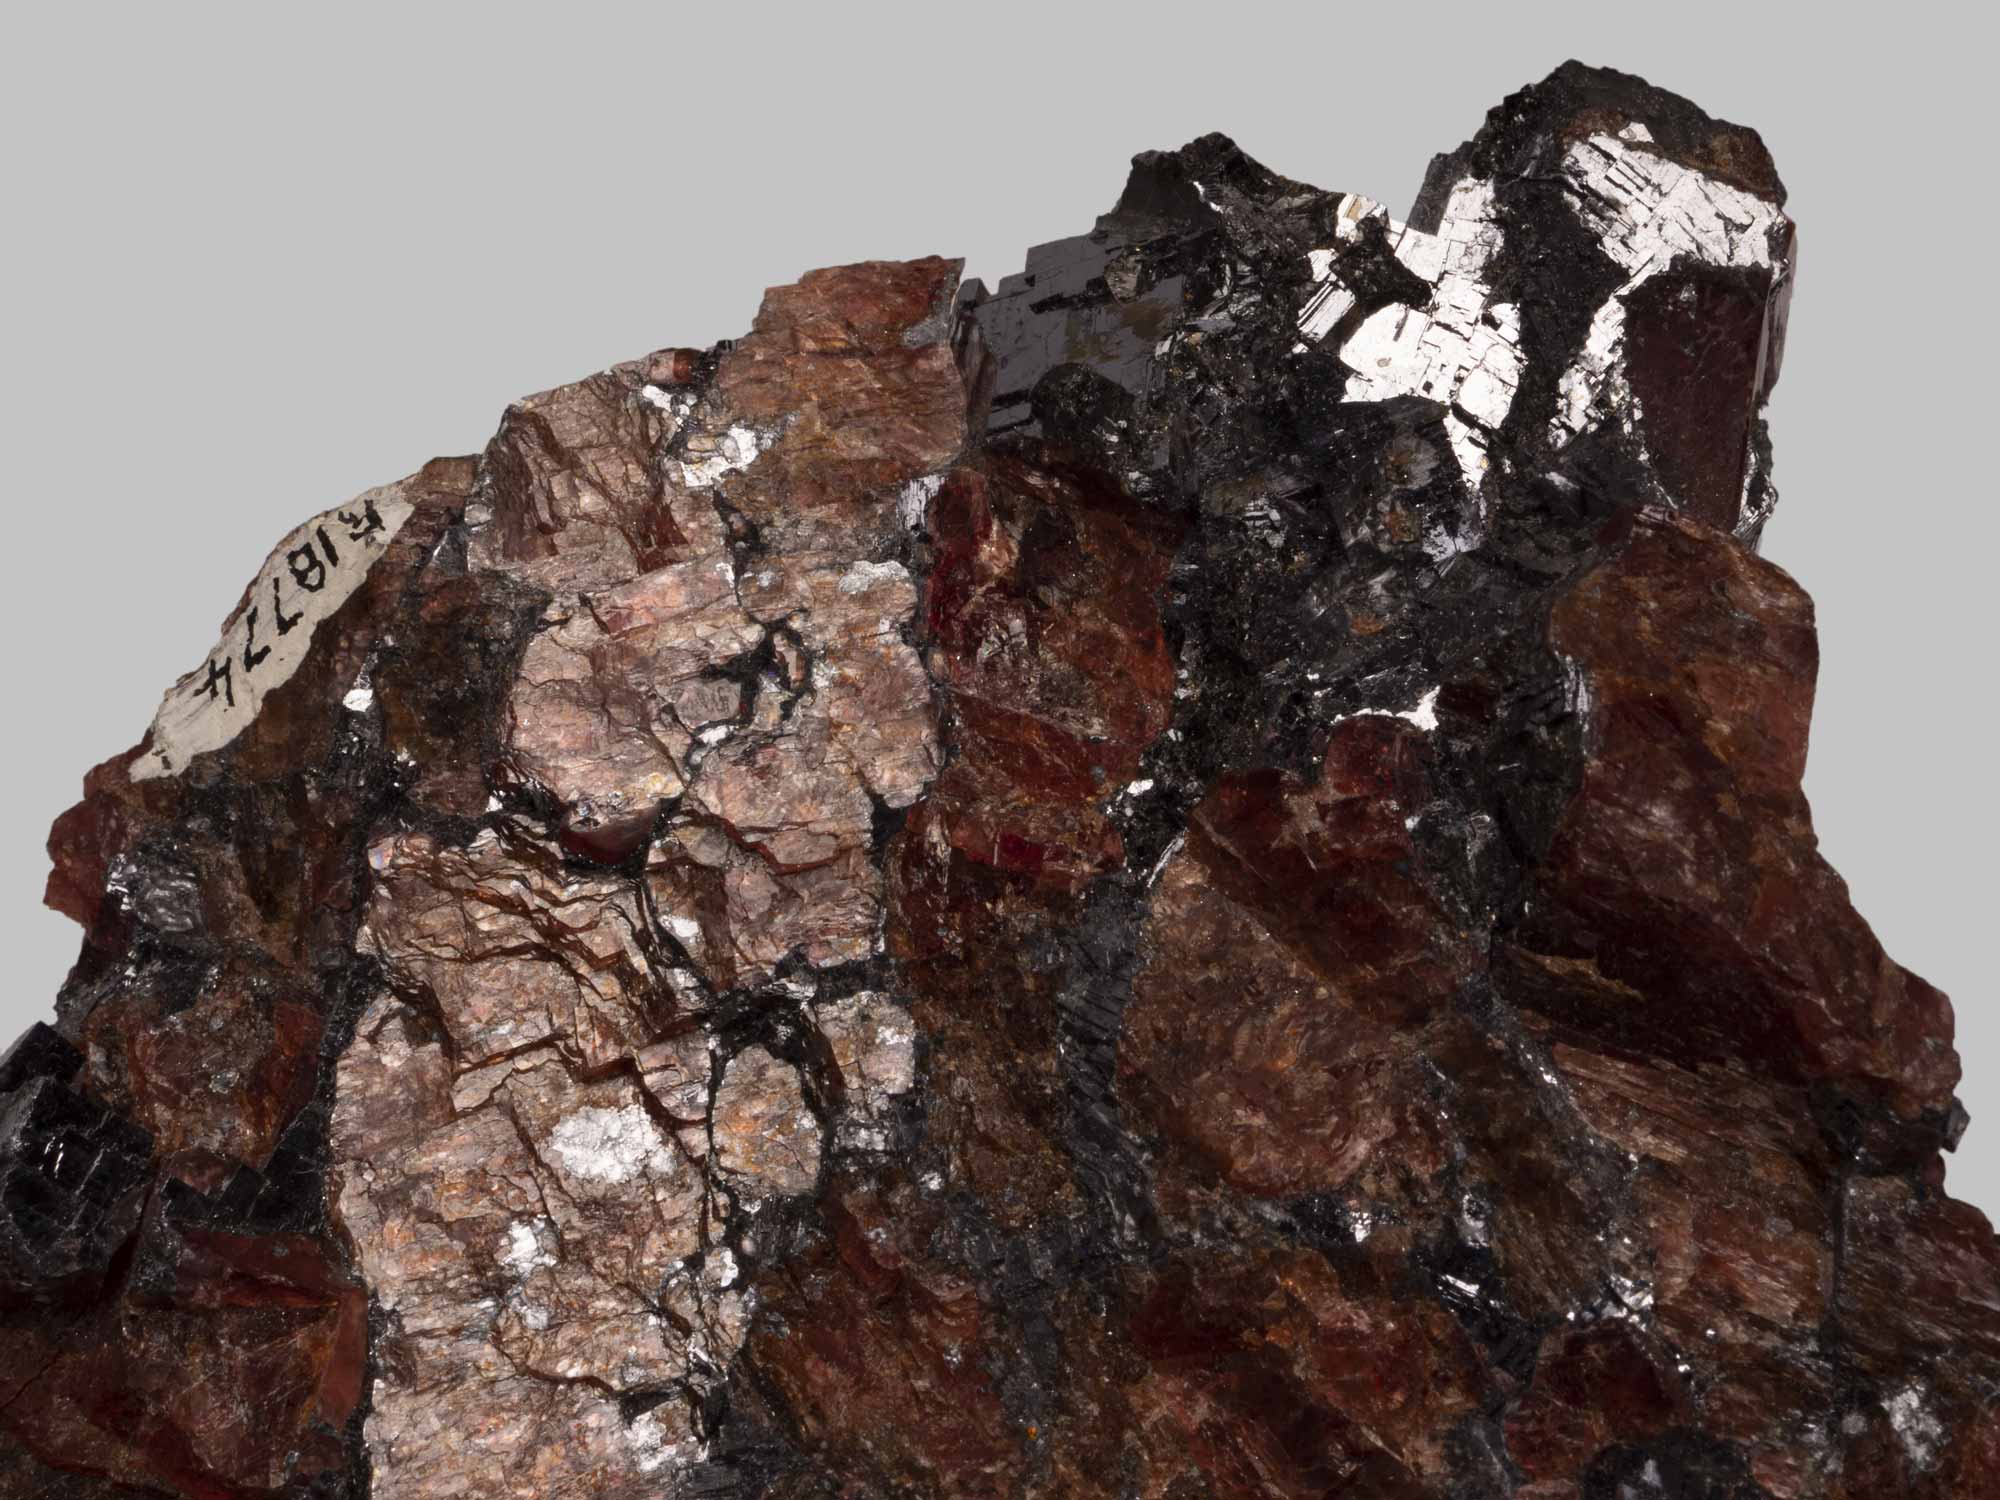
Galena (silver at top of specimen) on rhodonite from Broken Hill, New South Wales. Silver is extracted from the galena in the Broken Hill region which is one of Australia’s most significant polymetallic mineral provinces. Image courtesy of Geoscience Australia National Mineral and Fossil Collection.
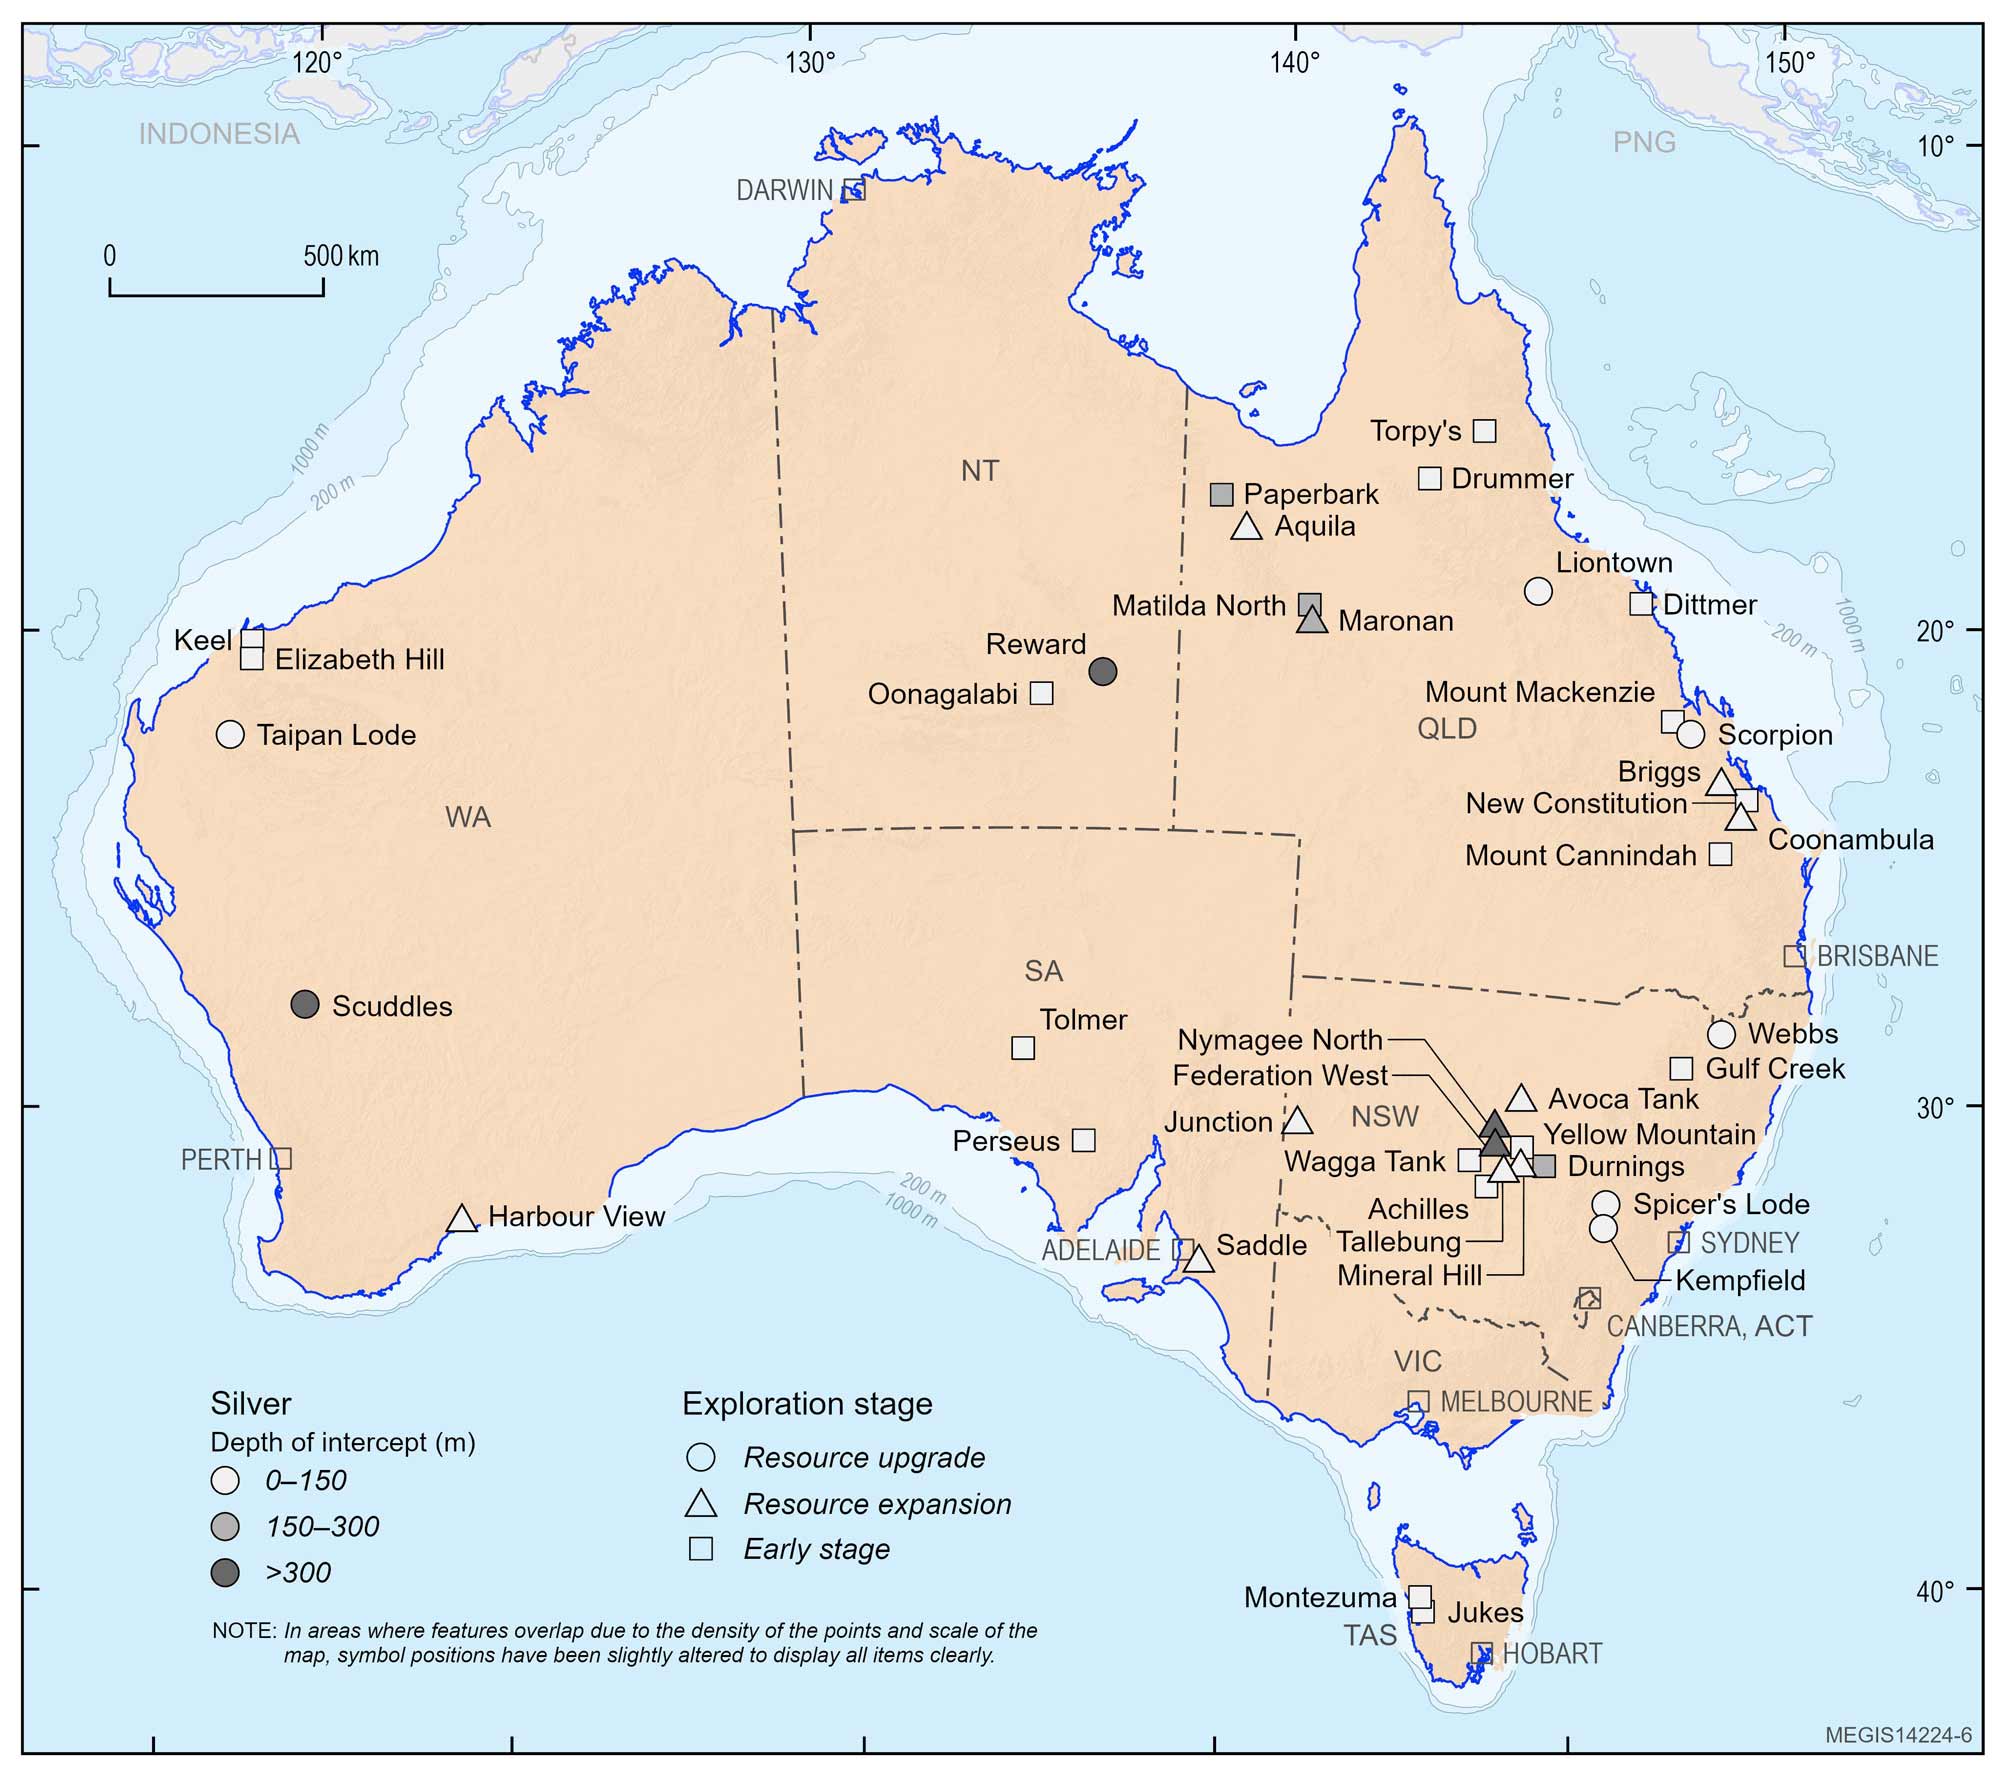
Figure 14. Location of significant drill results containing silver reported through the ASX (or equivalent) in 2025. Significant drill results are classified by exploration stage: Early stage refers to first-pass or follow-up drilling without a Mineral Resource estimate; Resource expansion refers to step-out or extensional drilling with a Mineral Resource estimate; and Resource upgrade includes infill drilling with a Mineral Resource estimate.
Table 12. Significant drill results containing silver reported through the ASX (or equivalent) in 2025. Company tickers are for the ASX unless otherwise stated.
| Company | Company Ticker | Deposit or Prospect | State | Intercept |
|---|---|---|---|---|
| Early-stage exploration drilling | ||||
| Alchemy Resources Ltd | ALY | Yellow Mountain | NSW | 113 m at 0.37 g/t Au, 24.3 g/t Ag, 0.33% Cu, 0.86% Pb, 1.23% Zn from 43 m |
| Australian Gold and Copper Ltd | AGC | Achilles | NSW | 42 m at 2.6 g/t Au, 12 g/t Ag, 0.1% Cu, 0.6% Pb, 0.1% Zn from 26 m |
| Ballymore Resources Ltd | BMR | Torpy's | QLD | 6 m at 226.7 g/t Ag, 8.73% Pb, 7.58% Zn, 0.05% Cu, 6.51 g/t In from 87 m |
| Ballymore Resources Ltd | BMR | Dittmer | QLD | 6.6 m at 13.67 g/t Au, 4.4 g/t Ag, 0.18% Cu from 139.40 m |
| Barton Gold Holdings Ltd | BGD | Tolmer | SA | 6 m at 4,747 g/t Ag, 197 ppm Cu, 2,159 ppm Pb, 55 ppm Zn from 46 m |
| CopperCorp Resources Inc | CPER (TSXV) | Jukes | TAS | 12.6 m at 0.78% Cu, 0.15 g/t Au, 3.43 g/t Ag from 109.9 m |
| Dart Mining NL | DTM | Coonambula | QLD | 5 m at 4.33% Sb, 1.69 g/t Au, 23.65 g/t Ag from 41.5 m |
| Dart Mining NL | DTM | New Constitution | QLD | 10.5 m at 2.63 g/t Au, 12.21 g/t Ag, 1.94% Zn from 68.6 m |
| Investigator Resources Ltd | IVR | Perseus | SA | 9 m at 21 g/t Ag from 90 m |
| Lightning Minerals Ltd | L1M | Drummer | QLD | 20.4 m at 2.4 g/t Au, 14.3 g/t Ag from 62 m |
| Litchfield Minerals Ltd | LMS | Oonagalabi | NT | 91 m at 0.9% Cu, 1.3% Zn, 0.1% Pb, 7 g/t Ag, 0.1g/t Au from 8 m |
| Lode Resources Ltd | LDR | Montezuma | TAS | 8.6 m at 5.02% Sb, 738 g/t Ag, 0.7 g/t Au, 7.28% Pb, 0.32% Cu, 0.16% Sn from surface |
| Maronan Metals Ltd | MMA | Copper-Gold Zone | QLD | 9.9 m at 0.51% Cu, 2.26 g/t Au, 7 g/t Ag from 237 m |
| OD6 Metals Ltd | OD6 | Gulf Creek | NSW | 8 m at 1.41% Cu, 1.26% Zn, 7.08 g/t Ag, 386 ppm Co from 108 m |
| Peel Mining Ltd | PEX | Wagga Tank | NSW | 119 m at 3.17% Cu, 0.38% Pb, 0.11% Zn, 15 g/t Ag, 1.49 g/t Au from 57 m |
| QMines Ltd | QML | Mount Mackenzie | QLD | 11 m at 4.63 g/t Au, 59.76 g/t Ag from 47 m |
| Raiden Resources Ltd | RDN | Keel | WA | 43 m at 0.22% Ni, 0.13% Cu, 136.35 ppm Co, 0.66 g/t Ag from 12 m |
| Rubix Resources Ltd | RB6 | JB Zone | QLD | 70.5 m at 1.35% Zn, 0.38% Pb, 4.23 g/t Ag from 173.5 m |
| Talisman Mining Ltd | TLM | Durnings | NSW | 28 m at 0.32 g/t Au, 0.07% Cu, 0.1% Pb, 0.17% Zn, 1.06 g/t Ag from 156 m |
| West Coast Silver Ltd | WCE | Elizabeth Hill | WA | 21 m at 1,047 g/t Ag from 10 m |
| Resource expansion drilling | ||||
| Aeris Resources Ltd | AIS | Avoca Tank | NSW | 9.4 m at 8.87% Cu, 1.15 g/t Au, 38.1 g/t Ag from 63.5 m |
| AIC Mines Ltd | A1M | Matilda North | QLD | 9.75 m at 6.35% Cu, 1.0 g/t Au, 5.21 g/t Ag from 271 m |
| Aurelia Metals Ltd | AMI | Federation West | NSW | 1.7 m at 25.3% Zn, 11% Pb, 0.2% Cu, 0.3 g/t Au, 54 g/t Ag from 425.5 m |
| Aurelia Metals Ltd | AMI | Nymagee North | NSW | 2.4 m at 2.7% Cu, 1.8 g/t Au, 3.6% Zn, 1.7% Pb, 95 g/t Ag from 567.1 m |
| Broken Hill Mines Ltd | BHM | Junction | NSW | 7.9 m at 921 g/t Ag, 18.8% Pb, 6.8% Zn, 0.1% Cu, 0.7 g/t Au from 57 m |
| Cannindah Resources Ltd | CAE | Mount Cannindah | QLD | 274 m at 0.35% Cu, 0.14 g/t Au, 5.9 g/t Ag from 82 m |
| Canterbury Resources Ltd | CBY | Briggs | QLD | 222.2 m at 0.26% Cu, 48 ppm Mo, 0.72 g/t Ag from 9 m |
| Hillgrove Resources Ltd | HGO | Saddle | SA | 14 m at 2.67% Cu, 0.36 g/t Au, 2.46 g/t Ag from 136 m |
| Kingston Resources Ltd | KSN | Southern Ore Zone | NSW | 7.87 m at 30.8 g/t Au, 7 g/t Ag, 1.39% Cu, 0.07% Pb, 0.03% Zn from 58.65 m |
| Medallion Metals Ltd | MM8 | Harbour View | WA | 6.5 m at 20.2 g/t Au, 5% Cu, 15.4 g/t Ag from 139.2 m |
| Sky Metals Ltd | SKY | Tallebung | NSW | 40 m at 0.24% Sn, 0.04% W, 26.6 g/t Ag from 31 m |
| True North Copper Ltd | TNC | Aquila | QLD | 59 m at 1.77% Cu, 0.04% Co, 5.2 g/t Ag from 134 m |
| Resource upgrade drilling | ||||
| 29Metals Ltd | 29M | Scuddles | WA | 80.4 m at 3.9% Cu, 0.2% Zn, 0.5 g/t Au, 22 g/t Ag from 600.3 m |
| Argent Minerals Ltd | ARD | Lode 200 | NSW | 200.8 m at 61.9 g/t Ag, 0.1 g/t Au, 0.43% Pb, 1.55% Zn from 33.4 m |
| Black Cat Syndicate Ltd | BC8 | Taipan Lode | WA | 12.45 m at 1.15% Sb, 1.51% Pb, 16.1 g/t Ag from 80 m |
| Godolphin Resources Ltd | GRL | Spicer's Lode | NSW | 39.9 m at 1.08 g/t Au, 52.8 g/t Ag, 0.11% Cu, 1.19% Pb, 2.18% Zn from 135.3 m |
| KGL Resources Ltd | KGL | Reward Main | NT | 7.5 m at 2.24% Cu, 15.4 g/t Ag, 0.17 g/t Au, 0.14% Pb, 0.65% Zn from 376.48 m |
| QMines Ltd | QML | Scorpion | QLD | 114 m at 1.64% Cu, 0.86% Zn, 0.3 g/t Au, 13.1 g/t Ag from 11 m |
| Rapid Critical Metals Ltd | RCM | Webbs | NSW | 17.4 m at 205 g/t Ag, 0.13% Cu, 1.43% Pb, 1.49% Zn from 115.8 m |
| Sunshine Metals Ltd | SHN | Liontown | QLD | 15 m at 21.45 g/t Au, 26.6 g/t Ag from 38 m |
Iron ore

*Data from Australian Bureau of Statistics, Mineral and Petroleum Exploration Australia (December 2025). Data are from the ‘iron ore’ category. #Data from Geoscience Australia, Australia’s Identified Mineral Resources 2025.
Iron is one of the most important metals in modern society, primarily because it is the main component of steel, which is used extensively in construction, manufacturing and transportation. Steel derived from iron provides the structural framework for buildings, bridges and infrastructure, as well as key components in vehicles, machinery, tools and appliances, making it essential to industrial development and everyday life.
Globally, about 98% of iron ore is used for steelmaking, highlighting its central role in economic activity and infrastructure growth66. Australia plays a leading role in the global iron ore industry, being the world’s largest producer and exporter, with production approaching around 955 million tonnes annually in recent years. Most of this production comes from Western Australia, particularly the Pilbara region, which dominates national output and supports extensive export networks67. Although iron ore is a mature industry, it continues to attract exploration investment and remains a major contributor to Australia’s export earnings, underpinning regional employment and global supply chains.
Iron ore exploration expenditure has slowed over the past two decades although there has been a more recent uptick starting in 2021 (Figure 3b; see section 2.2). Despite accounting for 20.1% of mineral exploration expenditure in 2025, there were limited significant drill results for Australia reported to stock exchanges. This could be due to the majority of iron ore exploration being carried out by major mining companies who do not report iron ore drill results. All significant iron ore results in 2025 were in Western Australia (Figure 15; Table 13).
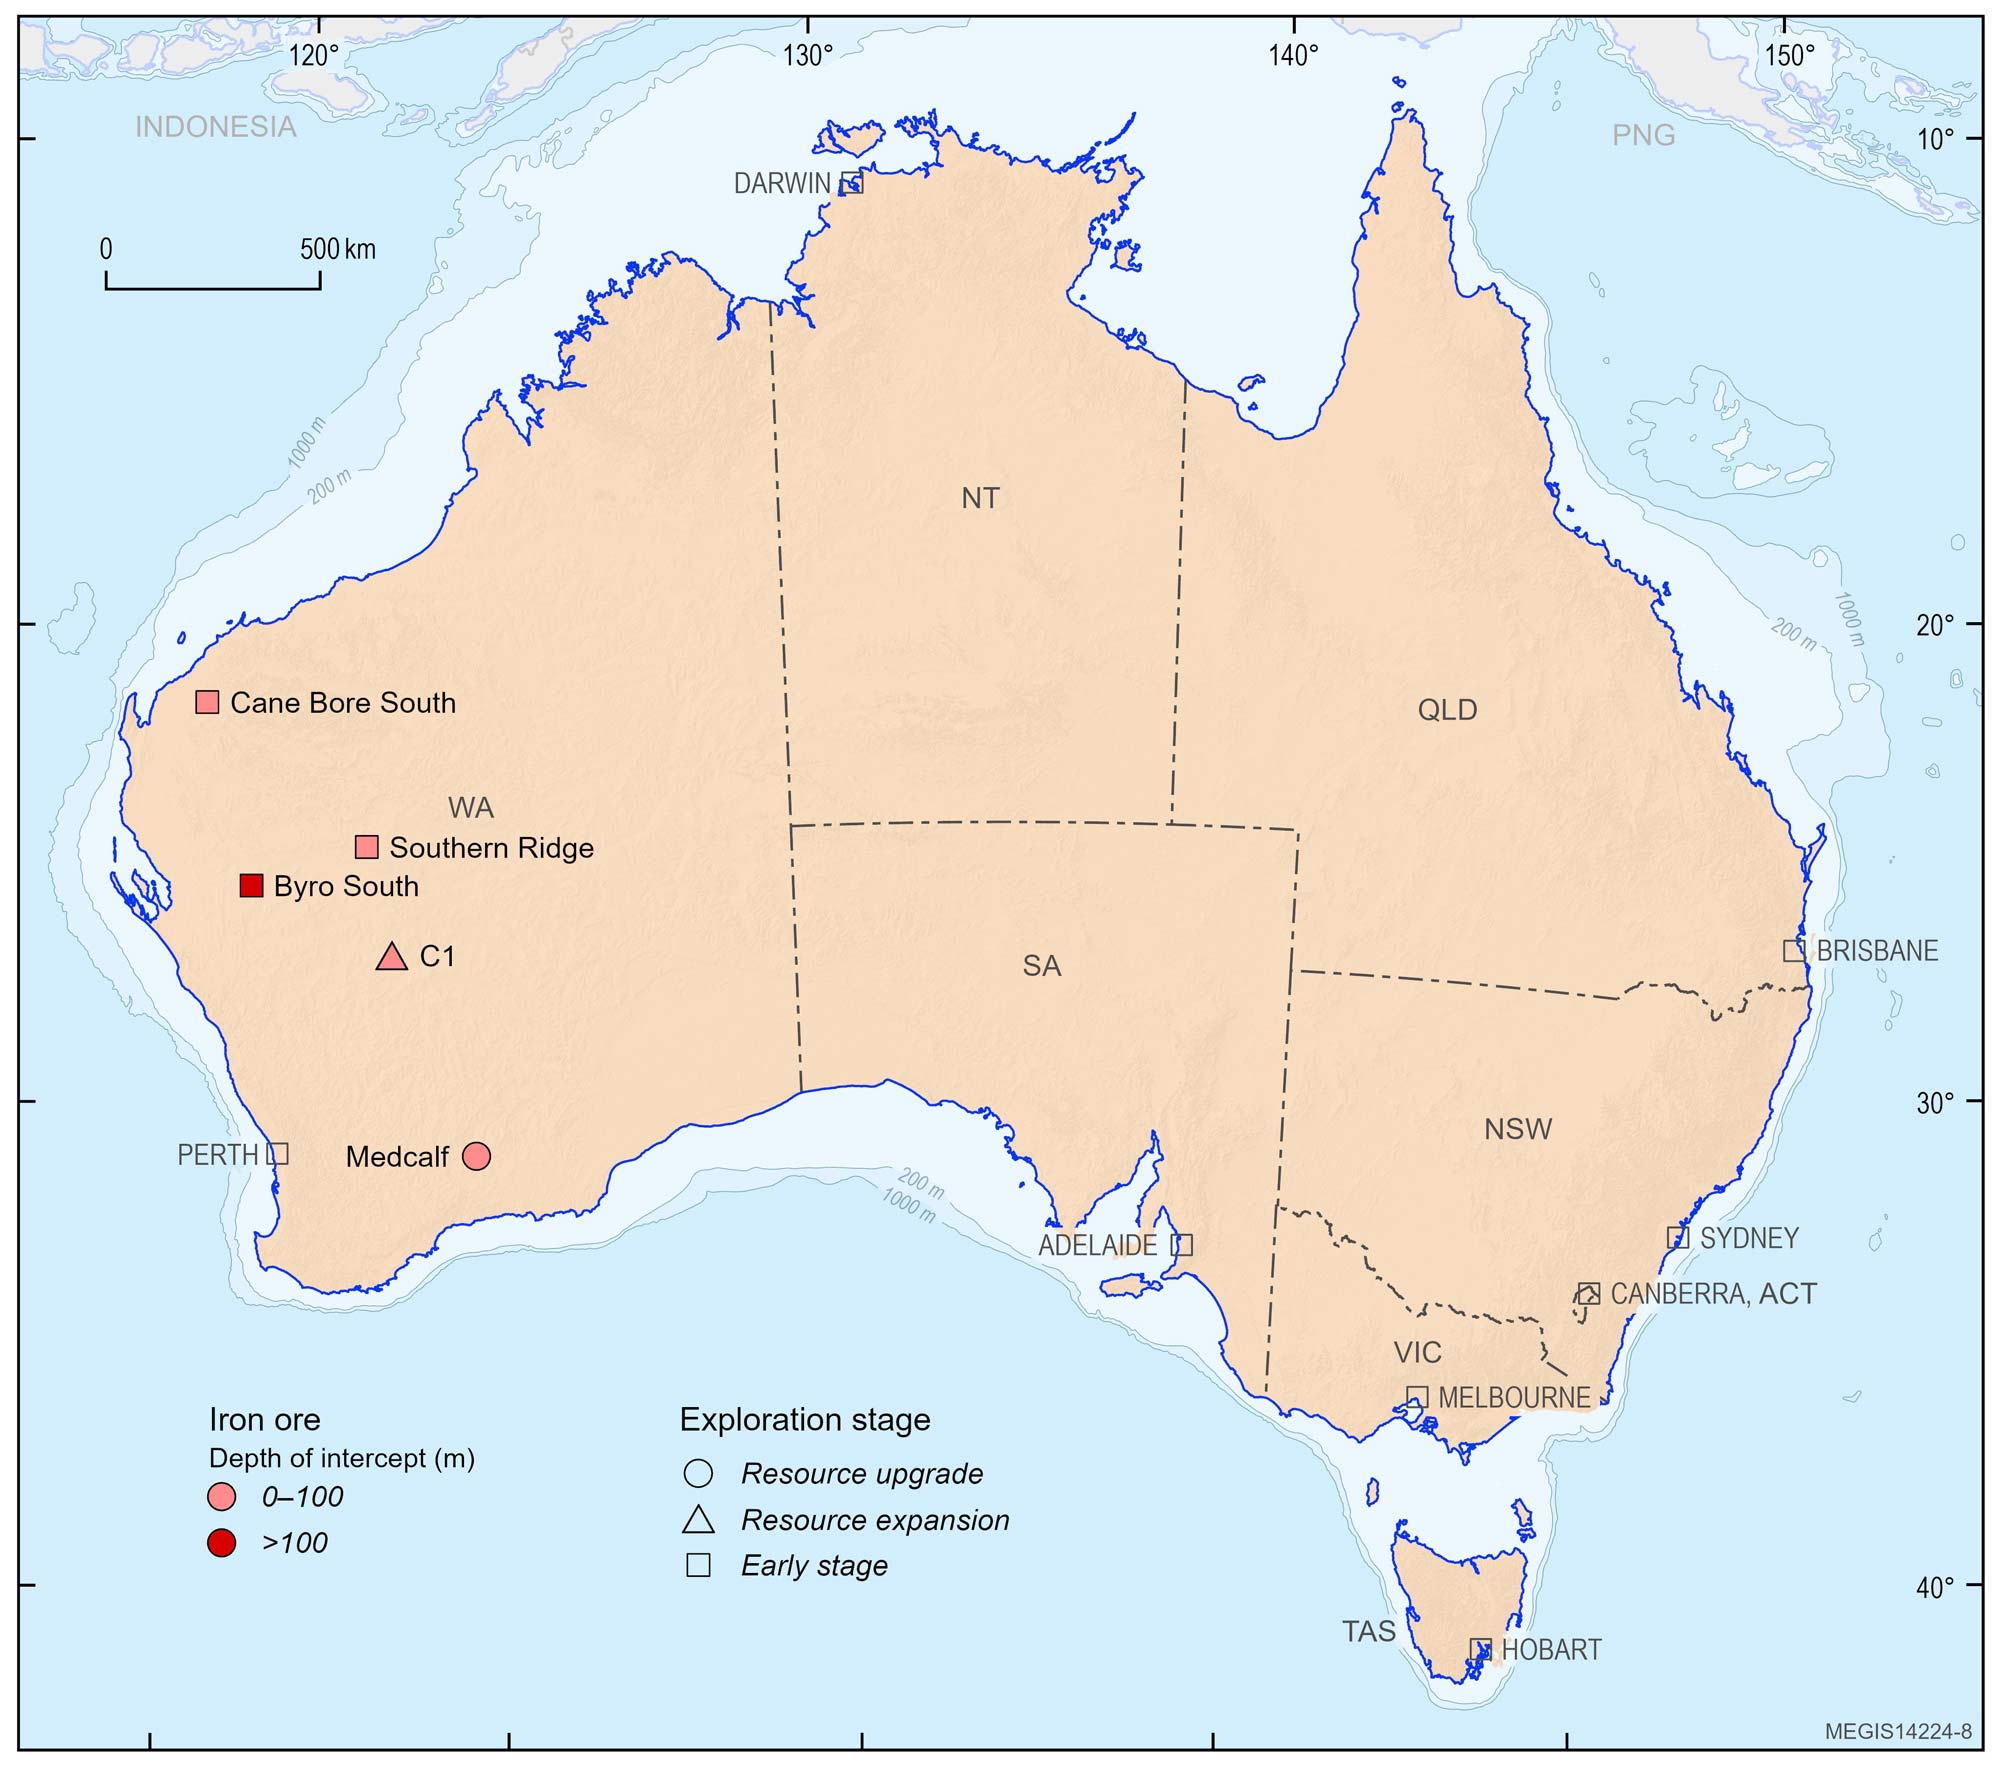
Figure 15. Location of significant drill results containing iron ore reported through the ASX (or equivalent) in 2025. Significant drill results are classified by exploration stage: Early stage refers to first-pass or follow-up drilling without a Mineral Resource estimate; Resource expansion refers to step-out or extensional drilling with a Mineral Resource estimate; and Resource upgrade includes infill drilling with a Mineral Resource estimate.
Table 13. Significant drill results containing iron ore reported through the ASX (or equivalent) in 2025. Company tickers are for the ASX unless otherwise stated.
| Company | Company Ticker | Deposit or Prospect | State | Intercept |
|---|---|---|---|---|
| Early-stage exploration drilling | ||||
| Alchemy Resources Ltd | ALY | Southern Ridge | WA | 50 m at 62.5% Fe from 17 m |
| Burley Minerals Ltd | BUR | Cane Bore South | WA | 7 m at 51.0% Fe, 8.5% SiO2 from surface |
| Athena Resources Ltd | AHN | Byro South | WA | 34 m at 36.5% Fe, 3.5% SiO2 from 126 m |
| Resource expansion drilling | ||||
| Aurumin Ltd | AUN | C1 | WA | 15 m at 59.24% Fe from 14 m |
| Resource upgrade drilling | ||||
| Audalia Resources Ltd | ACP | Medcalf | WA | 60 m at 7.71% TiO2, 0.4% V2O5, 41.92% Fe2O3 from surface |
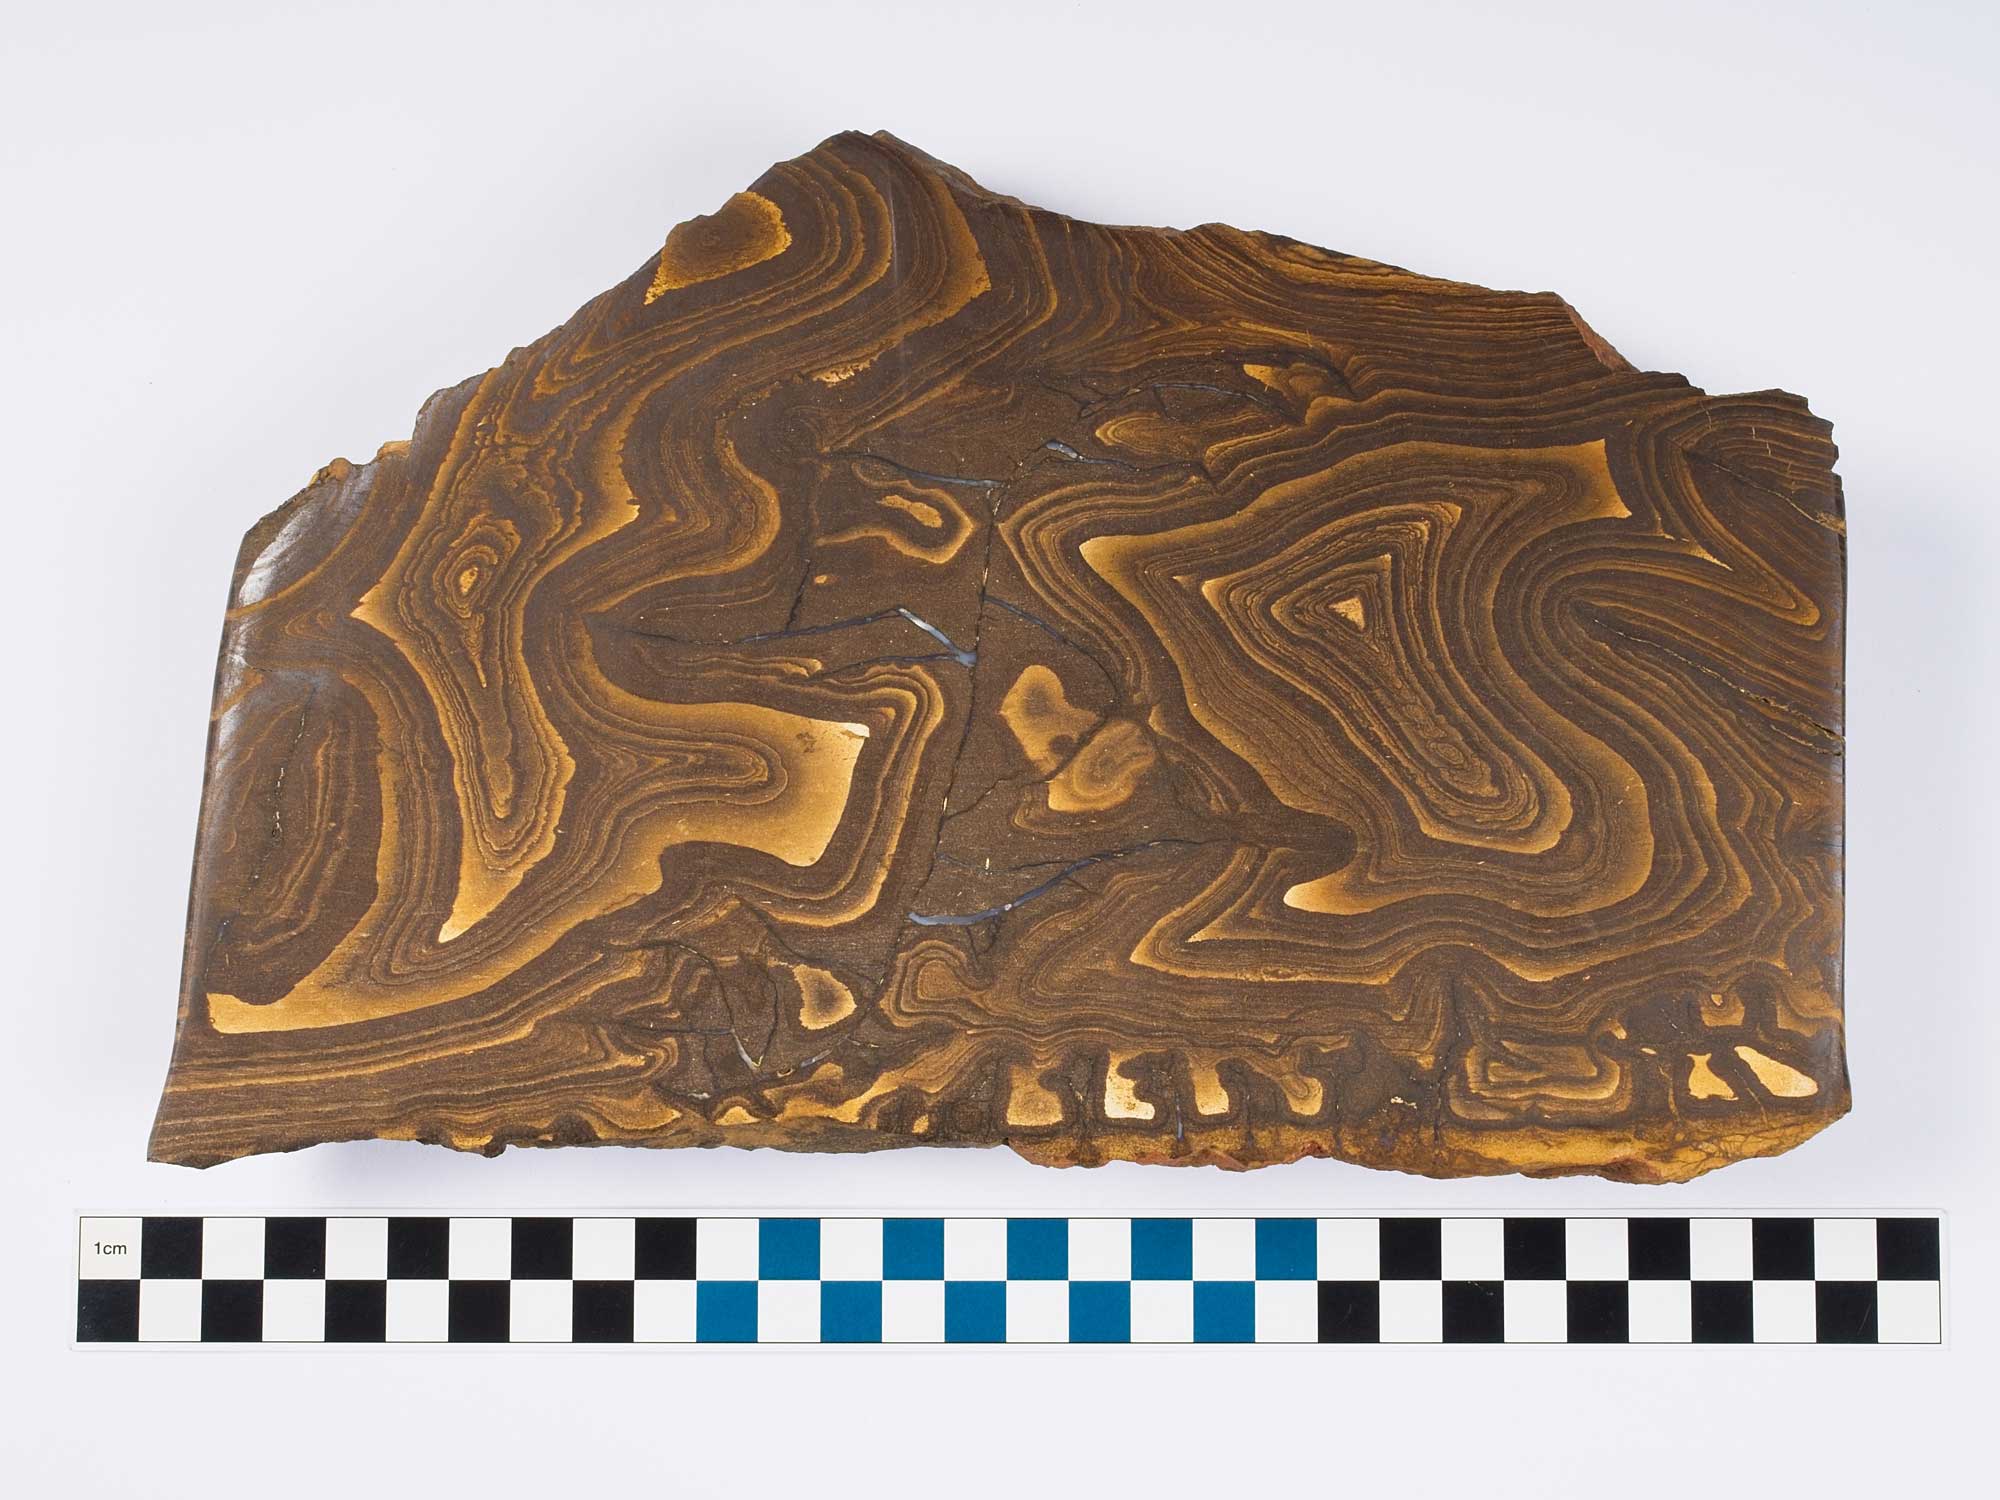
Banded iron specimen collected near Eulo, Queensland. Banded iron formations are ancient iron-rich sedimentary rocks primarily formed in the Precambrian. They are important exploration targets as they can host iron ore deposits, which supply the raw material used to make steel for infrastructure, transport, machinery and construction. Image courtesy of Geoscience Australia National Mineral and Fossil Collection.
Uranium

*Data from Australian Bureau of Statistics, Mineral and Petroleum Exploration Australia (December 2025). Data are from the ‘uranium’ category. #Data from Geoscience Australia, Australia’s Identified Mineral Resources 2025.
Uranium is predominantly used as fuel in nuclear reactors for electricity generation, as well as for medical isotopes and in certain industrial applications. Geologically, uranium deposits in Australia commonly occur in iron oxide breccia complexes, unconformity-related settings, sandstone-hosted environments and calcrete-style deposits68.
Australia hosts the largest economic resources of uranium globally, with significant resources primarily concentrated in South Australia, the Northern Territory and Western Australia69. Despite possessing extensive uranium resources, Australia does not use nuclear power domestically; instead, the uranium extracted is entirely exported under stringent international agreements, ensuring it is utilised solely for peaceful purposes and does not contribute to any military applications70.
Uranium exploration activity in 2025 occurred across jurisdictions with differing policies for uranium exploration and mining. South Australia, the Northern Territory and Tasmina permit uranium mining and exploration, while Queensland and New South Wales both permit uranium exploration but not mining. Western Australia also permits uranium exploration and restricts uranium mining, apart from projects approved before 2017 that have demonstrated substantial commencement. Victoria prohibits both uranium exploration and mining71. Despite these restrictions, significant drill results were reported from four early-stage projects in South Australia, with a further three early-stage projects in Western Australia, the Northern Territory and Queensland (Figure 16). There were two additional significant drill results reported from projects with established Mineral Resources in Queensland and Western Australia (Table 14) despite mining not currently being permitted in these jurisdictions.
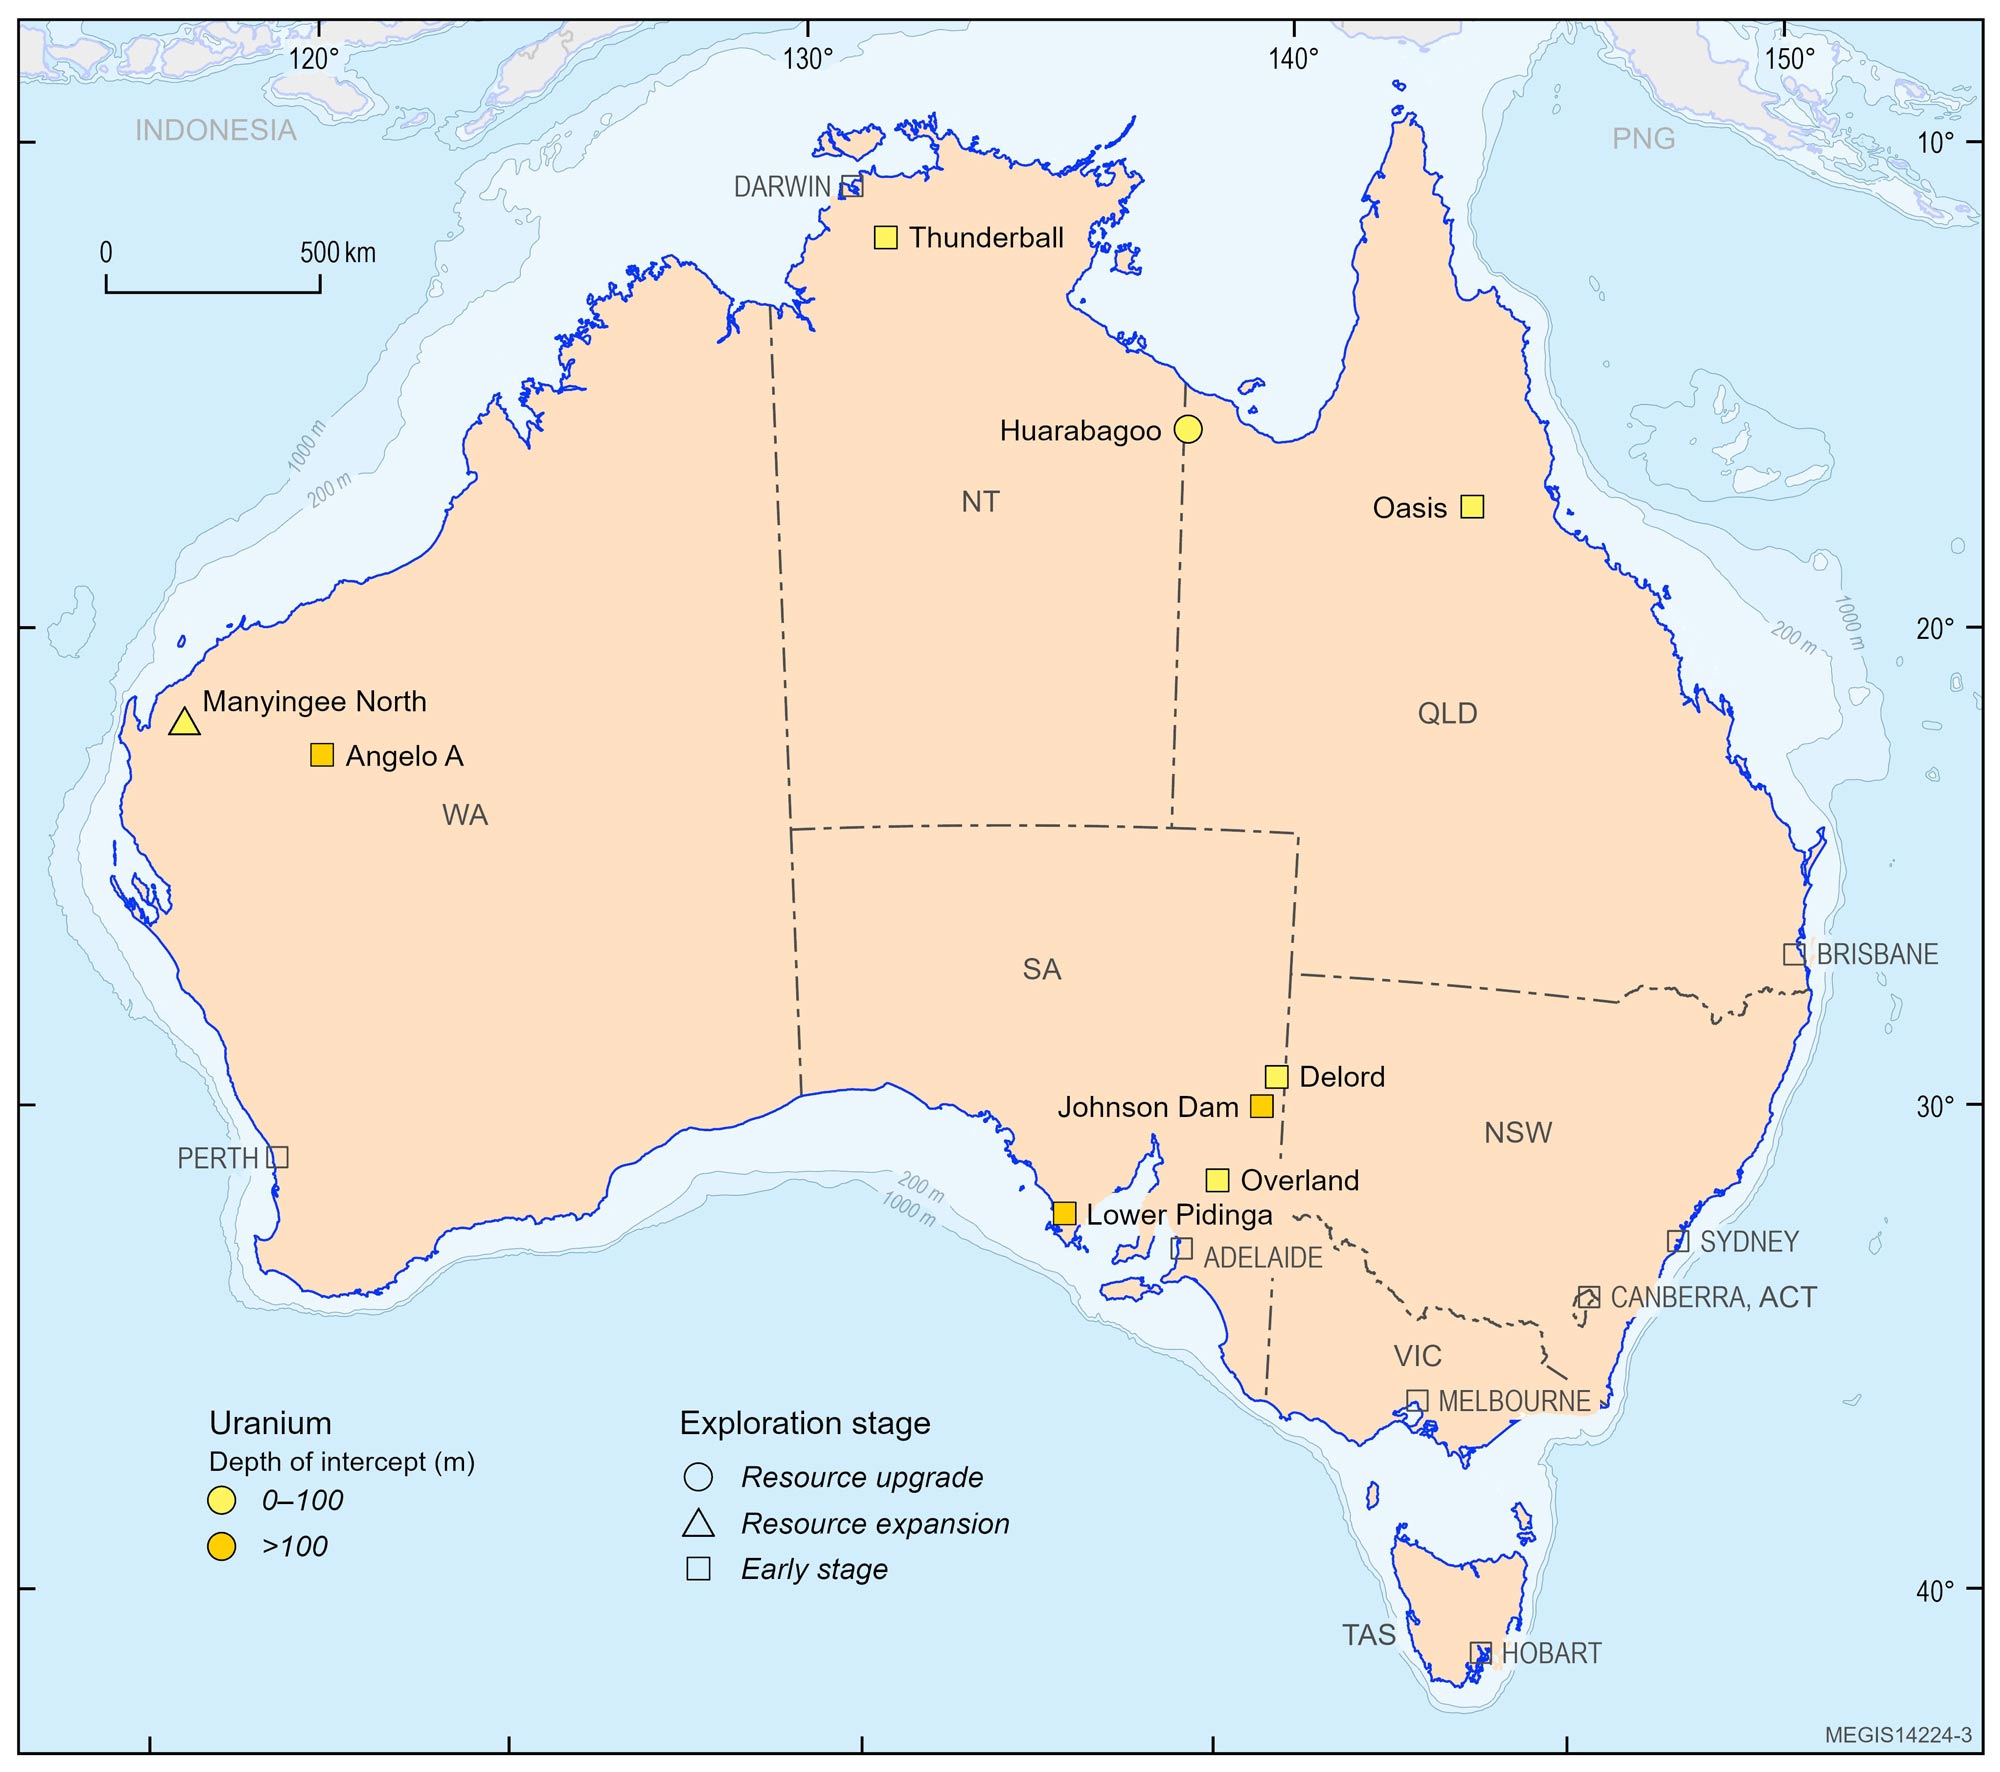
Figure 16. Location of significant drill results containing uranium reported through the ASX (or equivalent) in 2025. Significant drill results are classified by exploration stage: Early stage refers to first-pass or follow-up drilling without a Mineral Resource estimate; Resource expansion refers to step-out or extensional drilling with a Mineral Resource estimate; and Resource upgrade includes infill drilling with a Mineral Resource estimate.
Table 14. Significant drill results containing uranium reported through the ASX (or equivalent) in 2025. Company tickers are for the ASX unless otherwise stated.
| Company | Company Ticker | Deposit or Prospect | State | Intercept |
|---|---|---|---|---|
| Early-stage exploration drilling | ||||
| Australian Rare Earths Ltd | AR3 | Overland | SA | 2 m at 126 ppm U3O8 from 70 m |
| Core Energy Minerals Ltd | CR3 | Lower Pidinga | SA | 4 m at 114.3 ppm U3O8 from 104 m |
| Greenvale Energy Ltd | GRV | Oasis | QLD | 8 m at 2,125 ppm U3O8 from 84 m |
| Havilah Resources Ltd | HAV | Johnson Dam | SA | 7 m at 2,169 ppm U3O8 from 108 m |
| Koba Resources Ltd | KOB | Delord | SA | 1.07 m at 693 ppm eU3O8 from 88.39 m |
| Patronus Resources Ltd | PTN | Thunderball | NT | 10.76 m at 2.95% U3O8 from 87 m |
| Piche Resources Ltd | PR2 | Angelo A | WA | 7 m at 8,733 ppm U3O8 from 138 m |
| Resource expansion drilling | ||||
| Cauldron Energy Ltd | CXU | Manyingee South | WA | 4.8 m at 1,016.5 ppm eU3O8 from 88.89 m |
| Resource upgrade drilling | ||||
| Laramide Resources Ltd | LAM | Huarabagoo | QLD | 5 m at 2,053 ppm U3O8, 0.58 g/t Au from 34.5 m |
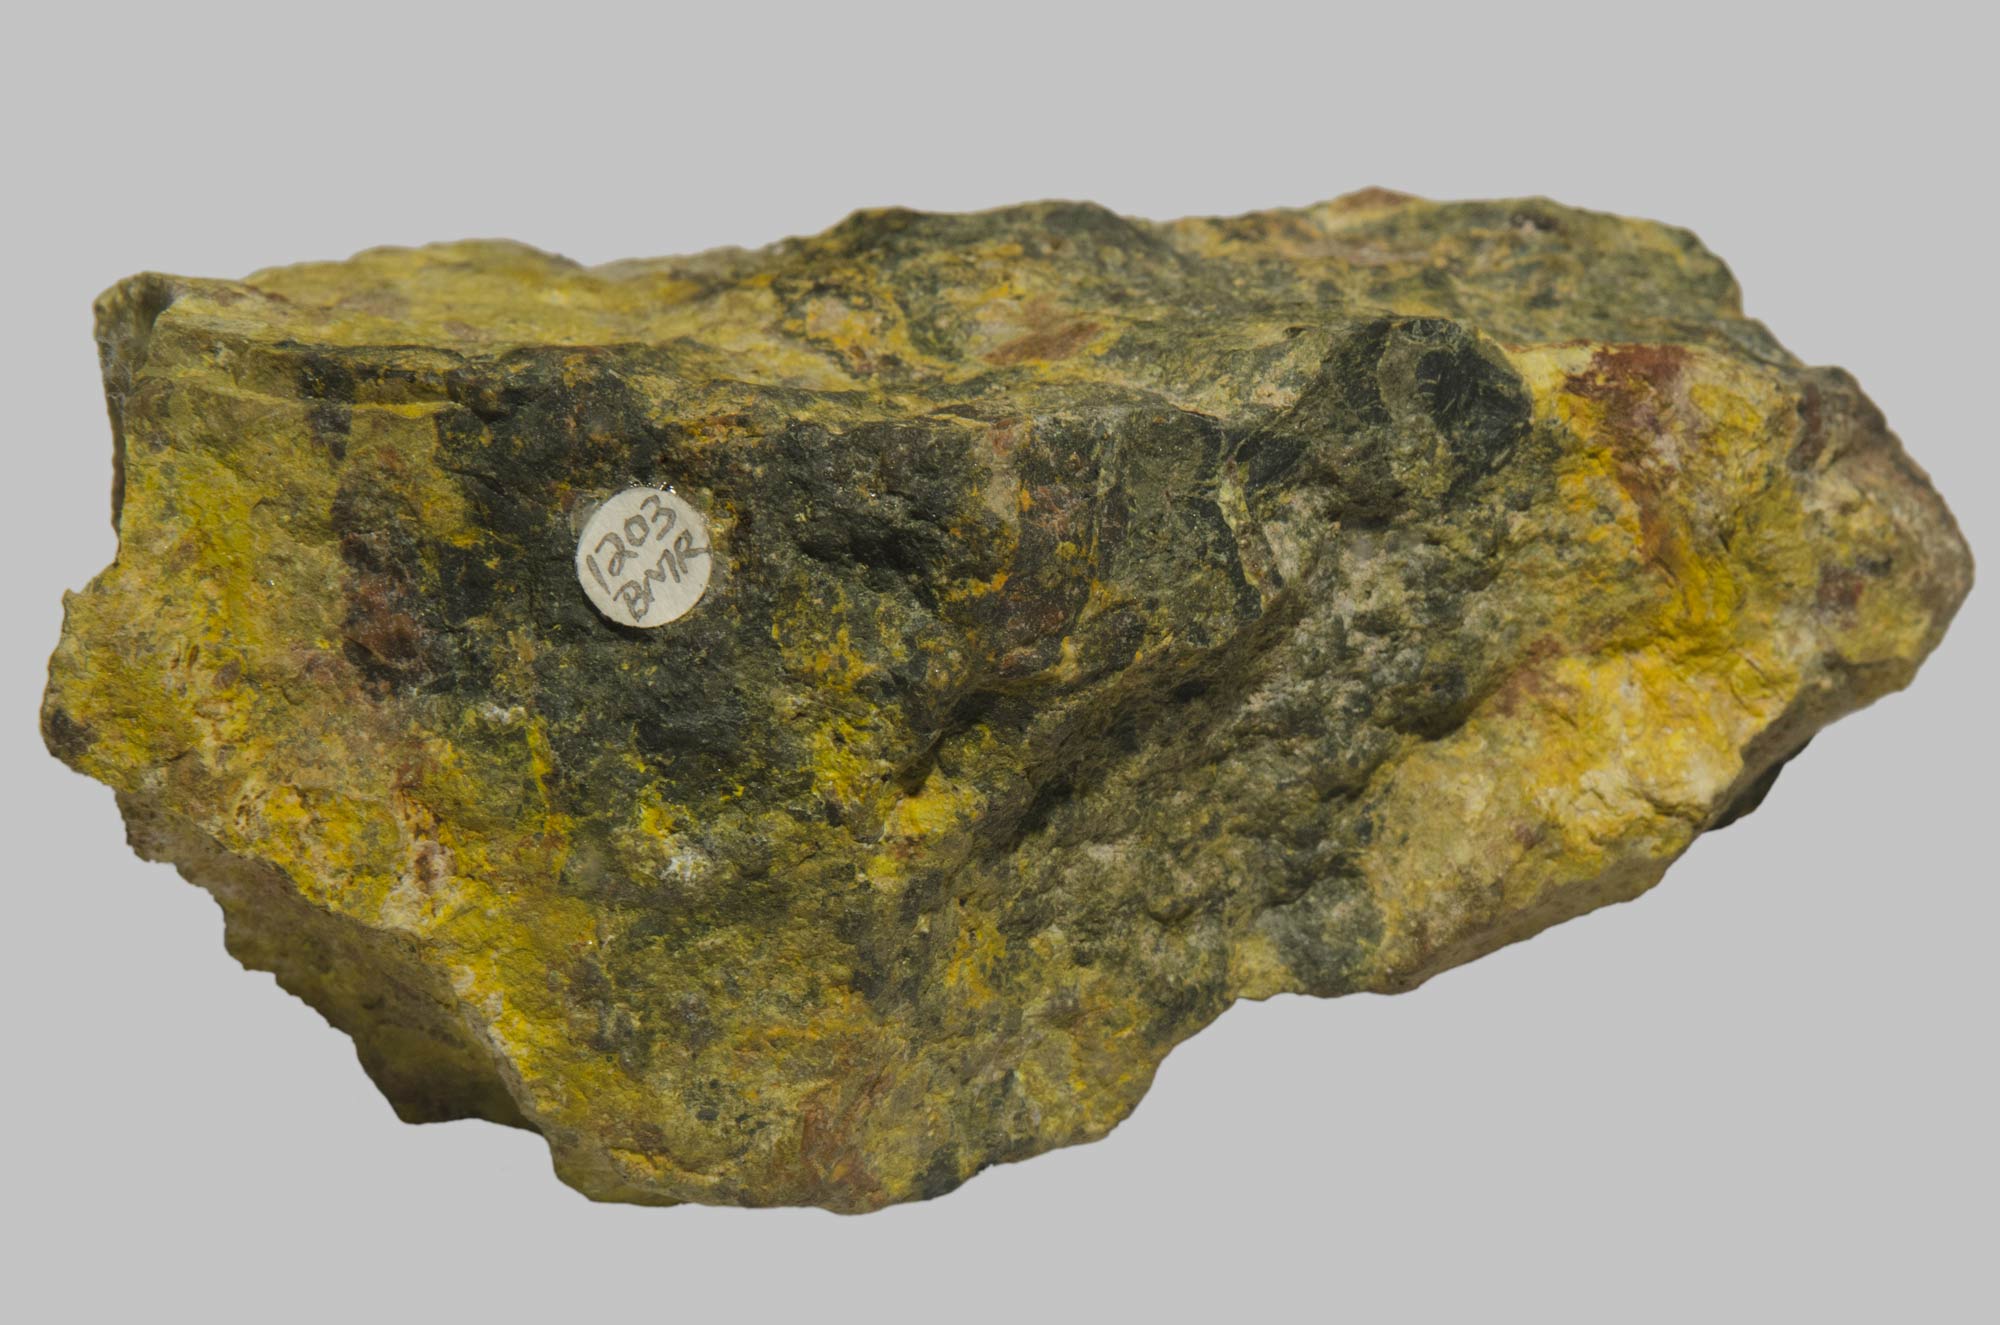
Uraninite specimen with alteration products from the Palette Mine, South Alligator Valley, Northern Territory. Uraninite (black mineral), previously known as pitchblende, is a principal uranium ore mineral and is commonly investigated through geological mapping, radiometric surverys, drilling, wireline logging and sampling to identify mineralised intervals, correlate geology between drill holes and support the definition of uranium resources. Image courtesy of Geoscience Australia National Mineral and Fossil Collection.
61 DISR, 2025. Commonwealth of Australia Resources and Energy Quarterly December 2025.
62 Hughes et al., 2026. Australia’s Identified Mineral Resources 2025.
63 Hughes et al., 2026. Australia’s Identified Mineral Resources 2025.
64 McQueen, K.G., 2005. ‘Ore Deposit Types and their Primary Expressions.’ Regolith Expression of Australian Ore Systems: A Compilation of Exploration Case Histories with Conceptual Dispersion, Process and Exploration Models (Cornelius, S.M. and Robertson, I.D.M., Eds.), CRC LEME, Australia, pp. 1-14.
65 Hughes et al., 2026. Australia’s Identified Mineral Resources 2025.
66 Anglo American, 2025. Iron Ore: The Heart of Steel Production.
67 Hughes et al., 2026. Australia’s Identified Mineral Resources 2025.
68 Geoscience Australia, 2014. Uranium and Thorium Geology.
69 Hughes et al., 2026. Australia’s Identified Mineral Resources 2025.
70 Gibson E., 2024 Current prohibitions on nuclear activities in Australia: a quick guide. Department of Parliamentary Services, Canberra.
71 ibid.