

Key messages
- Coal is a sediment that is largely composed of dead plant matter. Coal is formed when the accumulated plant matter is buried under anoxic conditions and exposed to increased temperatures and pressures over a long period of time (millions of years). The degree of plant matter alteration is expressed by coal ranks, ranging from peat, lignite, sub-bituminous, bituminous and anthracite. The latter three ranks are commonly referred to as “black coal” while lignite is commonly called “brown coal”.
- Coal is Australia’s largest energy resource. At the end of 2019, Australia’s recoverable Economic Demonstrated Resources were 75,428 million tonnes (Mt) of black coal and 73,865 Mt of brown coal.
- Australia is currently the fifth largest producer and the second largest exporter of coal and has the third largest reserves of coal in the world.
Summary
Australia’s coal resources are among the largest in the world (Figure 1; Figure 2). In 2019, in situ Economic Demonstrated Resources (EDR) of black coal reached 89,707 million tonnes (Mt) and brown coal amounted to 85,634 Mt (Figure 2).
Recoverable resources, however, provide a more accurate assessment of coal endowment as it includes losses that occur during mining and processing. As at December 2019, Australia’s total recoverable Identified Resources of black coal were estimated at 165,315 Mt, of which recoverable EDR were 75,428 Mt (Figure 2). Australia is ranked fourth globally for economically demonstrated black coal resources after the United States, China and India.
As at December 2019, the total recoverable Identified Resource of brown coal was estimated at 433,360 Mt, of which recoverable EDR were 73,865 Mt (Figure 2). Australia is ranked second globally for economic demonstrated brown coal resources, behind Russia and followed by Germany and USA.
In Australia, black coal is produced in Queensland, New South Wales, Western Australia and Tasmania with a vast majority exported to overseas markets. By the end of 2019, export earnings from black coal totalled $63.9 billion, down from $66.8 billion at the end of 2018 (Department of Industry, Innovation and Science, 2020a). Japan and other Asian countries are prime destinations for Australian coal.
In 2019, coal exploration expenditure was $229 million, an increase of 32 per cent on 2018 ($174 million). Much of the expenditure occurred in Queensland, and coal exploration was nearly 9 per cent of the 2019 total exploration spend (Australian Bureau of Statistics, 2020).
Australia's identified resources
Australia’s coal resources are expressed as EDR, Subeconomic Demonstrated Resources and Inferred Resources as defined below:
- EDR combines proved reserves, probable reserves, and economic measured resources and indicated resources, as defined by the Australasian Code for Reporting of Exploration Results, Mineral Resources and Ore Reserves also called the 'JORC Code' (Joint Ore Reserves Committee [JORC], 2012);
- Subeconomic Demonstrated Resources are resources that are currently deemed unsuitable for economic extraction but could potentially be used in the future; and
- Inferred Resources are a less accurate estimate of a resource. They are those parts of a resource accumulation that are estimated at the lowest level of confidence; they are not differentiated as either economic or subeconomic because there is not enough information to make this determination.
A range of coal quality specifications are preferred for different markets. The specific energy of the coal is the amount of coal required to produce a given heat output—an important parameter for the thermal coal market. Ash is the non-combustible portion that remains when coal is heated at a high temperature, and coal naturally contains some moisture. Both ash and moisture dilute the amount of energy that a coal can produce. Coal ash creates extra costs due to the requirement for its capture and disposal, whereas moisture content increases the relative freight cost per unit of energy. Other important coal quality parameters include sulphur, volatile matter and carbon levels (Coalfield Geology Council of New South Wales, 2011).
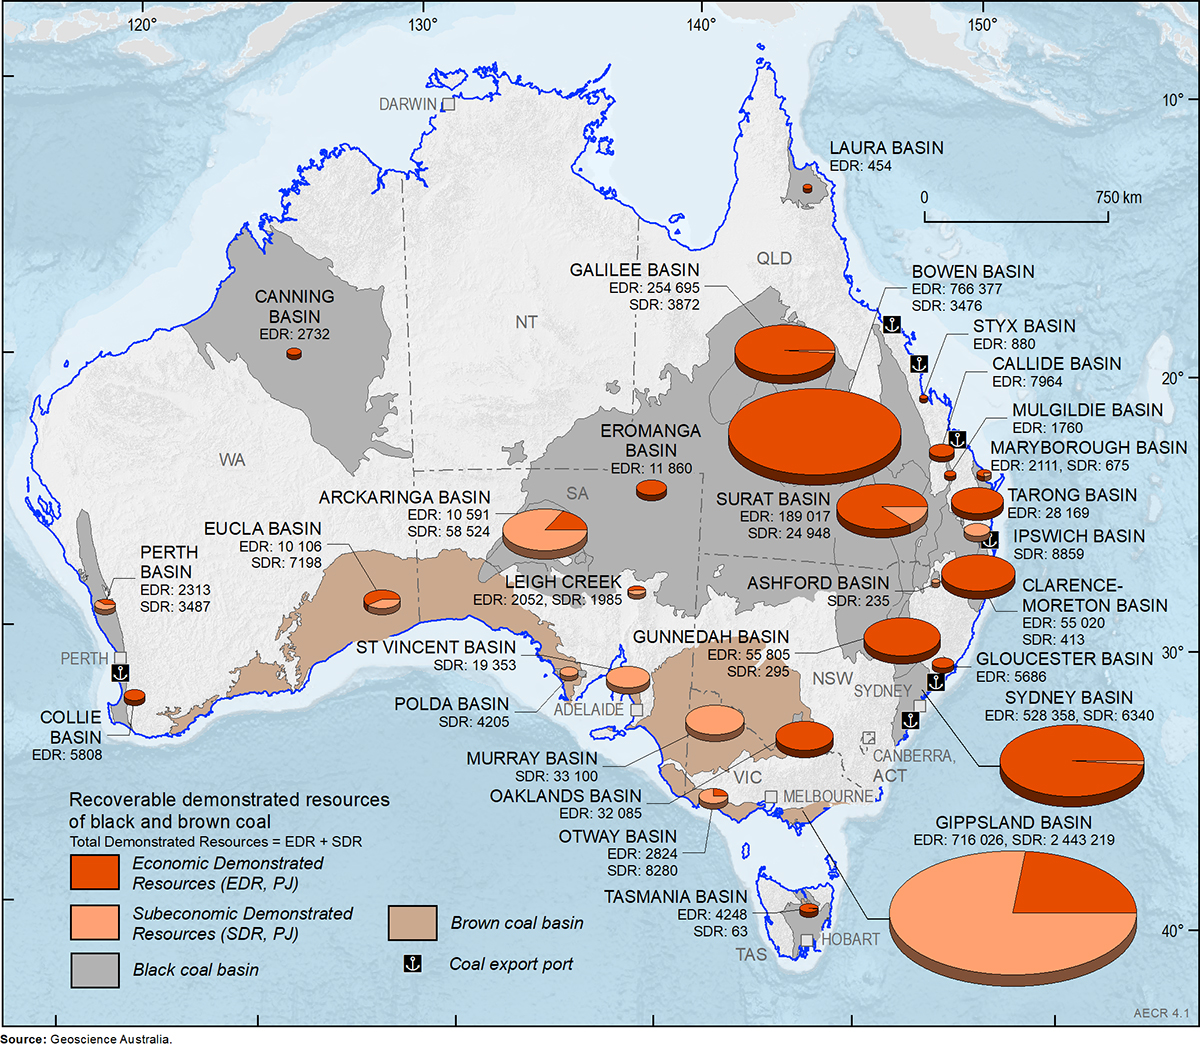
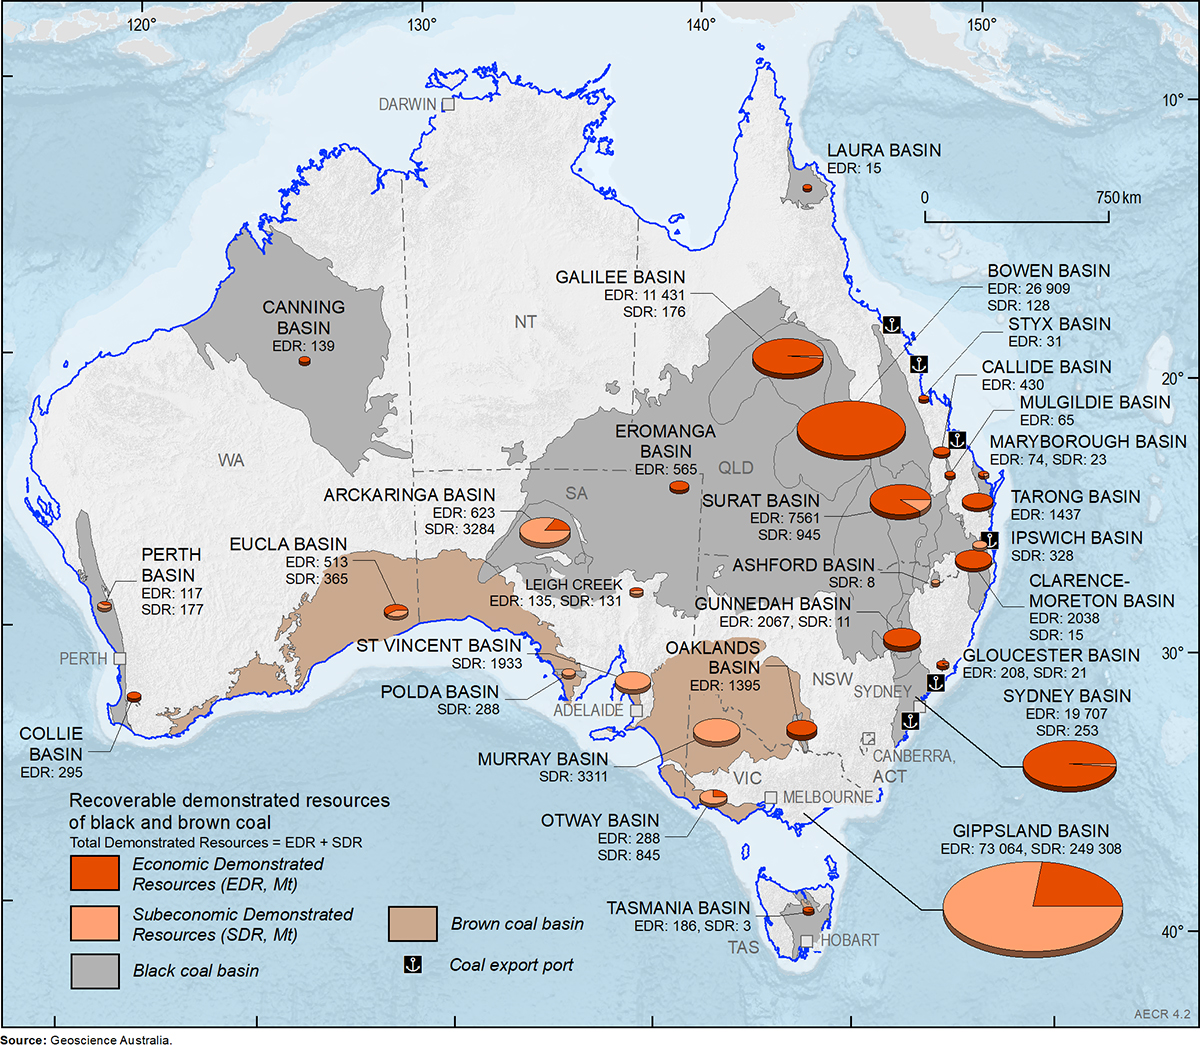
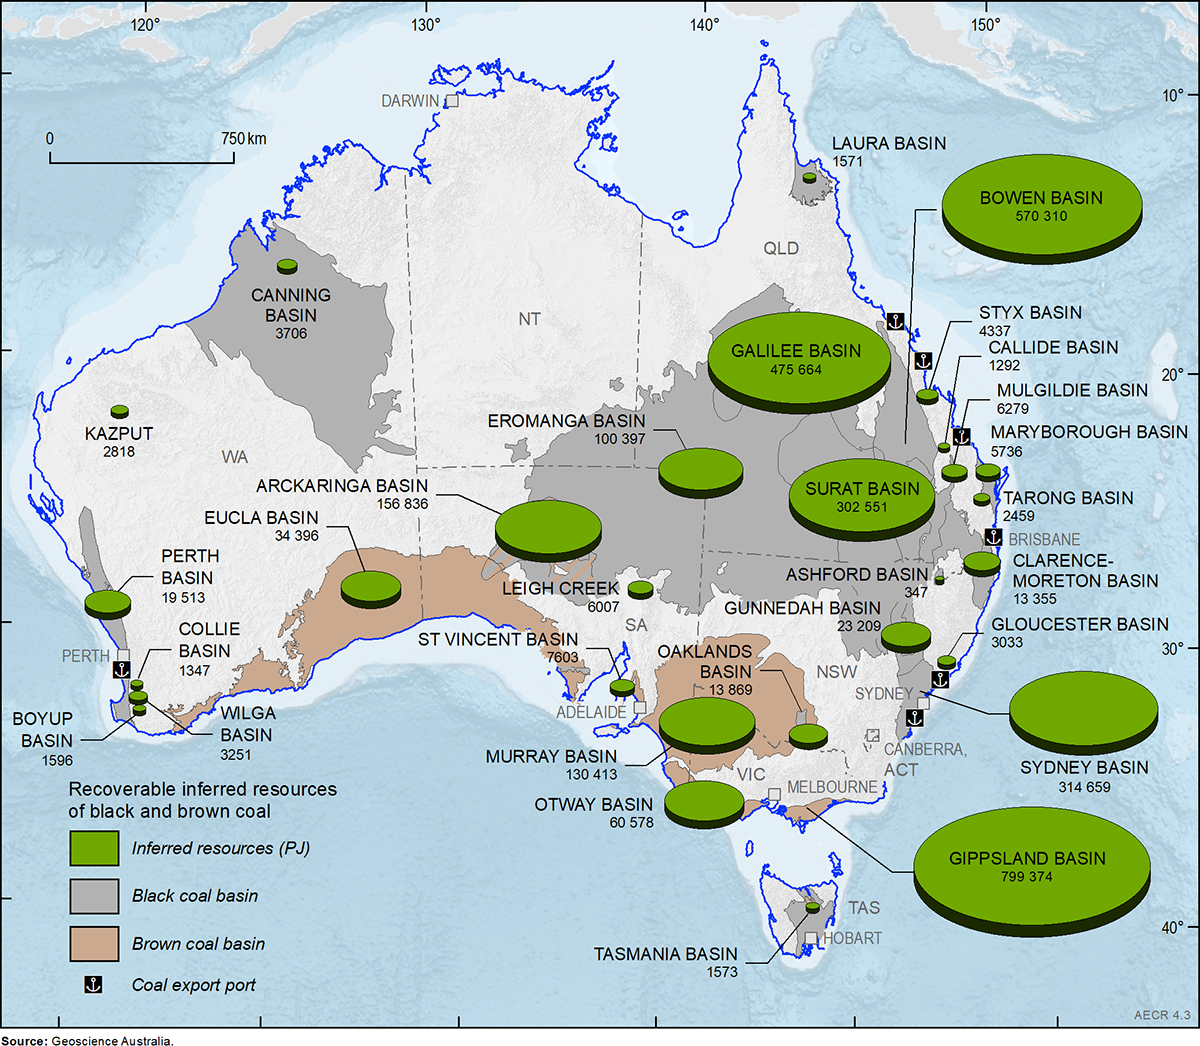
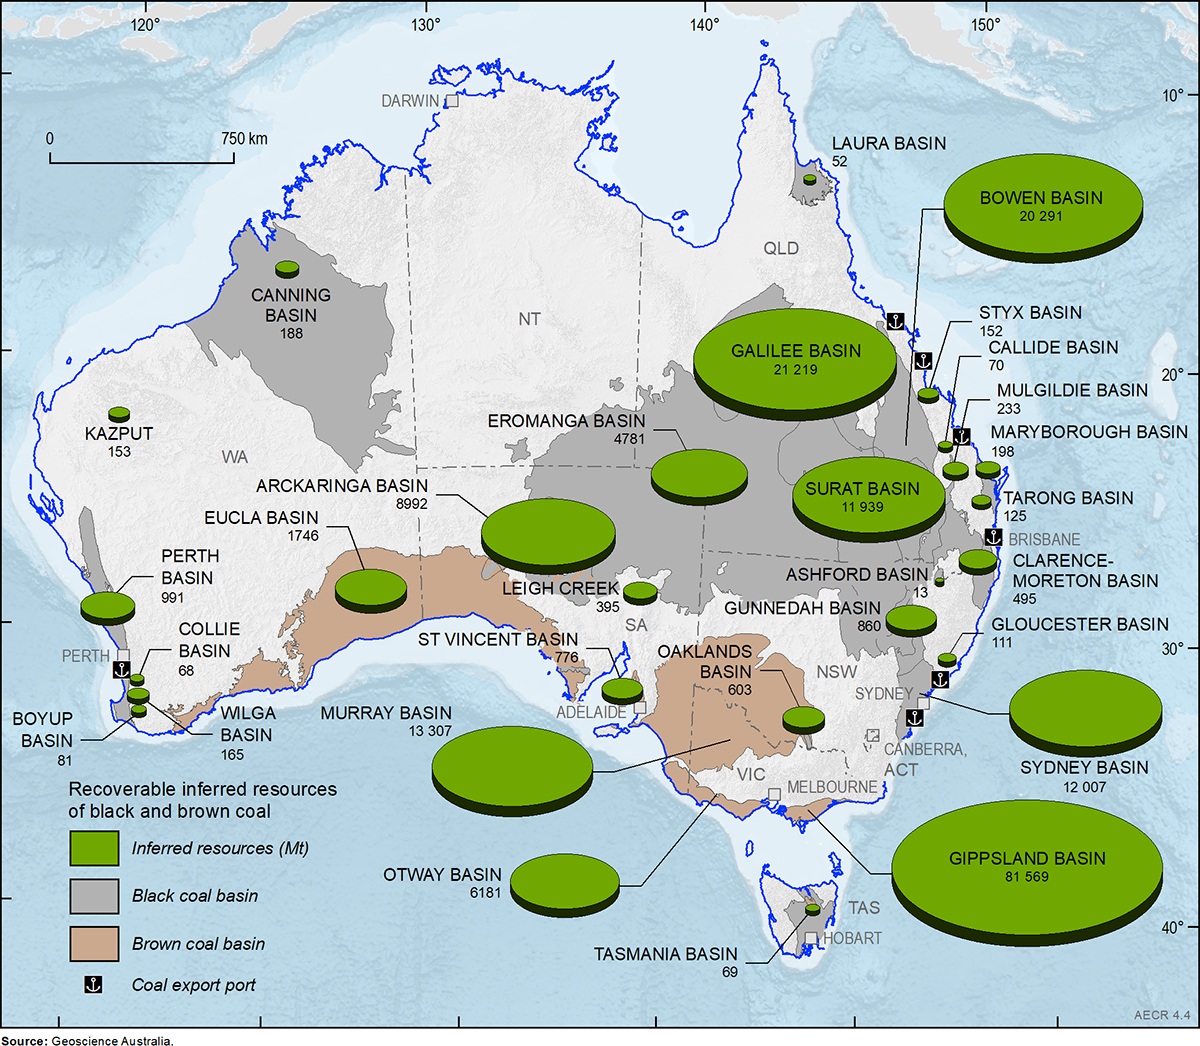
As at 31 December 2019, Australia had substantial EDR (Table 1 and Table 2; Figure 1 and Figure 2) and Inferred Resources (Table 1 and Table 2; Figure 3 and Figure 4) of black and brown coal, which contribute considerably to Australia’s resource potential.
Black coal
Most of Australia’s black coal EDR is in Queensland and New South Wales, followed by South Australia, Western Australia and Tasmania. There are two main types of black coal products; metallurgical coal and thermal coal. Metallurgical coal (also called met coal or coking coal) is mostly used for steel making and other industrial processes. Thermal coal (also called steaming coal) is used for electricity production.
Total in situ resources of black coal in Australia (EDR plus Subeconomic Demonstrated Resources plus Inferred Resources) are estimated at 202,316 Mt, comprising 89,707 Mt of EDR, 6,838 Mt of Subeconomic Demonstrated Resources and 105,772 Mt of Inferred Resources. Australia’s total recoverable Identified Resources of black coal are estimated to be 165,315 Mt, comprising 75,428 Mt of EDR, 5,791 Mt of Subeconomic Demonstrated Resources and 84,097 Mt of Inferred Resources (Table 1).
In 2019, the estimate of Australia’s recoverable EDR of black coal was revised upwards from 73,719 Mt to 75,428 Mt, an increase of 1,709 Mt, or 2.3 per cent, from the previous year. Large additions to EDR came from Queensland’s Bowen Basin at the Hutton Coking Coal Project (Valiant Resources), the Olive Downs Coking Coal Project (Pembroke Resources) and Hail Creek (Glencore). Wandoan (Glencore), in Queensland’s Surat Basin, also saw a large increase in EDR during 2019. In New South Wales’ Sydney Basin, Mount Pleasant (Mach Energy) and Mount Thorley (Yancoal) also reported increased EDR.
In 2019, contributions to Inferred Resources from the Bowen Basin came from Hail Creek (Glencore). In the Sydney Basin, Hunter Valley Operations (Yancoal: Glencore) reported a large increase in Inferred Resources.
Brown coal
Total in situ resources (all categories) of brown coal, are estimated to be approximately 489,355 Mt, of which in situ EDR are 85,634 Mt, Subeconomic Demonstrated Resources are 279,224 Mt and Inferred Resources are 124,496 Mt. Total recoverable Identified Resources of brown coal are estimated at 433,360 Mt, of which recoverable EDR are 73,865 Mt, Subeconomic Demonstrated Resources are 255,763 Mt and Inferred Resources are 103,732 Mt. Nearly all of Australia’s recoverable brown coal EDR is in Victoria, with more than 90 per cent in the Latrobe Valley.
Table 1. Australia's remaining black coal resources by basin area to year end 2019 (Mt and PJ)
| Basin | Black Coal | |||||
|---|---|---|---|---|---|---|
| EDR (Mt) | SDR (Mt) | Inferred (Mt) | EDR (PJ) | SDR (PJ) | Inferred (PJ) | |
| Arckaringa | 623 | 3,284 | 8,992 | 10,591 | 58,524 | 156,836 |
| Ashford | 0 | 8 | 13 | 0 | 235 | 347 |
| Bowen | 26,909 | 128 | 20,291 | 766,377 | 3,476 | 570,310 |
| Boyup | 0 | 0 | 81 | 0 | 0 | 1,596 |
| Callide | 430 | 0 | 70 | 7,964 | 0 | 1,292 |
| Canning | 139 | 0 | 188 | 2,732 | 0 | 3,706 |
| Clarence-Moreton | 2,038 | 15 | 495 | 55,020 | 413 | 13,355 |
| Collie | 295 | 0 | 68 | 5,808 | 0 | 1,347 |
| Eromanga | 565 | 0 | 4,781 | 11,860 | 0 | 100,397 |
| Galilee | 11,431 | 176 | 21,219 | 254,695 | 3,872 | 475,664 |
| Gloucester | 208 | 21 | 111 | 5,686 | 0 | 3,033 |
| Gunnedah | 2,067 | 11 | 860 | 55,805 | 295 | 23,209 |
| Ipswich | 0 | 328 | 0 | 0 | 8,859 | 0 |
| Laura | 15 | 0 | 52 | 454 | 0 | 1,571 |
| Telford | 135 | 131 | 395 | 2,052 | 1,985 | 6,007 |
| Maryborough | 74 | 23 | 198 | 2,111 | 675 | 5,736 |
| Mulgildie | 65 | 0 | 233 | 1,760 | 0 | 6,279 |
| Oaklands | 1,395 | 0 | 603 | 32,085 | 0 | 13,869 |
| Perth | 117 | 177 | 991 | 2,313 | 3,487 | 19,513 |
| Polda | 0 | 288 | 0 | 0 | 4,205 | 0 |
| Styx | 31 | 0 | 152 | 880 | 0 | 4,337 |
| Surat | 7,561 | 945 | 11,939 | 189,017 | 24,948 | 302,551 |
| Sydney | 19,707 | 253 | 12,007 | 528,358 | 6,340 | 314,659 |
| Tarong | 1,437 | 0 | 125 | 28,169 | 0 | 2,459 |
| Tasmania | 186 | 3 | 69 | 4,248 | 63 | 1,573 |
| Wilga | 0 | 0 | 165 | 0 | 0 | 3,251 |
| Total | 75,428 | 5,791 | 84,097 | 1,967,985 | 117,377 | 2,032,895 |
Notes: Additional coal resources are also present outside of these basin areas, which are included in the totals documented in AECR. The data shown have been rounded. EDR = economic demonstrated resources. SDR = sub-economic demonstrated resources. Mt = million tonnes. PJ = petajoules. Source: Geoscience Australia OZMIN database, accessed 15th September 2020.
Table 2. Australia's remaining brown coal resources by basin area to year end 2019 (Mt and PJ)
| Basin | Brown Coal | |||||
|---|---|---|---|---|---|---|
| EDR (Mt) | SDR (Mt) | Inferred (Mt) | EDR (PJ) | SDR (PJ) | Inferred (PJ) | |
| Eucla | 513 | 365 | 1,746 | 10,106 | 7,198 | 34,396 |
| Gippsland | 73,064 | 249,308 | 81,569 | 716,026 | 2,443,219 | 799,374 |
| Kazput* | 0 | 0 | 153 | 0 | 0 | 2,818 |
| Murray | 0 | 3,311 | 13,307 | 0 | 33,100 | 130,413 |
| Otway | 288 | 845 | 6,181 | 2,824 | 8,280 | 60,578 |
| St Vincent | 0 | 1,933 | 776 | 0 | 19,353 | 7,603 |
| Total | 73,865 | 255,763 | 103,732 | 728,956 | 2,511,151 | 1,035,181 |
Notes: Additional coal resources are also present outside of these basin areas, which are included in the totals documented in AECR. The data shown have been rounded. EDR = economic demonstrated resources. SDR = sub-economic demonstrated resources. Mt = million tonnes. PJ = petajoules. Source: Geoscience Australia OZMIN database, accessed 15th September 2020.
New technology coal projects
Hydrogen Energy Supply Chain project
The Hydrogen Energy Supply Chain pilot project is a one-year pilot project that will demonstrate the production and supply of hydrogen gas from brown coal in Victoria. The pilot project is a Japanese-Australian collaboration, whereby brown coal from Loy Yang mine will be used to make hydrogen at a trial plant at AGL’s Loy Yang complex. The coastal waters (three-mile zone) part of the Gippsland Basin contains geological structures that are being considered for carbon dioxide storage from blue hydrogen production with support from the Victorian (Victoria State Government, 2020) and Australian governments. Construction of the hydrogen plant commenced in 2019 and the project commenced operations in March 2021, after the project participants reported the initial production of hydrogen gas from brown coal in February. During the next stages of the pilot project, hydrogen will be liquefied at a facility at the Port of Hastings, loaded on to a specialised marine carrier and shipped to Japan where it will be used in hydrogen fuel cell vehicles and residences.
Leigh Creek Energy Project
The Leigh Creek Energy Project will utilise in-situ gasification technology to produce syngas from deep coal resources at Leigh Creek in South Australia. A pre-commercial demonstration plant was established at Leigh Creek, with a successful trial production of syngas having commenced October 2018 being completed in June 2019.
While syngas can be used to produce electricity and a variety of products, the proponent’s pre-feasibility study suggests that urea fertiliser, on-site power and possibly hydrogen are the most likely outputs. Downstream processing will take place on-site at purpose-built facilities and the proponent is investigating carbon capture and storage (geological storage) options to store the carbon dioxide by-product from the project. Australia is heavily reliant on imports for urea fertiliser, and the project could bolster local supply with surplus stocks potentially being exported. The proponent has been issued a petroleum production license, and in March 2021 made the Final Investment Decision for Stage 1 of the project involving the drilling of five new syngas wells and construction of a 5 MW power plant (Leigh Creek Energy, 2021).
Production
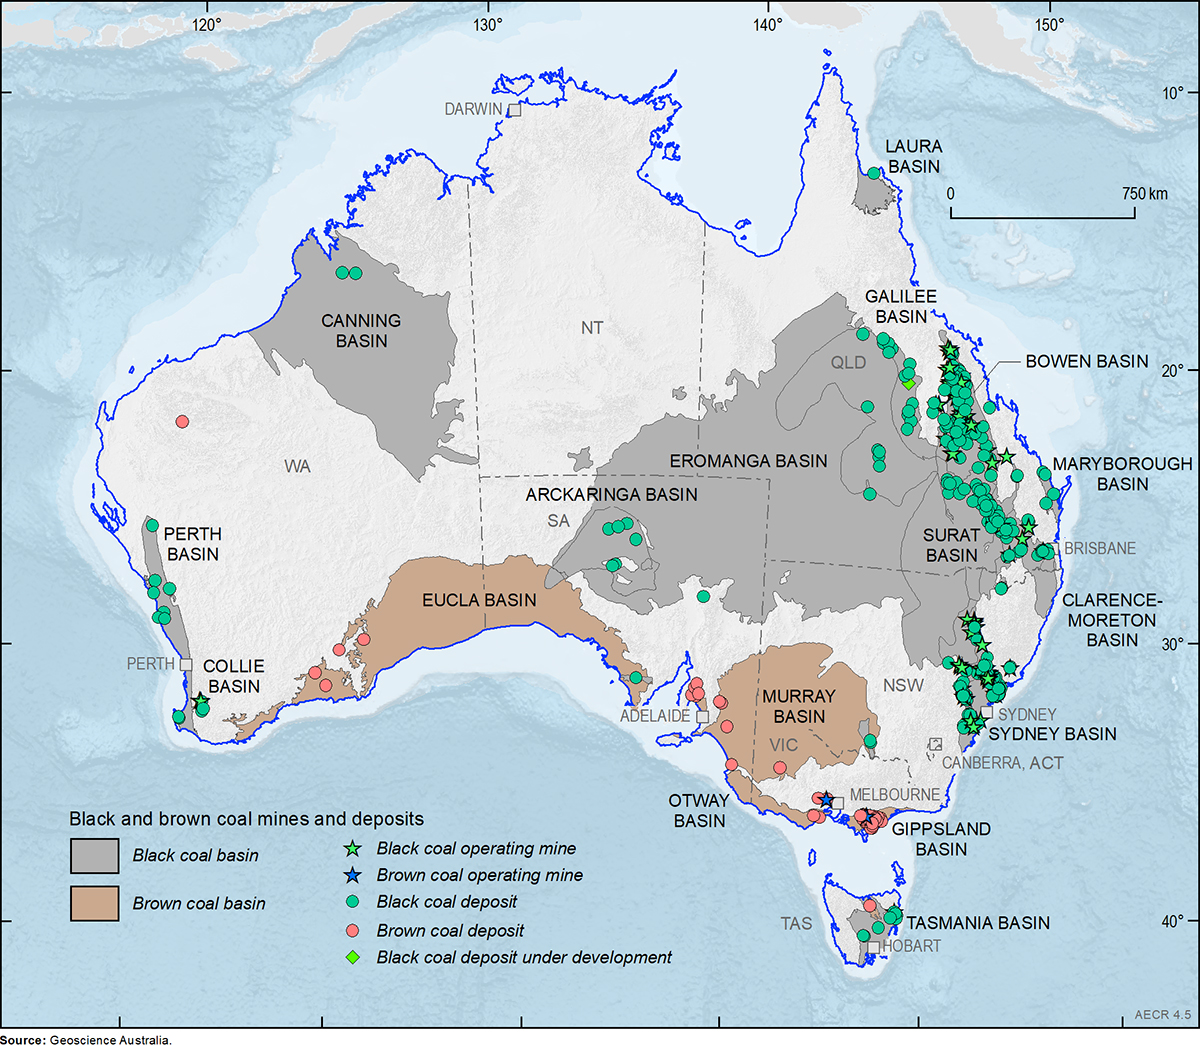
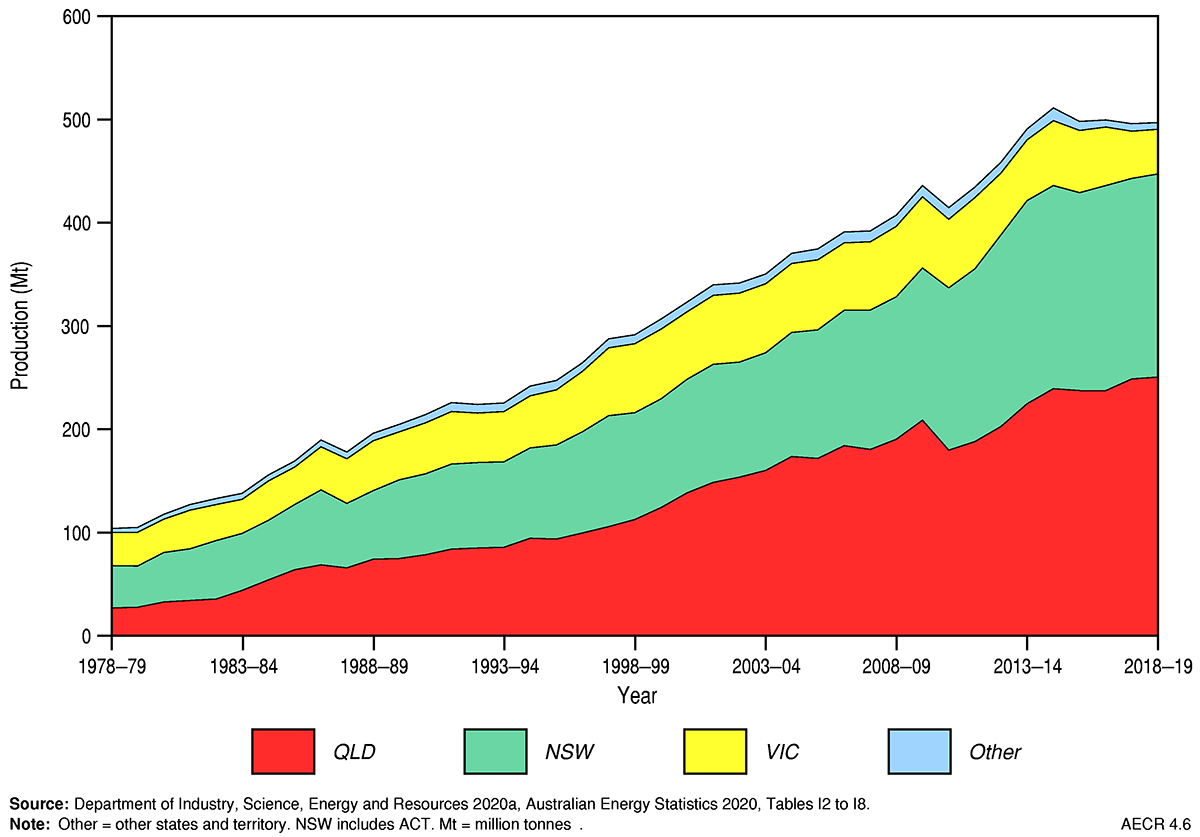
During 2019, Australia had 96 operating black coal mines, 3 operating brown coal mines (Figure 5), and more than 200 known coal deposits. The majority of Australia’s black coal mines are in Queensland and New South Wales, which accounted for approximately 50 per cent and 40 per cent, respectively, of Australia’s 2018–19 coal production (Figure 6). Brown coal produced in Victoria, mainly from the Gippsland Basin, contributed 9 per cent to total coal production in 2018–19.
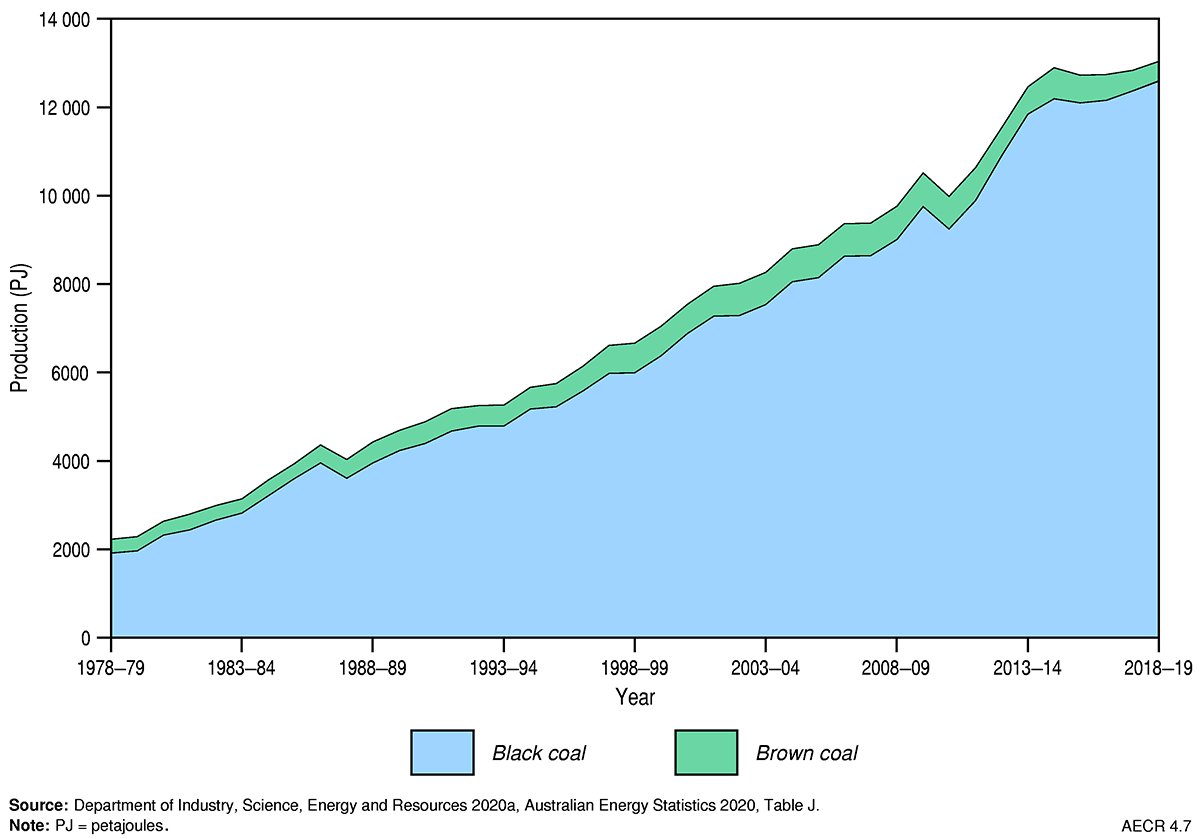
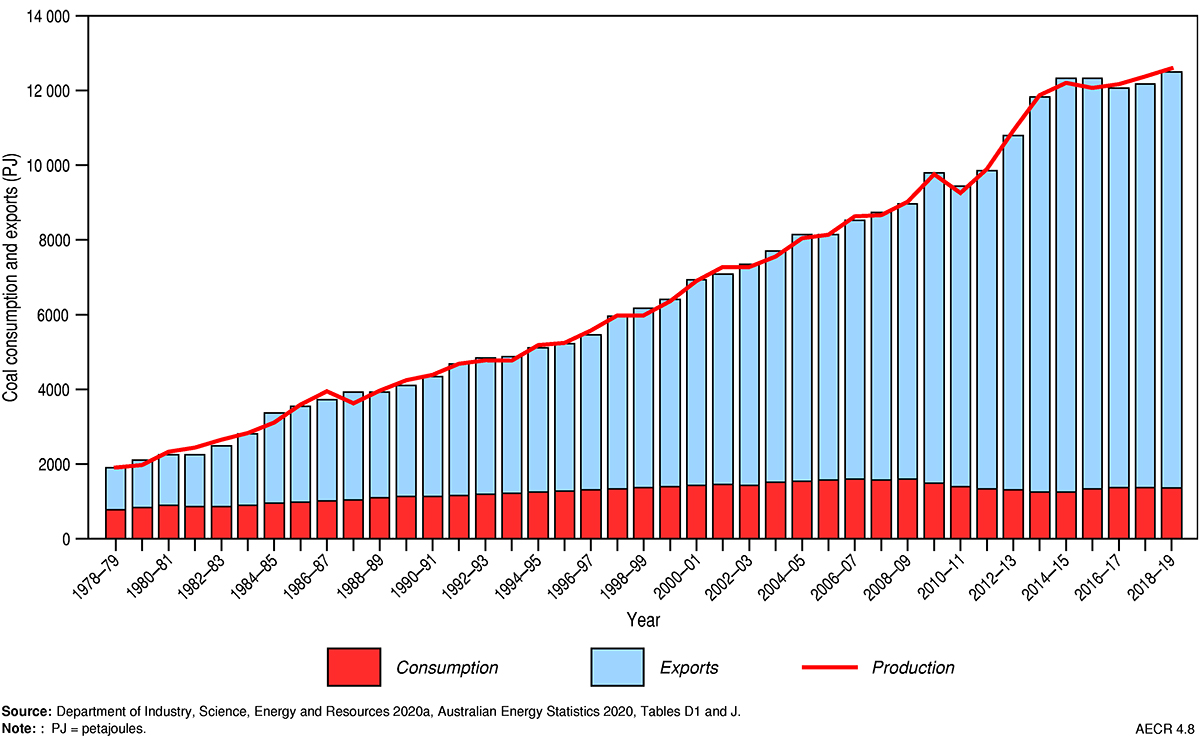
In 2018–19, Australia’s production of saleable black and brown coal was 13,038 PJ, which accounted for 66 per cent of total energy production (excluding uranium production; Department of Industry, Science, Energy and Resources, 2020a). Over the past decade, coal production has grown by an average annual rate of 3 per cent, moderated by a fall of production in 2010–11 due to flooding in Queensland (Figure 7). The bulk of coal production growth experienced in this period was driven by growth in export markets. In 2018–19, 88 per cent of domestically produced black coal was exported (Figure 8).
Trade
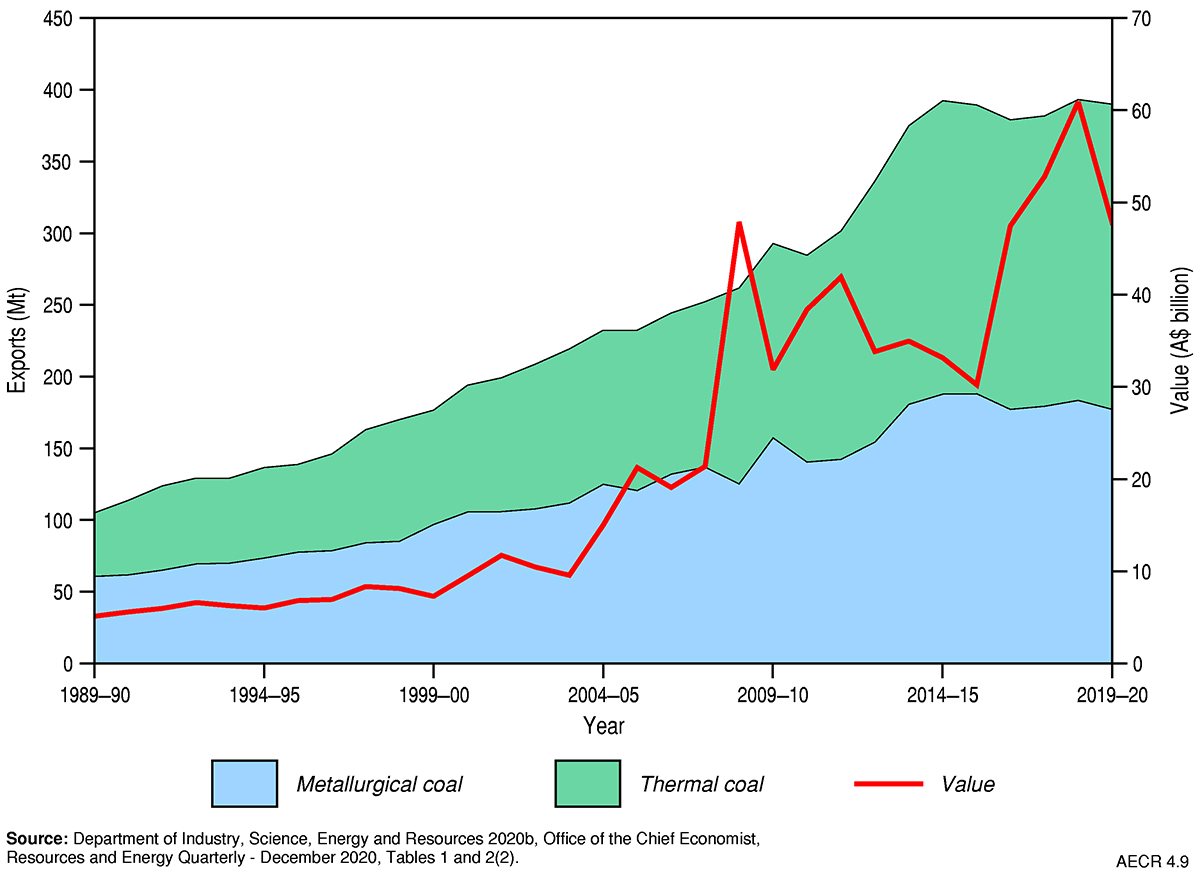
Australia exports the majority of its coal, capitalising on its abundant coal resources and strong ongoing coal demand from Asia. Australia exported 11,131 PJ of coal and coal products in 2018–19, which was about 70 per cent of Australia’s total energy exports (Department of Industry, Science, Energy and Resources, 2020a). The total value of coal exports increased by an average growth rate of 2.4 per cent a year from $54.7 billion in 2008–09 to $69.6 billion in 2018–19 (Figure 9).
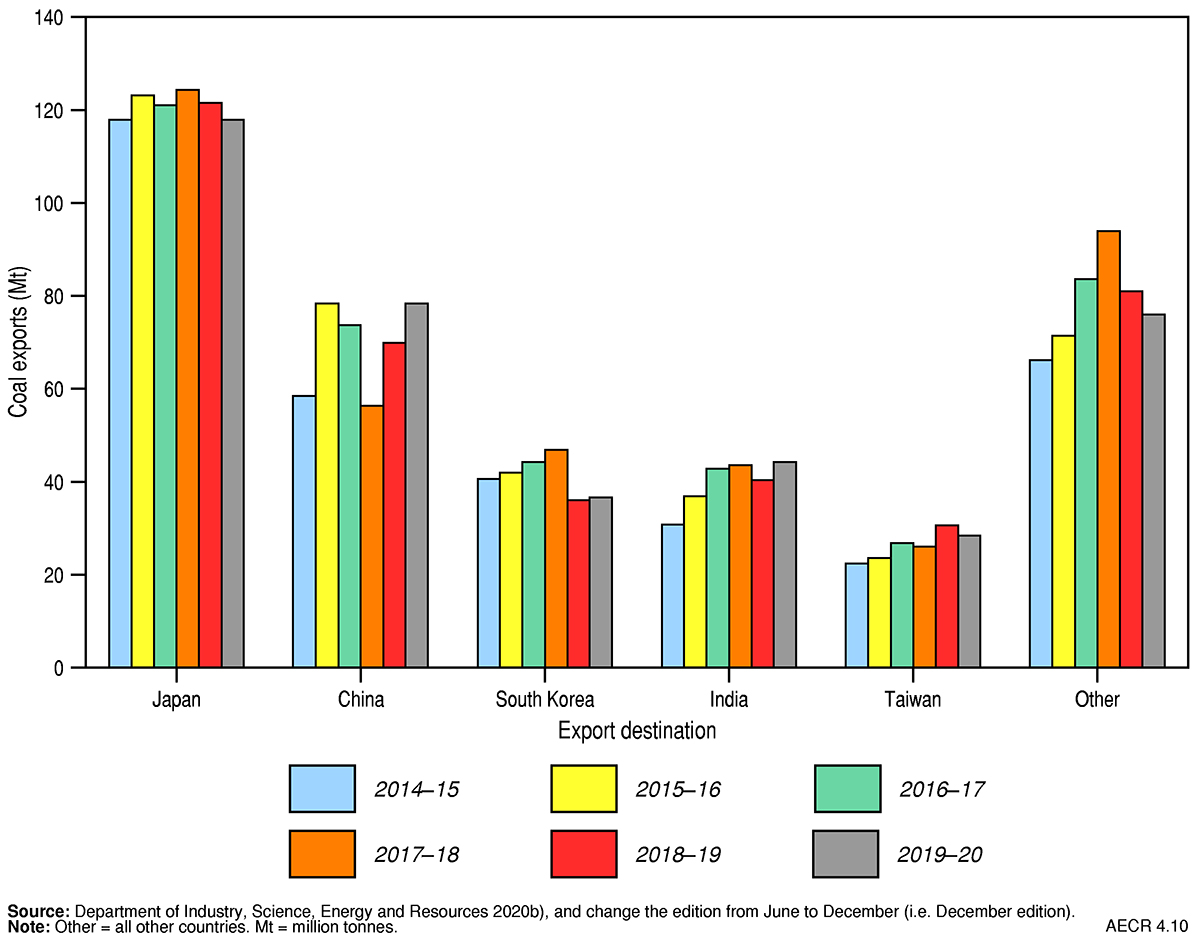
In 2019, the Newcastle benchmark thermal coal spot price averaged US$82/t, compared to US$106/t in 2018, and the premium hard coking coal spot price averaged US$177/t, compared to US$206/t in 2018. Export volumes to Japan and China remained high, and volumes (Figure 10) to India, South Korea and Taiwan have continued to increase. Coal export volumes grew at an average annual rate of 2.2 per cent from 336 Mt in 2012–13 to 393 Mt in 2018–19. Total coal exports increased by about 3 per cent in 2018–19, consistent with the average annual growth between 2009 and 2019 (Department of Industry, Science, Energy and Resources, 2020b). Greater demand for coal resources in China, India and Taiwan have contributed to recent increases in Australian coal export volumes.
World rankings
Reserves
In 2019, Australia held 14 per cent of the world’s coal reserves (black and brown), ranking third behind the United States (24 per cent) and Russia (15 per cent) (BP 2019; Figure 11; Table 3 and Table 4).
In respect of black coal, Australia is thought to hold about 10 per cent of world economic resources and ranks fourth behind the United States (29 per cent), China (18 per cent) and India (13 per cent), while for brown coal our share of the world’s economic resources is believed to be in the order of 24 per cent, ranking Australia second in the world behind Russia (28 per cent) (Senior et al., 2021).
Production
In 2019, Australia accounted for:
- 6 per cent of global black coal production and was the world’s fifth largest producer of black coal after China, India, the United States and Indonesia; and
- 6 per cent of the world's brown coal production and was the seventh largest producer after Germany, Turkey, Russia, Poland, the United States and India (International Energy Agency, 2020).
Export
In 2019–20 Australia was the world’s largest exporter of metallurgical coal and the second largest exporter of thermal coal (Table 4; Department of Industry, Science, Energy and Resources, 2020b).
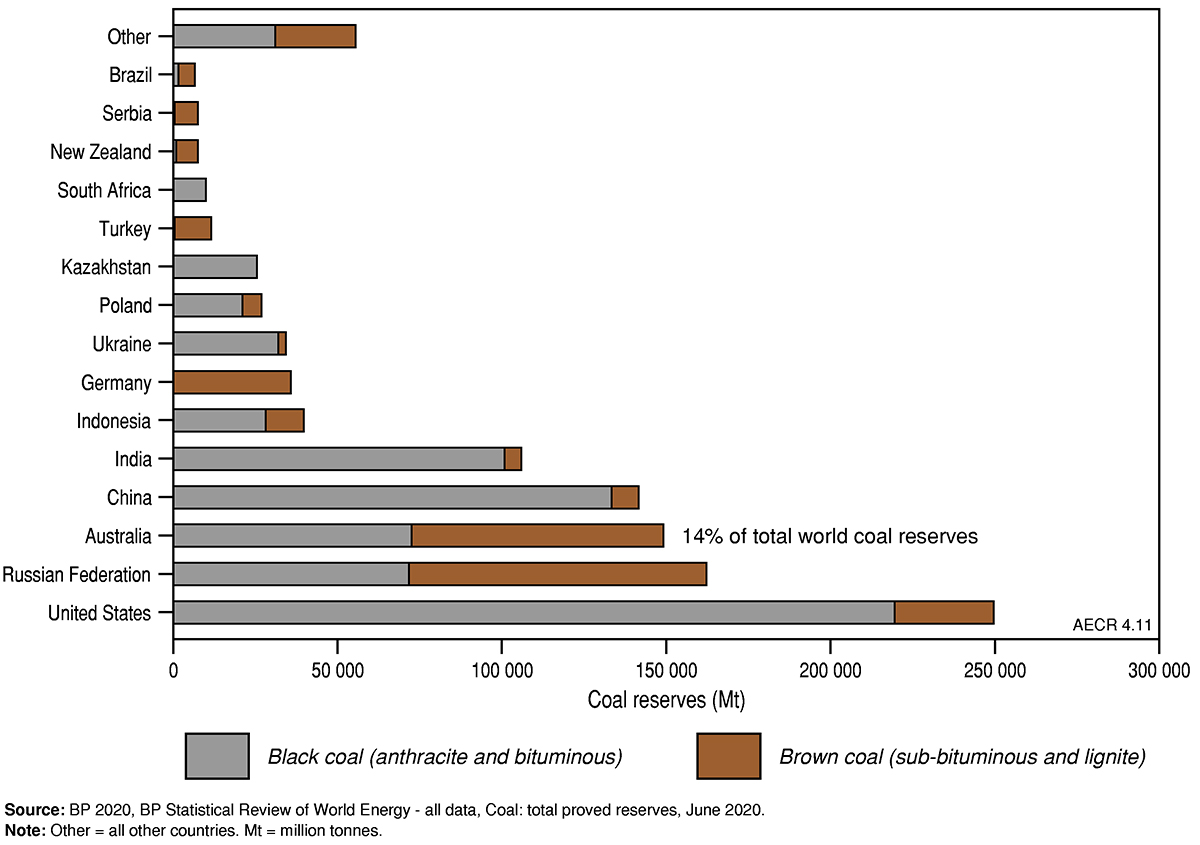
Table 3. Key coal statistics (physical units)
| Australia 2019 | OECD 2019 | World 2019 | ||
|---|---|---|---|---|
| Resources | ||||
| Proved reserves (at end of year) | Mt | 149,293a | 501,196b | 1,069,636b |
| of which: Black coal (anthracite and bituminous) | Mt | 75,428a | 324,066b | 749,167b |
| of which: Brown coal (sub-bituminous1 and lignite) | Mt | 73,865a | 177,130b | 320,469b |
| Share of world coal reserves | % | 13.9b | 46.9b | 100b |
| World ranking | no. | 3b | na | na |
| Production | ||||
| Annual production | Mt | 507b | 1,650 | 8,129b |
| Share of world annual coal production | % | 6.2b | 20.3b | 100b |
| CAGR from 2009 | % | 1.8b | -2.3b | 1.4b |
| World ranking | no. | 5b | na | na |
Notes: 1Sub-bituminous coal has properties that range from those of brown coal to those of black coal—there is therefore some variation in this terminology across countries. aRecoverable economic demonstrated resource (EDR). bproved reserves of coal as defined by BP. OECD = Organisation for Economic Co-operation and Development countries. CAGR = compound annual growth rate. Mt = million tonnes. na = not available. Source: aGeoscience Australia; bBP (2020) BP Statistical Review of World Energy.
Table 4. Key coal statistics (energy units)
| Australia 2018-19 | OECD 2019 | World 2019 | ||
|---|---|---|---|---|
| Production | PJ | 13,038 | 33,895 | 167,575 |
| Share of world coal production | % | 7.9 | 20.2 | 100 |
| CAGR from 2009 | % | 2.6 | -1.9 | 1.6 |
| Coal exports | PJ | 11,131 | na | 35,284 |
| CAGR from 2009 | % | 3.3 | na | 4.5 |
| Coal export value | A$b | 69.59 | na | na |
| of which: Metallurgical coal and coke | A$b | 43.64 | na | na |
| of which: Thermal coal | A$b | 25.96 | na | na |
| World ranking | no. | 1a | na | na |
Notes: aAustralia is ranked as the world’s largest exporter of metallurgical coal and second largest exporter of thermal coal. Definitions vary between data sourced from the International Energy Agency (IEA) and the Australian Energy Statistics (AES). For example, the IEA data are reported as net energy content, whereas AES data are reported as gross energy content. OECD = Organisation for Economic Co-operation and Development countries. CAGR = compound annual growth rate. na = not available. PJ = petajoules. A$b = billion Australian dollars. Source: Australian Energy Statistics 2020, Tables A2, J, N published by Industry, Science, Energy and Resources (2020a); Resources and Energy Quarterly - June 2020, Tables 24(1) and 24(2), published by Department of Industry, Science, Energy and Resources (2020b); BP (2020) BP Statistical Review of World Energy.
References
Australian Bureau of Statistics 2020. 8412.0 Mineral and Petroleum Exploration, Australia, Table 5. September 2020 (last accessed 27 April 2021).
BP 2020. Statistical Review of World Energy (last accessed 27 April 2021).
Coalfield Geology Council of New South Wales 2011. Coal quality assessment for geology and mining, short course notes, Coalfield Geology Council of New South Wales, Hunter Region, NSW.
Department of Industry, Science, Energy and Resources 2020a. Australian Energy Statistics (last accessed 27 April 2021).
Department of Industry, Science, Energy and Resources 2020b. Resources and Energy Quarterly, June 2020 (last accessed 27 April 2021).
International Energy Agency 2020. Statistics Report, Coal Information Overview (last accessed 27 April 2021).
Joint Ore Reserves Committee 2012. Australasian Code for Reporting of Exploration Results, Mineral Resources and Ore Reserves. The JORC Code (last accessed 18 February 2020).
Leigh Creek Energy 2021. Final Investment Decision for Stage 1. ASX Release 20210315 (last accessed 27 April 2021).
Senior, A, Cross, A., Champion, D, Huston, D., Bastrakov, E., Sexton, M., Moloney, J., Pheeney, J., Teh, M., and Schofield, A. 2021. Australia’s Identified Mineral Resources 2020. Geoscience Australia, Canberra (last accessed 27 April 2021).
Victoria State Government 2020. The CarbonNet Project (last accessed 27 April 2021).
Data download
Australia’s Energy Commodity Resources: 2018 and 2019 Data Tables.