

Key messages
- Natural gas is formed when accumulations of organic matter are buried and exposed to increasing heat and pressure over geological time. The generated gas consists of a mixture of methane and often other heavier hydrocarbons, as well as other gases including carbon dioxide, nitrogen, hydrogen sulphide and helium.
- Liquefied natural gas (LNG) is a natural gas that has been cooled to minus 162°C, a process that is commonly done for gas export purposes as it reduces the volume of the transported gas.
- Australia has substantial conventional gas resources, the largest of which are located offshore, and significant onshore unconventional gas resources.
- Australia is the seventh largest gas producer in the world.
- Exports of LNG have increased significantly over the past decade, with several new facilities commencing production including Wheatstone, Ichthys and Prelude. In 2020, Qatar and Australia were the world’s largest LNG exporters.
Summary
Australia has substantial gas resources (Figure 1 and Figure 2). In this report, ‘gas resources’ refers to conventional and unconventional gas resources, including coal seam gas (CSG), shale gas, tight gas, basin centred gas and in-situ gasification products. Conventional gas and coal seam gas remain Australia’s most important gas resources for production and trade.
Australia’s identified conventional gas resources have grown substantially, increasing fivefold since the discovery of the supergiant (>10 trillion cubic feet ‘Tcf’) and giant (>3 Tcf) gas fields on the North West Shelf in the early 1970s. About 93 per cent of conventional gas resources are located on the North West Shelf. Gas produced from the Northern Carnarvon, Browse and Bonaparte basins provide feedstock to seven LNG projects (Gorgon, Wheatstone, North West Shelf, Pluto, Prelude, Ichthys and Darwin).
CSG is largely methane gas that is extracted from shallow coal seams (<1,500 m depth) using hydraulic stimulation. Most of Australia’s CSG resources are produced in Queensland, where they form feedstock for three major LNG projects (Curtis Island LNG, Australia Pacific LNG and Gladstone LNG).
Other significant unconventional gas resource potential exists in onshore basins, including from deep CSG, shale gas, tight gas and basin centred gas resources and from in-situ gasification. Production of these unconventional gas resources has been limited to minor shale gas and tight gas in the Cooper Basin, which has supplied some gas to the East Coast Gas Market (Santos, 2018).
Gas resources are reported as best estimate of reserves (2P) and best estimate of contingent resources (2C) using the SPE-Petroleum Resources Management System. Reserves are commercially recoverable amounts of petroleum that remain in known accumulations, of which 2P reserves are the best estimate (the sum of Proved plus Probable Reserves). Australia’s 2P reserves in 2019 are estimated as 74,992 petajoules (PJ; 66.69 Tcf) for conventional gas and 31,597 PJ (29.79 Tcf) for unconventional CSG (Table 1 and Table 2; Figure 1 and Figure 2). At 2019 annual gas production rates of 6,245 PJ, this is the equivalent of 17 years of production for all gas reserves.
Contingent resources are potentially recoverable amounts of petroleum in known accumulations, of which 2C contingent resources are the best estimate. Contingent resources are not yet considered to be commercially recoverable due to one or more technical, commercial or other factors. Australia’s 2C contingent resources in 2019 are estimated as 121,140 PJ (107.71 Tcf) for conventional gas and 26,652 PJ (23.70 Tcf) for unconventional CSG (Table 1 and Table 2; Figure 1 and Figure 2).
Gas production overall has increased substantially, primarily driven by a rapid expansion of the Australian LNG industry on both the west and east coasts. These gas projects feed into both the domestic market and the international export market. About 74 per cent of natural gas production was exported in 2018‑19. Australia and Qatar are currently the world’s largest exporters of LNG.
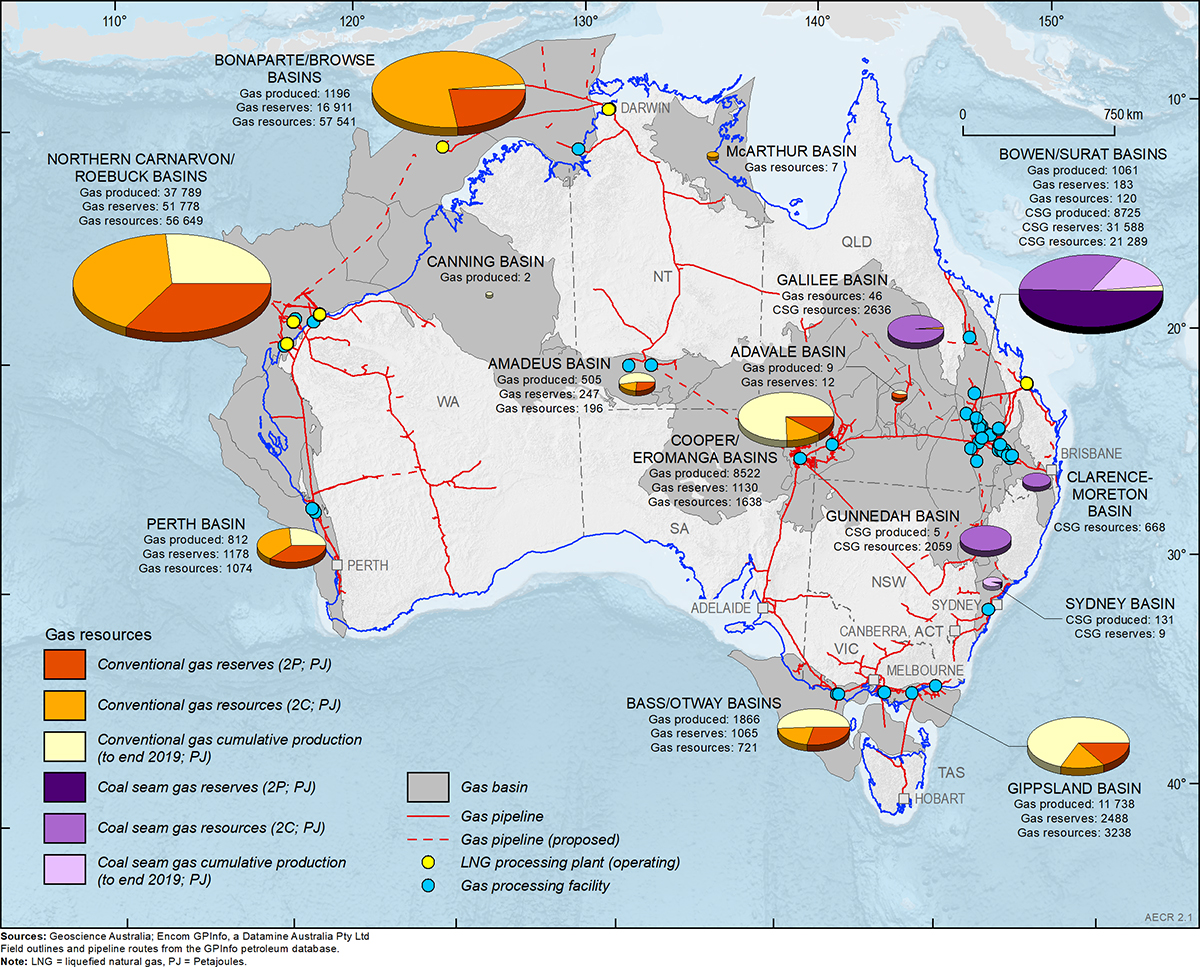
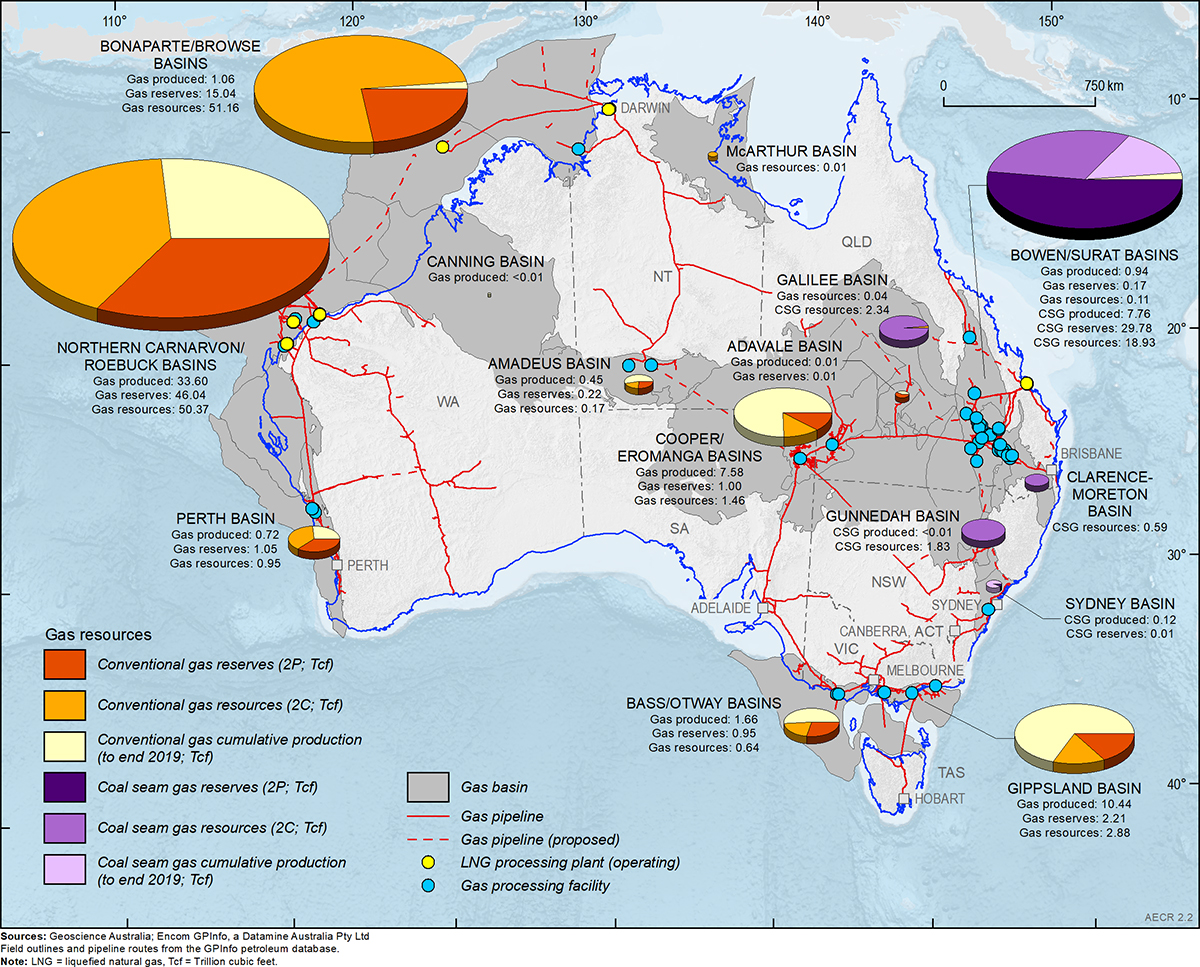
Table 1. Australia's remaining gas reserves (2P) and contingent resources (2C) during 2019 and cumulative production to end 2019 (PJ)
| Basin | Conventional gas | Coal seam gas | ||||
|---|---|---|---|---|---|---|
| Cumulative production | Reserves (2P) | Resources (2C) | Cumulative production | Reserves (2P) | Resources (2C) | |
| Adavale | 9 | 12 | 0 | 0 | 0 | 0 |
| Amadeus | 505 | 247 | 196 | 0 | 0 | 0 |
| Bass/Otway | 1,866 | 1,065 | 721 | 0 | 0 | 0 |
| Bonaparte/Browse | 1,196 | 16,911 | 57,541 | 0 | 0 | 0 |
| Bowen/Surat | 1,061 | 183 | 120 | 8,725 | 31,588 | 21,289 |
| Canning | 2 | 0 | 0 | 0 | 0 | 0 |
| Northern Carnarvon/Roebuck | 37,789 | 51,778 | 56,649 | 0 | 0 | 0 |
| Clarence-Moreton | 0 | 0 | 0 | 0 | 0 | 668 |
| Cooper/Eromanga | 8,522 | 1,130 | 1,638 | 0 | 0 | 0 |
| Galilee | 0 | 0 | 46 | 0 | 0 | 2,636 |
| Gippsland | 11,738 | 2,488 | 3,149 | 0 | 0 | 0 |
| Gunnedah | 0 | 0 | 0 | 5 | 0 | 2,059 |
| McArthur | 0 | 0 | 7 | 0 | 0 | 0 |
| Perth | 812 | 1,178 | 1,074 | 0 | 0 | 0 |
| Sydney | 0 | 0 | 0 | 131 | 9 | 0 |
| Total | 63,500 | 74,992 | 121,140 | 8,861 | 31,597 | 26,652 |
Notes: Data from the former Joint Petroleum Development Area (JPDA) have been omitted from Bonaparte Basin totals. PJ = petajoules. Source: Offshore data provided by NOPTA to year-end 2019; onshore data are sourced from government statistics and company estimates reported at various dates between June 2019 and June 2020.
Table 2. Australia's remaining gas reserves (2P) and contingent resources (2C) during 2019 and cumulative production to end 2019 (Tcf)
| Basin | Conventional gas | Coal seam gas | ||||
|---|---|---|---|---|---|---|
| Cumulative production | Reserves (2P) | Resources (2C) | Cumulative production | Reserves (2P) | Resources (2C) | |
| Adavale | 0.01 | 0.01 | 0 | 0 | 0 | 0 |
| Amadeus | 0.45 | 0.22 | 0.17 | 0 | 0 | 0 |
| Bass/Otway | 1.66 | 0.95 | 0.64 | 0 | 0 | 0 |
| Bonaparte/Browse | 1.06 | 15.04 | 51.16 | 0 | 0 | 0 |
| Bowen/Surat | 0.94 | 0.17 | 0.11 | 7.76 | 29.78 | 18.93 |
| Canning | <0.01 | 0 | 0 | 0 | 0 | 0 |
| Northern Carnarvon/Roebuck | 33.60 | 46.04 | 50.37 | 0 | 0 | 0 |
| Clarence-Moreton | 0 | 0 | 0 | 0 | 0 | 0.59 |
| Cooper/Eromanga | 7.58 | 1.00 | 1.46 | 0 | 0 | 0 |
| Galilee | 0 | 0 | 0.04 | 0 | 0 | 2.34 |
| Gippsland | 10.44 | 2.21 | 2.80 | 0 | 0 | 0 |
| Gunnedah | 0 | 0 | 0 | <0.01 | 0 | 1.83 |
| McArthur | 0 | 0 | 0.01 | 0 | 0 | 0 |
| Perth | 0.72 | 1.05 | 0.95 | 0 | 0 | 0 |
| Sydney | 0 | 0 | 0 | 0.12 | 0.01 | 0 |
| Total | 56.46 | 66.69 | 107.71 | 7.88 | 29.79 | 23.70 |
Notes: Data from the former Joint Petroleum Development Area (JPDA) have been omitted from Bonaparte Basin totals. Tcf = trillion cubic feet. Source: Offshore data provided by NOPTA to year-end 2019; onshore data are sourced from government statistics and company estimates reported at various dates between June 2019 and June 2020.
Australia's identified gas resources
Identified resources are those that have been discovered and their locations, quantity and quality are known from measurements or direct geological evidence. Identified gas resources, for the purposes of this report, are the equivalent of discovered 2P reserves and 2C contingent resources in the SPE-Petroleum Resources Management System.
The 2019 resource estimates compiled for this report are based on publicly available onshore data aggregated with confidential offshore data submitted to the National Offshore Petroleum Titles Administrator (NOPTA). Offshore data are reported for calendar year 2019, while onshore data are based on government statistics and company estimates reported at various dates between June 2019 and June 2020. The data are aggregated for composite basin regions where necessary to de-identify confidential offshore field data in the custody of NOPTA.
Australia’s estimated conventional gas resources in 2019 include 74,992 PJ (66.69 Tcf) of 2P reserves, accounting for 70 per cent of Australia’s total remaining 2P gas reserves, and 121,140 PJ (107.71 Tcf) of 2C contingent resources. Aggregating Australia’s 2P reserves and 2C contingent resources provides a total of 196,133 PJ (174 Tcf) of conventional gas identified resources. About 93 per cent of identified conventional gas resources are located offshore along the North West Shelf of Australia. Based on 2019 production rates of 4,641 PJ (4.13 Tcf), Australia’s identified conventional gas resources would have a life of 42 years if all identified contingencies to development are mitigated.
Coal seam gas is expected to remain as Australia’s most important unconventional gas resource in the near term (Figure 1 and Figure 2). CSG is already a major source for domestic gas and LNG exports in eastern Australia. Almost all reported CSG reserves and contingent resources are located in Queensland; the remainder are in New South Wales. In 2019 Australia’s total 2P reserves are estimated as 31,597 PJ (29.79 Tcf), accounting for 30 per cent of the total remaining 2P gas reserves. An additional 26,652 PJ (23.70 Tcf) of 2C contingent CSG resources are estimated in 2019. Aggregating Australia’s 2P reserves and 2C contingent resources provides a total estimate of 58,248 PJ (53.49 Tcf) of CSG identified resources. Based on 2019 production rates of 1,603 PJ (1.43 Tcf), these identified CSG resources would have an estimated life of 36 years if all identified contingencies to development are mitigated.
Other unconventional gas resources in Australia include tight gas, shale gas, basin centred gas and in-situ coal gasification resources. Tight gas and shale gas occur in reservoirs with low or no permeability, which require hydraulic stimulation for gas production. Basin centred gas occurs in abnormally pressured, gas-saturated, low-permeability reservoirs. In-situ coal gasification refers to gas being extracted from coal seams by in-situ heating to produce synthesis (syn) gas.
Unconventional contingent gas reserves for Australia, other than coal seam gas, are reported from an in-situ coal gasification demonstration plant at Leigh Creek in South Australia. The total 2P reported reserves of syngas for the Leigh Creek Energy Project in the Telford Basin are 1,153 PJ (1.03 Tcf) (Table 3).
Currently, there are no published reserves data for shale, tight or basin centred gas. This reflects the very early stage of unconventional gas exploration, a lack of infrastructure, and low oil and gas prices. Santos initially reported 3 PJ (2.8 Bcf) of shale gas reserves from the Moomba gas field in the Cooper Basin in 2012 (Santos, 2012, 2013), but these were subsequently downgraded to contingent resources.
Unconventional 2C contingent gas resources for Australia, other than coal seam gas, totalled 13,672 PJ (12.49 Tcf) during 2019 (Table 3). More than half of these (7,423 PJ; 6.60 Tcf) are represented by shale gas resources in the Beetaloo Sub-basin of the greater McArthur Basin, which are being appraised through drilling campaigns by Origin Energy, Empire Energy and Santos. Significant unconventional 2C contingent gas resources have also been identified in the Cooper Basin (2,080 PJ; 2.18 Tcf), Canning Basin (2,438 PJ; 2.17 Tcf) and Telford Basin (1,469 PJ; 1.31 Tcf) (Table 3).
Table 3. Australia's other unconventional gas reserves (2P) and contingent resources (2C) during 2019
| Basin | Type | Gas | Data Source | |||
|---|---|---|---|---|---|---|
| 2P Reserves (PJ) | 2P Reserves (Tcf) | 2C Resources (PJ) | 2C Resources (Tcf) | |||
| Beetaloo Sub-basin | Shale gas | 7,423 | 6.60 | Origin Energy (2017) | ||
| Canning Basin | Basin centred gas | 1,724 | 1.53 | Buru Energy (2016, 2018) | ||
| Tight gas | 714 | 0.64 | ||||
| Cooper Basin | Basin centred gas | 1,769 | 1.90 | Pure Energy (2020); |
||
| Undifferentiated | 311 | 0.28 | Beach Energy (2020) | |||
| Gippsland Basin | Tight gas | 89 | 0.08 | Lakes Oil (2020) | ||
| Isa Superbasin | Shale gas | 173 | 0.15 | Armour Energy (2014) | ||
| Telford Basin | Coal seam gasification | 1,153 | 1.03 | 1,469 | 1.31 | Leigh Creek Energy (2020) |
| Total | 1,153 | 1.03 | 13,672 | 12.49 | ||
Notes: PJ = petajoules. Tcf = trillion cubic feet.
Australia's prospective gas resources
Resources that are yet to be discovered can still be assessed and classified using the SPE-Petroleum Resources Management System. Undiscovered petroleum accumulations have a chance of geologic discovery and a chance of development. However, estimating the quantity of recoverable resources that may exist on discovery is subject to a range of uncertainty. Prospective resources are defined in the SPE Petroleum Resources Management System as the quantities of petroleum that are estimated to be potentially recoverable from undiscovered accumulations, assuming a discovery is made.
New conventional gas resources continue to be discovered in well-explored basins, often leading to the application of new exploration concepts and the extension of existing target horizons. For example, exploration in the Bedout Sub-basin (Roebuck Basin) has resulted in the discovery of new oil and gas accumulations (Phoenix South, Roc and Dorado), believed to be sourced from a Lower Triassic petroleum system. This new Lower Triassic petroleum system is likely to extend into other exploration areas and significantly increase the prospective resources on the North West Shelf. Improved seismic imaging of Jurassic and Triassic sedimentary sequences in the Vulcan Sub-basin (Bonaparte Basin) is driving renewed exploration and discovery of oil and gas resources, including the recently discovered Orchid gas and condensate field. Significant new gas discoveries have also been made in the Perth Basin (Waitsia and West Erregulla fields), Otway Basin (Annie, Dombey, Haselgrove and Enterprise) and Northern Carnarvon Basin (Ferrand).
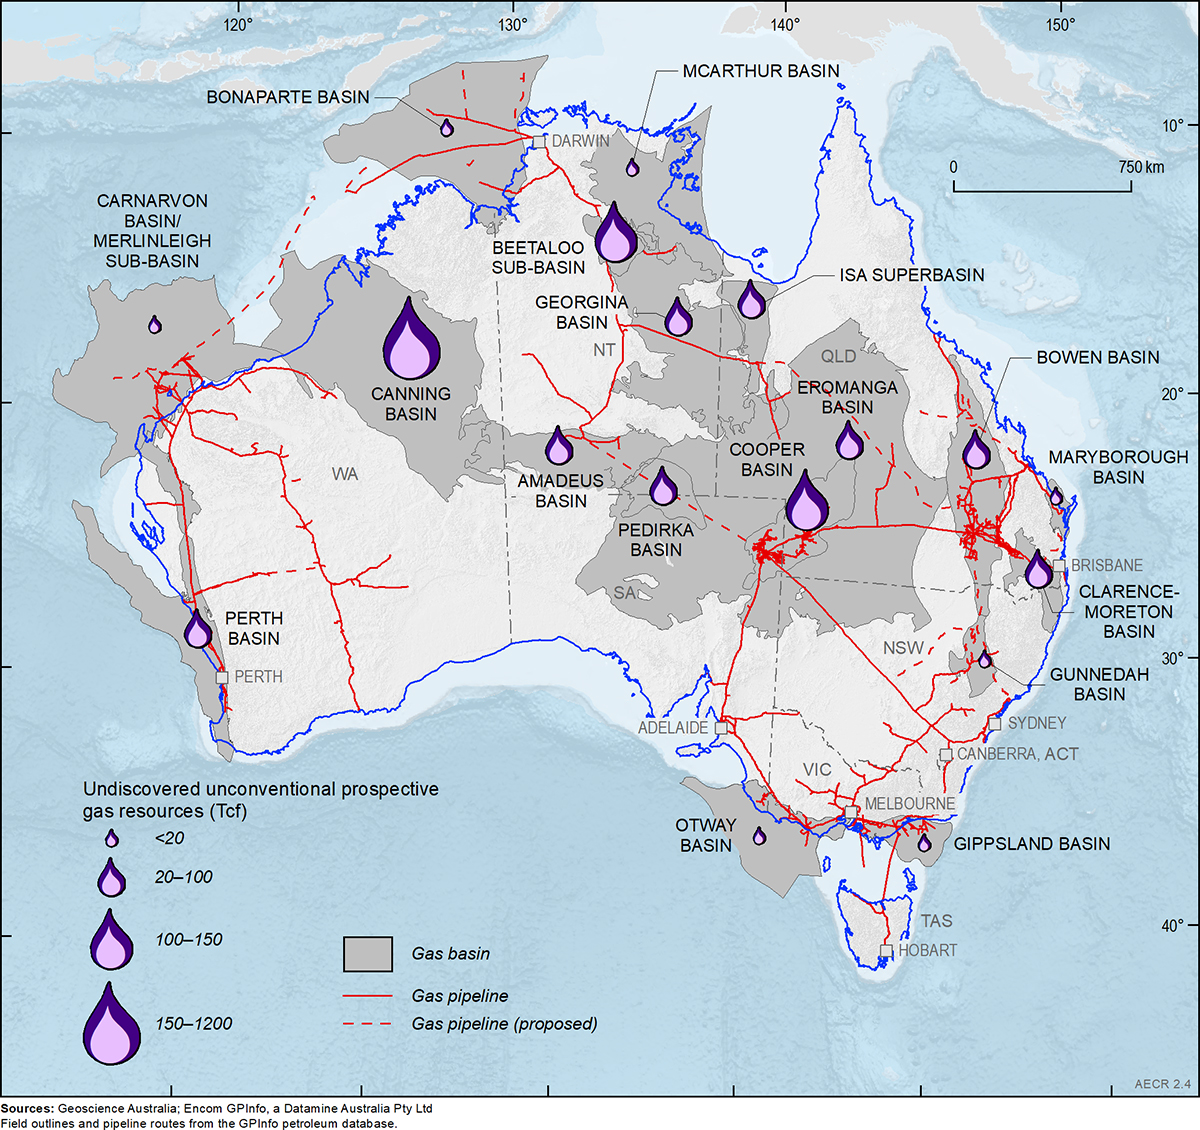
Exploration for Australia’s unconventional gas resources other than CSG is still in the early stages and has not sufficiently progressed to confidently constrain undiscovered prospective resource estimates. Consequently, our understanding of the undiscovered potential tight gas and shale gas resources in Australia is limited. Assessments of unconventional gas accumulations are subject to multiple uncertainties. They include size and recoverability of the resources, particularly in the early phases of exploration. This is due to limited direct measurement and knowledge of the precise geological characteristics and the lack of production data to estimate recoverability.
As there is a high degree of uncertainty in published resource estimates, all publicly available unconventional gas prospective resource assessments are listed in Table 4. The wide estimate range in potentially recoverable resources is related to different methodologies, assessment areas and data inputs in the resource assessment process, and are indicative of the uncertainty associated with these assessments. The USGS unconventional resources assessments of the Cooper Basin, Canning Basin, Perth Basin and Beetaloo Sub-basin consistently provide the most conservative undiscovered resource estimates as the estimates are fully risked and use predicted well production performance, in the absence of actual production data, to estimate recoverability.
A number of basins have the potential to host significant prospective resources (Table 4; Figure 3 and Figure 4). Greater certainty in Australia’s unconventional gas resources will not, however, be possible until production test data are acquired to define how productive the shale gas intervals are in each basin.
Table 4. Undiscovered prospective unconventional gas resource assessments
| Type | Basin | Recovery factor (%) | Best estimate potentially recoverable gas resource | Data Source | |
|---|---|---|---|---|---|
| PJ | Tcf | ||||
| Shale gas | Amadeus | 15b | 17,995 | 16 | AWT International (2013) |
| na | 8,660 | 7.7 | DSWPET (2011) | ||
| Beetaloo Sub-basin | 15b | 21,369 | 19 | AWT International (2013) | |
| na | 49,149 | 43.7 | EIA (2013) | ||
| 16a | 95,600 | 85 | Falcon Oil and Gas (2017) | ||
| 71a | 125,730 | 111.79 | RPS (2013) | ||
| na | 6,535 | 5.81 | USGS (2019) | ||
| Bonaparte | 15b | 6,748 | 6 | AWT International (2013) | |
| Bowen | 15b | 109,096 | 97 | AWT International (2013) | |
| Canning | 15b | 1,085,336 | 965 | AWT International (2013) | |
| na | 264,754 | 235.4 | EIA (2013) | ||
| 5b | 438,599 | 389.97 | Geoscience Australia (AERA 2018) | ||
| 15b | 49,487 | 44 | Triche and Bahar (2013) | ||
| na | 12,174 | 10.82 | USGS (2018) | ||
| Carnarvon | 15b | 10,122 | 9 | AWT International (2013) | |
| (Merlinleigh Sub-basin) | 15b | 15,993 | 14.22 | WA DMP (2015) | |
| Clarence-Moreton | 15b | 23,619 | 21 | AWT International (2013) | |
| Cooper | 15b | 55,110 | 49 | AWT International (2013) | |
| na | 104,485 | 92.9 | EIA (2013) | ||
| 5b | 7,777 | 6.92 | Geoscience Australia (AERA 2018) | ||
| Eromanga | 15b | 92,225 | 82 | AWT International (2013) | |
| Georgina | 15b | 56,235 | 50 | AWT International (2013) | |
| na | 14,396 | 12.8 | EIA (2013) | ||
| Gippsland | 5b | 6,281 | 5.59 | Geoscience Australia (AERA 2018) | |
| Gunnedah | 15b | 14,621 | 13 | AWT International (2013) | |
| Isa Superbasin | na | 24,856 | 22.1 | Armour Energy (2014) | |
| Maryborough | 15b | 7,873 | 7 | AWT International (2013) | |
| 30b | 21,594 | 19.2 | EIA (2013) | ||
| McArthur | 15b | 8,323 | 7.4 | AWT International (2013) | |
| na | 14,587 | 12.97 | MBA (2012) | ||
| Otway | 15b | 10,122 | 9 | AWT International (2013) | |
| 5b | 1,788 | 1.59 | Geoscience Australia (AERA 2018) | ||
| Pedirka | 15b | 48,362 | 43 | AWT International (2013) | |
| Perth | 15b | 25,868 | 23 | AWT International (2013) | |
| na | 36,778 | 32.7 | EIA (2013) | ||
| 5b | 12,349 | 10.98 | Geoscience Australia (AERA 2018) | ||
| na | 1,726 | 1.54 | USGS (2017) | ||
| Basin centred gas | Beetaloo Sub-basin | 71a | 56,471 | 50.21 | RPS (2013) |
| Tight gas | Amadeus | na | 11,697 | 10.4 | DSWPET (2011) |
| Cooper | 5b | 57,303 | 50.95 | Geoscience Australia (AERA 2018) | |
| na | 28,946 | 25.74 | USGS (2016) | ||
| Gippsland | 5b | 15,290 | 13.6 | Geoscience Australia (AERA 2018) | |
| Otway | 5b | 6,478 | 5.76 | Geoscience Australia (AERA 2018) | |
| Canning | 5b | 54,497 | 48.46 | Geoscience Australia (AERA 2018) | |
| na | 13,577 | 12.07 | USGS (2018) | ||
| Perth | na | 12,194 | 10.84 | USGS (2017) | |
| Deep coalbed gas | Cooper | na | 291 | 0.26 | USGS (2016) |
| Coalbed gas | Perth | na | 619 | 0.55 | USGS (2017) |
Notes: aStochastically applied factor. bArithmetically applied factor. USGS estimates are based on an estimated ultimate recovery factor using US analogues. In 2018 the South Australian government passed the 10 year fracking moratorium for the South East of South Australia. Victoria has a permanent ban on hydraulic fracturing and a moratorium on onshore petroleum exploration and production until 30 June 2021. NSW and WA currently have restrictions on hydraulic fracturing. PJ = petajoules. Tcf = trillion cubic feet. na = not available.

Production
Gas production in Australia has continued to increase substantially (Figure 5 and Figure 6). This is primarily driven by a rapid expansion of the Australian LNG industry, with a number of projects on both the west and east coasts. The most significant production of conventional gas occurs in the basins of the North West Shelf and the Gippsland and Cooper basins, while the most significant production of CSG occurs in the Bowen and Surat basins (Figure 1 and Figure 2).
The gas-producing basins of the North West Shelf (Northern Carnarvon, Bonaparte and Browse basins) accounted for 65 per cent of Australia’s annual gas production to the end of 2019, at 4,051 PJ (3.60 Tcf). Gas production in the Bowen and Surat basins accounted for 26 per cent of the 2019 total, at 1,608 PJ (1.43 Tcf).
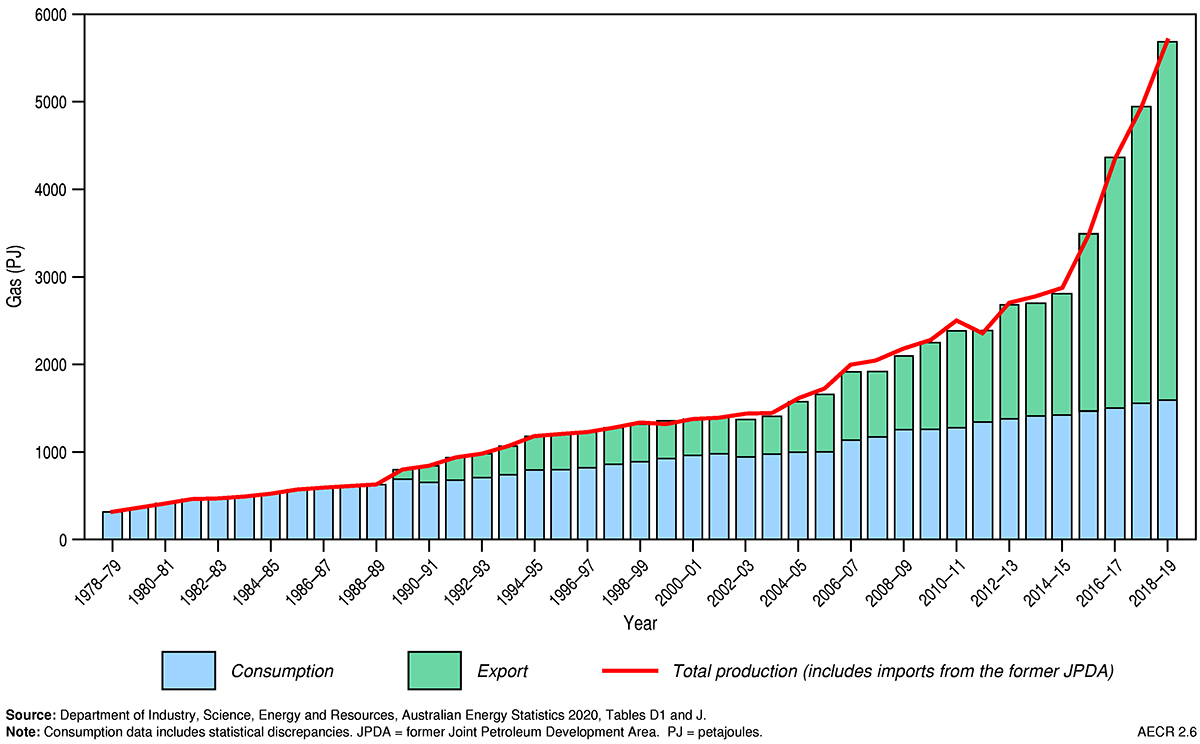
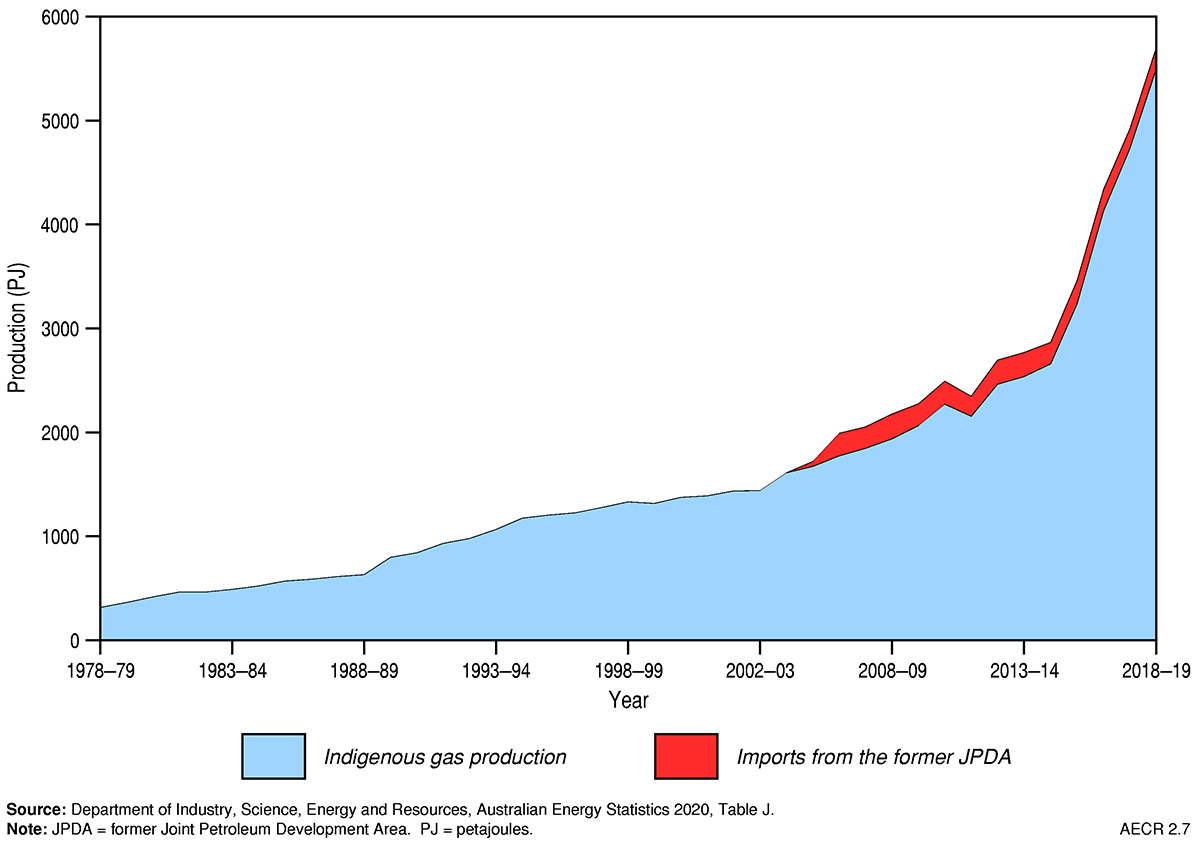
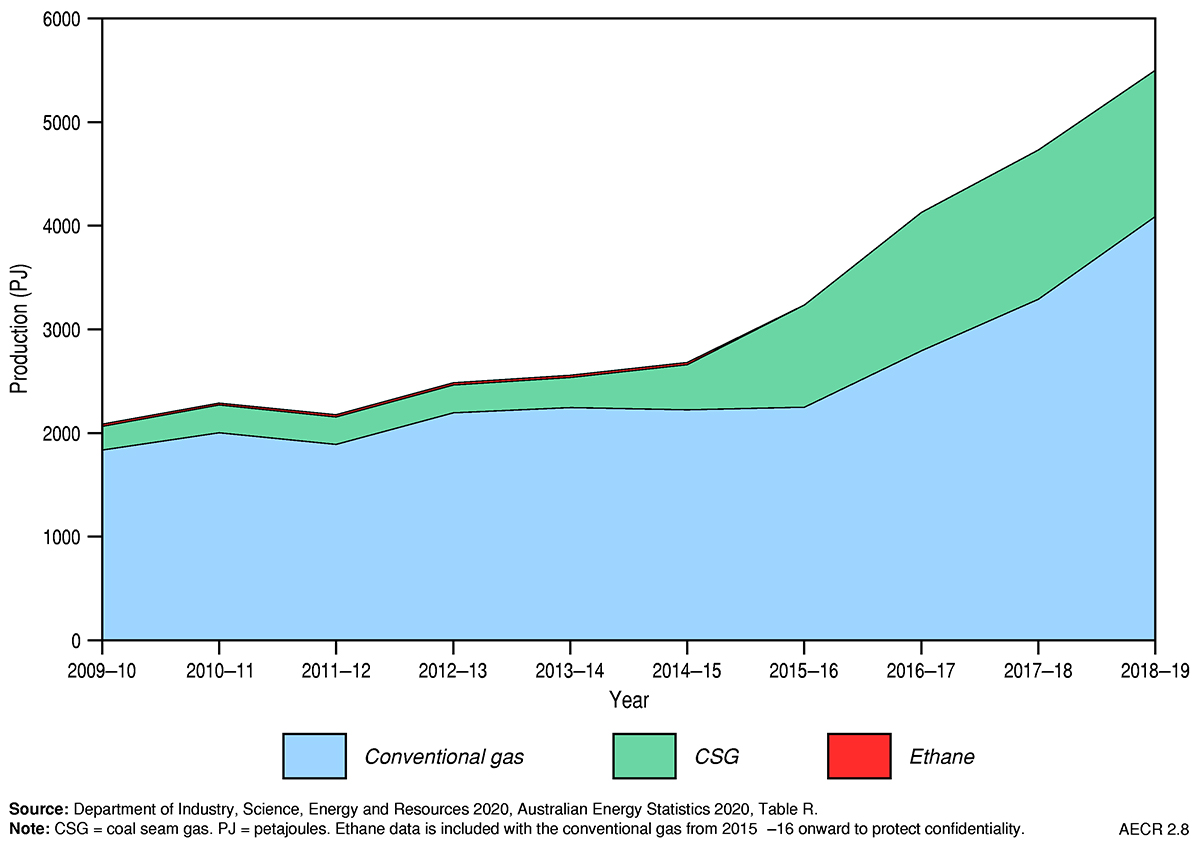
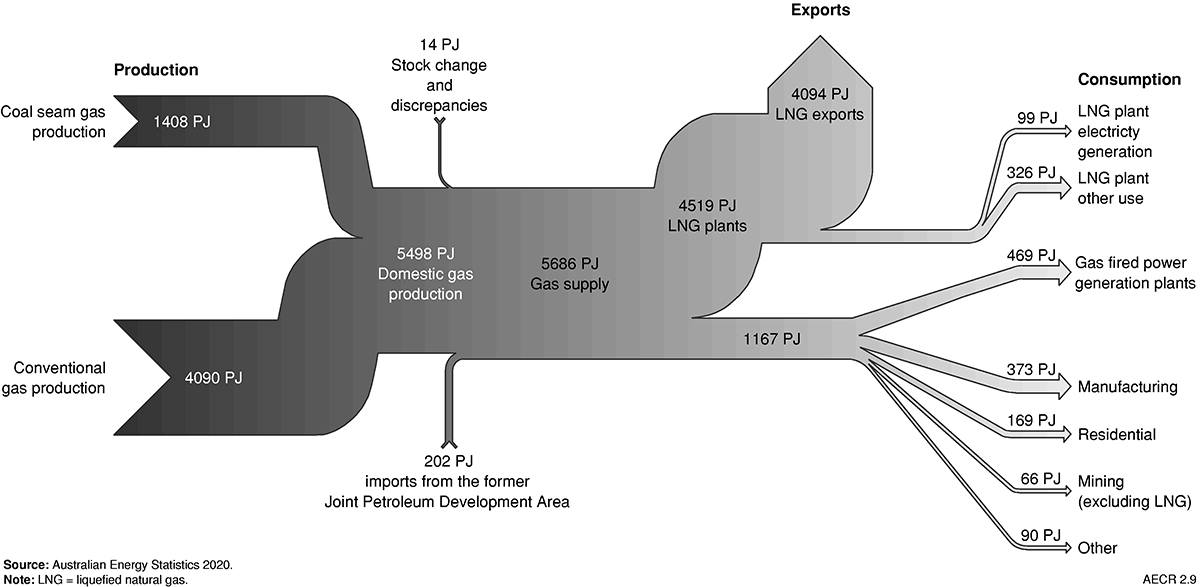
Recent trends in gas production are captured by the Australian Government’s energy production statistics in Australian Energy Statistics (Department of Industry, Science, Energy and Resources, 2020a). Natural gas production grew by 16 per cent to 5,498 PJ in the 2018–2019 financial year (Figure 7), and by an average of 11.5 per cent a year over the last decade (Department of Industry, Science, Energy and Resources, 2020a).
Conventional gas contributed 74 per cent of natural gas production on an energy content basis (Figure 7; Department of Industry, Science, Energy and Resources, 2020a). Significant CSG production growth in recent years is largely attributable to the expansion of LNG production from three major CSG to LNG plants near Gladstone, Queensland (Queensland Curtis LNG, Gladstone LNG and Australia Pacific LNG). Production of CSG accounted for 26 per cent of Australian gas production in 2018–2019 (Figure 7). At 1,408 PJ, this represents over two-thirds of east coast gas production in 2018‑19 (Department of Industry, Science, Energy and Resources, 2020a). Nearly all CSG is produced from the Bowen and Surat basins in Queensland, with a very small amount produced in New South Wales from the Camden Gas Project in the Sydney Basin. CSG production in the Camden Gas Project is scheduled to cease in 2023.
Trade
Australia is a substantial net exporter of natural gas (Department of Industry, Science, Energy and Resources, 2020a). About 74 per cent of natural gas produced in 2018‑19 was exported as LNG (Figure 8).
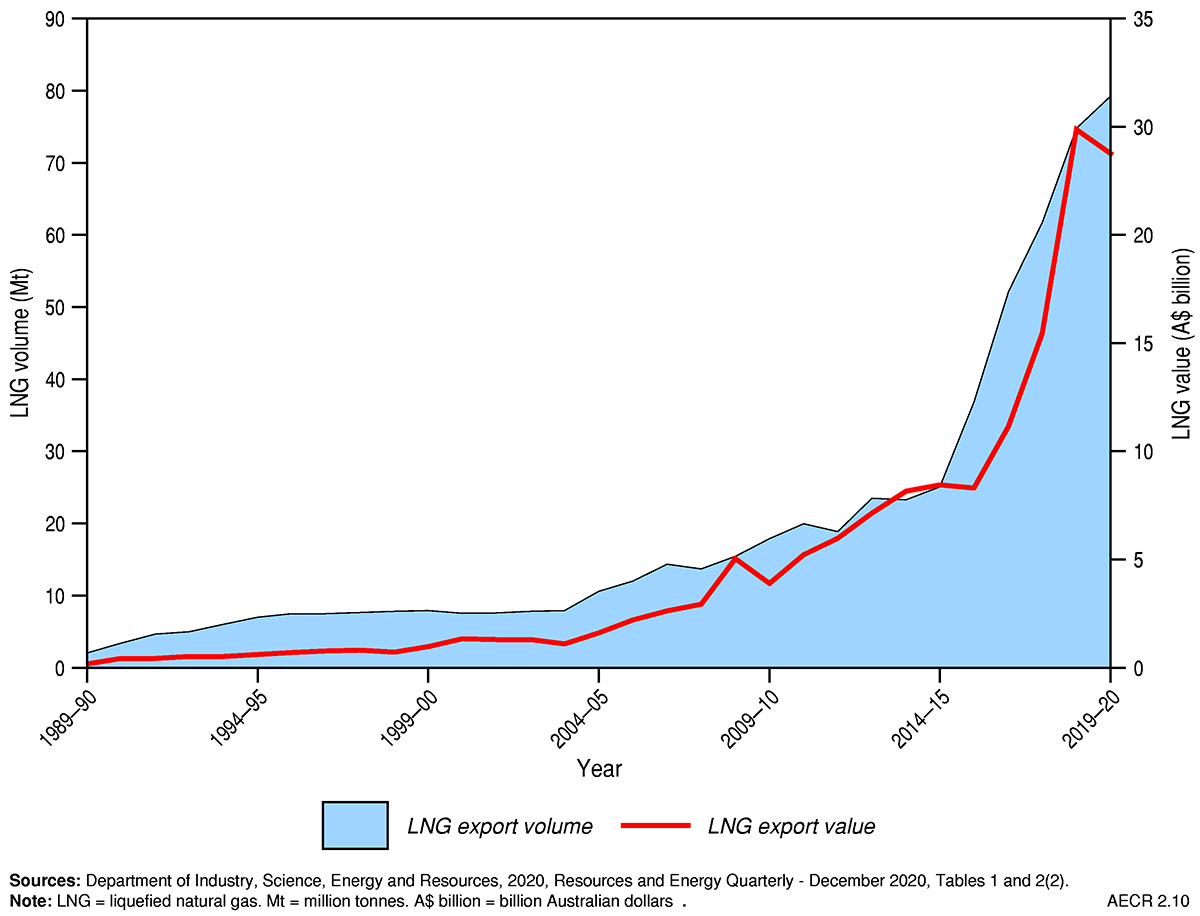
Over the past decade LNG exports from Australia have increased by an average of 17 per cent a year (Figure 9), with several new facilities commencing production in 2019 (Department of Industry, Science, Energy and Resources, 2020a). New export capacity in northwest Australia supported an increase of 21 per cent in LNG exports from 3,376 PJ (62 Mt) in 2017‑18 to 4,094 PJ (75 Mt) in 2018‑19 (Figure 9; Department of Industry, Science, Energy and Resources, 2020a). Australia’s increase in LNG exports was the third highest in the world during 2019, after the United States and Russia (BP, 2020).
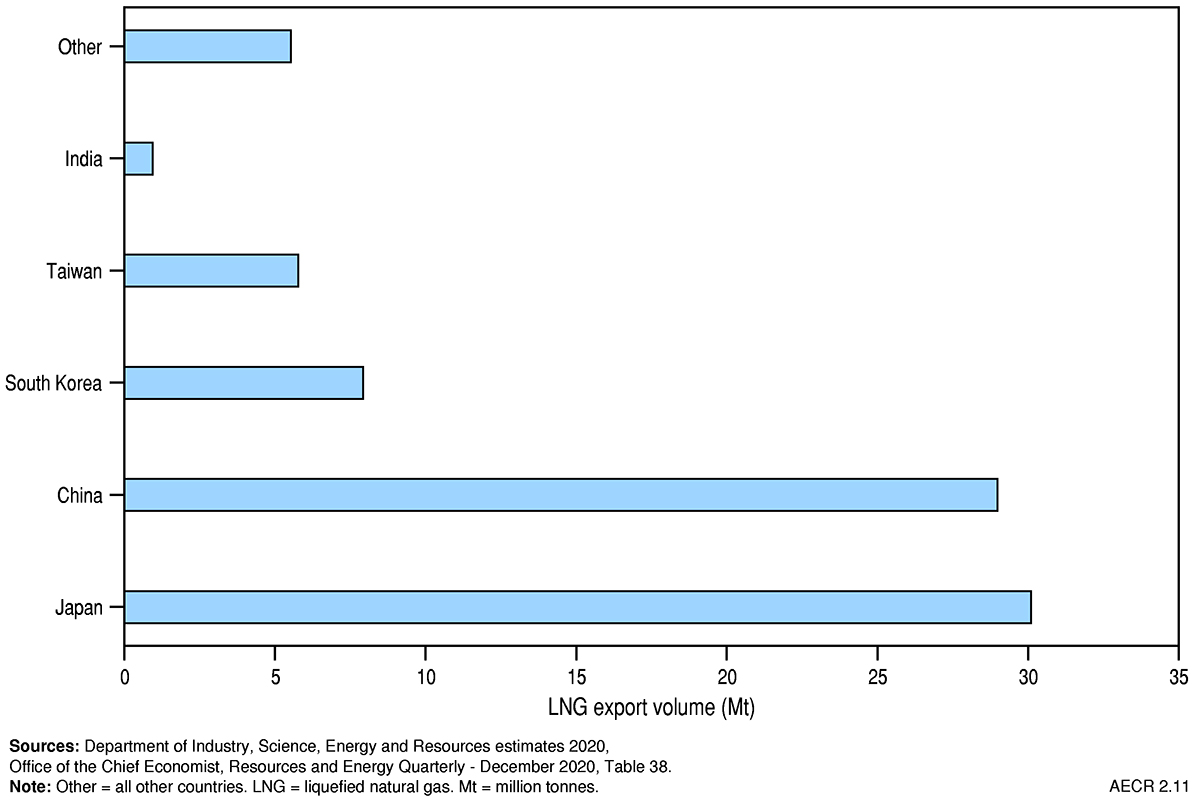
Nearly all of Australian LNG exports were delivered to Asian markets in 2018‑19 (Figure 10). Japan accounted for 38 per cent (equivalent to 30.1 Mt) of Australian LNG exports, followed by China (37 per cent, equivalent to 29.0 Mt) and the Republic of Korea (10 per cent, equivalent to 7.9 Mt).
Natural gas imports are the gas produced in the former Joint Petroleum Development Area, which is liquefied in Darwin for export (Department of Industry, Science, Energy and Resources, 2020a).
World gas resources
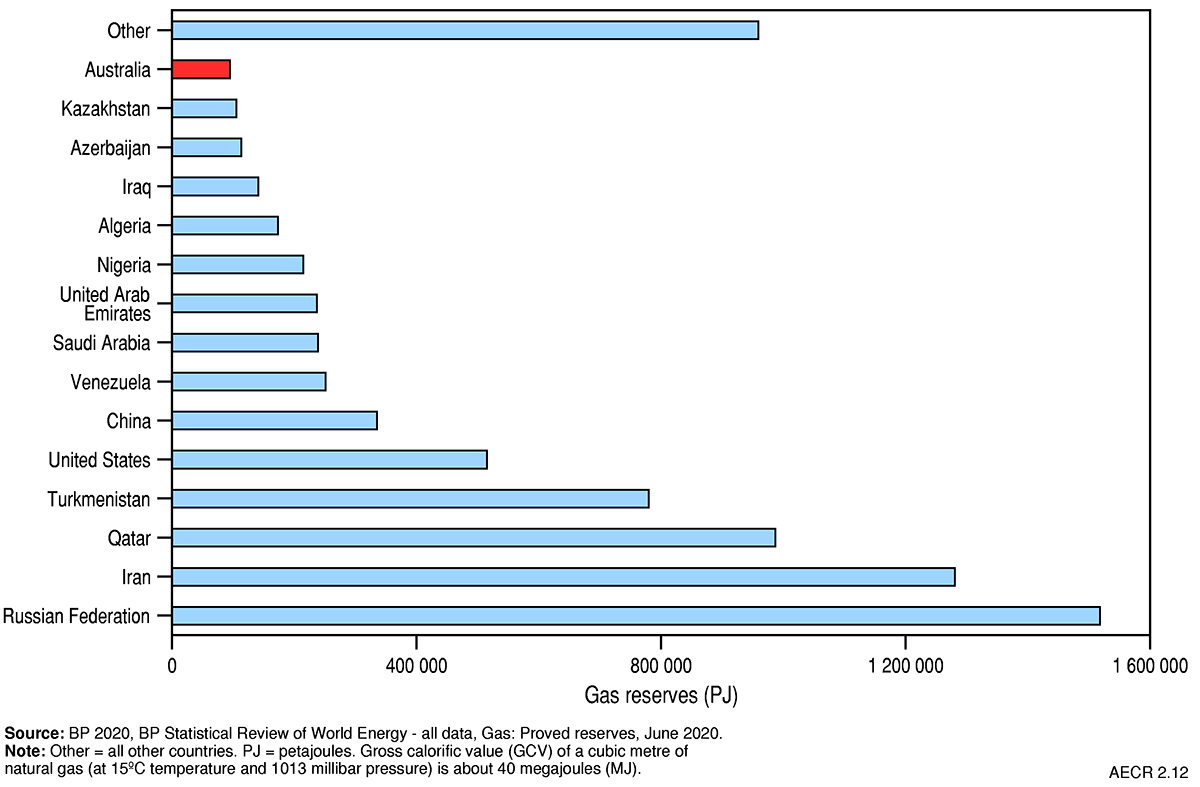
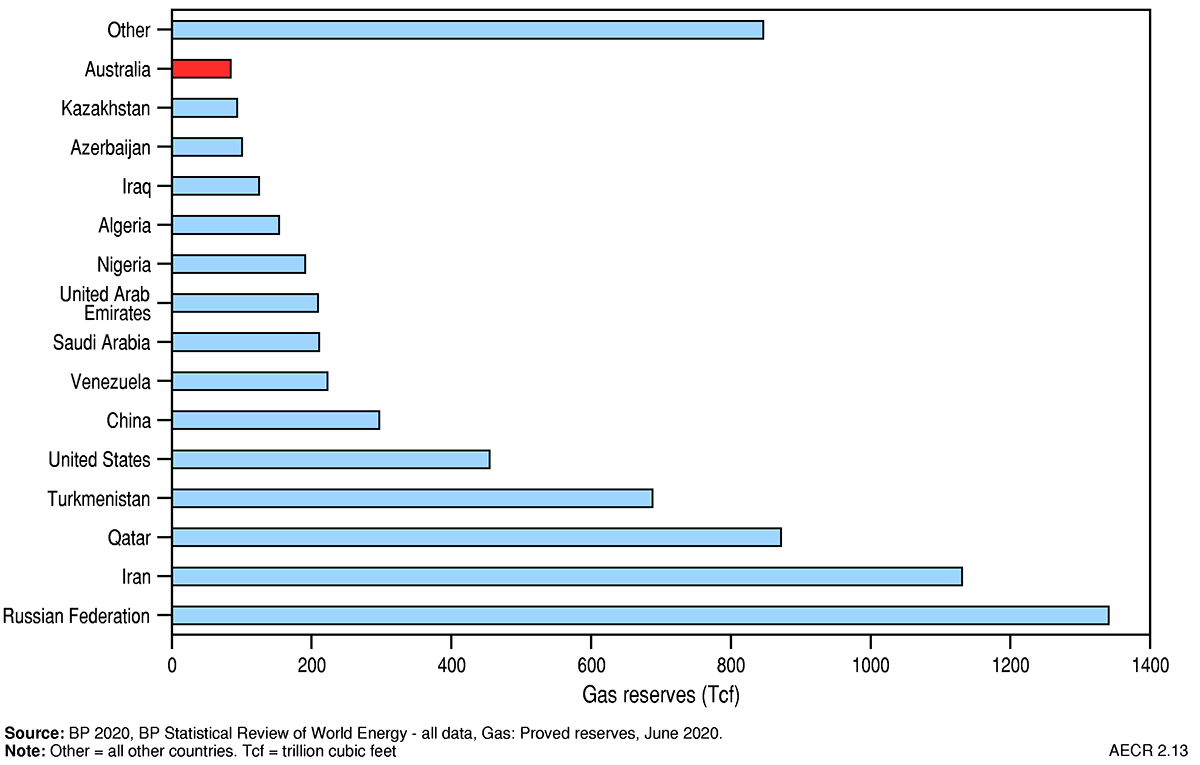
Proved world gas reserves in 2019 are estimated by BP (2020) at 7,019.07 Tcf (equivalent to about 7,152,434 PJ; Table 5). Russia, Iran and Qatar held the largest share of global reserves in 2019 (Figure 11 and Figure 12). Australia’s current global ranking for gas reserves is difficult to determine due to a lack of reported proved reserves since 2014, when Australia was ranked thirteenth holding 1.9 per cent of the world’s gas reserves (Geoscience Australia, 2018).
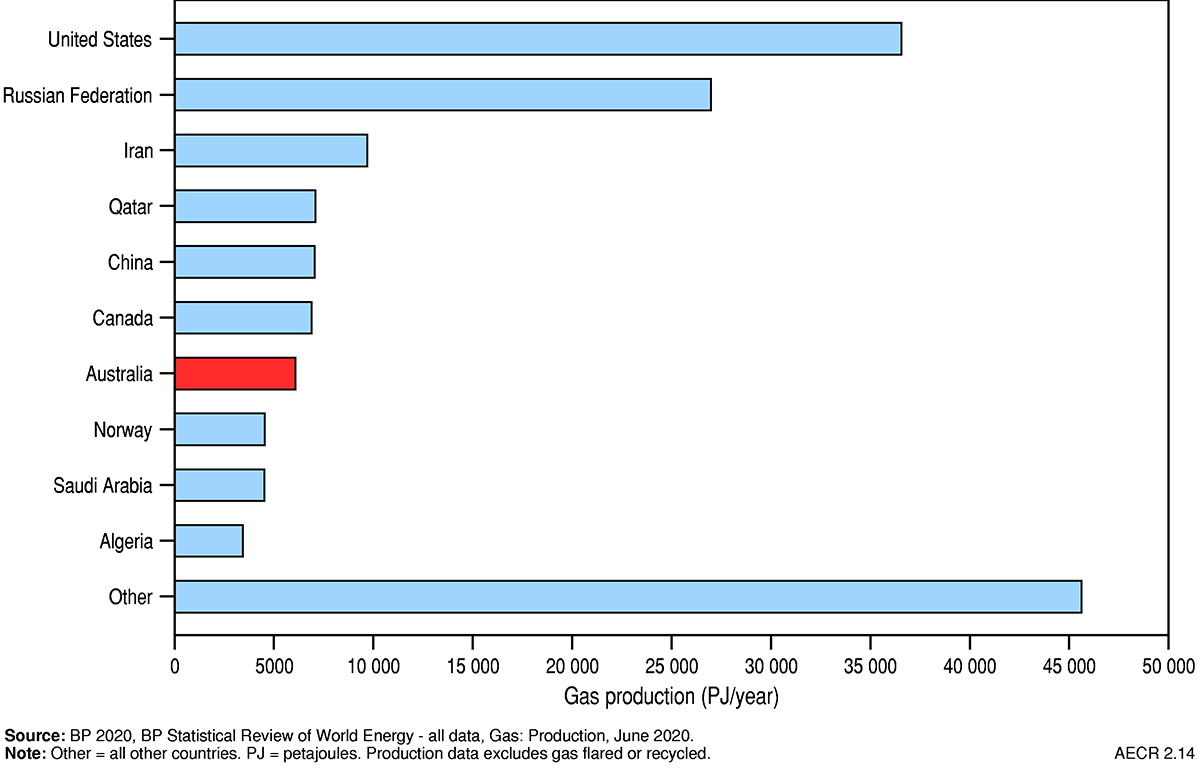
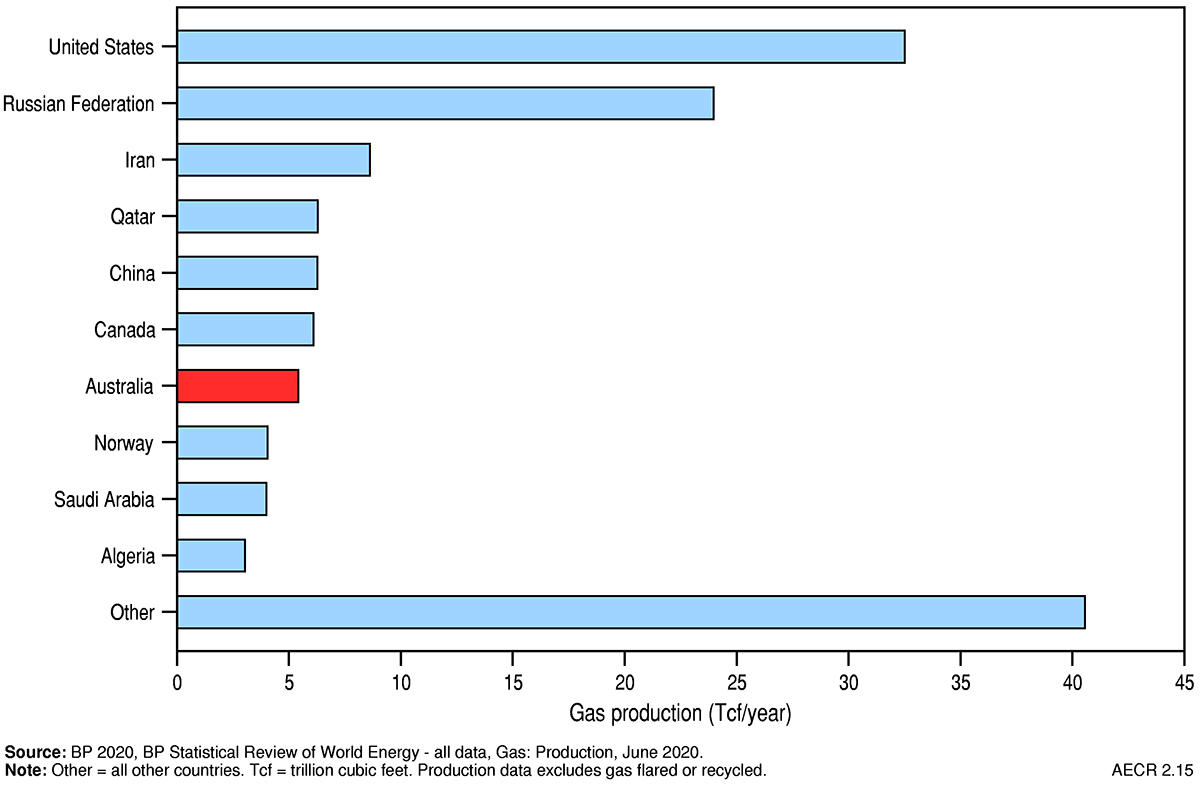
World gas production increased by 3.4 per cent in 2019 to a total of 143,557 PJ (140.88 Tcf; BP, 2020). Approximately 40 per cent of this production came from the US and Russia (Figure 13 and Figure 14). Australia ranks seventh in the world for gas production, accounting for 3.8 per cent of total gas production in 2019 (Table 5).
Global LNG exports increased by almost 13 per cent (54 Bcm) in 2019, the largest annual increase ever recorded (BP, 2020). The growth was driven by record increases from the US and Russia, as well as continued growth from Australia. Europe absorbed the exports growth with an unprecedented increase in LNG imports (BP, 2020).
Australian export volumes reached 79 million tonnes in 2019–20, confirming Australia’s position as one of the two major LNG exporters in the world with Qatar (Department of Industry, Science, Energy and Resources, 2020b).
Table 5. Key gas statistics
| Australia 2019 | OECD 2019 | World 2019 | ||
|---|---|---|---|---|
| Resources | ||||
| Proved Reserves (at end of year) | PJ | na | 723,025b | 7,152,434b |
| Tcf | na | 709.54 | 7,019.07b | |
| Proved plus Probable Reserves (at end of year) | PJ | 106,589a | na | na |
| Tcf | 96.48a | na | na | |
| CAGR from 2009 | % | na | 2.2b | 1.5b |
| Share of world gas reserves | % | na | 10.1b | 100b |
| World ranking | no. | 15b | na | na |
| Production | ||||
| Annual production | PJ | 6,245a | 54,201b | 143,557b |
| Tcf | 5.55a | 53.19b | 140.88b | |
| CAGR from 2009 | % | 12.6b | 3.2b | 3.1b |
| Share of world gas production | % | 3.8b | 37.8b | 100b |
| World ranking | no. | 7b | na | na |
| Exports | ||||
| LNG export volume | PJ | 4,161b | na | 17,456b |
| Tcf | 3.70b | na | 17.13b | |
| CAGR from 2009 | % | 15.3b | na | 6.9b |
| Share of world LNG exports | % | 21.6b | na | 100b |
| World ranking | no. | 1b | na | na |
| LNG export value | A$b | 47.52c | na | na |
Notes: BP gas reserves data are proved reserves while Geoscience Australia data are Proved plus Probable (2P) Reserves. OECD = Organisation for Economic Co-operation and Development countries. na = not available. LNG = liquefied natural gas. CAGR = compound annual growth rate. Tcf = trillion cubic feet. PJ = petajoules. A$b = billion Australian dollars. Source: aGeoscience Australia; bBP (2020) BP Statistical Review of World Energy; cDepartment of Industry, Science, Energy and Resources (2020a and b) Resources and Energy Quarterly, December 2020 (Table 2).
References
Armour Energy 2014. Third party independent certification of 350 PJs (3C) Contingent Resources Lawn Hill Shale, Egilabria 2 DW1, ATP1087, Queensland. ASX media release (last accessed 19 April 2021).
AWT International 2013. Shale Gas Prospectivity Potential (last accessed 19 April 2021).
Beach Energy. 2020. Annual Report 2020 (last accessed 20 April 2021).
BP 2020. bp Statistical Review of World Energy, 69th edition (last accessed 20 April 2021).
Buru Energy 2016. Buru eyes return to Canning Basin tight gas play (last accessed 20 April 2021).
Buru Energy 2018. Increase in contingent resources and identification of prospective resources at Yulleroo (last accessed 20 April 2021).
Department of Industry, Science, Energy and Resources 2020a. Australian Energy Statistics (last accessed 20 April 2021).
Department of Industry, Science, Energy and Resources 2020b. Resources and Energy Quarterly, December 2020 (last accessed 20 April 2021).
DSWPET 2011. Unconventional reservoir resource assessment for the lower Larapinta Group Amadeus Basin. Central Petroleum Ltd, ASX Announcement, 7 February 2011.
EIA (US Energy Information Administration) 2013. Technically Recoverable Shale Oil and Shale Gas Resources: Australia (last accessed 20 April 2021).
Falcon Oil and Gas 2017. Beetaloo Basin Drilling Results Indicate Material Gas Resource. ASX media release (last accessed 20 April 2021).
Geoscience Australia 2018. Australian Energy Resources Assessment (AERA; last accessed 20 April 2021).
Icon Energy 2020. 2020 Annual Report (last accessed 20 April 2021).
Lakes Oil 2020. Corporate Update (last accessed 20 April 2021).
Leigh Creek Energy 2020. Annual Report 2020 (last accessed 20 April 2021).
MBA 2012. Independent expert’s report for Armour Energy Limited, MBA Petroleum Consultants Pty Ltd.
Northern Territory Geological Survey (NTGS) 2014. Petroleum geology and potential of the onshore Northern Territory, 2014. NTGS Report 22 (last accessed 20 April 2021).
Origin Energy 2017. Beetaloo Basin drilling results indicate material gas resource (last accessed 20 April 2021).
Pure Energy 2020. Converting gas resources to reserves and lower emissions (last accessed 20 April 2021).
RPS 2013. Evaluation of the hydrocarbon resource potential pertaining to certain acreage interest in the Beetaloo Basin, onshore Australia and Mako Trough, Onshore Hungary. Prepared for Falcon Oil and Gas Ltd (last accessed 20 April 2021).
Santos 2012. Santos (2012) Cooper Basin Unconventional Gas Opportunities & Commercialisation: November 2012 (last accessed 20 April 2021).
Santos 2013. Moomba 191 and beyond (last accessed 20 April 2021).
Santos 2018. Historical highlights (last accessed 20 April 2021).
Triche, N.E. and Bahar, M. 2013. Shale gas volumetrics of unconventional resource plays in the Canning Basin, Western Australia, in: Unconventional Resources Conference and Exhibition—Asia Pacific, Brisbane, Australia, November 11–13, 2013, Proceedings: Society of Petroleum Engineers, Paper SPE–167078–MS, 31p (last accessed 20 April 2021).
United States Geological Survey (USGS) 2016. Assessment of undiscovered conventional oil and gas resources of the Cooper and Eromanga basins, Australia, 2016. U.S. Geological Survey Fact Sheet 2016-3050, 2 p. (last accessed 20 April 2021).
United States Geological Survey (USGS) 2017. Assessment of continuous oil and gas resources in the Perth Basin Province, Australia, 2017. U.S. Geological Survey Fact Sheet 2017-3039, 2 p. (last accessed 20 April 2021).
United States Geological Survey (USGS) 2018. Assessment of Undiscovered Oil and Gas Resources in the Canning Basin Province, Australia, 2017. U.S. Geological Survey Fact Sheet 2018-3023, 4 p. (last accessed 20 April 2021).
United States Geological Survey (USGS) 2019. Assessment of Continuous Oil and Gas Resources in the Beetaloo Basin, Australia, 2018. U.S. Geological Survey Fact Sheet 2019-3013, 2 p. (last accessed 20 April 2021).
WA DMP (Department of Mines and Petroleum, Western Australia) 2015. Source Potential and Maturity of the Merlinleigh Sub-basin. Poster (Last accessed 20 April 2021).
Data download
Australia’s Energy Commodity Resources: 2018 and 2019 Data Tables.