

Introduction
Australia is endowed with abundant and diverse geological resources, including several globally significant energy commodity resources. Our nation’s non‑renewable energy resource base continues to expand through discoveries made in producing provinces, through application of new exploration concepts, and from greenfield exploration in Australia’s many frontier regions.
Each year, Geoscience Australia assesses Australia’s mineral commodity reserves and resources in Australia’s Identified Mineral Resources (AIMR). The assessments reveal trends in production, reserves and resources estimates, providing useful long‑term indicators of potential resource life. AIMR 2020, the most recent edition, presents estimates of Australia's minerals reserves and resources as at the end of 2019.
This inaugural Australia’s Energy Commodity Resources (AECR) 2021 assessment presents, in parallel to AIMR, the estimates of Australia’s energy commodity reserves and resources as at the end of 2019. It also provides a pre-COVID-19 baseline for the production and remaining recoverable resources of gas, oil, coal, uranium and thorium in Australia.
The resource estimates in AECR are primarily based on published open file data and aggregated (de-identified) confidential data. AECR 2021 also includes previously unpublished energy commodity resource estimates data compiled by Geoscience Australia for the 2018 reporting period (Appendix 5).
Australia's non renewable energy resources
Australia’s non‑renewable energy resources include fossil fuels (gas, oil and coal) and nuclear energy fuels (uranium and potentially thorium). A summary of Geoscience Australia’s estimated non-renewable energy resources during 2018 and 2019 are provided in Table 1, together with a comparison to the last published non‑renewable energy resources estimates by Geoscience Australia for 2014 (gas and oil) and 2016 (coal, uranium and thorium).
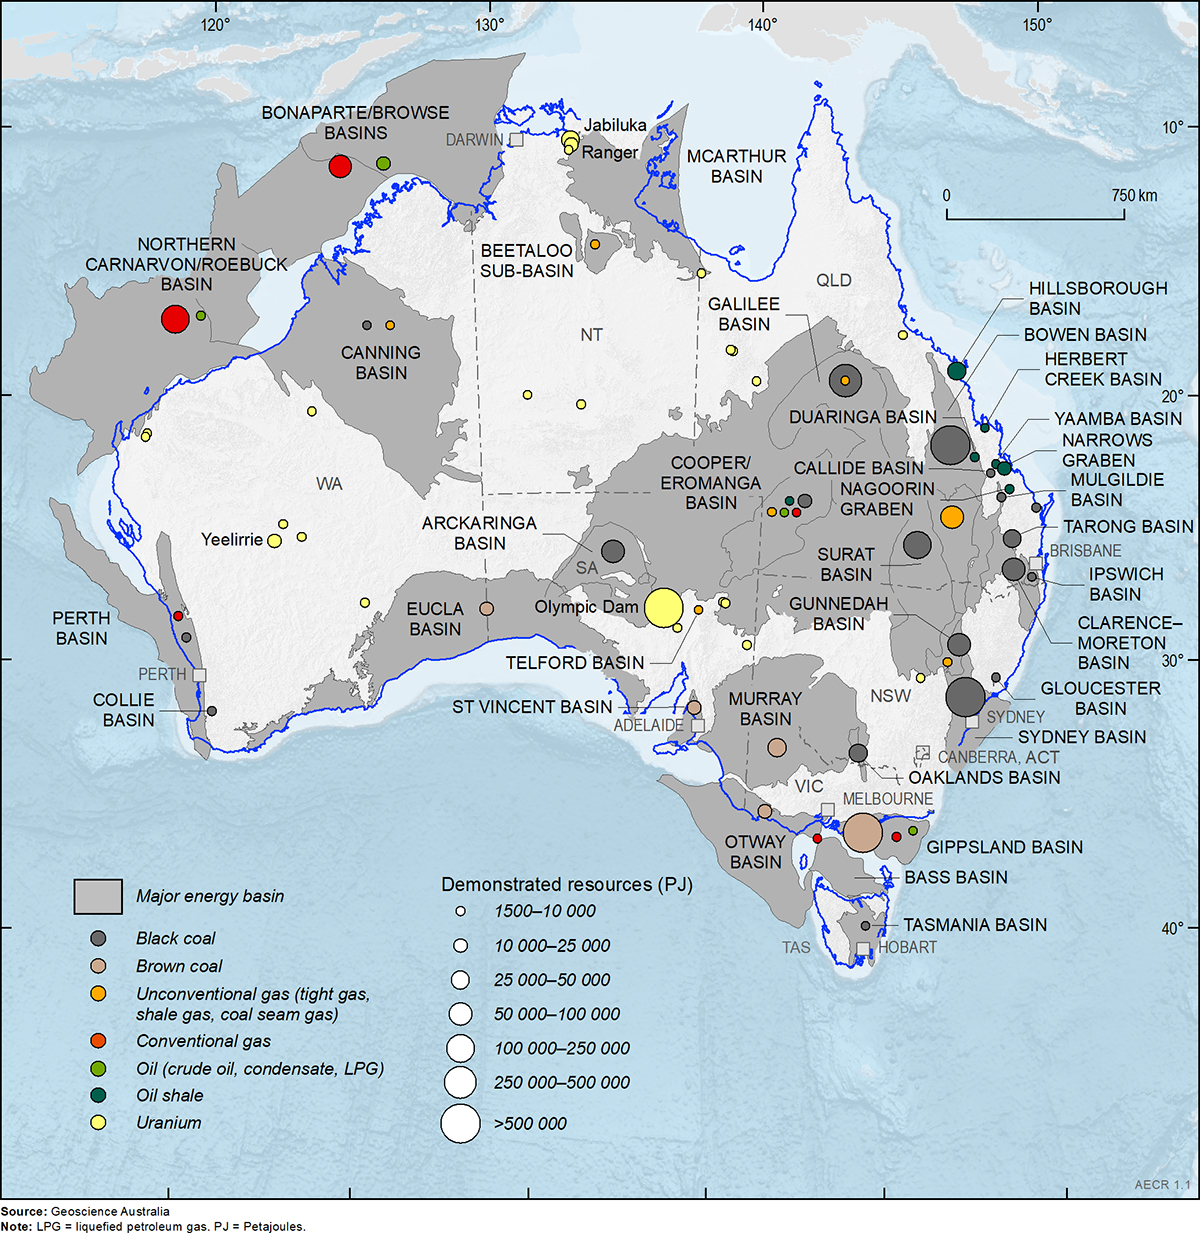
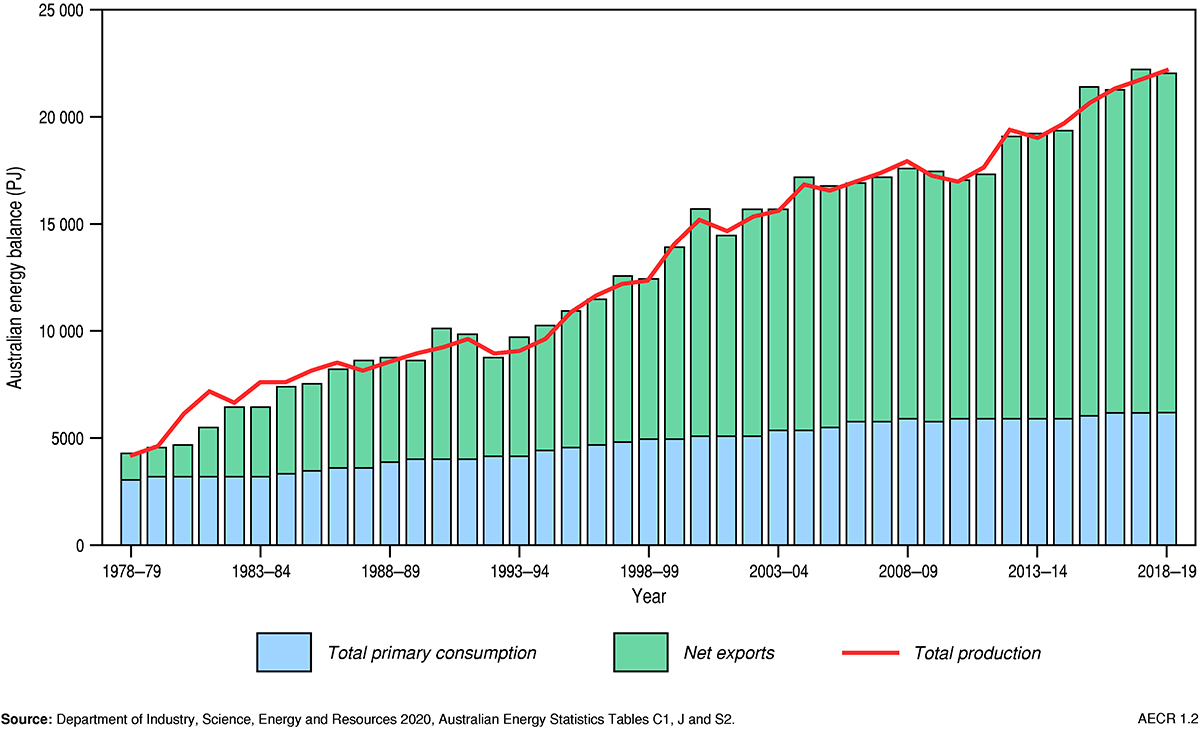
Australia has particularly vast, widely distributed resources of coal, gas and uranium as shown in Figure 1. Production of these non‑renewable resources continues to be high allowing Australia to be a net energy exporter.
Table 1. Australia's total demonstrated non renewable energy resources (2014/16, 2018, 2019) and estimated resources life in 2019
| Resource | Unit | Note | TDR 2014/2016 | TDR 2018 | TDR 2019 | %Change 2018–19 | Production 2019 | Resource Life 2019 |
|---|---|---|---|---|---|---|---|---|
| Crude oil | PJ | 1, 2 | 7,066 | 6,474 | 5,661 | -12.6 | 261 | 22 |
| Condensate | PJ | 1, 2 | 16,463 | 16,213 | 15,951 | -1.6 | 450 | 35 |
| LPG | PJ | 1, 2 | 5,957 | 1,483 | 1,421 | -4.2 | 44 | 32 |
| Oil shale | PJ | 1, 2 | 0 | 84,436 | 84,436 | 0 | 0 | na |
| Unconventional oil (undifferentiated) | PJ | 1, 2 | 0 | 335 | 335 | 0 | 0 | na |
| Conventional gas | PJ | 1, 2 | 186,235 | 194,239 | 196,133 | 1.0 | 4,641 | 42 |
| Coal seam gas | PJ | 1, 2 | 79,450 | 63,732 | 58,248 | -8.6 | 1,603 | 36 |
| Coal seam gasification | PJ | 1 | na | 1,469 | 2,622 | 78.5 | 0 | na |
| Unconventional gas (undifferentiated) | PJ | 1, 2 | 14,000 | 13,426 | 12,203 | -9.1 | 0 | na |
| Black coal | PJ | 3, 4, 5 | 1,999,669 | 2,066,612 | 2,085,362 | 0.9 | 12,594 | 166 |
| Brown coal | PJ | 3, 4, 5 | 3,250,352 | 3,293,660 | 3,240,107 | -1.6 | 444 | 7291 |
| Uranium | PJ | 4, 5, 6 | 718,083 | 801,287 | 673,791 | -15.9 | 3,703 | 182 |
| Thorium | ktd | 4, 7 | 130 | 130 | 560 | 330.8 | na | na |
| Total resources | PJ | 8 | 6,277,405 | 6,543,496 | 6,376,830 |
Notes: 2P reserves plus 2C contingent resources from the PRMS classification system. 2. Oil and gas data for the end 2014 are as reported by Geoscience Australia (2018). 3. Demonstrated recoverable coal resources. 4. Coal, uranium and thorium data for the end of 2016 are as reported by Geoscience Australia (2018). 5. Coal and uranium production data for 2019 are based on 2018-19 data published in the 2020 Australian Energy Statistics Report. 6. Recoverable resources at >US$130/kg. 7. A conversion into energy content equivalent for thorium was not available at the time of publication. 8. Excludes thorium resources. kt = thousand tonne. LPG = liquefied petroleum gas. PJ = petajoule. TDR = total demonstrated resources. Source: Geoscience Australia (2018); Australian Energy Statistics 2020, published by the Department of Industry, Science, Energy and Resources (2020a).
Total demonstrated energy resources
Estimating energy resources requires a consistent approach to describing commodity reserves and resources to ensure reliable and easily comparable results. The resource classification appendix (Appendix 2) outlines the various resource classification systems used in AECR to describe the commerciality of energy resources. These systems use levels of geological knowledge and confidence to distinguish between identified and potential resources.
Identified resources are those for which measurements have been made to quantify their extent and grade or quality. A measurement may be, for example, a well drilled into an oil reservoir to provide a sample. The process of ‘proving’ that a resource is suitable for development is one of reducing uncertainty through the measurement of the nature of the resource, and its commercial and social viability.
‘Reserves’ or ‘economic demonstrated resources’ are the terms given to non‑renewable energy resources that are known to exist in sufficient quantity and grade that commercial and social viability is confirmed. ‘Contingent resources’ or ‘sub‑economic resources’ are the terms often given to resources that have been confirmed to exist but are not currently viable and/or economic to extract. Total demonstrated resources (TDR) is the sum of these two resource classes.
Potential resources are those identified by indirect evidence with a high degree of uncertainty around their existence and viability. ‘Prospective’, ’undiscovered’ or ‘inferred’ are the terms often used to describe the potential resource base.
The resource base cannot be considered in isolation from energy conversion technologies. For example, in the last decade, energy security in the US has been increased as a result of hydraulic fracturing technologies. These technologies are enabling previously non‑viable shale oil and shale gas resources to be commercially exploited.
Estimating the resource base requires setting a cut‑off grade—for example, a minimum concentration and volume of gas in a reservoir. An energy conversion technology is implicit in this—hence, the minimum viable resource is determined not only by the inherent nature of the resource, but also by the technology available to produce it.
Mineral and petroleum energy resource estimates are often documented as industry standard measurements of volume or mass. Coal and uranium are generally measured by weight (tonnes), while oil and gas are generally measured by volume (barrels/cubic feet). However, the energy content of different energy commodities varies significantly. In this assessment, energy resource estimates have been converted to a common energy unit—petajoules (PJ) —to allow direct comparisons of different energy commodities. The Measurement and Conversion appendix (Appendix 3) provides average energy contents and conversion factors for the various energy commodities.
Estimating energy resource life
Australia has high‑quality energy resources that are widely distributed across the country. These resources are expected to last for many more decades, even as production increases.
The potential life of Australia’s non‑renewable energy resources is derived through dividing the estimated total remaining identified resources by 2019 annual production rates (Table 1). Such estimates provide a snapshot in time that can only be used for general impressions as they are averages based on the assumption that:
- production rates in the future will remain the same as the 2019 production rates used in the calculation;
- accumulations and deposits deemed as identified resources in 2019 will remain so in the future; and
- depleted resources won’t be replaced by new discoveries.
Gas resources
Australia has substantial conventional gas resources that are located mostly off the north‑west coast of Western Australia, and significant onshore unconventional (coal seam gas, shale gas, and tight gas) resources. Australia’s total demonstrated resources for all conventional and unconventional gas in 2019 are estimated at 269,206 PJ (241 Tcf trillion cubic feet [Tcf]). This amount, based on 2019 rates of production and assuming all uncertainties associated to the development of the resources are addressed, is sufficient to supply the demand for gas, domestic and overseas, for over 40 years.
As at December 2019 conventional gas TDR are estimated to be 196,133 PJ (174 Tcf). Between 2018 and 2019, Australia’s total demonstrated conventional gas resources grew slightly (1 per cent). This conventional gas resource growth occurred despite record conventional gas production to support increased demand for liquefied natural gas (LNG) exports from offshore north‑western Australia fields. The estimated life for Australia’s conventional gas resources is 42 years based on 2019 production rates.
Coal seam gas (CSG) resources are located primarily in east coast basins (Bowen, Surat, Galilee, Gunnedah, Sydney and Clarence‑Moreton basins). As at December 2019 Australia’s CSG TDR are estimated at 58,248 PJ (53 Tcf). Between 2018 and 2019, total identified CSG resources declined by about 9 per cent, with gas production supplying LNG exports from Gladstone exceeding the discovery on new resources. Despite a long‑term trend of declining CSG resources, Australia still had sufficient identified resources in 2019 to last 36 years based on 2019 production rates.
Australia’s gas resource base includes one in‑situ coal seam gasification project, the Leigh Creek Energy Project in the Telford Basin. In‑situ coal gasification refers to gas being extracted from coal seams by in‑situ heating to produce synthesis (syn) gas. The Leigh Creek Energy Project has an estimated TDR of 2,622 PJ (2 Tcf). In 2019, total demonstrated resources for in situ coal seam gasification increased by 78 per cent following the identification of the first 2P reserves in the Leigh Creek Energy Project of 1,153 PJ (1 Tcf).
Prospective shale gas, tight gas, basin centred gas and deep coal seam gas resources are held in low‑permeability reservoirs across Australia. In 2019, unconventional gas TDR (excluding CSG and in‑situ coal seam gasification) totalled 12,203 PJ (11 Tcf). There were no identified unconventional gas reserves in 2019. Most of these unconventional gas resources are located in the Cooper Basin, Canning Basin and Beetaloo Sub‑basin. Between 2018 and 2019 Australia’s TDR for unconventional gas declined by about 9 per cent, despite a lack of production. This is due to reductions in the reported unconventional gas resources in the Gippsland and Cooper basins. There is no resource life estimate for unconventional gas resources due to the lack of production and only a limited understanding of reserves for these resources.
Oil resources
Australia’s conventional liquid hydrocarbon resources include crude oil, and the condensate and liquefied petroleum gas (LPG) resources associated with gas accumulations (as phases of natural gas liquids).
As at December 2019 Australia’s crude oil TDR is estimated to be 5,661 petajoules (PJ) or 963 million barrels (MMbbl). Australia’s crude oil resources are small by world standards and are being depleted at a faster rate than they are being replenished by new discoveries. Total identified crude oil resources declined by about 13 per cent from 2018 to 2019. The estimated life for Australia’s crude oil resources is 22 years based on 2019 production rates. Australia is increasingly reliant on crude oil and refined petroleum imports to meet its energy requirements. However, the crude oil potential of Australia’s frontier basins is yet to be adequately assessed, and further exploration may yield additional resources.
Australia’s liquefied petroleum gas (LPG) resources are also relatively small. In 2019, Australia had an estimated TDR of 1,421 PJ (338 MMbbl). LPG resources showed a decline of about 4 per cent between 2018 and 2019. The remaining life for Australia’s LPG resources is about 32 years based on 2019 production rates.
Australia has significantly more condensate than crude oil and LPG resources, with an estimated TDR of 15,951 PJ (2,713 MMbbl) in 2019. The majority of condensate resources are associated with LNG projects in the Northern Carnarvon and Browse basins on the North West Shelf. Australia’s condensate TDR showed only a small decline of about 2 per cent between 2018 and 2019. Condensate resources have an estimated life of about 35 years based on 2019 production rates.
Unconventional oil resources are currently undeveloped but include significant oil shale occurrences (TDR of 84,436 PJ; 14,360 MMbbl) and minor condensate associated with unconventional gas resources (TDR of 335 PJ; 57 MMbbl). Oil shale resources are exclusively located in Queensland, and require mining and industrial processing to extract oil. Although minor amounts of oil shale resources were produced in the past, there are currently no identified reserves or operating projects.
Coal resources
Australia’s coal resources are world class in volume and quality. In December 2019 Australia’s TDR of recoverable black and brown coal are estimated to be 5,325,469 PJ (410,846 million tonnes [Mt]). In addition to these large TDR of coal, Australia also has significant inferred coal resources.
Black coal TDR are estimated to be 2,085,362 PJ (81,218 Mt). Black coal resources are found in most states, with the largest TDR in the Bowen–Surat Basin in Queensland and the Sydney Basin in New South Wales. In 2019, Australia’s black coal TDR increased by 1 per cent. Black coal resources have an estimated resource life of 166 years, based on 2018–19 production rates.
Australia has vast brown coal resources, although these have a much lower energy content than black coal. Brown coal TDR are estimated to be 3,240,107 PJ (329,628 Mt), and are located mainly in Victoria’s Gippsland Basin. Australia’s brown coal TDR showed only a minor decline of 2 per cent between 2018 and 2019. However, a more significant fall of 4 per cent did occur in the economic demonstrated resources for brown coal (Senior et al., 2021). Australia’s brown coal TDR will support over 7,000 years of production based on the very low rates that are currently extracted.
Uranium and thorium resources
More than one‑third of the world’s known uranium resources are in Australia. In December 2019 Australia’s TDR of uranium are estimated to be 673,791 PJ (1,203 thousand tonnes [kt]). Although most Australian states have uranium deposits, EDR are concentrated in South Australia, the Northern Territory and Western Australia. Australia’s TDR for uranium resources showed a significant decline of 16 per cent in 2019. Uranium resources have an estimated life of 182 years based on 2019 production rates.
Australia also has a major share of the world’s thorium resources. Although not currently in use as an energy resource, thorium could play a role as a nuclear fuel in the future.
Australia's energy production and trade
Australia’s energy resources contribute substantially to the nation’s gross domestic product and export earnings. Energy productivity (gross domestic product ‘GDP’ divided by energy consumption) improved by 1.3 per cent in 2018–19, and by 19 per cent over the past ten years (Department of Industry, Science, Energy and Resources, 2020a). Australia now creates $304 million in GDP for every petajoule of energy consumed, almost $50 million more than a decade ago (Department of Industry, Science, Energy and Resources, 2020a). Approximately 85 per cent of Australian energy production was exported in 2018–19. Exports of LNG have been one of the main contributors to recent growth in our energy exports. Australia is a net exporter of energy commodities but, notwithstanding this, it remains a net importer of oil products.
The outlook for Australian energy production from coal, oil, gas and uranium is tied to global trends in demand, supply and pricing. This section provides an overview of Australia’s energy production and trade, drawn from the time‑series data to 2018–19 as published in the Australian Energy Update (Department of Industry, Science, Energy and Resources, 2020a), together with Resources and Energy Quarterly data published by the Office of the Chief Economist.
Primary energy production in Australia
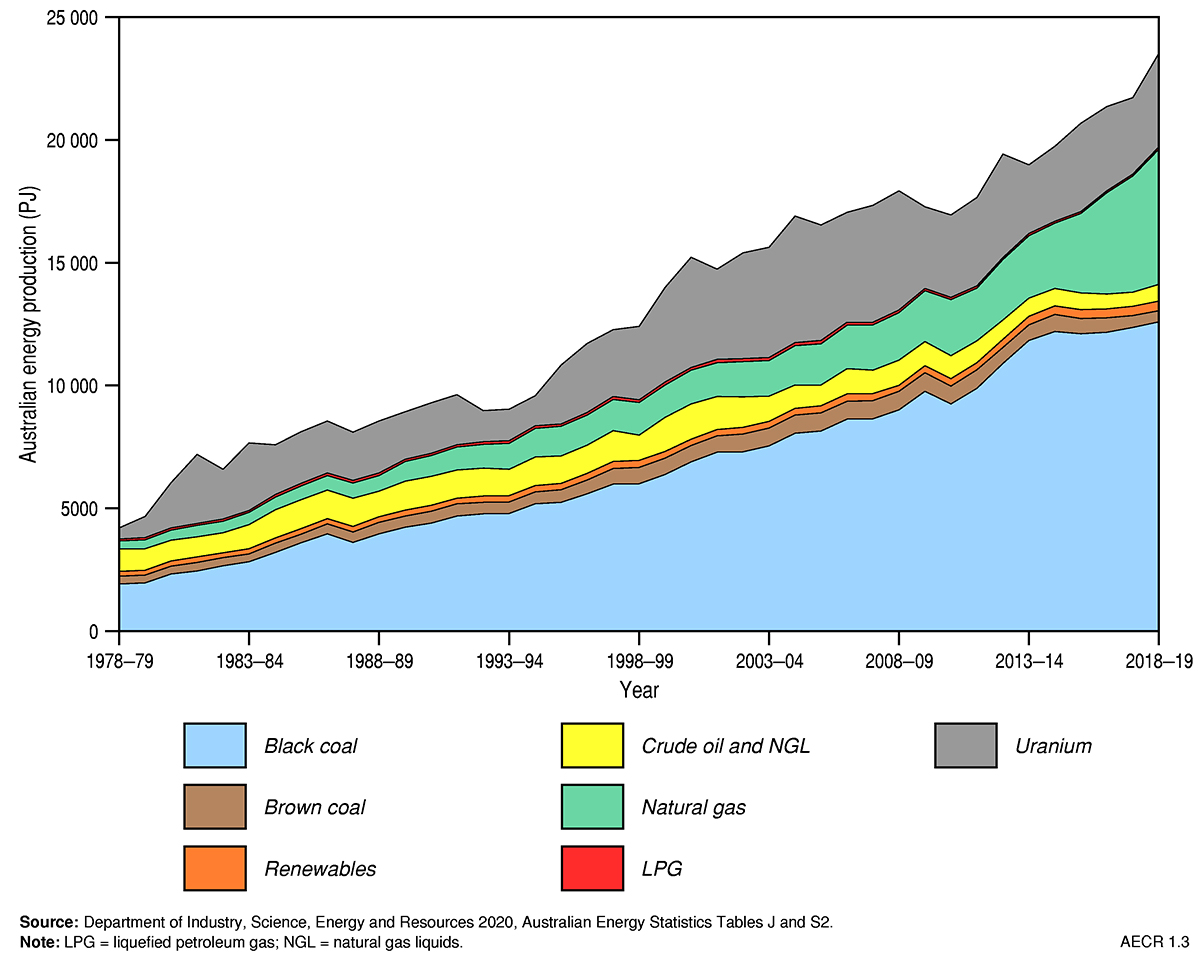
Energy production increased by 7 per cent in 2018–19 to an all‑time high of 23,291 PJ, and by 3 per cent over the past ten years. This is largely due to increased natural gas production (Figure 2; Table 2).
Table 2. Australian primary energy production by fuel type (2018–19)
| Energy source | Production (PJ) | Share (%) | Average annual growth 2018-19 (%) |
Average annual growth 2008-09 to 2018-19 (%) |
|---|---|---|---|---|
| Non-renewables | 22,892 | 98.3 | 7.2 | 2.6 |
| Black coal | 12,594 | 54.1 | 1.8 | 3.4 |
| Brown coal | 444 | 1.9 | -6.1 | -5.1 |
| Natural gas | 5,498 | 23.6 | 16.2 | 11.0 |
| Oil, NGL | 677 | 2.9 | 18.3 | -4.1 |
| LPG | 98 | 0.4 | 32.1 | -0.8 |
| Uranium | 3,580 | 15.4 | 14.5 | -3.0 |
| Renewables | 400 | 1.7 | 4.6 | 5.2 |
| Total | 23,291 | 100.0 | 7.2 | 2.7 |
Notes: The share of production by fuel types differs from that published in the Australian Energy Statistics due to inclusion of uranium in this table. Source: Department of Industry, Science, Energy and Resources (2020) Australian Energy Statistics Tables J, I1 and S2.
Black coal is the principal source of energy production in Australia, accounting for 54 per cent of total energy production at 12,594 PJ (Figure 3). While black coal production grew by 2 per cent in 2018–19, brown coal output fell by 6 per cent to 444 PJ, linked to an overall fall in brown coal‑fired electricity from power stations, such as Hazelwood.
In 2018–19, natural gas production grew by 16 per cent to 5,498 PJ. This was largely due to increased conventional gas production in offshore Western Australia to support additional LNG exports. Coal seam gas accounted for about one‑quarter of Australia’s annual gas production on an energy content basis, with over two thirds of production on Australia’s east coast. In 2019, coal seam gas production increased by 3 per cent to 1,603 PJ.
Crude oil and condensate production grew by 18 per cent in 2018–19 to 677 PJ, reversing the longer term trend of declining production from mature fields. This short term reversal in oil and condensate production is attributed to the commencement of crude oil production from the Greater Enfield Project in the Northern Carnarvon Basin, together with a ramp up in condensate production from the Ichthys and Prelude projects in the Browse Basin.
Australia accounts for 12 per cent of world uranium production. Uranium contributed 15 per cent of Australia’s total primary energy production in 2018–19 at 3,580 PJ. Uranium production increased by 15 per cent in 2018–19, but will decline by about 30 per cent in the short to medium term following closure of the Ranger mine in January 2021.
Trade of Australia’s energy resources
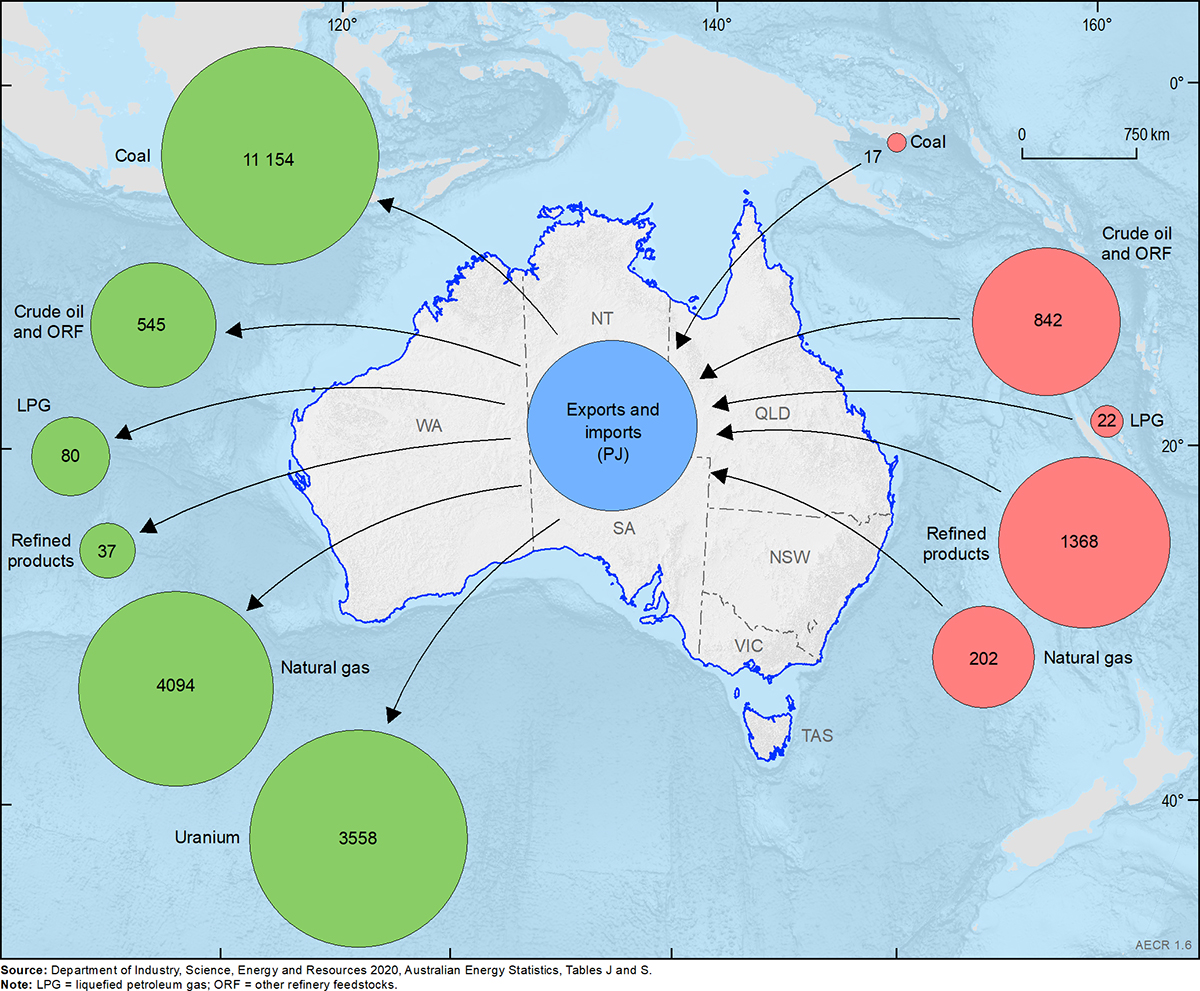
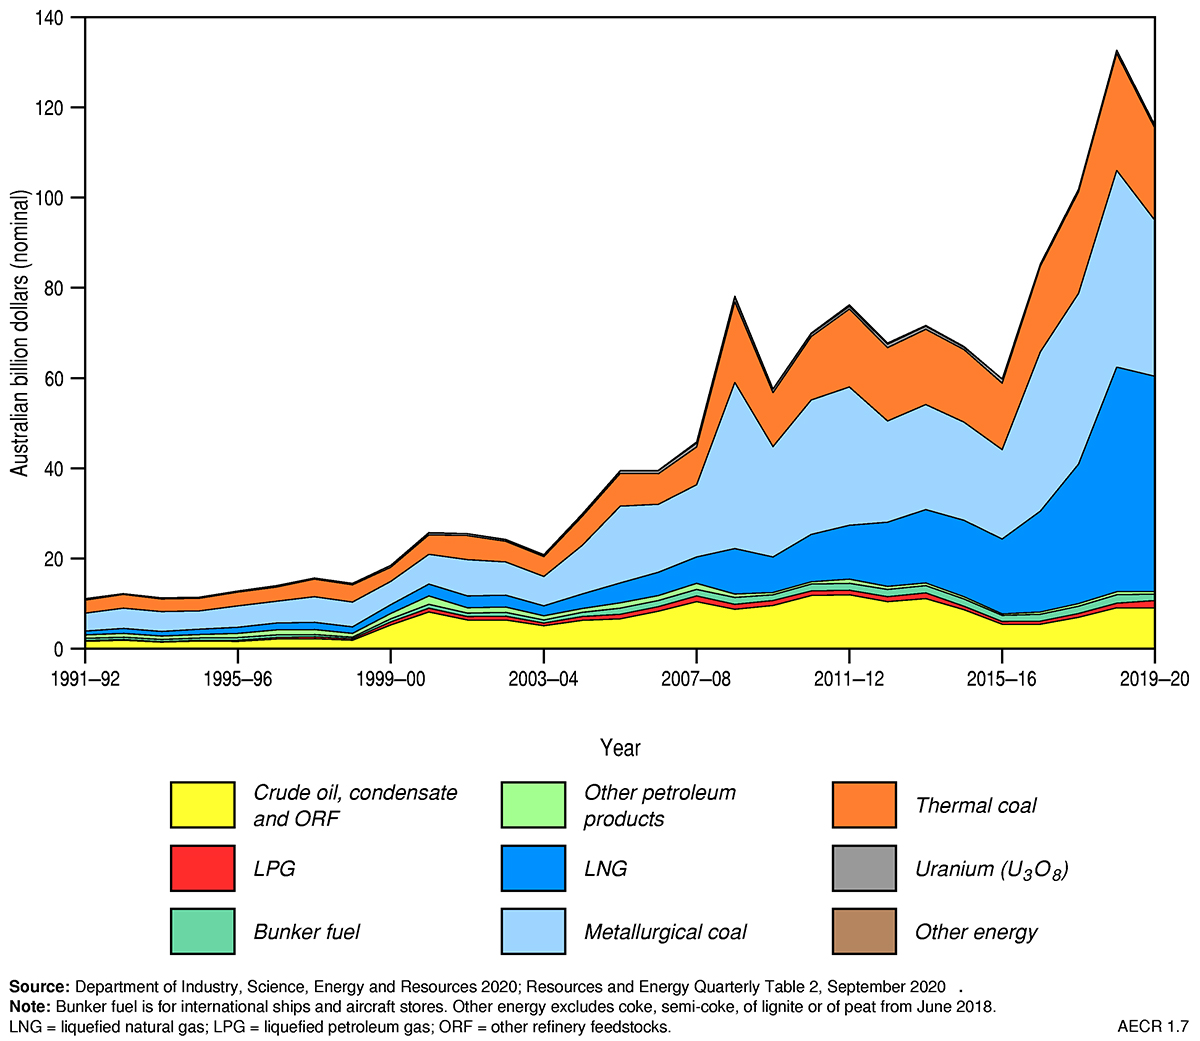
Australia is a net exporter of energy—in 2018–19 energy commodity exports exceeded imports by almost eight times (Figure 4, Figure 5, Figure 6, Table 3, Table 4). In 2018–19, Australia’s energy commodity exports grew by 5 per cent to 19,469 PJ, slightly lower than the average annual growth over the past decade of 6 per cent (Figure 4, Figure 6, Table 3). Associated energy commodity export earnings increased by 30 per cent to AUD$133 billion (Figure 7, Table 5), while energy commodity imports decreased slightly by 0.1 per cent to 2,451 PJ (Figure 5, Table 4).
In 2018–19 black coal remained the dominant energy commodity export growing by 3 per cent to 11,131 PJ, and providing associated export earnings of about AUD$70 billion. Overall, black coal exports grew annually by about 4 per cent over the last decade.
- About 88 per cent of black coal produced in Australia was exported in 2018–19.
Table 3. Australian energy exports by fuel type (2018–19)
| Energy source | Exports (PJ) | Share (%) | Average annual growth 2018-19 (%) |
Average annual growth 2008-09 to 2018-19 (%) |
|---|---|---|---|---|
| Black coal | 11,131 | 57.2 | 3.4 | 4.2 |
| Coal by-products | 23 | 0.1 | 15.8 | na |
| Natural gas (LNG) | 4,094 | 21.0 | 21.3 | 17.2 |
| Crude Oil and ORF | 545 | 2.8 | 13.1 | -1.2 |
| LPG | 80 | 0.4 | 21.3 | 1.8 |
| Refined Products | 37 | 0.2 | -2.9 | -1.5 |
| Uranium | 3,558 | 18.3 | -6.7 | -2.9 |
| Total | 19,469 | 100.0 | 4.9 | 5.9 |
Notes: The share of production by fuel types differs from that published in the Australian Energy Statistics due to inclusion of uranium in this table. na = not available. Source: Department of Industry, Science, Energy and Resources (2020) Australian Energy Statistics Tables J, I1 and S2.
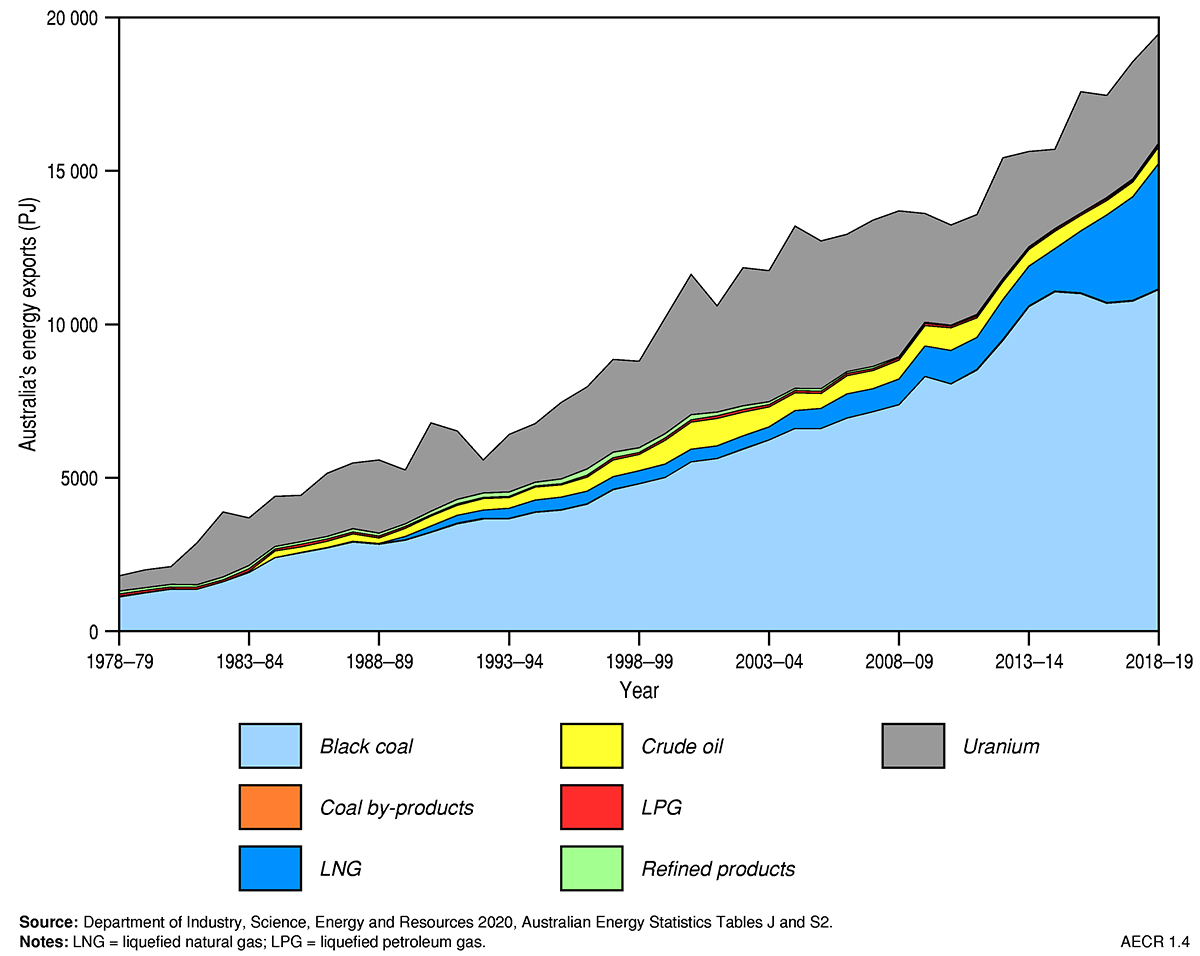
Australia’s LNG exports grew by 21 per cent in 2018–19 to 4,094 PJ, following the start‑up of new LNG projects in Western Australia during 2018. Associated LNG export earnings rose by 61 per cent in 2018–19 to AUD$50 billion, representing about 38 per cent of total energy commodity export earnings. In the previous decade, LNG exports have shown an average annual growth rate of about 17 per cent. The only gas Australia imported in 2018–19 was sourced from the former Joint Petroleum Development Area in the Timor Sea, which was transported and liquefied in Darwin for export.
- In 2018–19, around 75 per cent of all natural gas produced in Australia was exported.
In 2018–19 Australia’s export of crude oil and condensate increased by 13 per cent to 545 PJ. Export earnings from crude oil and condensate increased by about 30 per cent in 2018–19 to about AUD$9 billion. The increase in oil exports during 2018–19 was a significant reversal to the longer term trend of exports decreasing by about 1 per cent per annum over the past decade. Despite the increase in oil production during 2018–19, Australia continued to import the majority of its crude oil and refined petroleum products, which totalled 2,210 PJ—a decrease of about 3 per cent from 2017–18. Australia exports the majority of its produced oil as our basins typically produce light sweet oil, which needs to be blended with other heavier crude oils to produce refined fuel products. As the majority of Australia’s oil is produced on the North West Shelf (significant distances from our Eastern Australian refineries), it has been more effective for Australia’s crude to be exported to the larger Asian refineries, and import refined fuel products into Australia.
- About 80 per cent of all crude oil and condensate produced in Australia was exported in 2018–19.
Australia is also a significant exporter of uranium oxide for use in nuclear power plants. However, in 2018–19 uranium exports decreased by 7 per cent to 3,558 PJ reflecting the trend of declining growth in uranium exports over the past decade. On average uranium exports have over the past decade decreased by about 3 per cent per annum. Export earnings for uranium did, however, increase in 2018–19 by 28 per cent to AUD$0.7 billion due to a rise in uranium prices following the historical lows reached in 2017 (Department of Industry, Science, Energy and Resources, 2019).
Table 4. Australian energy imports by fuel type (2018–19)
| Energy source | Imports (PJ) | Share (%) | Average annual growth 2018-19 (%) |
Average annual growth 2008-09 to 2018-19 (%) |
|---|---|---|---|---|
| Coal and coal by-products | 17 | 0.7 | 42.8 | 26.7 |
| Crude Oil and ORF | 842 | 34.4 | -2.9 | -1.1 |
| LPG | 22 | 0.9 | -3.8 | -2.2 |
| Refined Products | 1,368 | 55.8 | 0.2 | 7.0 |
| Natural Gas | 202 | 8.2 | 8.3 | -1.8 |
| Total | 2,451 | 100.0 | -0.1 | 2.6 |
Notes: The share of production by fuel types differs from that published in the Australian Energy Statistics due to inclusion of uranium in this table. Source: Department of Industry, Science, Energy and Resources (2020) Australian Energy Statistics Tables J, I1 and S2.
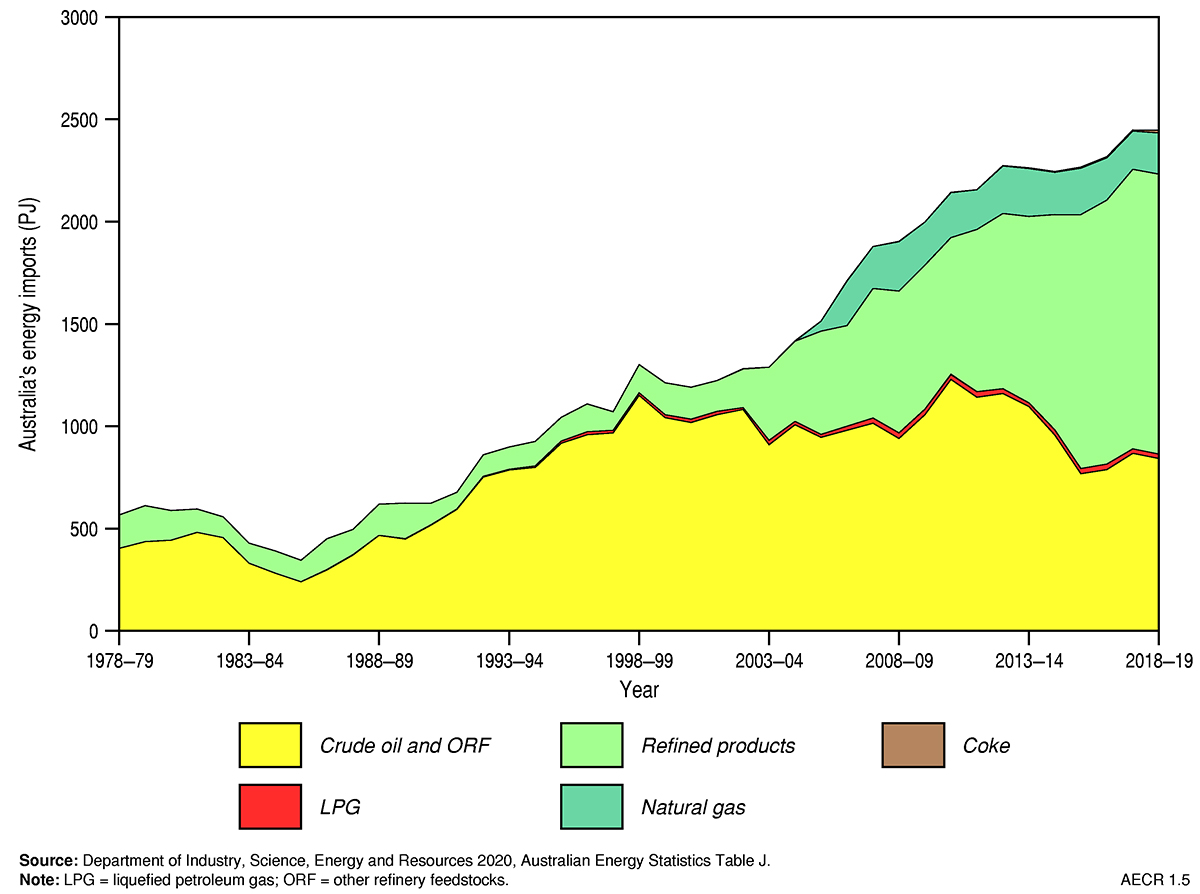
Table 5. Annual value of Australian energy commodity exports by fuel type (2018–19)
| Energy source | Vaue (AUD$billion) | Share (%) | Average annual growth 2018-19 (%) |
Average annual growth 2008-09 to 2018-19 (%) |
|---|---|---|---|---|
| Crude oil and ORF | 9.1 | 6.8 | 30.4 | 0.4 |
| LPG | 1.0 | 0.8 | 31.5 | 0.1 |
| Bunker fuel | 1.8 | 1.4 | 9.0 | 1.7 |
| Other petroleum products | 0.7 | 0.5 | 20.5 | -0.9 |
| Natural gas (LNG) | 49.7 | 37.5 | 60.9 | 17.3 |
| Metallurgical coal | 43.6 | 32.9 | 15.5 | 1.7 |
| Thermal coal | 26.0 | 19.6 | 14.9 | 3.8 |
| Uranium | 0.7 | 0.6 | 27.7 | -3.0 |
| Total | 132.7 | 100.0 | 30.3 | 5.4 |
Notes: The share of production by fuel types differs from that published in the Australian Energy Statistics due to inclusion of uranium in this table. Source: Department of Industry, Science, Energy and Resources (2020) Resources and Energy Quarterly, December 2020, Table 2(2).
Australia in the world energy market
This section examines the place of Australia in the world energy market in terms of primary energy production and energy trade. Statistics on fossil fuel resources in 2019 are sourced primarily from the BP (2020) Energy Outlook and BP Statistical Review of World Energy (2020). There is, however, no data on uranium resources or world primary energy production available for the 2019 reporting period. As such, statistics for the 2018 reporting period as reported by the International Energy Agency (2020) have been used.
Improvements in global output, quality of life and prosperity have led to significant increases in global energy demand. The middle class in the developing world is also increasing and overall the world’s population is on track to reach 9.2 billion in 2040. This has significant impacts on the global trade and demand for energy resources.
Growth in global energy demand slowed during 2019 to 1.3 per cent—a significant reduction from the eight year high of 2.8 per cent in 2018 and below its 10 year average rate of 1.6 per cent. China accounted for over three quarters of net global growth, with India and Indonesia the next largest contributors. About three‑quarters of global growth in 2019 was driven by demand for renewable energy and natural gas resources. The share of renewables and natural gas in primary energy consumption increased to record highs, while coal consumption declined to its lowest level since 2003. Most fuels showed a slower rate of growth than their 10 year averages due to weaker economic growth and unwinding of some climatic factors that boosted demand for heating and cooling services in 2018. However, nuclear energy demand showed its fastest growth (3.2 per cent) since 2004.
- During 2018–19 Australia’s energy demand increased by 0.6 per cent to 6,196 PJ (Department of Industry, Science, Energy and Resources, 2020a).
World primary energy production
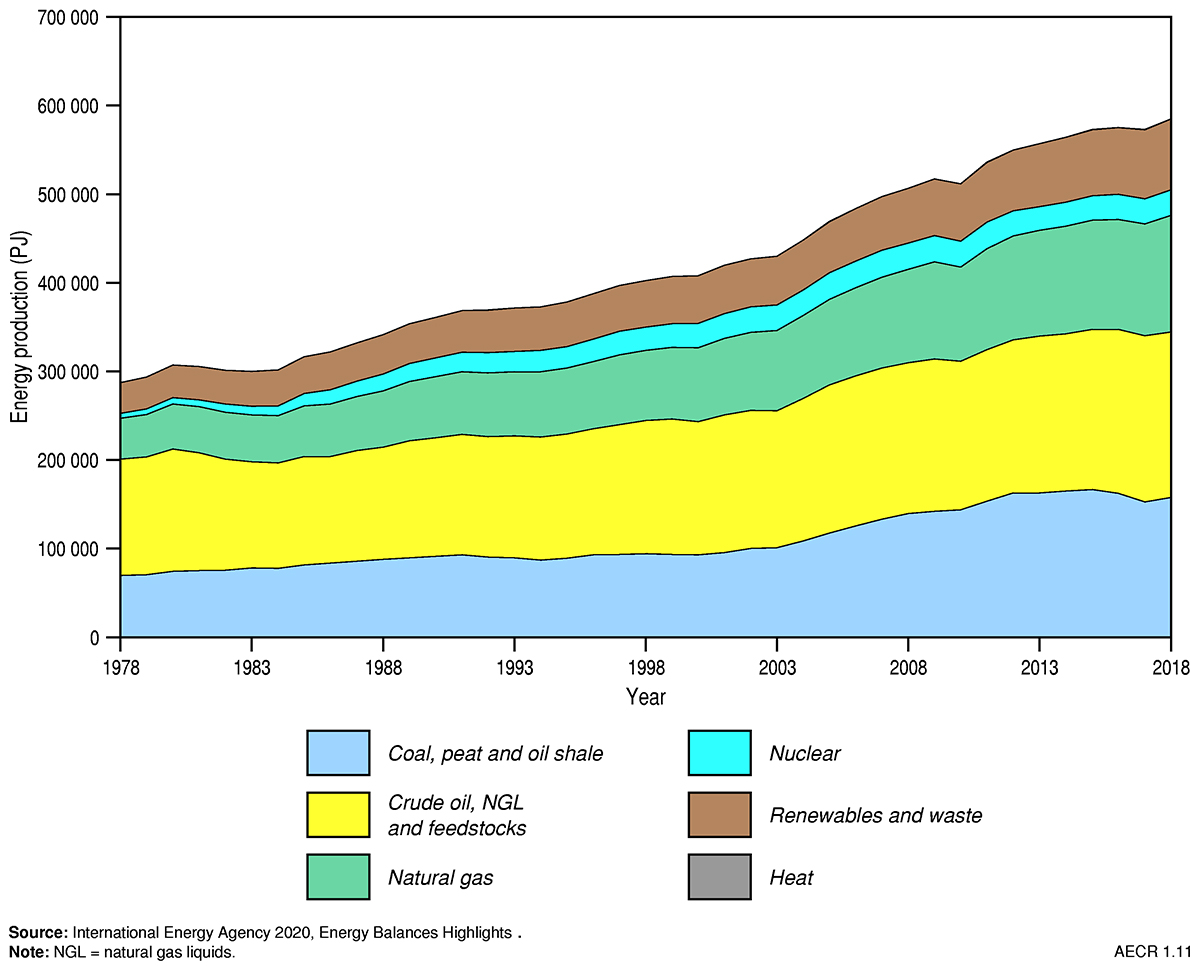
In 2019, global energy production for fossil fuels increased by 1.5 per cent following a 3.2 per cent growth in 2018. About 43 per cent of total global energy production in 2018 occurred in China, the US and Russia (Table 6)—Australia was ranked eighth producing about 3 per cent of the world’s energy resources. Most global energy production was from oil (32 per cent), coal (27 per cent), or natural gas resources (23 per cent; Figure 8).
In 2019, growth in energy production was dominated by gas production, which increased by 3.4 per cent (3.7 Tcf; 4,746 PJ). About two thirds of this increase (2.4 Tcf; 3,060 PJ) came from the US, primarily from shale gas resource developments. Australia and China also had significant increases in total gas production of 16.2 per cent (0.7 Tcf; 841 PJ) and 9.9 per cent (0.5 Tcf; 577 PJ), respectively.
- At the end of 2019 Australia was the seventh largest natural gas producer, contributing about 3.9 per cent of global gas production.
Table 6. World energy production by country 2018
| Country | Energy production (PJ) | World share (%) | Rank | Major energy resources |
|---|---|---|---|---|
| People's Republic of China | 107,277 | 17.8 | 1 | Coal, solar/wind/other, hydro |
| United States | 90,963 | 15.1 | 2 | Natural gas, crude oil/NGL/feedstock, coal |
| Russian Federation | 62,141 | 10.3 | 3 | Natural gas, crude oil/NGL/feedstock |
| Saudi Arabia | 27,859 | 4.6 | 4 | Crude oil/NGL/feedstock |
| India | 24,015 | 4.0 | 5 | Coal, hydro, biofuels |
| Australia | 17,232 | 2.9 | 8 | Coal, natural gas, uranium |
| World total | 603,814 |
Source: International Energy Agency (2020) World Energy Balances: Overview.
In 2019, global oil production fell by 0.06 MMbbl (0.4 PJ) per day due to a sharp decline in OPEC production. The US had the largest increase in oil production for the third consecutive year, with output rising 1.7 MMbbl per day (10 PJ per day; 11.0 per cent), largely associated with the development of shale oil and tight oil resources. Increases in production also occurred in Canada (2.7 per cent; 0.15 MMbbl per day; 0.9 PJ per day) and Brazil (7.4 per cent; 0.2 MMbbl per day; 1.2 PJ per day). These increases were, however, counteracted by declines in Venezuela (down by 37.7 per cent; 0.6 MMbbl per day; 3.4 PJ per day) and Iran (down by 26.4 per cent; 1.3 MMbbl per day; 7.7 PJ per day).
- At the end of 2019 Australia was ranked 30th in the world for oil production, contributing only 0.5 per cent to global oil production.
In 2019, coal’s share in the energy mix continued to decline, falling to a sixteen year low of 27 per cent. Consequently, global coal production rose by only 1.5 per cent in 2019, significantly lower than the 4.3 per cent of growth that occurred in 2018. OECD countries showed a significant decline in coal production (down by 6.9 per cent; 121.5 Mt; 1,776.3 PJ). However, coal production grew in China (4.2 per cent; 148.0 Mt; 3,239.2 PJ) and Indonesia (9.4 per cent; 52.2 Mt; 1,288.5 PJ), where demand for coal also continued to grow.
- In 2019 Australia maintained its ranking as the world’s fifth largest producer of black coal.
In 2018, nuclear production increased by 2.8 per cent with particularly strong growth in China (19 per cent), Taiwan (23 per cent) and Argentina (13 per cent). In contrast, nuclear production decreased by 18 per cent in Africa.
- At the end of 2018, Australia maintained its ranking as the world’s third largest producer of uranium.
World trade
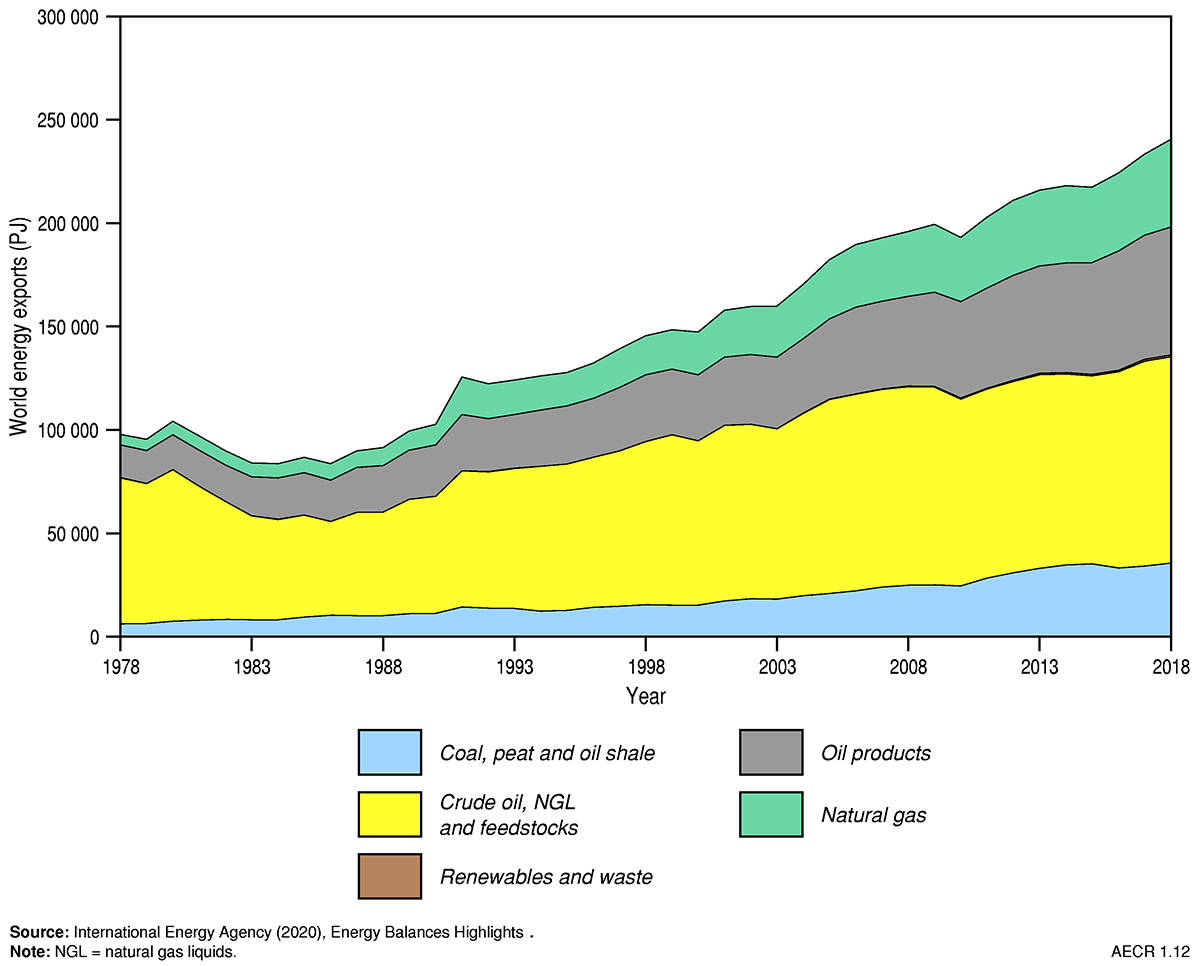
In 2018, global energy exports were dominated by crude oil (41 per cent), oil products (25 per cent), natural gas (17 per cent) and coal (15 per cent; Figure 9). About 42 per cent of world energy exports during this period originated from six countries—the Russian Federation (12.3 per cent), the United States (8.5 per cent), Saudi Arabia (8.3 per cent), Australia (5.6 per cent), Canada (5.3 per cent) and Indonesia (4.7 per cent; Table 7).
- In 2018 Australia was the world’s fourth largest energy exporter.
During 2019, oil trade fell by 0.2 MMbbl/day (down by 0.3 per cent; 1.4 PJ/day)—a significant reduction from the 1.4 MMbbl/day (8.2 PJ/day) growth seen in 2018 and the first decline since the financial crisis in 2009. Most of this decline was due to reduced crude oil trade, with a sharp fall in Middle East exports by 1.3 MMbbl/day (down by 5.4 per cent; 8.1 PJ/day). Oil imports grew significantly in China by 0.8 MMbbl/day (7.3 per cent; 4.9 PJ/day) and India by 0.2 MMbbl/day (3.5 per cent; 1.1 PJ/day). However, these increases were offset by reduced oil imports, particularly into the United States (down by 8.5 per cent; 0.9 MMbbl/day; 5.2 PJ/day) and Japan (down by 4.1 per cent; 0.2 MMbbl/day; 1.0 PJ/day). In addition, during 2019 the average dated Brent oil prices dropped from US$71.31/bbl to US$64.21/bbl.
Table 7. World energy exports by country in 2018
| Country | Energy exports (PJ) | World share (%) | Rank | Major energy exports |
|---|---|---|---|---|
| Russian Federation | 30,480 | 12.3 | 1 | Largest natural gas exporter (pipeline & LNG) and one of major exporters of oil and coal |
| United States | 21,086 | 8.5 | 2 | Major exporter of oil and natural gas |
| Saudi Arabia | 20,620 | 8.3 | 3 | Largest oil and NGL exporter |
| Australia | 13,930 | 5.6 | 4 | Largest exporter of coal, second largest exporter of LNG1, major exporter of uranium |
| Canada | 13,063 | 5.3 | 5 | One of the major exporters of oil and natural gas |
| Indonesia | 11,534 | 4.7 | 6 | Second largest coal exporter, and one of the major exporters of natural gas |
Notes: 1Australia subsequently became the largest LNG exporter in 2019. Source: International Energy Agency (2020), World Energy Balances: Overview
In 2019, the global LNG market expanded rapidly with inter‑regional trade increasing by 12.7 per cent (1.93 Tcf; 1,952.9 PJ), the largest ever increase and more than double the 10‑year average. This record growth was driven by increased LNG exports from the United States (66.3 per cent; 0.67 Tcf; 678.8 PJ), the Russian Federation (57.9 per cent; 0.51 Tcf; 517.2 PJ), and continued growth from Australia (14 per cent; 0.46 Tcf; 461.9 PJ). Growth in LNG exports were mostly absorbed by an unprecedented 68.1 per cent (1.71 Tcf; 1,740.0 PJ) growth in LNG exports to Europe. Gas prices also fell sharply due to a global oversupply of LNG, with US Henry Hub prices dropping almost 20 per cent, while European and Asian prices fell by more than 40 per cent.
- In 2019 Australia was the world’s largest LNG exporter.
In 2019, coal trade decreased for the first time since 2015 by 1.3 per cent (down by 452.8 PJ), with significant declines in exports from the United Sates (down by 17.5 per cent; 507.2 PJ) and Columbia (down by 13.5 per cent; 327.2 PJ). Australia experienced a small decline in coal exports of 0.9 per cent (down by 85.2 PJ). A strong growth in exports was only seen in Indonesia (7.2 per cent; 619.3 PJ). Coal imports grew in India (7.9 per cent; 415.9 PJ), China (4.3 per cent; 263.8 PJ), and elsewhere in the Asia‑Pacific region (10.9 per cent; 587.9 PJ), but were offset by falling imports in Europe (down by 18.4 per cent; 1183.9 PJ), Japan (down by 2.2 per cent; 108.9 PJ), and South Korea (down by 4.7 per cent; 185.9 PJ).
- In 2019–20, Australia was the world’s largest exporter of metallurgical coal and the second largest exporter of thermal coal (Department of Industry, Science, Energy and Resources, 2020).
Ownership and administration of energy resources
The Australian Constitution provides that mineral and petroleum resources are owned either by the Australian Government, or the state and territory governments. Exploration and development of these resources are undertaken by companies operating under licences and permits granted by the government. The Australian, state and territory governments actively encourage investment in Australia’s energy resources.
Petroleum exploration and production activities beyond three nautical miles from the territorial sea baseline and within Australia’s Exclusive Economic Zone (‘Commonwealth Waters’) are the responsibility of the Australian Government. These resources are governed under the Offshore Petroleum and Greenhouse Gas Storage Act 2006 and by maritime boundary treaties with neighbouring countries. The Joint Authorities (comprising the Commonwealth and state and territory governments), the National Offshore Petroleum Titles Administrator and the National Offshore Petroleum Safety and Environmental Management Authority grant, administer and regulate petroleum titles to ensure that exploration and development activities are compliant with the relevant regulatory frameworks.
Exploration for, and development of, non‑renewable resources onshore and out to three nautical miles is the responsibility of the state and territory governments. They are administered and regulated under the relevant state or territory legislation relating to minerals and petroleum. The legislation varies between jurisdictions, but is similar in content and administration, and is based on a two‑stage process of exploration permit and production licence. An overview is provided in Australia's Energy and Mineral Resources Investor Guide, and more information is available from the state and territory mineral and petroleum departments and agencies.
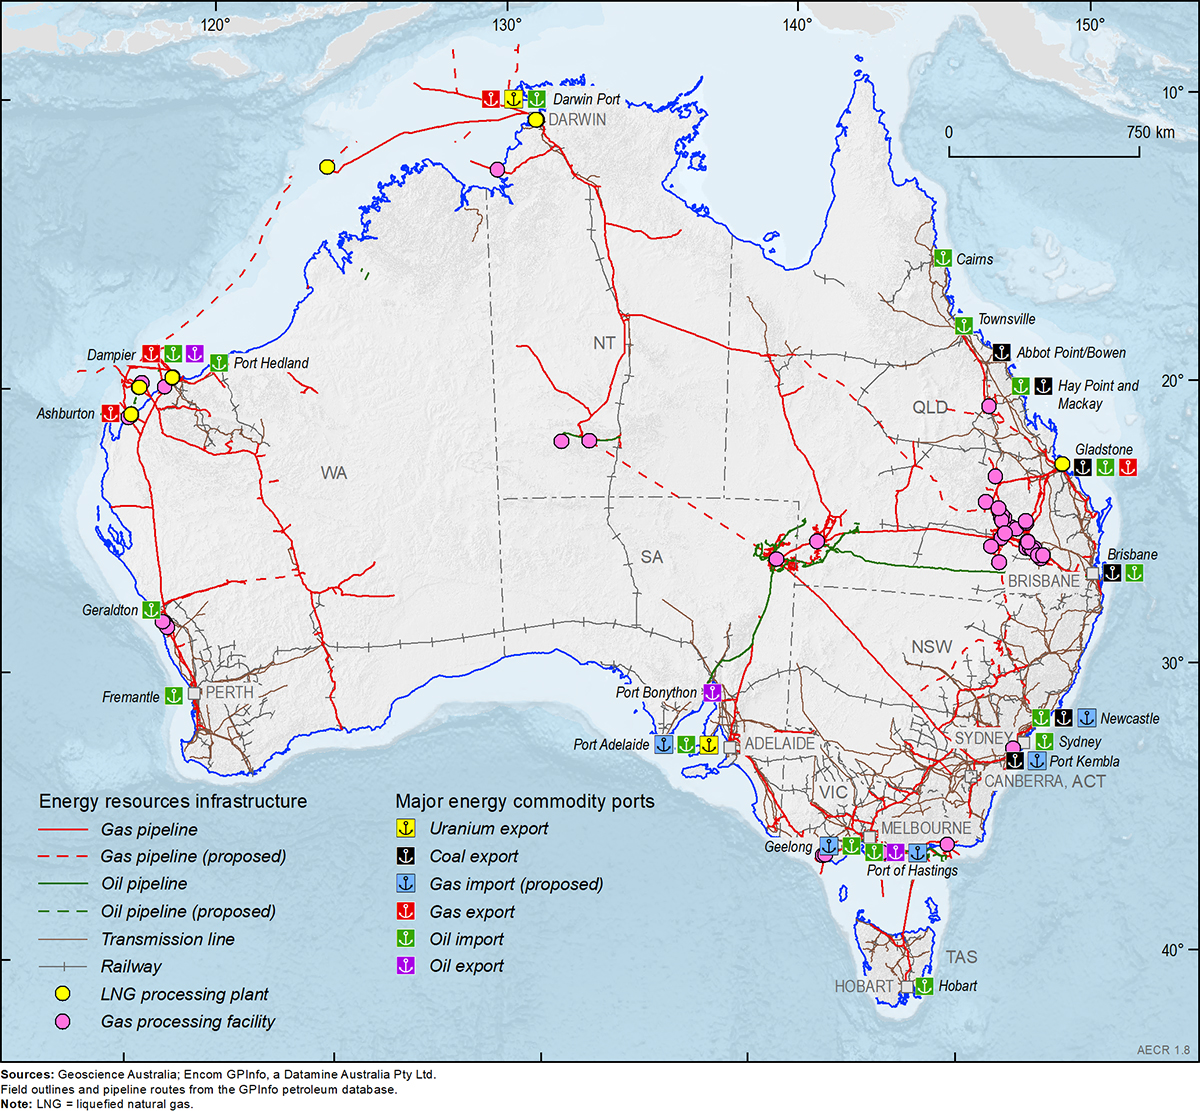
Energy production and distribution infrastructure
Utilisation of Australia’s abundant non‑renewable energy resources requires investment in reliable energy supply infrastructure, including gas pipelines, gas processing and storage facilities, ports, rail networks (Figure 10). Gas is distributed across a series of transmission pipelines from areas of extraction and processing plants to either ports for export as LNG, or to power stations, large industrial and commercial plants, mines, and local consumers via gas retailers for domestic consumption. Shipping is the main transport mode used to trade Australia’s energy resources, including coal (six ports); petroleum liquids (four ports and one floating facility), gas (four ports and one floating facility), and uranium (two ports).
Maritime trade is forecast to double in the next 20 years as Australia’s economy continues to grow. Australia has a dedicated network of railway infrastructure for the transportation of coal and uranium resources from their extraction points to a number of major ports for export.
Gas pipelines
Gas pipelines in Australia consist of long haul transmission pipelines, which deliver gas from production and processing facilities, to domestic markets and export terminals (Figure 10). These pipelines typically have wide diameters and operate under high pressure to optimise shipping capacity.
An interconnected gas pipeline network, including fourteen major pipelines, links gas fields in the Northern Territory, Queensland, South Australia and Victoria with industrial and domestic demand centres across eastern and southern Australia. This interconnected gas transmission network has become increasingly important in recent years to ensure peak gas demand in southern states during winter is supplied by gas producing basins in northern Australia (AEMO, 2021). The Western Australian gas market is serviced by a series of ten major pipelines, which link gas fields in the Perth Basin and the North West Shelf to the mining sector and domestic markets (AEMO, 2020).
Gas storage facilities
Deep gas storage facilities provide flexible capacity to meet domestic consumption requirements by storing surplus gas produced during low demand periods in summer to meet increased demand during winter. In 2021, gas storage facilities include two depleted gas fields in Western Australia (Mondarra and Tubridgi), two depleted gas fields in eastern Australia (Silver Springs and Iona), and two LNG storage facilities in eastern Australia (Newcastle and Dandenong).
In recent years, there has been increased reliance on gas storage in southern states as gas production from locally sourced fields has decreased. The critical role for gas storage in southern Australia is expected to increase further after 2023 as the maximum daily gas production decreases (AEMO, 2021).
Ports
Shipping is the main mode of transport for Australia’s imports and exports. Every day $1.2 billion of trade moves through Australian ports, making up 98 per cent of Australia’s total trade (Ports Australia, 2021). Australia has 77 trading ports, a number of which are equipped to export coal, oil, gas and uranium (Figure 8).
There are six major coal‑exporting ports, which are located in New South Wales and Queensland. Newcastle is currently the world’s largest coal export port (Department of Infrastructure and Regional Development, 2018). While infrastructure capacity constraints (including port and rail) have limited the ability of the Australian coal industry to respond to growing global demand in previous years, recent additions to capacity, including an expansion of the Hay Point coal port in Queensland, will help alleviate these constraints (Department of Industry, Innovation and Science, 2016).
Gas is exported as LNG from ports in Western Australia (Dampier and Ashburton), the Northern Territory (Darwin) and Queensland (Gladstone). Liquid hydrocarbons (petroleum and condensate, liquid petroleum gas [LPG]) are exported from the Dampier region (crude oil), Darwin (LPG), the Port of Hastings in Victoria (crude oil and LPG), and Port Bonython in South Australia (LPG). The Prelude floating LNG production facility in the Browse Basin (offshore Western Australia) is also used to export LNG and LPG. Overall there are about 150 terminals that offload petroleum products from domestic and/or international sources.
The export of uranium is only approved from two ports—Darwin in the Northern Territory—and Port Adelaide in South Australia (Ports Australia, 2019).
Proposed LNG import terminals
LNG import terminals represent an alternative source of gas for consumers in eastern Australia. Up to six LNG import terminals have been proposed to help offset declining production from gas fields in southern Australia, thereby firming seasonal and peak supply requirements1. These terminals could source gas from both international and domestic markets, potentially providing a virtual pipeline from Australia’s northern gas fields to southern demand centres. The Port Kembla Gas Terminal is now considered a committed project by the AEMO (2021), and should provide increased flexibility as early as 2023.
Rail
Australia has substantial rail infrastructure including 33,221 route km of heavy railways, 291 route km of light rail/tramways and heavy and light urban passenger rail networks of 401 route km and 250 route km, respectively (Department of Infrastructure and Regional Development, 2018; Figure 8). The rail network transports a variety of resources from their extraction points to a number of major ports for export. For example, the railways enable Port Hedland to be the world’s largest bulk export port.
Most extracted coal is transported via the rail network and, with iron ore, forms the largest bulk freight flows. The principal coal rail networks include the central Queensland systems (1,979 route kilometres) and the New South Wales Hunter Valley Coal network (approximately 785 route kilometres). Approximately 90 per cent of coal produced in Queensland and 73 per cent in New South Wales is exported. Coal extracted in Tasmania is used domestically (Department of Infrastructure and Regional Development, 2018). Rail is also used to transport uranium to ports in Adelaide and Darwin for export.
Enabling Clean Energy Technologies
Maximising the potential of Australia’s remaining gas and coal resources requires developing enabling technologies for either capturing, storing or eliminating greenhouse gas emissions associated with extraction and utilisation of these fossil fuels. Australia’s Technology Investment Roadmap: First Low Emissions Technology Statement has identified hydrogen production and associated carbon capture and storage (CCS) as priority technologies to enable low emissions utilisation of Australia’s fossil fuel resources (Department of Industry, Science, Energy and Resources, 2020c).
Hydrogen
Hydrogen is a key enabling technology recognised under the Technology Investment Roadmap (Department of Industry, Science, Energy and Resources, 2020c) and has been identified as a key technology for decarbonising our energy systems in Australia’s National Hydrogen Strategy (Commonwealth of Australia, 2019).
The primary methods currently available for producing clean hydrogen include:
- Renewable hydrogen (commonly referred to as Green Hydrogen) where renewable energy sources such as solar and wind power are used to source the electricity required to split hydrogen from water using a process known as electrolysis;
- CCS hydrogen (commonly referred to as Blue Hydrogen) where hydrogen is produced through a thermochemical reaction using water and fossil fuel feedstocks such as coal (coal gasification) or natural gas (steam methane reforming). The CO2 emissions created as a by‑product are captured and stored in deep sub‑surface geological formations.
Globally, around 70 million tonnes of hydrogen are produced each year with a further 48 million tonnes produced as a by‑product of other industrial processes (IEA, 2019). The large majority of all hydrogen produced to date has been derived from fossil fuels without carbon capture and storage. Renewable electricity is used to produce less than 0.3 per cent of the world’s hydrogen. It is currently less expensive to produce hydrogen using fossil fuels with CCS, but it is anticipated that the costs will narrow over the coming years.
Australia’s hydrogen potential
With large potential for renewable energy, abundant identified resources of natural gas and coal, and good potential geological storage sites for any co‑produced CO2, Australia is well placed to become a major hydrogen producer for both domestic consumption and export. Geoscience Australia’s AusH2 data portal provides open access data sets and tools to assist governments and industry to assess hydrogen potential in Australia. Development of an Australian hydrogen industry will not only ensure our future energy security, but also enable our abundant non‑renewable energy resources to be transformed into a carbon free energy source for overseas markets.
Like natural gas or LNG, hydrogen can be transported by pipelines, trucks or ships in compressed, liquefied form, or as a chemical compound such as ammonia or methylcyclohexane. Hydrogen can be stored in tanks on the surface, or in sub‑surface salt caverns or depleted gas fields. Storage infrastructure is essential to enable hydrogen to be produced and stored during periods of low energy demand, then distributed to demand centres during periods of high energy consumption. Geoscience Australia is currently mapping the distribution of potential hydrogen storage sites under its Exploring for the Future Program.
Australia’s hydrogen projects
While large scale implementation of hydrogen production is not yet available in Australia, there are several pilot, demonstration and small scale projects in various stages of operation. Figure 11 shows the location of current hydrogen projects in Australia and the results of a mapping scenario that considers hydrogen production from renewable energy using coastal water supplies and constrained by the existing electricity network.
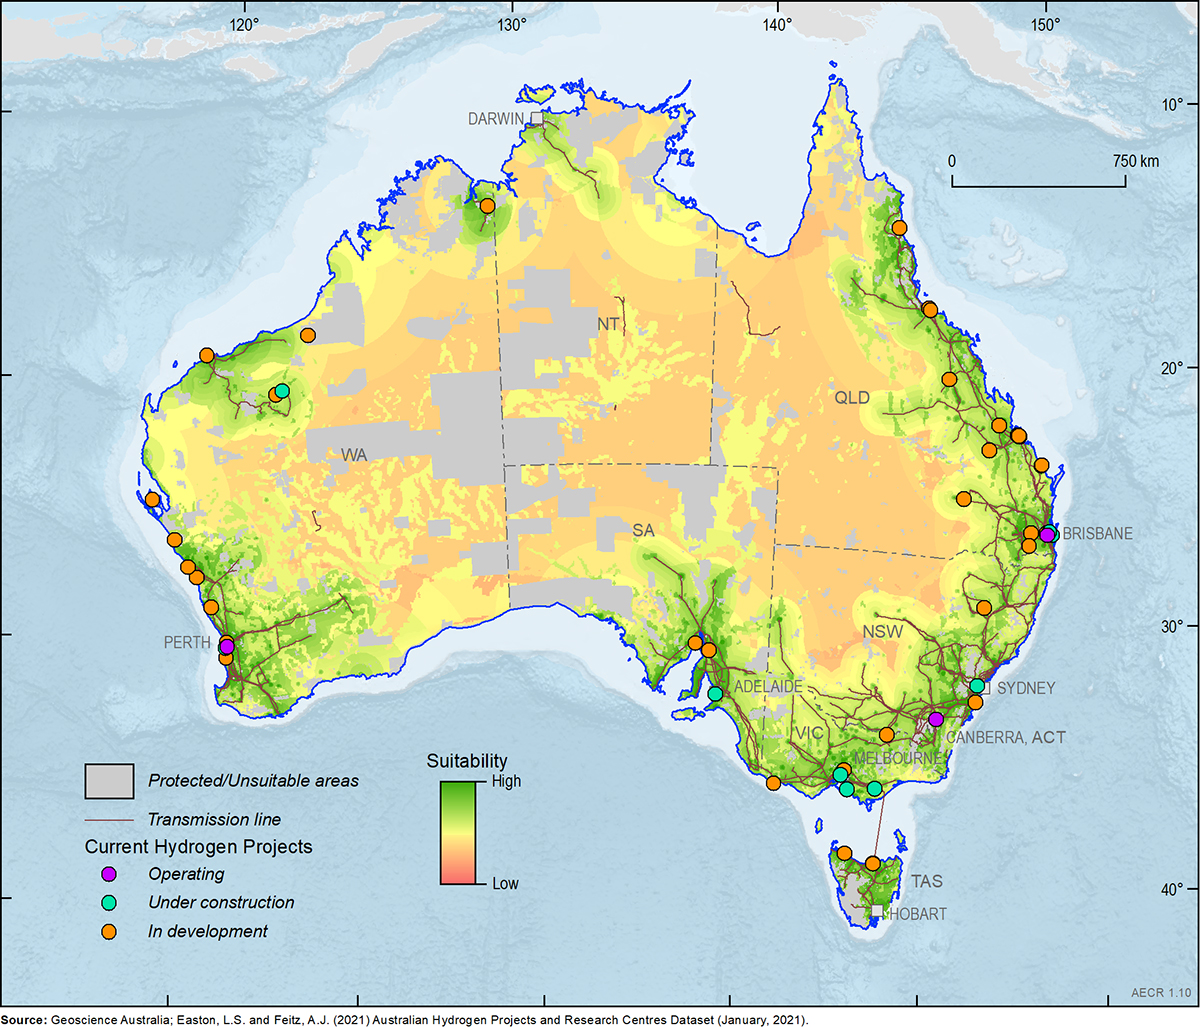
Australia’s Gippsland Basin is the location for a world‑first project, the Hydrogen Energy Supply Chain Project, which is demonstrating the feasibility of producing clean liquid hydrogen from brown coal resources in the La Trobe Valley for export to Japan. The project has the potential to provide clean, economically viable hydrogen through gasification of coal, and associated carbon capture and storage of CO2 by‑products in suitable geological storage sites within the Gippsland Basin. First pilot project hydrogen production commenced in early 2021.
Carbon Capture and Storage
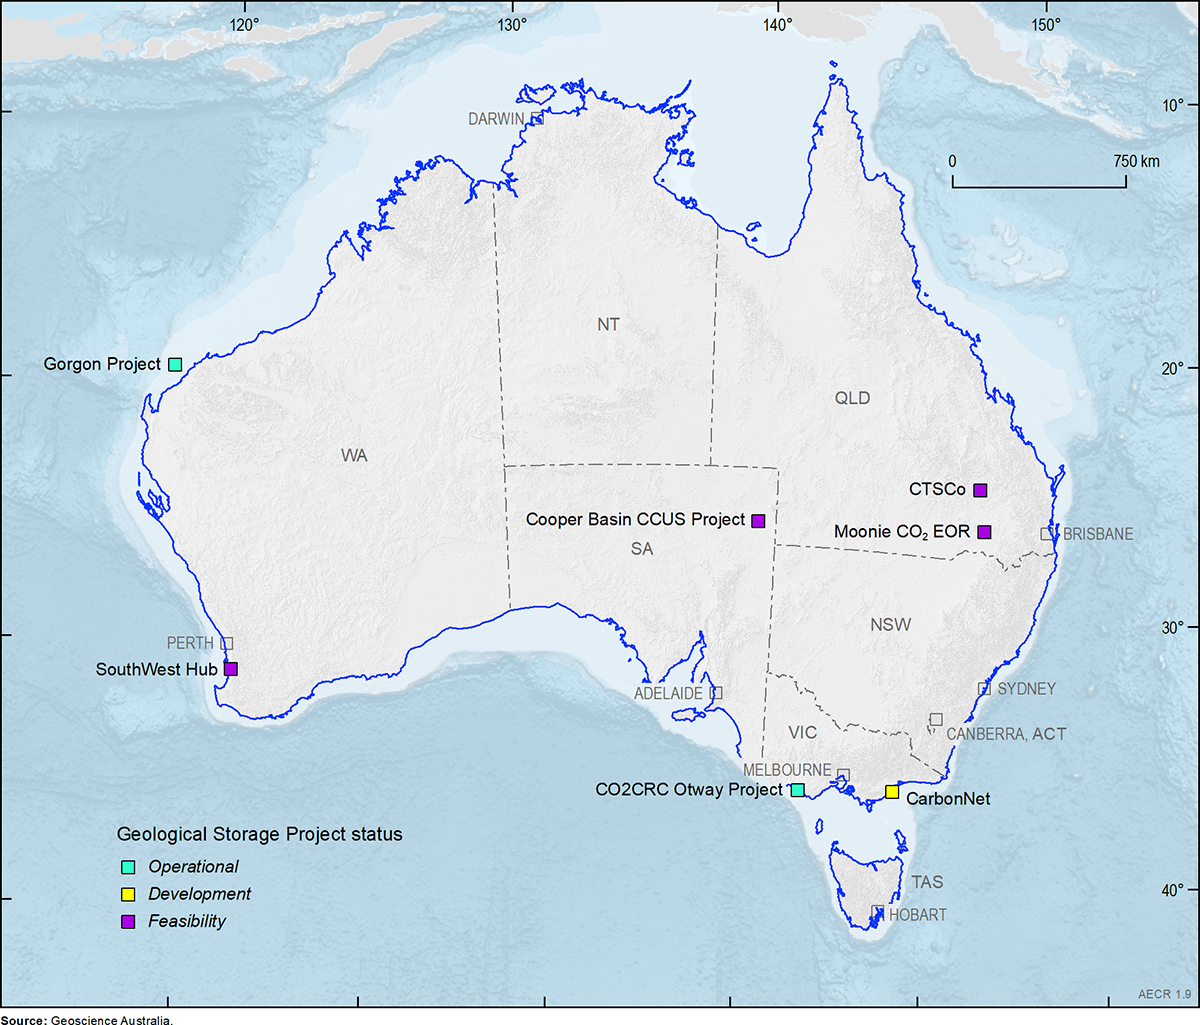
Carbon capture and storage (CCS) is a technology that can reduce the amount of CO2 released to the atmosphere from stationary anthropogenic sources by capturing, transporting, compressing and then injecting into deep geological formations where it remains trapped for thousands of years or more. There are two carbon capture and storage projects operating in Australia, while an additional five projects are at various stages of assessment for commercial viability (Figure 12).
CCS for the coal industry
Due to the important role of coal‑fired power in providing cheap, baseload power in many countries, a significant amount of effort has been put toward capture and storage of CO2 from coal‑fired power plants globally. However, the gases emitted from coal‑fired power plants possess a number of gas components, complicating the capture of CO2 from the gas stream and thereby increasing the cost of capture. As a result, due to the elevated costs of the process for capturing CO2, there have been few successful projects related to coal‑fired power. The few that exist globally are coupled to another commercial venture (e.g. enhanced oil recovery) in order to offset project costs (IEAGHG, 2015). In Australia, the CTSCo Project (Carbon Transport and Storage Company) is in the final feasibility stage for the first demonstration project of the full process of CO2 capture and storage from a coal‑fired power station. The demonstration project will capture and inject between 60,000 and 120,000 tonnes CO2 per year for three years (Coal 21, 2018), and has potential to expand to commercial‑scale CO2 capture and geological storage (millions of tonnes CO2 per year; University of Queensland Carbon Storage Assessment Project).
CCS for the gas industry
Natural gas can contain significant concentrations of CO2 mixed with methane, as is the case with some of the gas fields on Australia’s North West Shelf. In the past, CO2 has simply been separated from the natural gas stream and vented to the atmosphere. Venting practices are becoming less acceptable, mainly due to health and safety concerns, with issues relating to elevated CO2 levels becoming more prominent. Into the future, gas producers may consider re‑injecting the CO2 gas stream into underground formations nearby, or into recently depleted gas fields. The Chevron‑led Gorgon LNG plant includes one of the largest and most advanced CCS projects in the world, which captures CO2 produced from the Gorgon and Jansz‑Io gas fields prior to liquefaction to prevent the natural gas stream freezing into a solid. The Gorgon CCS project began operations in August 2019, and is planned to inject and store over 100 Mt of CO2 during the project’s >40 years lifetime (Chevron, 2019).
CCS for enhanced oil recovery
The use of anthropogenic CO2 in the enhanced oil recovery (EOR) process is another way to achieve permanent storage of CO2 in the sub‑surface (Verma, 2015). CO2–EOR involves injecting into mature oil fields to mobilise trapped oil and extend the life of the fields. This technology has been used widely in the USA where oil compositions and the proximity to CO2 sources have made the process economically viable (United States Department of Energy, 2010). Two CO2–EOR projects are currently in the feasibility stage—Santos’s Cooper Basin CCUS project—and Bridgeport Energy’s Moonie CCUS project.
CCS for hydrogen production
The burgeoning hydrogen production industry is another sector which has great potential in terms of application of CCS technology (Bruce et al., 2018). Hydrogen has also been identified as a central technology for lowering emissions in Australia’s National Hydrogen Strategy (Commonwealth of Australia, 2019), and in Australia’s Technology Investment Roadmap (Department of Industry, Science, Energy and Resources, 2020c). Although hydrogen can be generated with zero emissions through the use of renewable power to electrolyse water, current hydrogen production is mostly conducted using hydrocarbons such as methane and coal, combined with water. Producing hydrogen in such a manner does produce significant CO2 emissions that can be separated and sequestered in the subsurface. Hydrogen production is still in the early stages of development, however, CCS is likely to play a role in the development of Australia’s hydrogen production industry. The CarbonNet Project in Victoria is in the development stage to potentially store up to 5 Mtpa of CO2 from emissions in Victoria’s Latrobe Valley from future hydrogen projects, together with emissions from coal‑fired power stations.
References
Australian Energy Market Operator. 2020. Western Australia gas statement of opportunities, December 2020 (last accessed 5 May 2021).
Australian Energy Market Operator. 2021. Gas statement of opportunities, March 2021, for eastern and south‑eastern Australia (last accessed 5 May 2021).
BP. 2020. bp Energy Outlook: 2020 edition (last accessed 5 May 2021).
BP. 2020. bp Statistical Review of World Energy, 69th edition (last accessed 5 May 2021).
Bruce, S., Temminghoff, M., Hayward, J., Schmidt, E., Palfreyman, D., and Hartley, P. 2018. National Hydrogen Roadmap, CSIRO, Australia (last accessed 5 May 2021).
Chevron. 2019. Gorgon carbon dioxide injection project fact sheet (last accessed 5 May 2021).
Coal 21. 2018. CTSCO carbon capture and storage demonstration: Queensland (last accessed 5 May 2021).
Commonwealth of Australia 2019. Australia’s National Hydrogen Strategy (last accessed 5 May 2021).
Department of Industry, Innovation and Science. 2016. Resources and energy major projects. In: Resources and Energy Quarterly, December 2016 (last accessed 5 May 2021)
Department of Industry, Science, Energy and Resources. 2019. Resources and Energy Quarterly, September 2019 (last accessed 5 May 2021).
Department of Industry, Science, Energy and Resources. 2020a. Australian Energy Statistics (last accessed 5 May 2021).
Department of Industry, Science, Energy and Resources. 2020b. Resources and Energy Quarterly, December 2020 (last accessed 5 May 2021).
Department of Industry, Science, Energy and Resources. 2020c. Technology Roadmap Discussion Paper, Australian Government, Department of Industry, Science, Energy and Resources (last accessed 5 May 2021).
Department of Infrastructure and Regional Development. 2014. Containerised and non‑containerised trade through Australian ports to 2032–33. (last accessed 5 May 2021).
Department of Infrastructure and Regional Development. 2018. Trainline 6 Statistical Report (last accessed 5 May 2021)
Easton, L. and Feitz, A.J. 2021. Australian hydrogen projects and research centre data set; January 2021 (last accessed 5 May 2021).
Geoscience Australia. 2018. Australian Energy Resources Assessment (last accessed 5 May 2021).
IEAGHG. (2015). Integrated carbon capture and storage project at SaskPower’s Boundary Dam Power Station, 2015/06, August 2015 (last accessed 5 May 2021).
International Energy Agency (IEA). 2019. The Future of Hydrogen (last accessed 5 May 2021).
International Energy Agency (IEA). 2020. World Energy Balances: Overview (last accessed 5 May 2021).
Ports Australia. 2019. Trade statistics for 2016‑2017 (last accessed 5 May 2021).
Ports Australia. 2021. Trade statistics (last accessed 5 May 2021).
Senior, A., Britt, A., Summerfield, D., Hughes, A., Hitchman, A., Cross, A., Champion, D., Huston, D., Bastrakov, E., Sexton, M., Moloney, J., Pheeney, J., Teh, M., and Schofield, A., Geoscience Australia 2021. Australia’s identified mineral resources, 2020 (last accessed 5 May 2021).
United States Department of Energy (National Energy Technology Laboratory). 2010. Carbon Dioxide Enhanced Oil Recovery Report. 31 pages (last accessed 5 May 2021).
Verma, M.K. 2015. Fundamentals of carbon dioxide‑enhanced oil recovery (CO2‑EOR)—A supporting document of the assessment methodology for hydrocarbon recovery using CO2‑EOR associated with carbon sequestration. U.S. Geological Survey Open‑File Report 2015–1071 (last accessed 5 May 2021).
Data download
Australia’s Energy Commodity Resources: 2018 and 2019 Data Tables.
1 At the time of publication, the proposed LNG import terminal at Crib Point (Victoria) had not attained environmental approvals.