

Key messages
- Oil is a liquid that forms when accumulations of organic matter are buried and exposed to increasing heat and pressure over geological time.
- Australia has limited identified conventional oil resources which are being depleted at a faster rate than they are being replaced by new discoveries. In 2021, Australia imported about 85 per cent of its oil requirements.
- Most of Australia’s oil is currently produced on the North West Shelf, some distance from domestic east coast refining capacity. In addition, the grades of domestically produced crude oil are generally not suited for local refineries compared to other internationally sourced oil.
- Australia’s domestic crude oil production continues to rapidly decline, and without new reserves, production will cease within the next 5 years.
Summary
Australia is a net importer of oil, with only around 15 per cent of refinery feedstock domestically produced in 2020–21. ‘Oil’ in this report refers to any hydrocarbon liquids, including conventional crude oil, condensate and liquefied petroleum gas (LPG), and unconventional resources including shale oil, oil shales, coal oil, tight oil and the natural gas liquid component of basin centred gas resources.
Oil resources are reported as best estimate of reserves (2P) and best estimate of contingent resources (2C) using the SPE-Petroleum Resources Management System. Reserves are commercially recoverable amounts of petroleum that remain in known accumulations, of which 2P reserves are the best estimate (the sum of Proved plus Probable Reserves).
Australia’s 2P reserves of conventional oil resources in 2021 are estimated as 8,564 petajoules (PJ; 1,490 million barrels [MMbbl]). In 2020–21 Australia produced 865 PJ (147 MMbbl) of crude oil, condensate and LPG, of which over 80 per cent was exported.
Contingent resources are potentially recoverable amounts of petroleum in known accumulations, of which 2C contingent resources are the best estimate. Contingent resources are not yet considered to be commercially recoverable due to one or more technical, commercial or other factors. Australia’s 2C contingent resources of conventional oil in 2021 are estimated as 12,718 PJ (2,202 MMbbl).
In 2021, around three quarters of all oil production was from fields in offshore north-western Australia. This included condensate resources produced from a few supergiant (>10 trillion cubic feet ‘Tcf’) and giant (>3 Tcf) gas fields in the offshore Northern Carnarvon Basin and the neighbouring Browse Basin. The remaining oil volumes were produced from fields in the Gippsland Basin (offshore SE-Australia) and the Cooper-Eromanga basins, in South Australia and Queensland.
Australia has significant undiscovered unconventional oil resources potential, including shale oil, tight oil, oil shale and basin centred natural gas liquids. Oil shale is the only unconventional oil resource that has been exploited to date. Currently, there is no commercial production of oil shale resources in Australia.
Australia's identified oil resources
Identified resources are those that have been discovered and their locations, quantity and quality are known from measurements or direct geological evidence. Identified oil resources, for the purposes of this report, are the equivalent of discovered 2P reserves and 2C contingent resources in the SPE-Petroleum Resources Management System.
The 2021 resource estimates compiled for this report are based on publicly available data for onshore areas aggregated with confidential offshore data submitted to the National Offshore Petroleum Titles Administrator (NOPTA). Offshore data are reported for the 2021 calendar year, while onshore data are based on government statistics and company estimates reported at various dates between June 2021 and June 2022. Data are aggregated for composite basin regions where necessary to de-identify confidential offshore field data in the custody of NOPTA.
The majority of the remaining identified offshore oil resources occur in basins from either north‑west or south‑east Australia. Onshore, the Cooper–Eromanga basin in South Australia and Queensland holds the greatest quantity of identified remaining conventional oil resources (Figure 1 and Figure 2; Table 1, Table 2 and Table 3).
Crude oil
Australia’s domestic supply of crude oil is limited, with estimated remaining 2P reserves of 1,416 PJ (241 MMbbl), and 3,130 PJ (532 MMbbl) of 2C contingent resources in 2021 (Table 1; Figure 1 and Figure 2). Aggregating Australia’s 2P reserves and 2C contingent resources gives a total of 4,546 PJ (773 MMbbl) of identified crude oil resources. Over 70 per cent of Australia’s remaining identified crude oil resources are in the Northern Carnarvon, Roebuck, Bonaparte and Browse basins. Nearly one quarter of Australia’s crude oil reserves are in the Cooper Basin, while approximately 14 per cent of remaining contingent resources are in the Gippsland Basin. Based on 2021 production rates of 258 PJ (44 MMbbl), Australia’s identified crude oil resources (2P reserves plus 2C contingent resources) would have a life of 18 years if all identified contingencies to development are resolved. However, remaining 2P reserves can only support 5 years of production at current extraction rates.
Condensate
Australia has significant remaining condensate resources, including 6,570 PJ (1,117 MMbbl) of 2P reserves and 9,011 PJ (1,533 MMbbl) of 2C contingent resources in 2021 (Table 2; Figure 1 and Figure 2). Aggregating Australia’s 2P reserves and 2C contingent resources gives a total of 15,581 PJ (2,650 MMbbl) of identified condensate resources. The majority of identified condensate resources are in supergiant and giant gas fields along the North West Shelf. Based on 2021 production rates of 432 PJ (74 MMbbl), Australia’s identified condensate resources (2P reserves plus 2C contingent resources) would have a life of 36 years if all identified contingencies to development are resolved, which includes 15 years of reserves life.
LPG
Australia’s LPG resources in 2021 are estimated to include 578 PJ (131 MMbbl) of 2P reserves and 577 PJ (137 MMbbl) of 2C contingent resources (Table 3). However, those estimates do not include any identified LPG resources for the Northern Carnarvon Basin due to the lack of reported LPG reserves or contingent resources for this basin area in the offshore NOPTA data. Aggregating Australia’s 2P reserves and 2C contingent resources gives a total of 1,155 PJ (268 MMbbl) of identified LPG resources. Based on 2021 production rates of 48 PJ (11 MMbbl), Australia’s identified LPG resources (2P reserves plus 2C contingent resources) would have a life of 24 years if all identified contingencies to development are resolved, which includes 12 years of reserves life.
Unconventional petroleum
Australia has significant potential for unconventional liquid petroleum resources hosted in oil shales, and shale oil and tight oil accumulations. Oil shale contains immature kerogen and requires mining and retorting to produce oil. Oil shale exploration has a long history, with sporadic small-scale production dating back to the 19th century (Dyni, 2006). Large volumes of contingent resources are contained in unconventional oil shale accumulations, estimated at 84,436 PJ (14,360 MMbbl; Table 5, Figure 3, Figure 4). Other contingent unconventional oil resources are currently limited to a small quantity (369 PJ, 63 MMbbl) of condensate and LPG associated with basin centred gas and tight gas accumulations in the Canning and Cooper/Eromanga Basins (Table 4).
Shale oil is liquid oil that can be extracted from shales using drilling and hydraulic fracturing. Coal oil is oil or condensate that is generated within coalbeds and then retained as a self-sourced reservoir system (USGS, 2016). Tight oil is hosted in low porosity and/or permeability reservoirs and also requires hydraulic stimulation for production. There are currently no identified contingent shale oil, coal oil or tight oil resources in Australia.
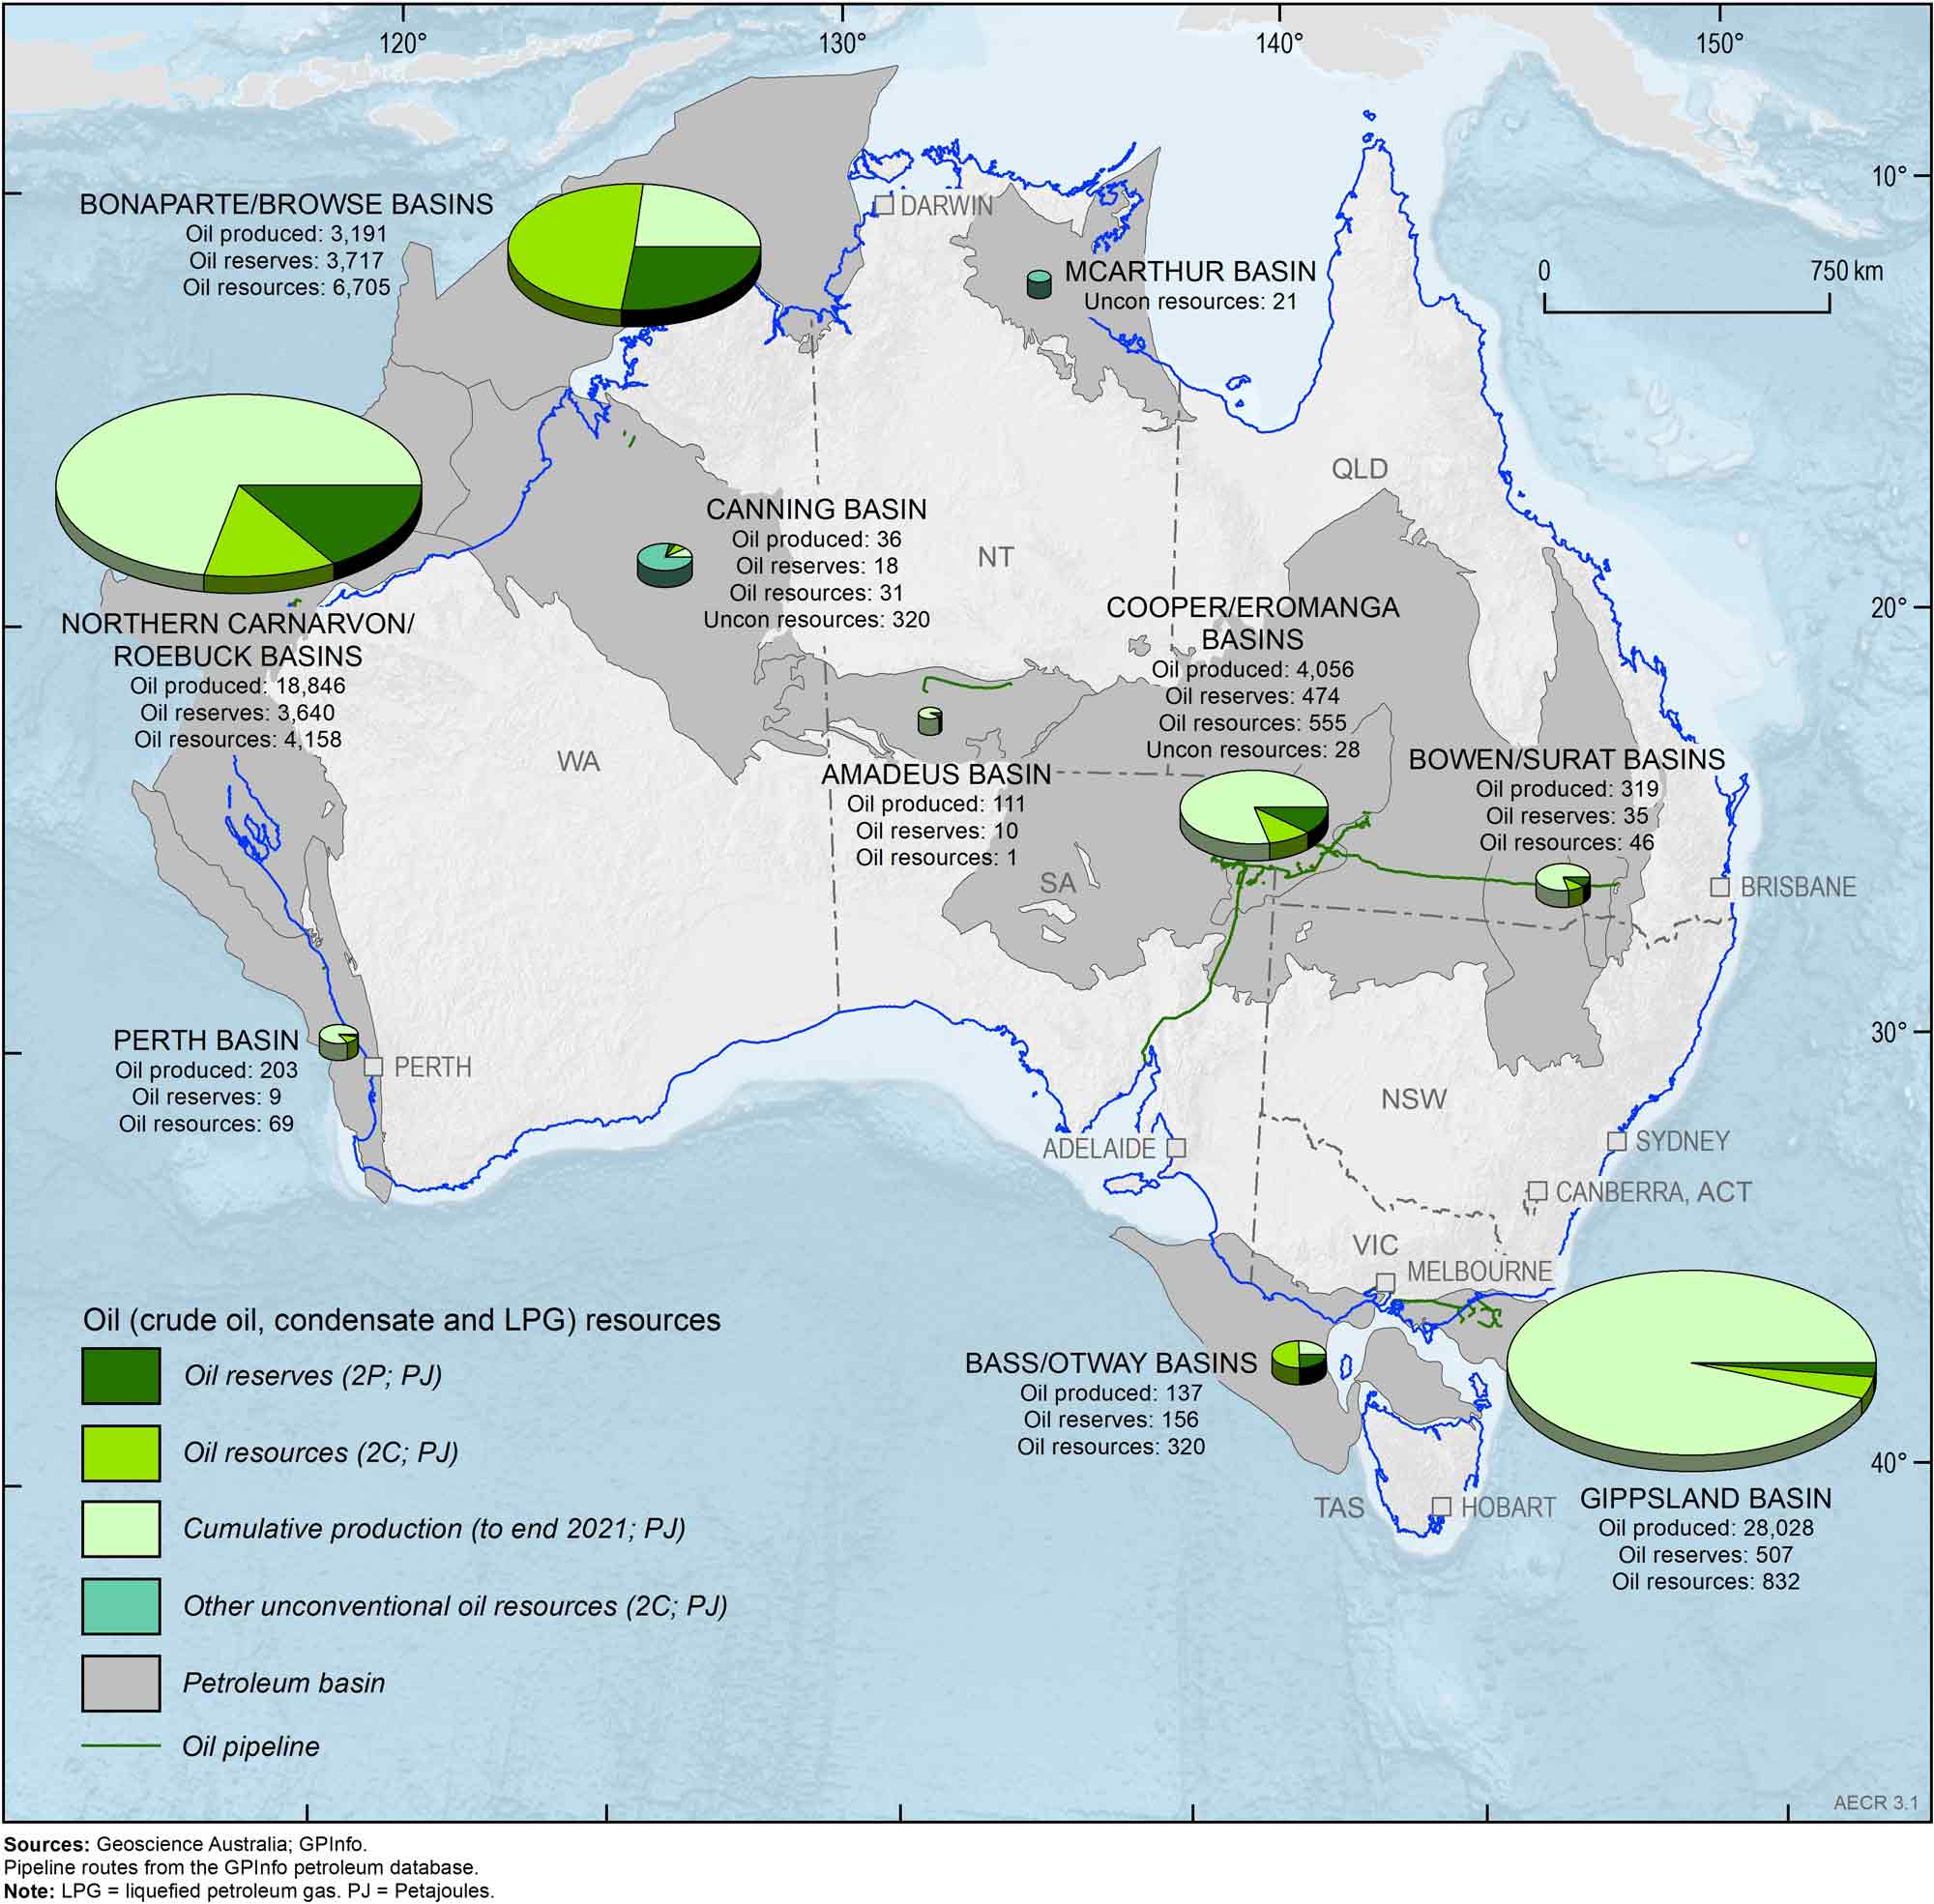
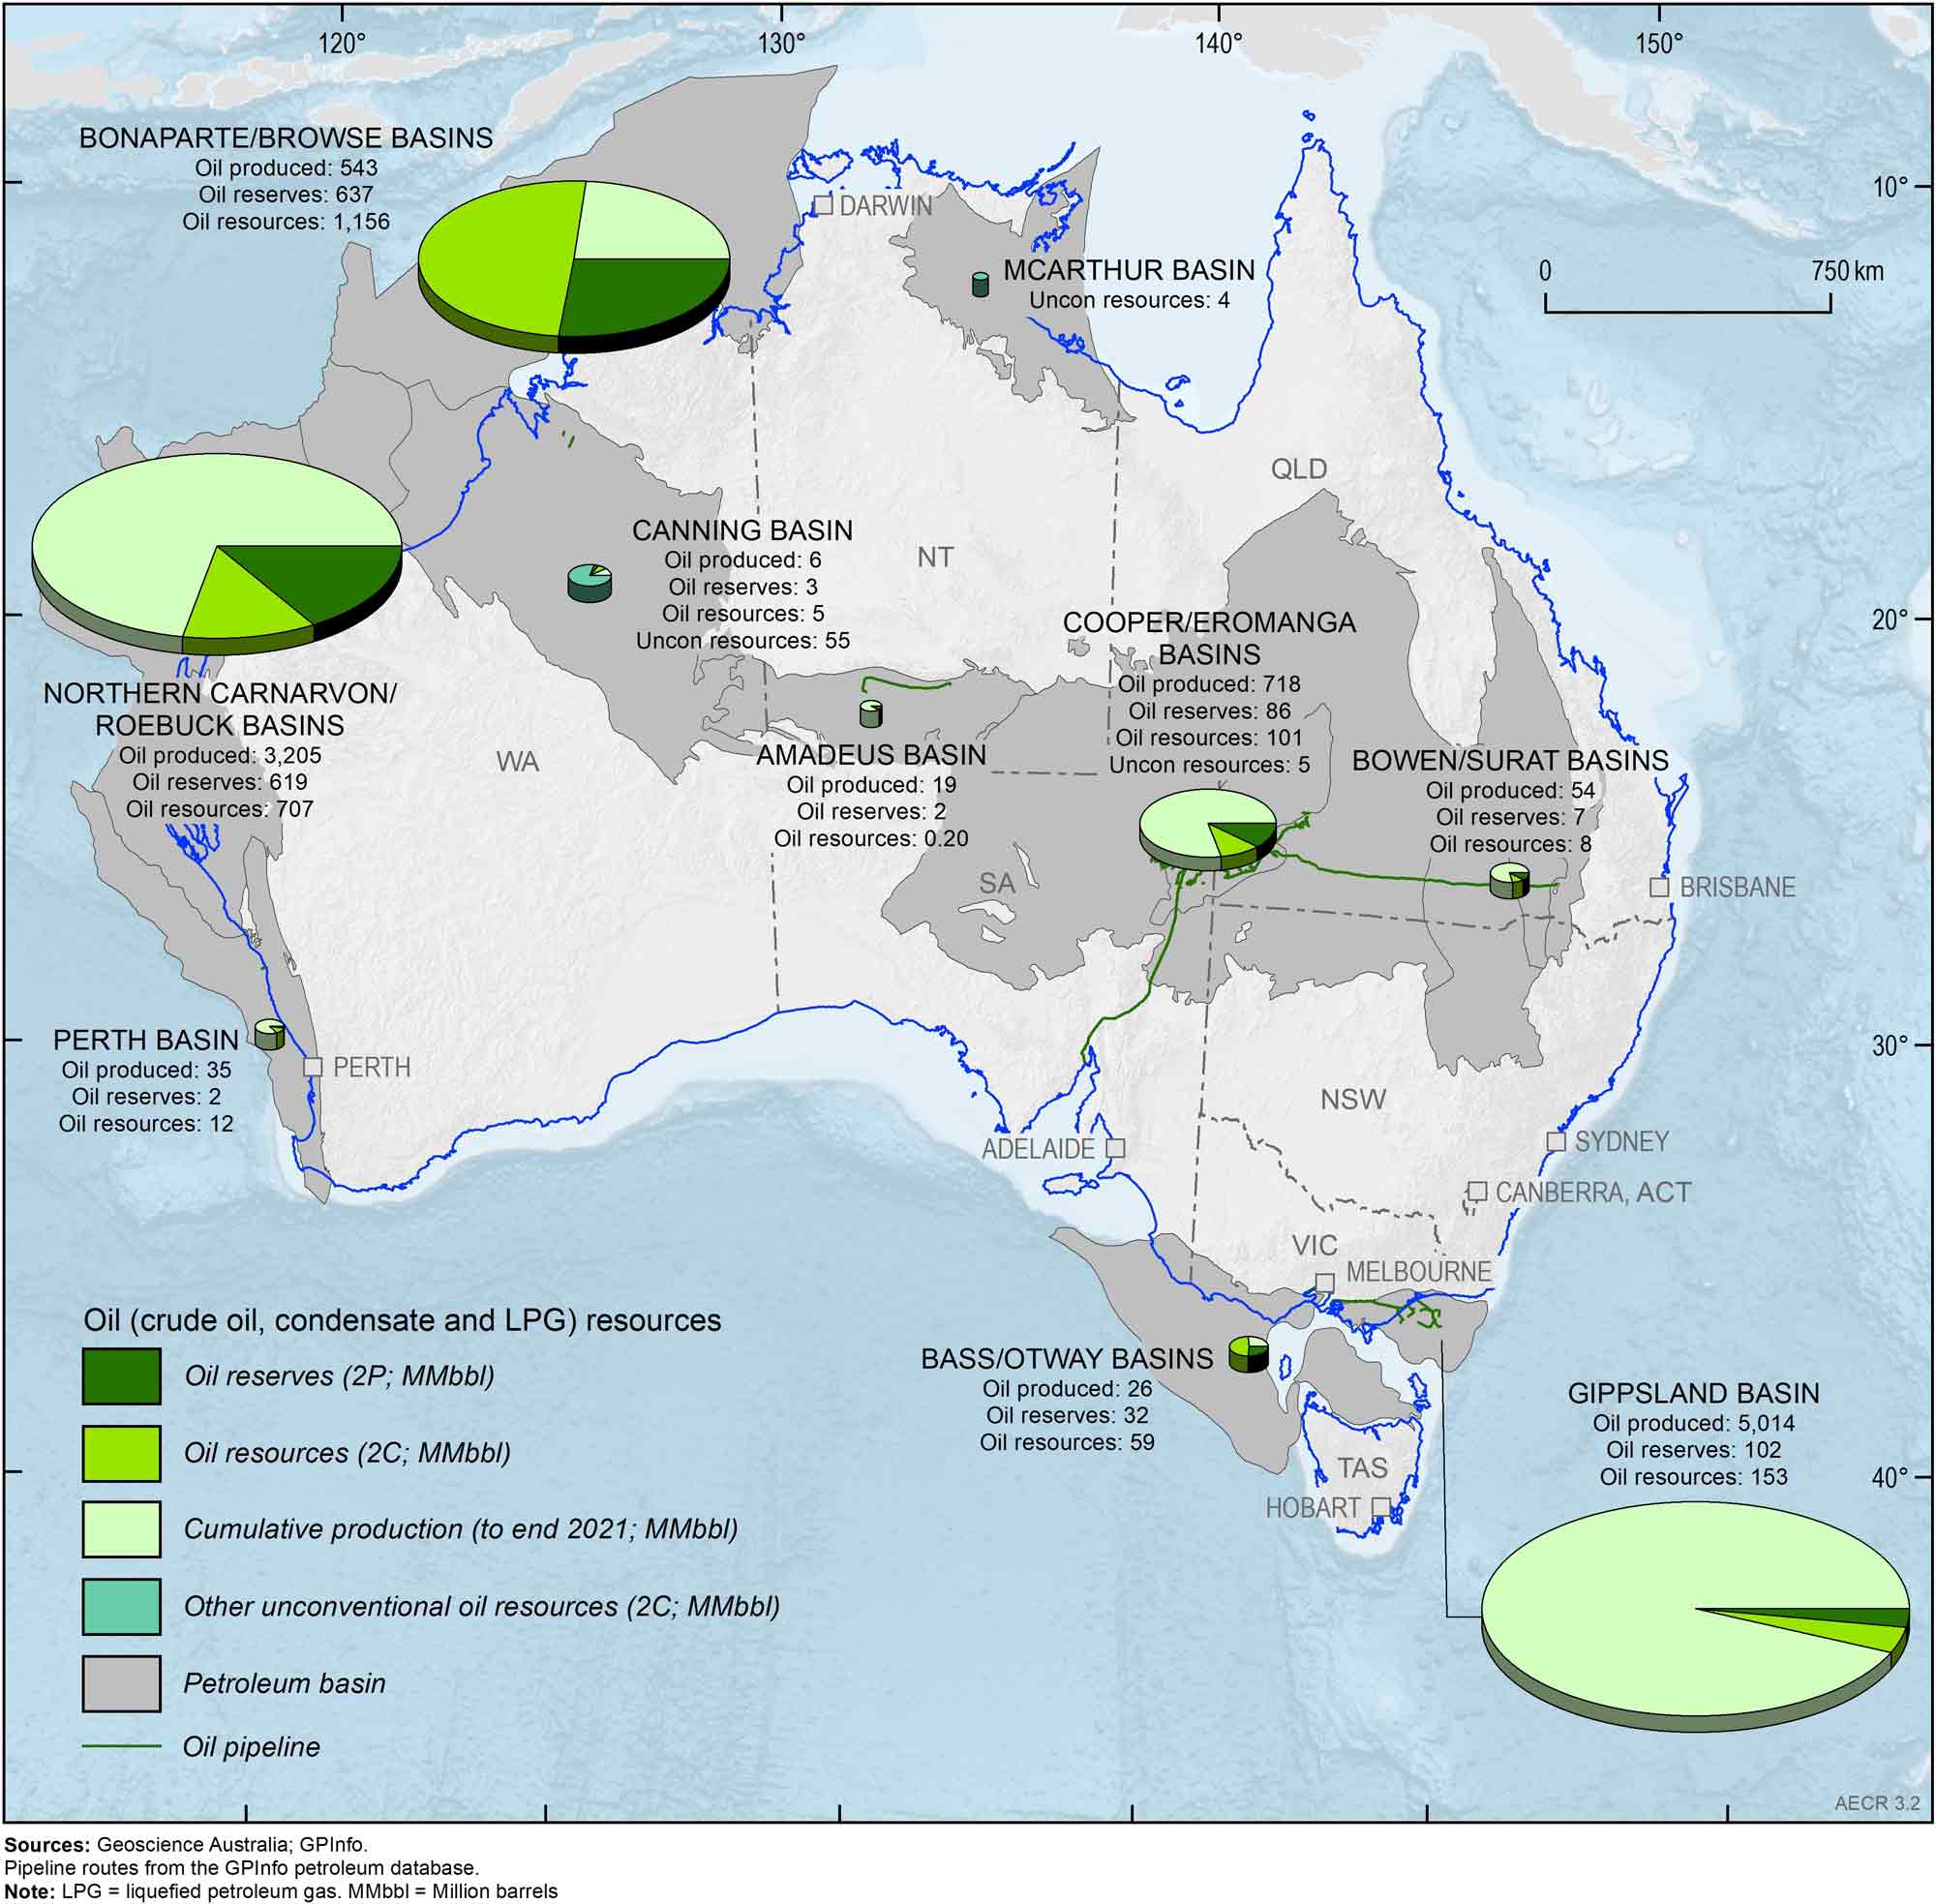
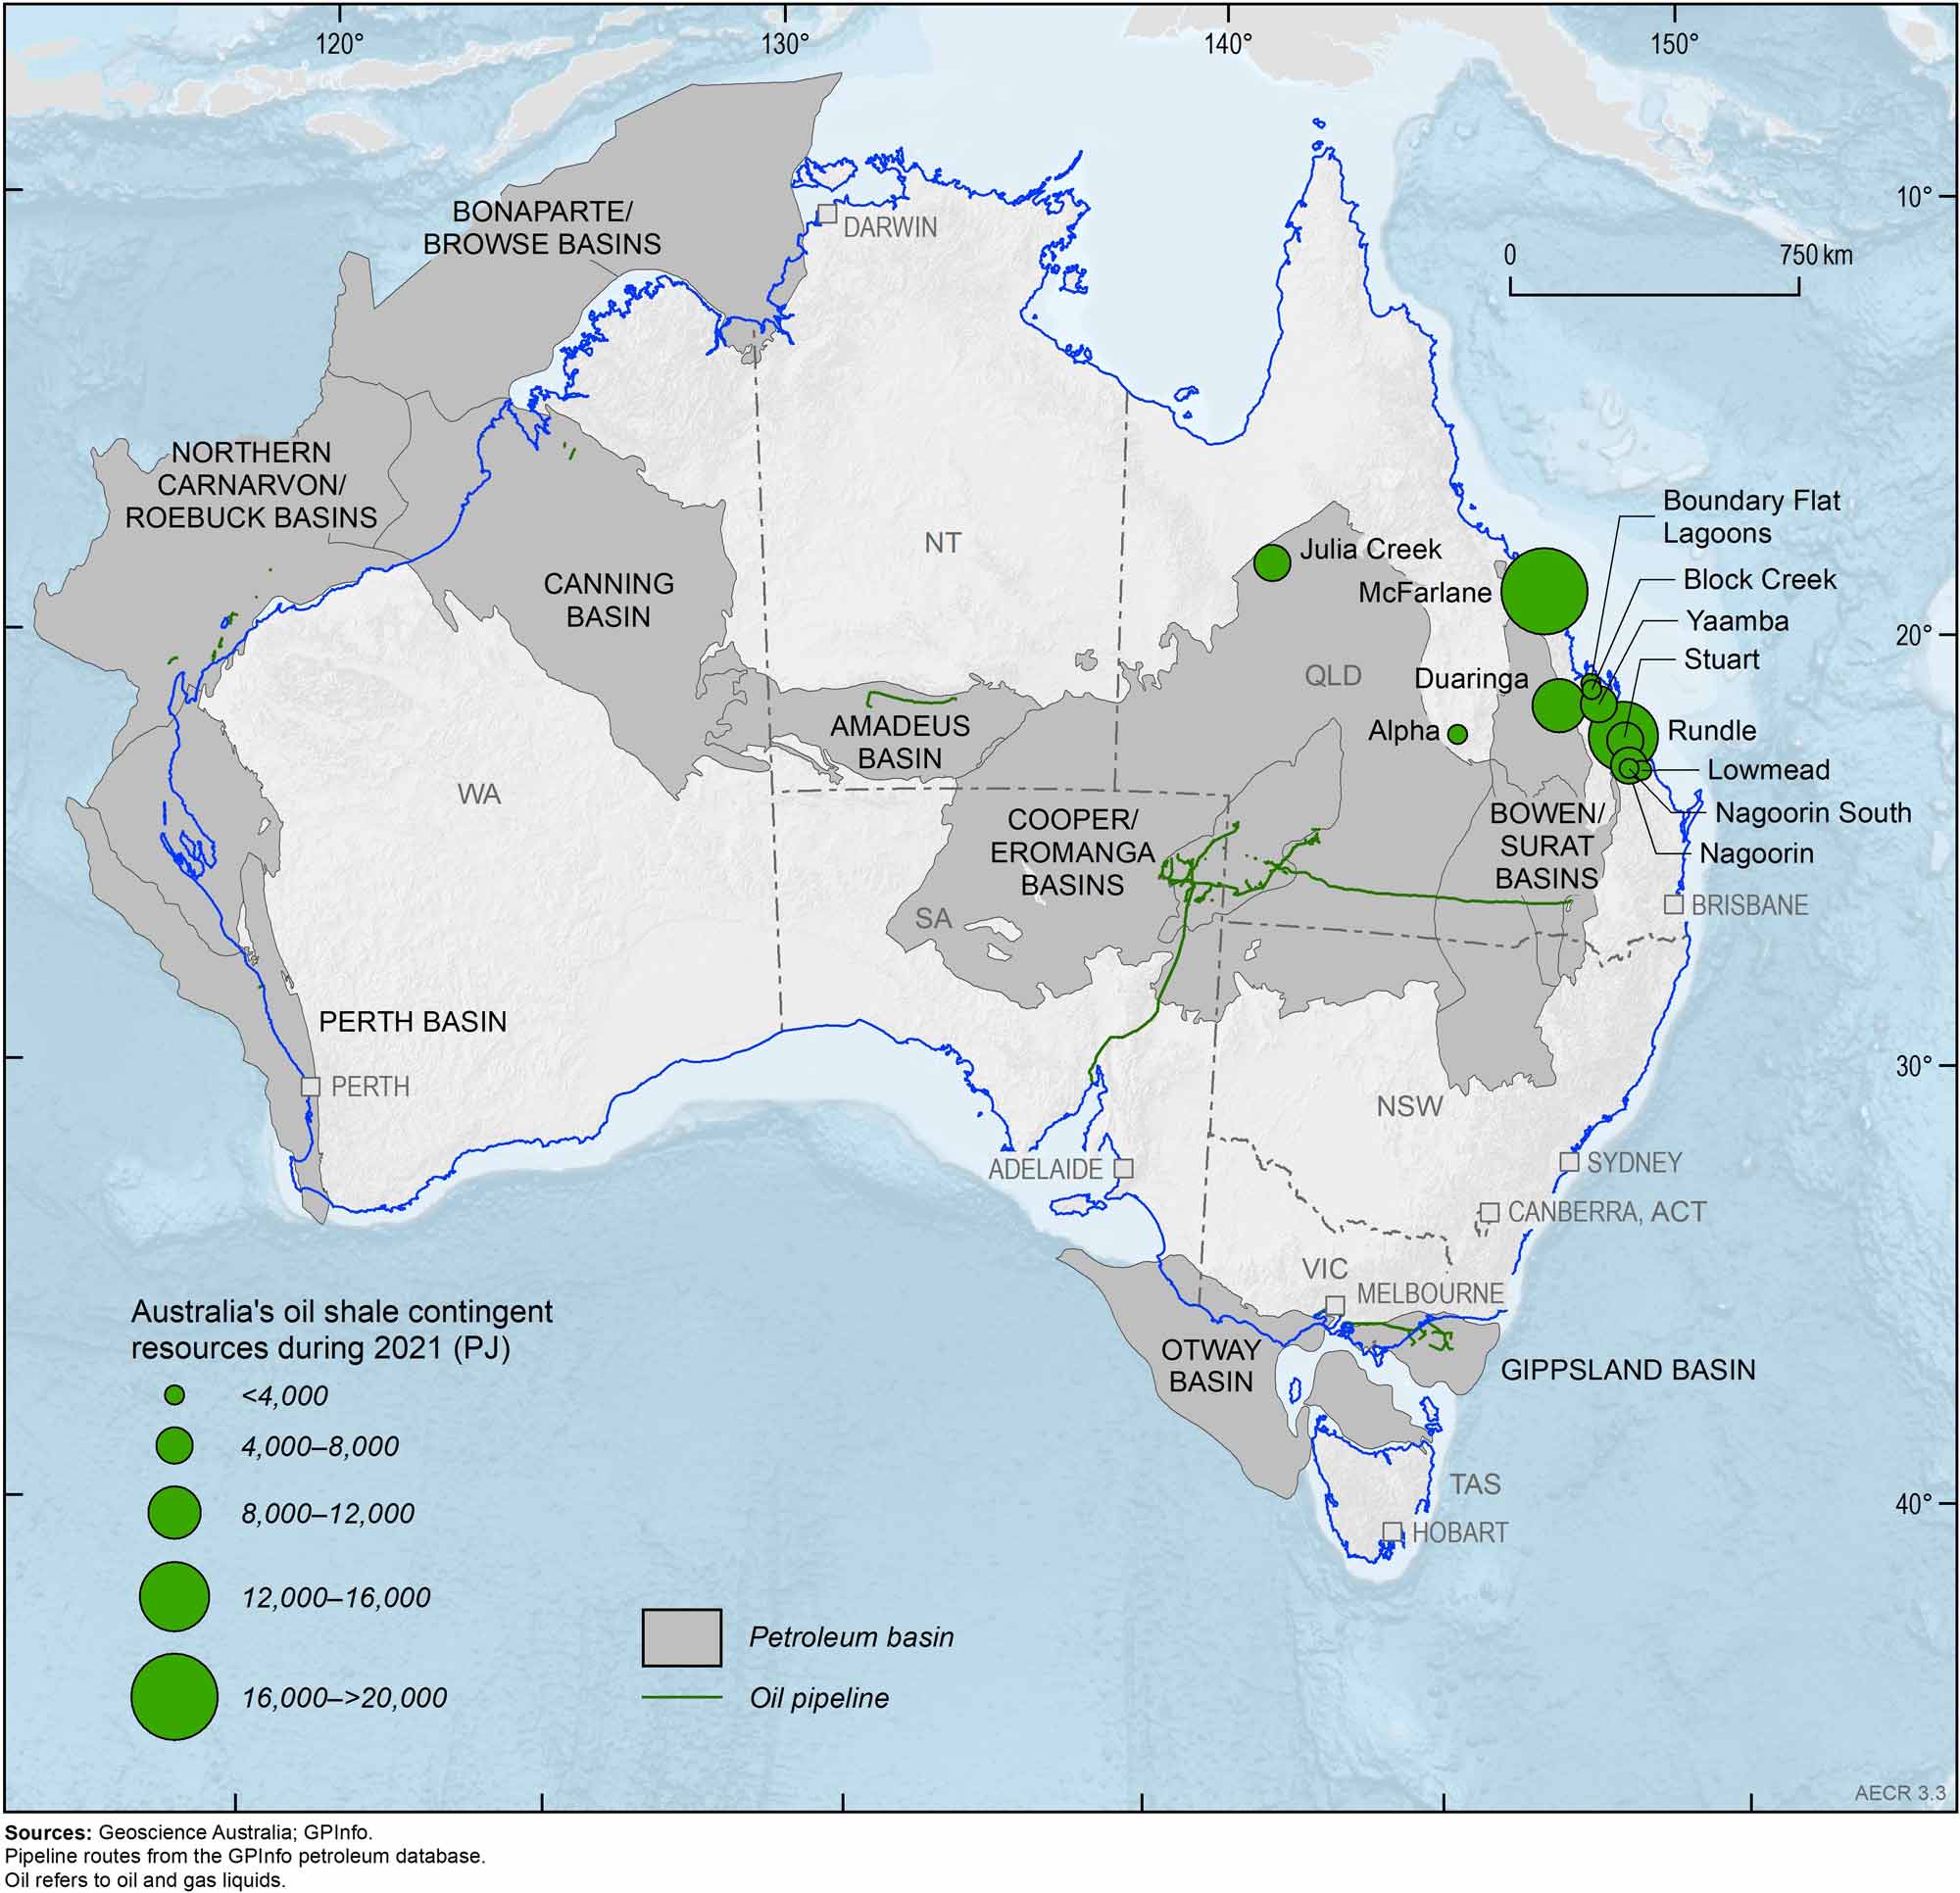
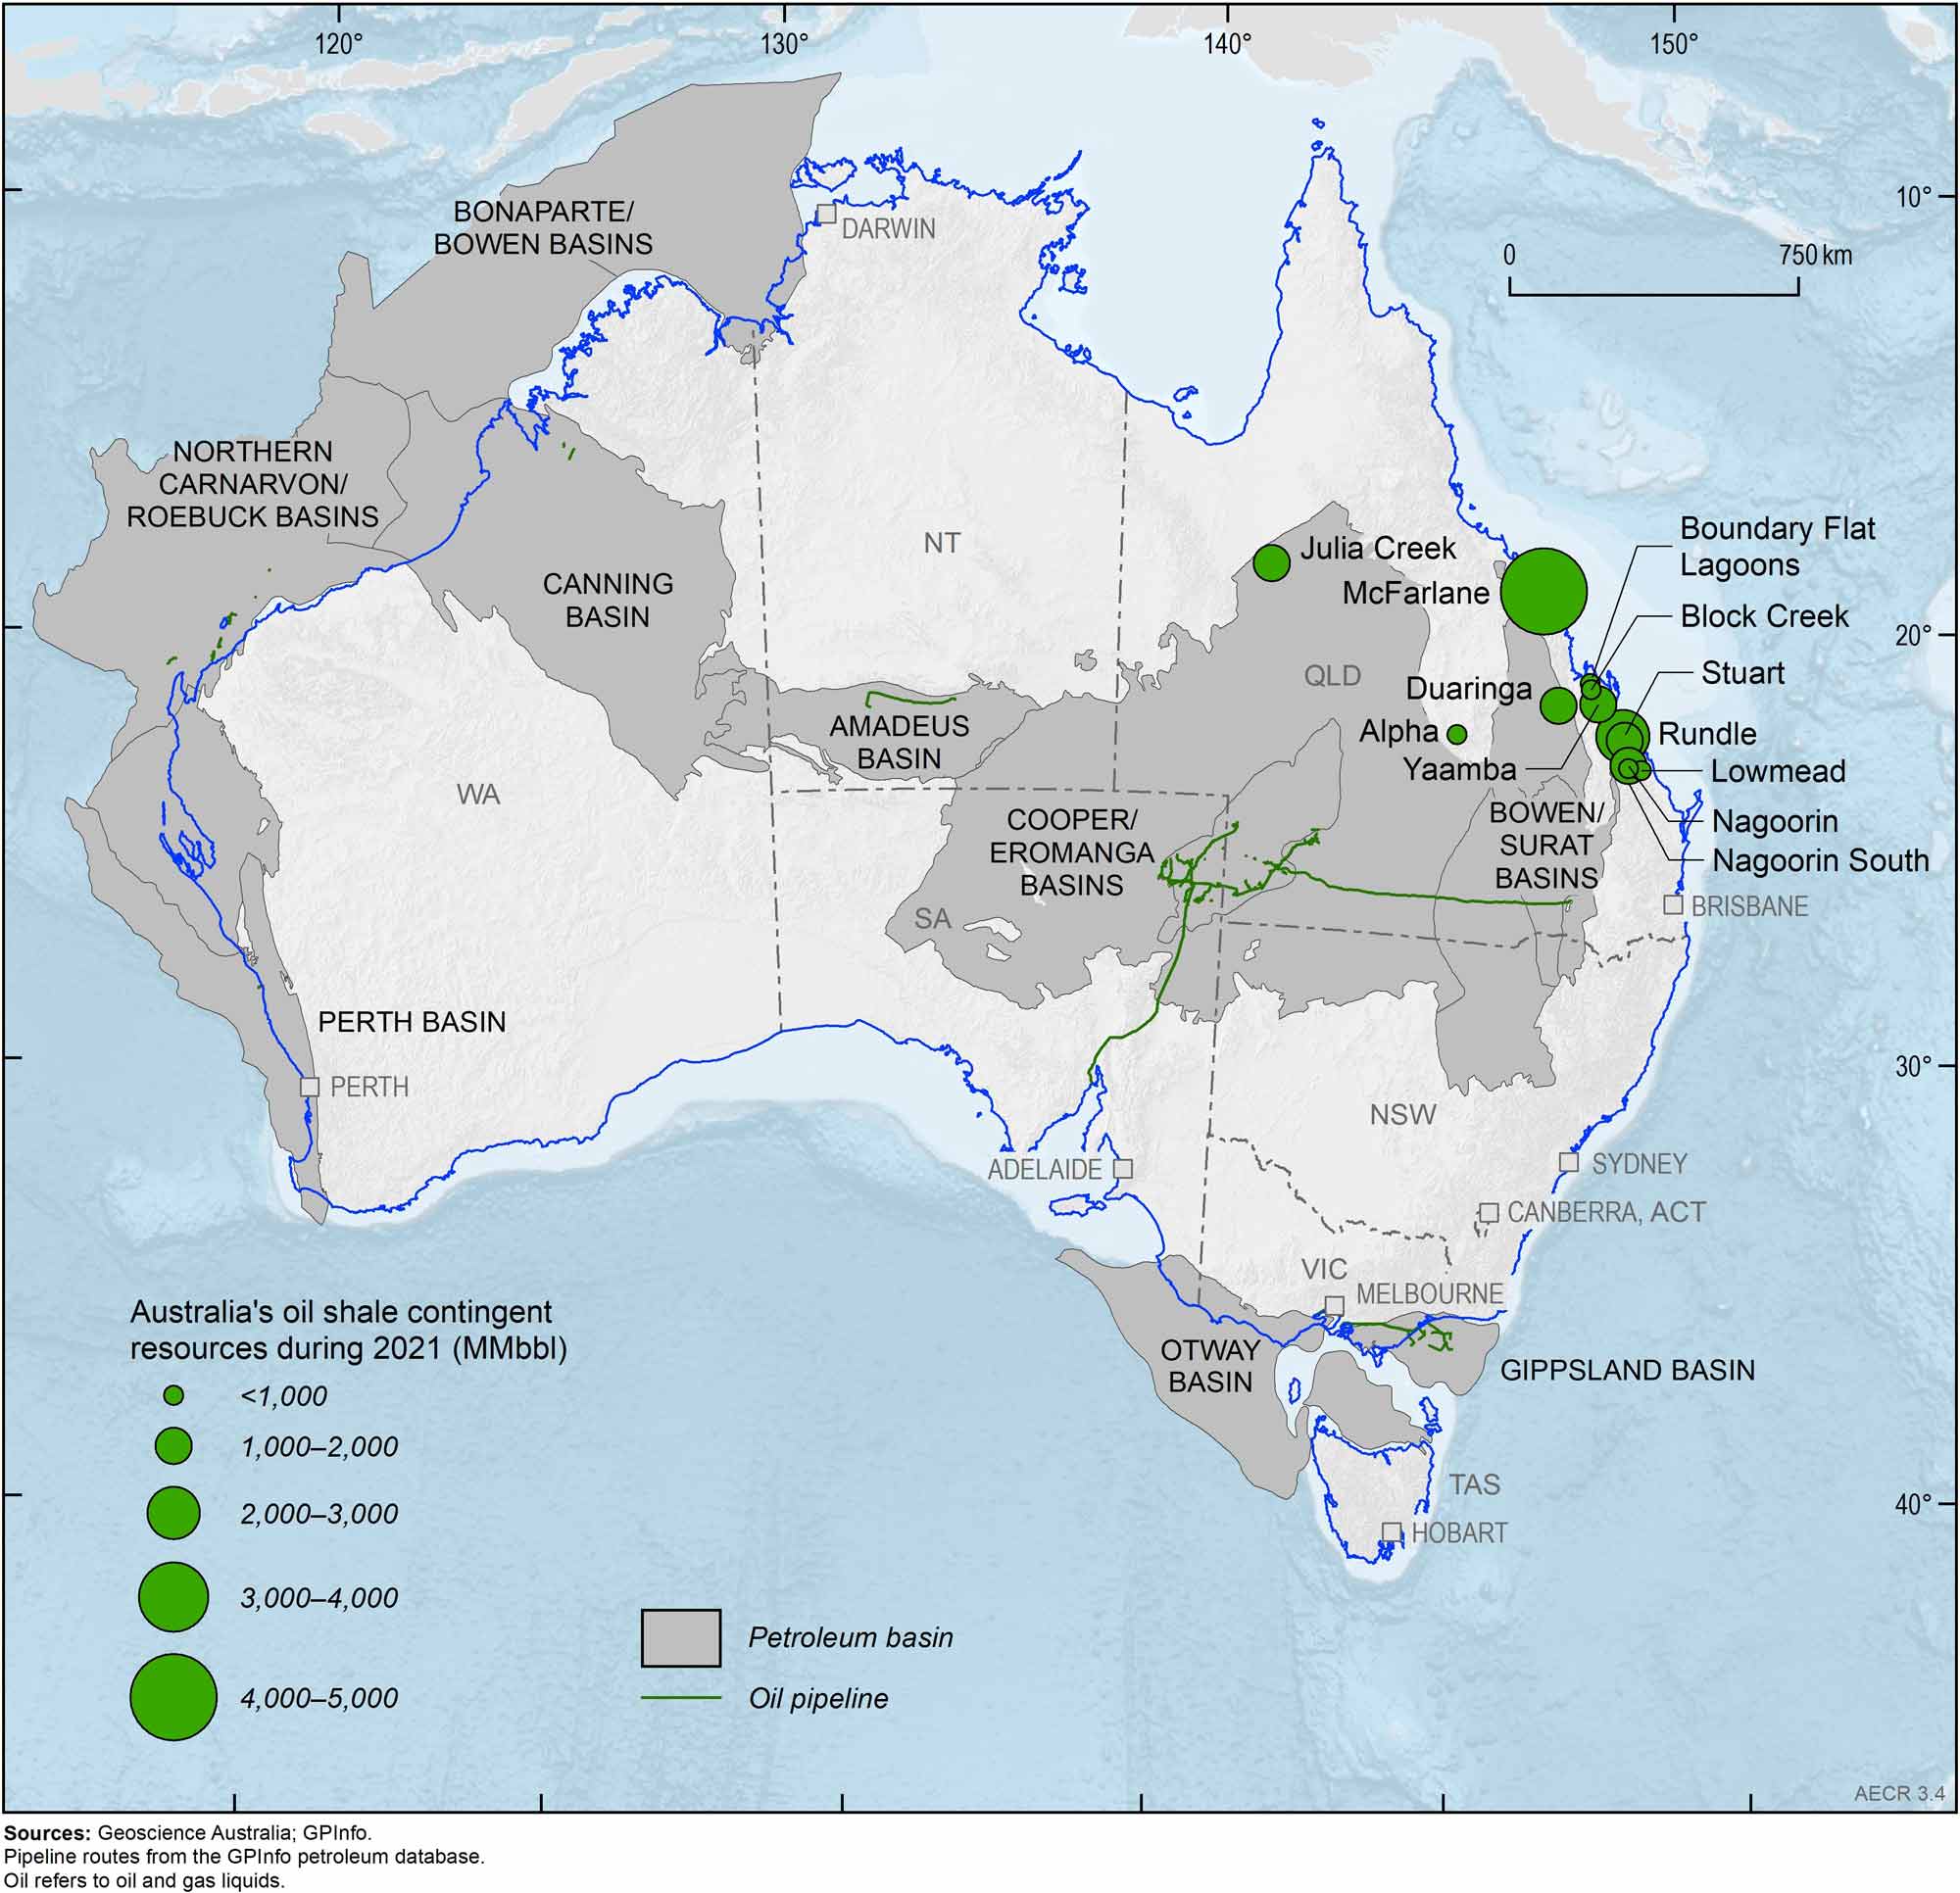
Table 1. Australia's remaining crude oil reserves (2P), contingent resources (2C) and annual production during 2021, and cumulative production to end 2021 (MMbbl)
| Basin | Crude oil (PJ) | Crude oil (MMbbl) | ||||||
|---|---|---|---|---|---|---|---|---|
| Annual Production | Cumulative production | Reserves (2P) | Resources (2C) | Annual Production | Cumulative production | Reserves (2P) | Resources (2C) | |
| Amadeus | 1 | 111 | 10 | 1 | 0 | 19 | 2 | 0 |
| Bass/Otway | 0 | 0 | 0 | 40 | 0 | 0 | 0 | 7 |
| Bonaparte/Browse | 16 | 2,699 | 156 | 384 | 3 | 459 | 27 | 65 |
| Bowen/Surat | 1 | 200 | 11 | 46 | 0 | 34 | 2 | 8 |
| Canning | 1 | 36 | 18 | 0 | 0 | 6 | 3 | 0 |
| Northern Carnarvon/Roebuck | 165 | 12,052 | 871 | 1,831 | 28 | 2,050 | 148 | 311 |
| Cooper/Eromanga | 50 | 2,416 | 321 | 334 | 9 | 411 | 55 | 57 |
| Gippsland | 23 | 22,683 | 24 | 432 | 4 | 3,858 | 4 | 73 |
| Perth | 2 | 197 | 6 | 61 | 0 | 33 | 1 | 10 |
| Total | 258 | 40,394 | 1,416 | 3,130 | 44 | 6,870 | 241 | 532 |
Notes: PJ= Petajoules. Data from the former Joint Petroleum Development Area (JPDA) have been omitted from Bonaparte Basin totals. Data sources: Offshore data provided by NOPTA to year-end 2021, except Browse-Bonaparte and Perth Basins- sourced from company reports; onshore data are sourced from government statistics and company estimates reported at various dates between December 2021 and June 2022.
Table 2. Australia's remaining condensate reserves (2P), contingent resources (2C) and annual production during 2021, and cumulative production to end 2021 (MMbbl)
| Basin | Condensate (PJ) | Condensate (MMbbl) | ||||||
|---|---|---|---|---|---|---|---|---|
| Annual Production | Cumulative production | Reserves (2P) | Resources (2C) | Annual Production | Cumulative production | Reserves (2P) | Resources (2C) | |
| Amadeus | 0 | 0 | 0 | 0 | 0 | 0 | 0 | 0 |
| Bass/Otway | 3 | 99 | 79 | 208 | 1 | 17 | 14 | 35 |
| Bonaparte/Browse | 174 | 492 | 3,392 | 6,095 | 30 | 84 | 577 | 1,037 |
| Bowen/Surat | 0 | 51 | 9 | 0 | 0 | 9 | 2 | 0 |
| Canning | 0 | 0 | 0 | 31 | 0 | 0 | 0 | 5 |
| Northern Carnarvon/Roebuck | 232 | 6,794 | 2,769 | 2,327 | 39 | 1,155 | 471 | 396 |
| Cooper/Eromanga | 11 | 727 | 76 | 118 | 2 | 124 | 13 | 20 |
| Gippsland | 13 | 1,676 | 241 | 225 | 2 | 285 | 41 | 38 |
| Perth | 0 | 6 | 3 | 8 | 0 | 1 | 1 | 1 |
| Total | 432 | 9,845 | 6,570 | 9,011 | 74 | 1,674 | 1,117 | 1,533 |
Notes: PJ= Petajoules. Data from the former Joint Petroleum Development Area (JPDA) have been omitted from Bonaparte Basin totals. Data sources: Offshore data provided by NOPTA to year-end 2021, except Browse-Bonaparte and Perth Basins- sourced from company reports; onshore data are sourced from government statistics and company estimates reported at various dates between December 2021 and June 2022.
Table 3. Australia's remaining LPG reserves (2P), contingent resources (2C) and annual production during 2021, and cumulative production to end 2021 (MMbbl)
| Basin | LPG (PJ) | LPG (MMbbl) | ||||||
|---|---|---|---|---|---|---|---|---|
| Annual Production | Cumulative production | Reserves (2P) | Resources (2C) | Annual Production | Cumulative production | Reserves (2P) | Resources (2C) | |
| Amadeus | 0 | 0 | 0 | 0 | 0 | 0 | 0 | 0 |
| Bass/Otway | 1 | 37 | 76 | 72 | 0 | 9 | 18 | 17 |
| Bonaparte/Browse | 0 | 0 | 168 | 226 | 0 | 0 | 34 | 54 |
| Bowen/Surat | 0 | 69 | 15 | 0 | 0 | 12 | 4 | 0 |
| Canning | 0 | 0 | 0 | 0 | 0 | 0 | 0 | 0 |
| Northern Carnarvon/Roebuck | 0 | 0 | 0 | 0 | 0 | 0 | 0 | 0 |
| Cooper/Eromanga | 13 | 913 | 77 | 103 | 3 | 184 | 18 | 24 |
| Gippsland | 34 | 3,669 | 242 | 175 | 8 | 871 | 57 | 42 |
| Perth | 0 | 0 | 0 | 0 | 0 | 0 | 0 | 0 |
| Total | 48 | 4,688 | 578 | 577 | 11 | 1,076 | 131 | 137 |
Notes: PJ= Petajoules. Data from the former Joint Petroleum Development Area (JPDA) have been omitted from Bonaparte Basin totals. Data sources: Offshore data provided by NOPTA to year-end 2021, except Browse-Bonaparte and Perth Basins- sourced from company reports; onshore data are sourced from government statistics and company estimates reported at various dates between December 2021 and June 2022.
Table 4. Australia's unconventional contingent oil resources (2C) during 2021
| Basin / deposit | Type | Oil | Condensate | LPG | Oil | Condensate | LPG | Data Source |
|---|---|---|---|---|---|---|---|---|
| 2C Resources (PJ) | 2C Resources (PJ) | 2C Resources (PJ) | 2C Resources (MMbbl) | 2C Resources (MMbbl) | 2C Resources (MMbbl) | |||
| Beetaloo Sub-basin | Shale Gas | 0 | 21 | 0 | 0 | 4 | 0 | Empire Energy (2022); Tamboran Resources (2022) |
| Canning | Basin centred gas; tight gas | 0 | 320 | 0 | 0 | 55 | 0 | Buru Energy (2018); Black Mountain (2022) |
| Cooper/Eromanga | Undifferentiated | 0 | 18 | 10 | 0 | 3 | 2 | Beach Energy (2022) |
| Total | 0 | 359 | 10 | 0 | 61 | 2 |
Notes: PJ = Petajoules; MMbbl = Million barrels
Table 5. Australia's oil shale contingent resources (2C) during 2021
| Basin / deposit | Type | Oil | Data Source | |
|---|---|---|---|---|
| 2C Resources (PJ) | 2C Resources (MMbbl) | |||
| Alpha deposit | Oil Shale | 58 | 10 | Geoscience Australia (AERA 2018) |
| Block Creek deposit | Oil Shale | 1,355 | 230 | Geoscience Australia (AERA 2018) |
| Boundary Flat Lagoons deposit | Oil Shale | 1,535 | 261 | Geoscience Australia (AERA 2018) |
| Duaringa deposit | Oil Shale | 8,485 | 1,443 | Geoscience Australia (AERA 2018) |
| Julia Creek deposits (aggregated) | Oil Shale | 6,023 | 1,024 | Geoscience Australia (AERA 2018) |
| Lowmead deposit | Oil Shale | 1,253 | 213 | Geoscience Australia (AERA 2018) |
| McFarlane deposit | Oil Shale | 28,745 | 4,889 | Geoscience Australia (AERA 2018) |
| Nagoorin deposit | Oil Shale | 6,305 | 1,072 | Geoscience Australia (AERA 2018) |
| Nagoorin South deposit | Oil Shale | 415 | 71 | Geoscience Australia (AERA 2018) |
| Rundle deposit | Oil Shale | 15,533 | 2,642 | Geoscience Australia (AERA 2018) |
| Stuart deposit | Oil Shale | 7,711 | 1,311 | Geoscience Australia (AERA 2018) |
| Yaamba deposit | Oil Shale | 7,018 | 1,194 | Geoscience Australia (AERA 2018) |
| Total | 84,436 | 14,360 | ||
Notes: PJ = Petajoules; MMbbl = Million barrels
Australia's prospective oil resources
Undiscovered resources can be assessed and classified using the SPE-Petroleum Resources Management System (PRMS). These are defined as Prospective Resources as they estimate potentially recoverable quantities of hydrocarbons from undiscovered accumulations, referred to as prospects, assuming that a discovery is made and developed. Individual prospects are defined by a range of possible resource outcomes and also carry both a geological risk of discovering oil and gas, as well as a risk of developing any resources in the event of a discovery. Estimating prospective resources at a prospect level is therefore subject to a range of uncertainty of the potentially recoverable quantities of hydrocarbons. The PRMS provides requirements for determining low, best and high case estimates of prospective resources. However, the methodologies used to assess prospective resources varies across basins, reservoir types, trap types and available sources of data. As such, each reporting entity has the flexibility to calculate resource estimates based on internal best practices.
Prospective resource estimates therefore need to be evaluated in the context of the assessment areas for which they have been generated, the resource type assessed (conventional or unconventional), the assumptions and methodologies used in the assessments, and with an understanding of the risk associated with these resources being realised. For example, the Kanga prospect in WA-412-P (Northern Carnarvon Basin) had gross mean recoverable resource estimates of 170 MMbbl of oil with a 36 per cent chance of success prior to drilling (Finder Energy, 2022a). However, after the drilling of the Kanga-1 well in May 2022, it was subsequently found to contain no commercial hydrocarbons (Finder Energy, 2022b). The implications of such ‘well failures’ for related exploration targets and prospective resource estimates need to be subsequently evaluated through post-drill analysis to determine if the failure occurred due to local prospect factors such as trap integrity, or more regional factors such as lack of hydrocarbon charge.
Due to their risk and uncertain nature, only a limited set of prospective resource estimates are published each year by petroleum exploration companies and other reporting entities. Consequently, it is not possible to provide an accurate aggregation of all prospective oil resources in Australia using published prospective resource estimates. A bibliography of all published prospective resource estimates for the 2021 reporting year accessed by Geoscience Australia is provided at the end of this chapter to assist accessing available prospective resource data in each hydrocarbon-bearing basin.
Production
Australia’s oil production in 2021 totalled 738 PJ (129 MMbbl; Table 6). Nearly two-thirds of Australia’s extracted oil in 2021 was condensate and LPG resources associated with producing gas fields.
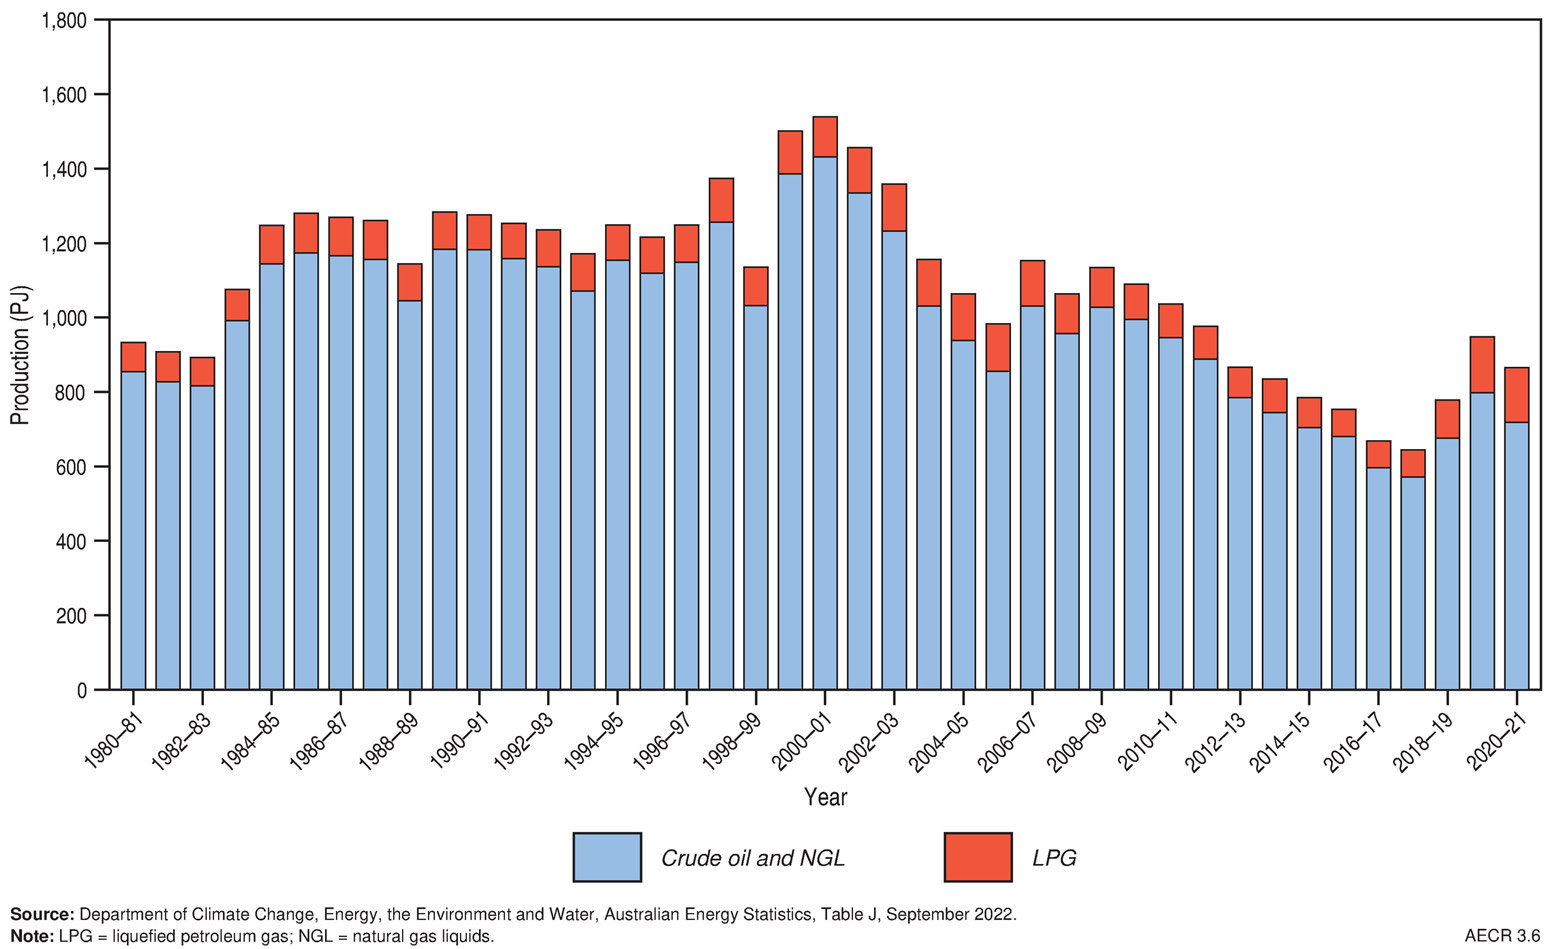
Trends in oil production are captured by the Australian Government’s energy production statistics in Australian Energy Statistics (Department of Climate Change, Energy, the Environment and Water, 2022). Between 2008–09 and 2017–18, the combined production of crude oil and condensate in Australia showed a trend of long-term decline (Figure 5; Department of the Environment and Energy, 2019). This decline reversed between 2018–19 and 2019–20 following the start-up of the Greater Enfield, Ichthys and Prelude projects on the North West Shelf. However, crude oil and condensate production declined again by 10 per cent in 2020–21 (Figure 5; Department of Climate Change, Energy, the Environment and Water, 2022). The decrease in condensate production in 2020–21 was primarily the result of gas production facility outages at the Prelude and Gorgon LNG plants reducing condensate and LPG output, while reductions in crude oil output are attributed to the natural decline in production and reserves from ageing oil fields (Department of Climate Change, Energy, the Environment and Water, 2022). LPG production declined by 9 per cent to 147 PJ in 2020–21 in association with the reduced output of condensate from the Prelude and Gorgon LNG projects.
Table 6. Key statistics for crude oil, condensate and LPG
| Unit | Australia 2021 | OECD 2021 | World 2021 | |
|---|---|---|---|---|
| Resources | ||||
| Proved reserves (at end of year) | PJ | na | 1,599,000b | 10,654,260b |
| Bbbl | na | 260.0b | 1,732.4b | |
| Proved plus Probable reserves (at end of year) | PJ | 8,564a | na | na |
| Bbbl | 1.5a | na | na | |
| of which: crude oil | Bbbl | 0.2a | na | na |
| of which: condensate | Bbbl | 1.1a | na | na |
| of which: LPG | Bbbl | 0.1a | na | na |
| Production | ||||
| Annual production | PJ | 738a | 63,763b | 201,751b |
| MMbbl | 129a | 10,368b | 32,805b | |
| of which: crude oil | MMbbl | 44a | na | na |
| of which: condensate | MMbbl | 74a | na | na |
| of which: LPG | MMbbl | 11a | 2,438b | 4,397b |
| CAGR from 2011 | % | –1.0b | 3.8b | 0.7b |
| Share of world oil production | % | 0.5b | 31.6b | 100b |
| World ranking | no. | 30b | na | na |
| Exports | ||||
| Oil | PJ | 593c | na | 92,443b |
| Oil export value | A$b | 7.4c | na | na |
| Petroleum products | PJ | 167d | na | 55,011b |
| Petroleum products export value | A$b | 3.5c | na | na |
| Imports | ||||
| Oil | PJ | 547d | na | 92,443b |
| Oil import value | A$b | 6.6c | na | na |
| Petroleum products | PJ | 1,347d | na | 55,011b |
| Petroleum products import value | A$b | 19.0c | na | na |
BP oil reserves data are proved reserves while Geoscience Australia data are Proved and Probable (2P) reserves. BP are undertaking process improvements in their Statistical Review of World Energy, and have only been able to publish 2020 world reserve data in their 2022 report. As a result the world reserve data in Table 6 are current as of 2020, whilst world production data are current as of 2021. Reserves and production include condensate, natural gas liquids (NGLs) as well as crude oil. Oil exports and imports include crude oil and condensate. Petroleum products include refined products, LPG and bunker fuel. BP data and Geoscience data are as at the end of 2021. Department of Industry, Science and Resources data (2022) are from the 2020-21 financial year. OECD = Organisation for Economic Co-operation and Development countries. na = not available. LPG = liquefied petroleum gas. CAGR = compound annual growth rate. MMbbl = million barrels. PJ = petajoules. A$b = billion Australian dollars. Source: aGeoscience Australia; bBP (2022) BP Statistical Review of World Energy; cDepartment of Industry, Science and Resources (2023) Resources and Energy Quarterly, March 2023 (Tables 1, 2 and 4); dDepartment of Climate Change, Energy, the Environment and Water (2022) Australian Energy Statistics (Table A2);
Trade
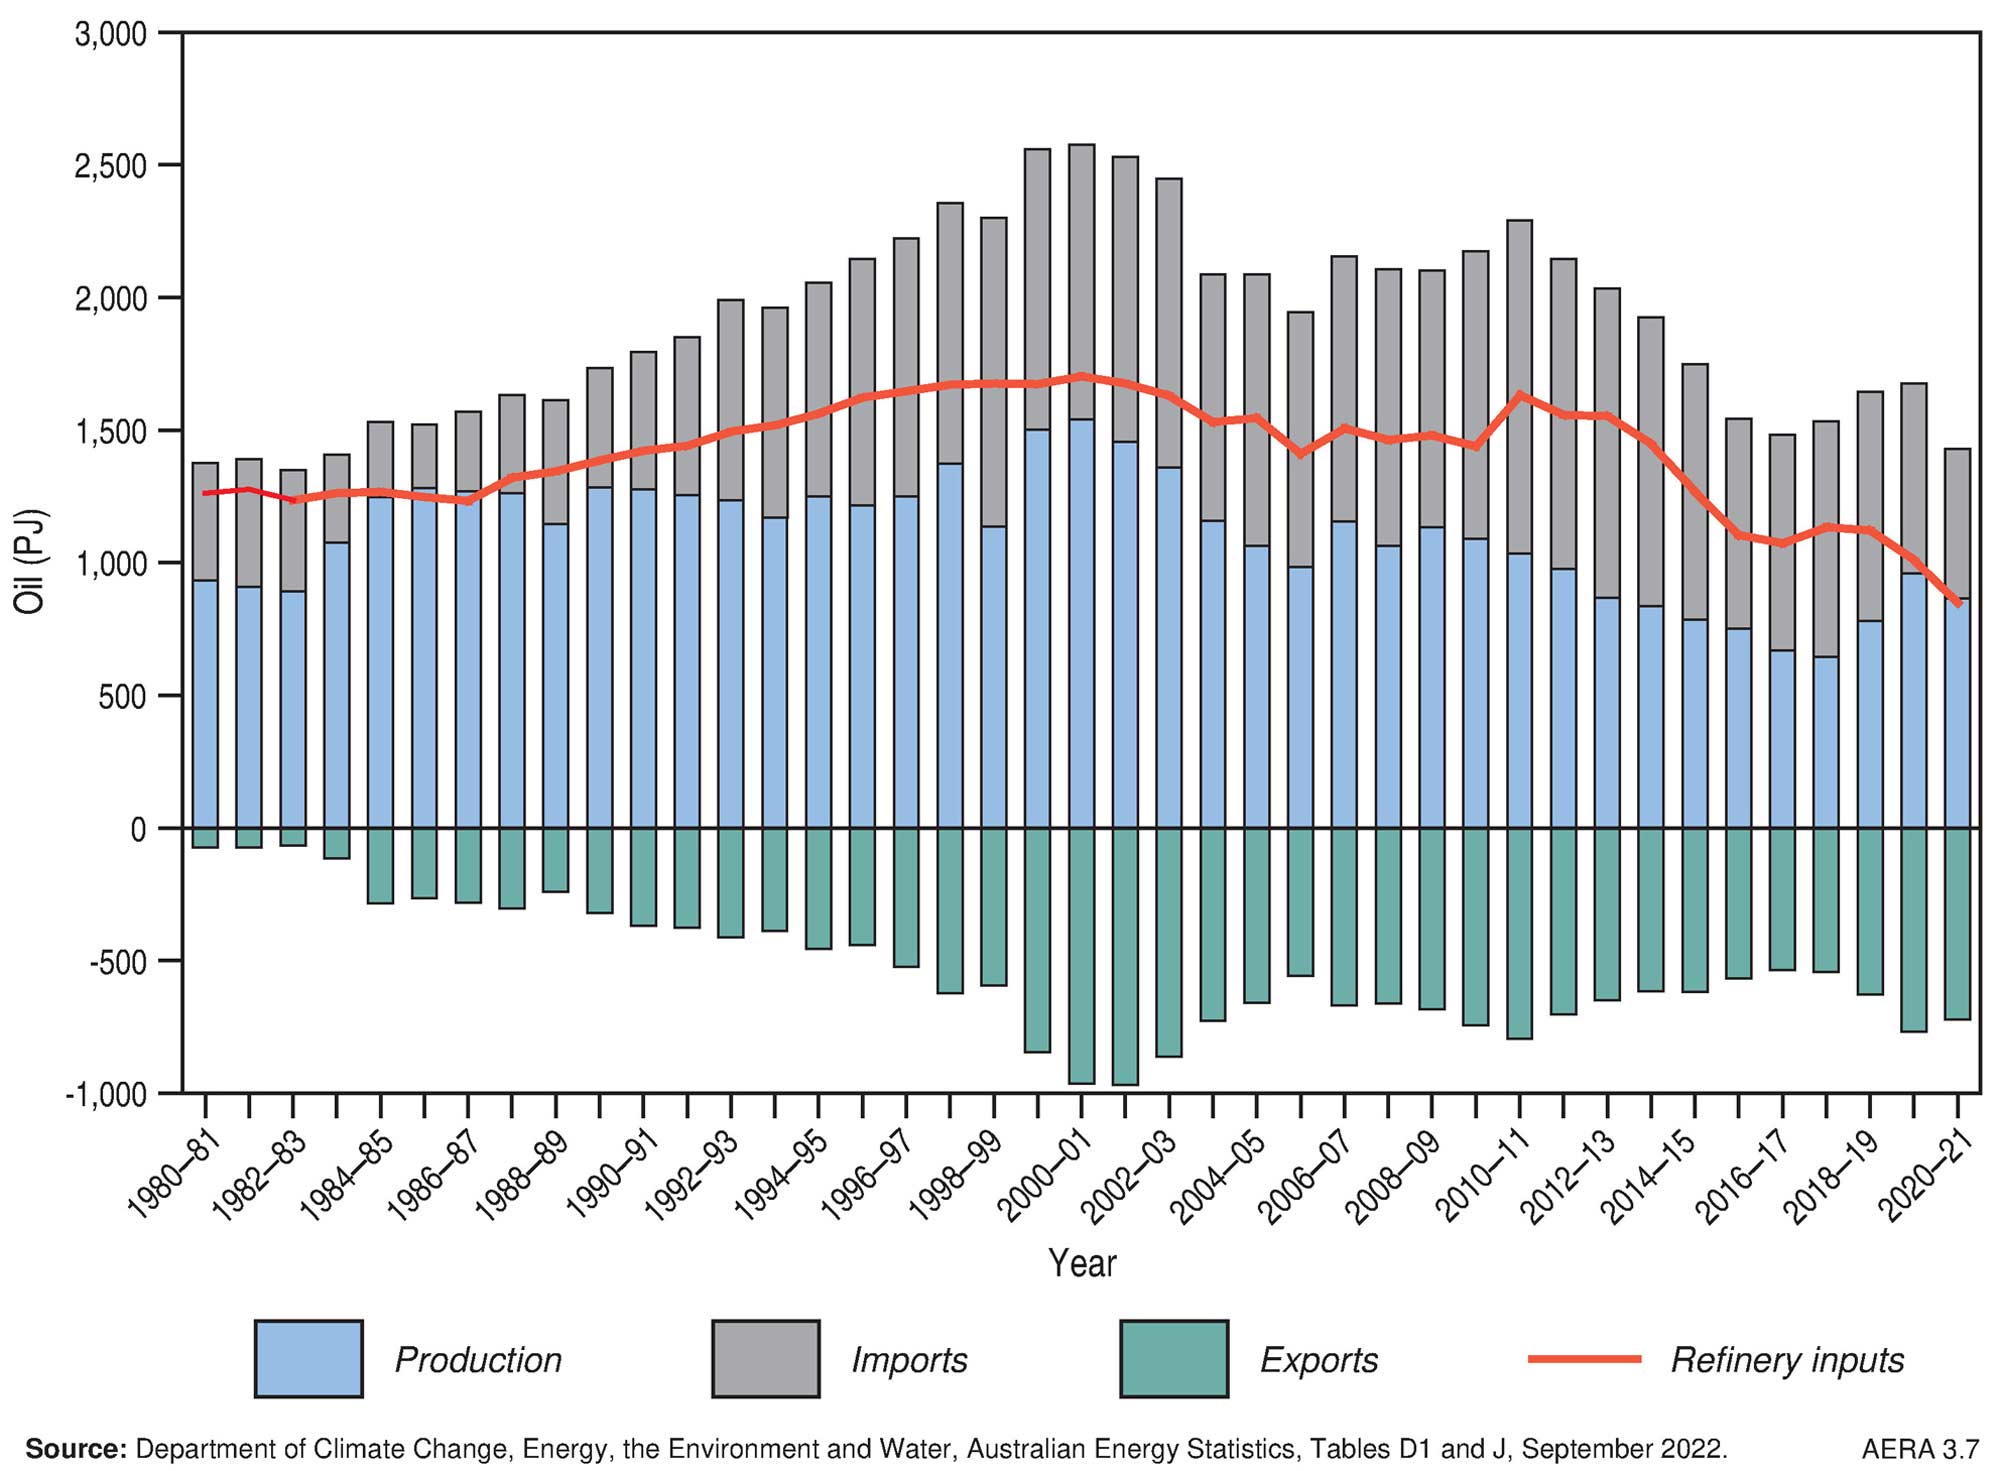
Since the mid-1980's Australia has been a net importer of refined oil products, as well as crude oil and other refinery feedstocks (Figure 6). However, Australia also exports a major share of its crude oil production, predominantly from Western Australia (Figure 6). Australia’s crude oil and condensate exports decreased by 5 per cent in 2020–21 to 593 PJ (Department of Climate Change, Energy, the Environment and Water, 2022). Associated export earnings dropped to AUD$7.4 billion, showing the impact of COVID-19 on revenue, as prices dropped dramatically in early 2020.
About 83 per cent of the domestically produced oil resources were exported in 2020–21. This is because Australian basins typically produce light sweet oils, which need to be blended with other heavier crude oils to produce refined fuel products. As most oil in Australia is produced on the North West Shelf at significant distances from refineries in the eastern part of the country, it is more cost effective to transport crude oil to larger refineries in the Asian region and import refined fuel products into Australia. The oil produced from eastern Australian basins is largely consumed domestically. However, falling east coast oil production means that Australia’s two remaining domestic refineries increasingly rely on imported feedstock.
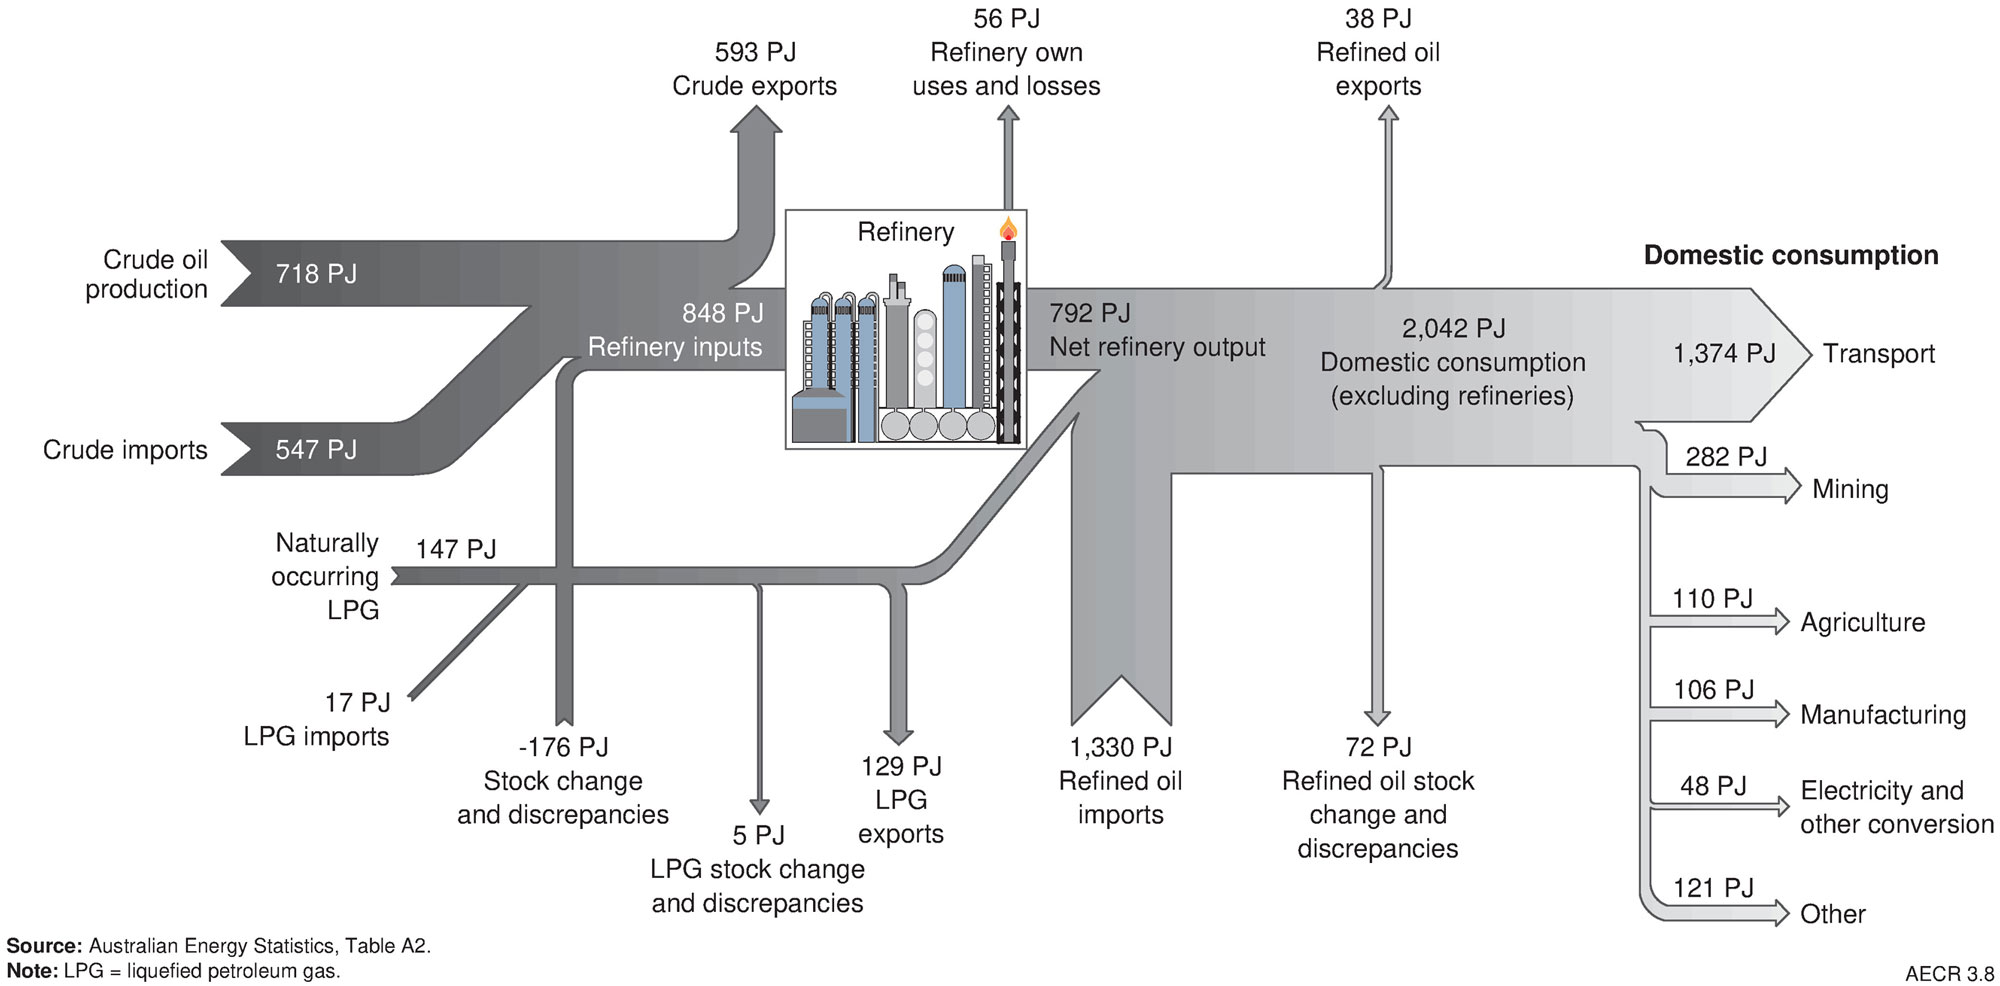
Australia also exported a small volume (about 167 PJ) of refined products and LPG in 2020–21, but this remained as a small proportion of domestically refined products (Figure 7; Department of Climate Change, Energy, the Environment and Water, 2022). Export earnings from Australia’s refined petroleum products and LPG decreased by about 4.7 per cent in 2020–21 to AUD$3.5 billion, but subsequently increased in 2021–22 by 43.4 per cent to AUD$5.0 billion (Department of Industry, Science and Resources, 2023).
The majority of Australia’s energy imports are represented by refined petroleum products (including LPG) and crude oil. Australia’s imports of crude oil decreased by 21 per cent in 2020–21 to 547 PJ, while imports of refined products and LPG remained relatively stable at 1,347 PJ (Department of Climate Change, Energy, the Environment and Water,2022).
World oil resources
Estimates of worldwide oil reserves for 2021 are not available as BP are undertaking process improvements in their Statistical Review of World Energy, and have only been able to publish 2020 world reserve data in their 2022 report (bp, 2022; Table 6).
In 2020, Venezuela held the largest share of world oil reserves with proved reserves of 304 Bbbl, accounting for approximately 17.5 per cent of global reserves (bp, 2021). Saudi Arabia and Canada held the second and third largest oil reserves, with proved reserves of 298 Bbbl and 168 Bbbl, respectively (bp, 2022). Nearly half (48 per cent) of total world oil reserves are in the Middle East. Australia’s current global ranking for oil reserves is difficult to determine due to a lack of reported proved reserves since 2014, when Australia was ranked 25th holding 0.2 per cent of the world’s oil reserves (Geoscience Australia, 2018).
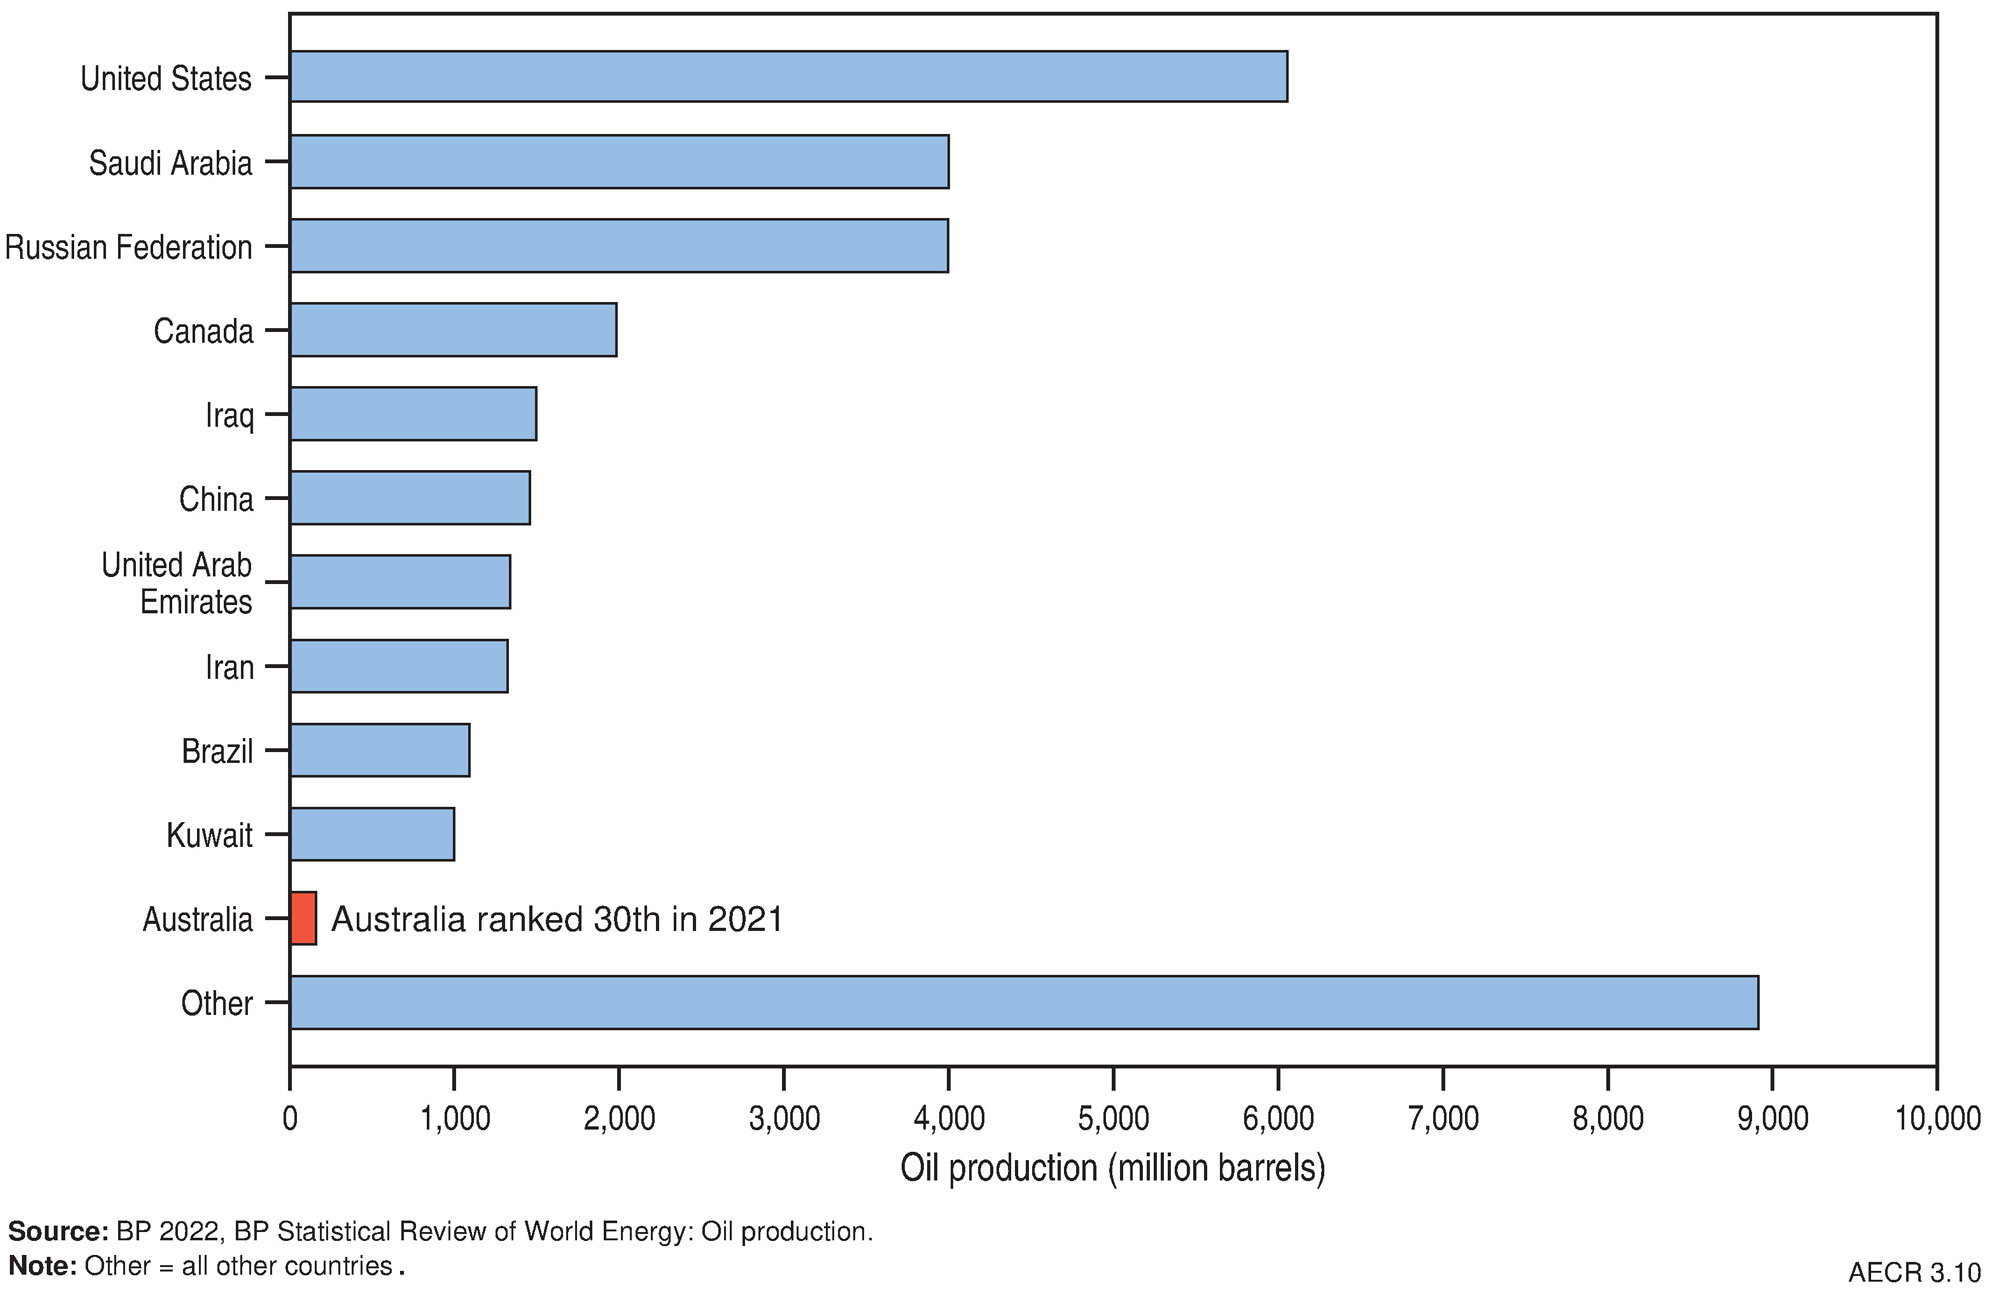
In 2021, total world oil production was approximately 33 Bbbl (equivalent to ~201,751 PJ; bp, 2022). The major oil producers were in the Middle East, which held a 31 per cent share of world production. The United States was the largest single producer, accounting for 18 per cent of world production, followed by Saudi Arabia (12 per cent) and the Russian Federation (12 per cent; Figure 8; bp, 2022). Australia is a minor oil producer, ranking 30th in the world and accounting for 0.5 per cent of total oil production in 2020 (bp, 2022).
References
bp 2021. bp Statistical Review of World Energy 2021, 70th edition (Last accessed 10 May 2023).
bp 2022. bp Statistical Review of World Energy 2022, 71st edition (Last accessed 10 May 2023).
Department of Climate Change, Energy, the Environment and Water 2022 Australian Energy Update 2022 (Last accessed 10 May 2023)
Department of the Environment and Energy 2019. Australian Energy Statistics (Last accessed 10 May 2023).
Department of Industry, Science and Resources 2023. Resources and Energy Quarterly, March 2023 (Last accessed 10 May 2023).
Dyni, J.R. 2006. Geology and resources of some world oil-shale deposits: U.S. Geological Survey Scientific Investigations Report 2005–5294, 42 p. (Last accessed 10 May 2023).
Finder Energy 2022a. Update - Kanga-1 Well (Last accessed 10 May 2023)
Finder Energy 2022b. Kanga-1 Well Result (Last accessed 10 May 2023)
Geoscience Australia. 2018. Australian Energy Resources Assessment (AERA)
United States Geological Survey (USGS). 2016. Assessment of undiscovered conventional oil and gas resources of the Cooper and Eromanga basins, Australia, 2016. U.S. Geological Survey Fact Sheet 2016-3050, 2 p. (Last accessed 10 May 2023).
References for onshore reserves, contingent resources, and production data
Armour Energy Limited 2022. Annual Report For the year ended 30 June 2022 (Last accessed 05 May 2023)
Beach Energy Limited 2021. Enterprise Exploration Success Delivers Material 2P Reserves Booking (Last accessed 10 May 2023)
Beach Energy Limited 2021. FY21 Second Quarter Activities Report (Last accessed 10 May 2023)
Beach Energy Limited 2021. FY21 Fourth Quarter Activities Report (Last accessed 05 May 2023)
Beach Energy Limited 2022. FY22 Second Quarter Activities Report (Last accessed 05 May 2023)
Beach Energy Limited 2022. Annual Report 2022 (Last accessed 05 May 2023)
Bengal Energy Ltd 2022. Annual Information Form for the year ended March 31, 2022 (Last accessed 10 May 2023)
Bengal Energy Ltd 2022. 2022 Annual Report Twelve Months Ended March 31, 2022 (Last accessed 10 May 2023)
Bengal Energy 2022. Bengal Energy Announces Independent Oil and Natural Gas Resource Report (Last accessed 05 May 2023)
Black Mountain Energy 2021. Prospectus (Last accessed 10 May 2023)
Buru Energy Limited 2022. 2021 Annual Report (Last accessed 10 May 2023)
Buru Energy Limited 2022. Rafael resources report confirms major gas potential (Last accessed 10 May 2023)
Buru Energy Limited 2018. Independent Assessment of Resources at the Yulleroo Field 18 January 2018 (Last accessed 10 May 2023)
Carnarvon Energy 2022. Corporate presentation - Good Oil Conference (Last accessed 05 May 2023)
Central Petroleum Limited 2022. 2022 Annual Report (Last accessed 05 May 2023)
Cooper Energy Limited 2021. Quarterly Report For the three months ended 30 June 2021 (Last accessed 10 May 2023)
Cooper Energy Limited 2022. Quarterly Report - Amended For the three months ended 31 December 2021 (Last accessed 10 May 2023)
Cooper Energy Limited 2022. Annual Report 2022 (Last accessed 05 May 2023)
Cooper Energy Limited 2022.Reserves and Contingent Resources at 30 June 2022 (Last accessed by 10 May 2023)
Denison Gas 2022. Reserves and Resources as at 30 June 2022 (Last accessed 05 May 2023)
Emperor Energy Limited 2022. Presentation for PESA Deal Day Brisbane (Last accessed 05 May 2023)
Empire Energy Group Limited 2022. 2021 Annual Report (Last accessed 05 May 2023)
Jadestone Energy 2022. 2021 Annual report (Last accessed 10 May 2023)
New Hope Corporation 2022. Bridgeport Energy Limited- 2022 Petroleum Reserves and Contingent Resources statement (Last accessed 07 May 2023)
NT Department of Industry, Tourism and Trade 2022. NT onshore oil and gas production data (Last accessed 07 May 2023)
Pilot Energy 2022. Annual Report 2022 (Last accessed 07 May 2023)
Red Sky Energy Limited 2022 Killanoola Project Initial Oil in Place Report (Last accessed 10 May 2023)
Red Sky Energy Limited 2022. Presentation to Good Oil Conference (Last accessed 07 May 2023)
ROC Oil Company Pty Ltd 2020. Summary of Reserves and Resources (Last accessed 02 February 2022)
Santos Limited 2020. 2021 Fourth Quarter Report Data Tables (Last accessed 07 May 2023)
Santos Limited 2021. Annual Report 2021 (Last accessed 07 May 2023)
Strike Energy Limited 2020. Exploration Portfolio Update (Last accessed 07 May 2023)
Strike Energy Limited 2022. Independent certification of Ocean Hill gas resource (Last accessed 07 May 2023)
Strike Energy Limited 2022. Independent certification of Walyering reserves (Last accessed 07 May 2023)
Tamboran Resources Limited 2022. 2022 Annual Report (Last accessed 07 May 2023)
Triangle Energy (Global) 2021. Quarterly Report Period ending 31 March 2021 (Last accessed 10 May 2023)
Triangle Energy (Global) 2021.Quarterly Report Period ending 30 June 2021 (Last accessed 10 May 2023)
Triangle Energy (Global) 2021.Quarterly Report Period ending 30 September 2021 (Last accessed 10 May 2023)
Triangle Energy (Global) 2022.Quarterly Report Period ending 31 December 2021 (Last accessed 10 May 2023)
Triangle Energy (Global) 2022.Annual Report 2022 (Last accessed 10 May 2023)
Vic Geological Survey of Victoria 2022. Earth Resources Regulation Annual Statistical Report FY2021-22 (Last accessed 07 May 2023)
Published prospective resource estimates (2021 reporting year)
Amadeus Basin
Central Petroleum Limited 2022. 2022 Annual Report (Last accessed 05 May 2023)
Northern Territory Geological Survey (NTGS) 2023. NT Resourcing The Territory Shale Gas and Liquids Factsheet April 2023 (Last accessed 07 May 2023)
Northern Territory Geological Survey (NTGS) 2023. NT Resourcing The Territory Conventional Oil and Gas Factsheet April 2023 (Last accessed 07 May 2023)
Bonaparte Basin
Finder Energy 2022. Corporate Presentation, 6 April 2022 (Last accessed 08 May 2023)
Melbana Energy 2021. Bonaparte Gulf - Beehive (Last accessed 08 May 2023)
Melbana Energy 2021. Vulcan Sub-basin Exploration (Last accessed 08 May 2023)
Browse Basin
IPB Petroleum Limited 2022. Investor Presentation (Last accessed 10 May 2023)
Canning Basin
Black Mountain Energy 2021. Prospectus (Last accessed 05 May 2023)
Buru Energy Limited 2018. Independent Assessment of Resources at the Yulleroo Field 18 January 2018 (Last accessed 08 May 2023)
Buru Energy Limited 2022. Rafael-resources-report-confirms-major-gas-potential (Last accessed 05 May 2023)
Cooper-Eromanga Basin
Bengal Energy 2022. Bengal Energy Announces Independent Oil and Natural Gas Resource Report (Last accessed 05 May 2023)
Icon Energy Limited 2022. 2022 Annual Report (Last accessed 08 May 2023)
Georgina Basin
Northern Territory Geological Survey (NTGS) 2023. NT Resourcing The Territory Shale Gas and Liquids Factsheet April 2023 (Last accessed 07 May 2023)
Northern Territory Geological Survey (NTGS) 2023. NT Resourcing The Territory Conventional Oil and Gas Factsheet April 2023 (Last accessed 07 May 2023)
Gippsland Basin
3D Oil Limited 2021.Update to VIC/P74 Prospective Resource Estimates (Last accessed 08 May 2023)
Cooper Energy 2021. RIU Good Oil and Gas Energy Conference (Last accessed 08 May 2023)
McArthur Basin (Beetaloo Sub-basin)
Empire Energy Group Limited 2022. Substantial Resources and Reserves Increase (Last accessed 05 May 2023)
Empire Energy Group Limited 2022. 2021 Annual Report (Last accessed 05 May 2023)
Northern Territory Geological Survey (NTGS) 2023. NT Resourcing The Territory Shale Gas and Liquids Factsheet April 2023 (Last accessed 07 May 2023)
Northern Territory Geological Survey (NTGS) 2023. NT Resourcing The Territory Conventional Oil and Gas Factsheet April 2023 (Last accessed 07 May 2023)
Tamboran Resources Limited 2022. 2022 Annual Report (Last accessed 07 May 2023)
Northern Carnarvon Basin
Bounty Oil and Gas NL 2021. Cerberus Farmin Agreement, Carnarvon Basin, Western Australia and Placement to Raise $2.74 Million (Last accessed 08 May 2023)
FAR Limited 2021. Annual Report 2020 (Last accessed 10 May 2023)
Finder Energy 2022. Corporate Presentation, 6 April 2022 (Last accessed 08 May 2023)
Tamaska Oil & Gas Limited 2021. Napoleon Prospect Technical Report (Last accessed 08 May 2023)
Otway Basin
Armour Energy 2022. Enterprise North – Project Update (Last accessed 08 May 2023)
Perth Basin
Strike Energy Limited 2022. Independent certification of Walyering reserves (Last accessed 07 May 2023)
Triangle Energy (Global) Limited 2021. Mt Horner L7 (R1) Prospective Resources Update (Last accessed 08 May 2023)
Roebuck Basin
Carnarvon Petroleum Ltd 2021. Bedout Basin Update (Last accessed 20 May 2022)
Data download
Australia's Energy Commodity Resources Data Tables - 2021 reporting period
1 Offshore data provided by NOPTA to year-end 2021, except Browse-Bonaparte and Perth Basins which are sourced from company reports; onshore data are sourced from government statistics and company estimates reported at various dates between June 2021 and June 2022.