

Key messages
- Natural gas is formed when accumulations of organic matter are buried and exposed to increasing heat and pressure over geological time. The generated gas consists of a mixture of methane and often other heavier hydrocarbons, as well as other gases including carbon dioxide, nitrogen, hydrogen sulphide and helium.
- Liquefied natural gas (LNG) is a natural gas that has been cooled to minus 162°C, a process that is commonly done for export purposes as it shrinks the gas to 1/600th of its volume.
- Australia has substantial conventional gas resources, the largest of which are located offshore, and significant onshore unconventional gas resources.
- During 2021, Australia was the seventh largest gas producer in the world. Australia’s LNG exports reached a record high of 83.2 million tonnes (Mt) in 2021–22 (slightly ahead of Qatar) making Australia the world’s largest LNG exporter.
Summary
Australia has substantial gas resources (Figure 1 and Figure 2). In this report, ‘gas resources’ refers to conventional and unconventional gas resources, including coal seam gas (CSG), shale gas, tight gas, basin centred gas and in-situ gasification products.
Conventional gas and coal seam gas remain Australia’s most important gas resources for energy generation and export.
Since the early 1970’s, following the discovery of the supergiant (>10 trillion cubic feet ‘Tcf’) and giant (>3 Tcf) gas fields on the North West Shelf, Australia’s identified conventional gas resources have grown substantially—increasing fivefold. About 93 per cent of conventional gas resources are located on the North West Shelf with gas produced from the Northern Carnarvon, Browse and Bonaparte basins providing feedstock to seven LNG projects (Gorgon, Wheatstone, North West Shelf, Pluto, Prelude, Ichthys and Darwin).
CSG is largely methane gas that is extracted from shallow coal seams (<1,500 m depth) using hydraulic stimulation. Most of Australia’s CSG resources are produced in Queensland, where they form feedstock for three major LNG projects ((Queensland-Curtis LNG (QCLNG), Australia Pacific LNG (APLNG) and Gladstone LNG (GLNG)).
Other significant unconventional gas resource potential has been identified in onshore basins, including deep CSG, shale gas, tight gas and basin centred gas resources and from in-situ gasification. Production of these unconventional gas resources has been limited to minor shale gas and tight gas in the Cooper Basin, which has supplied some gas to the East Coast Gas Market (Santos, 2018).
Gas resources are reported as best estimate of reserves (2P) and best estimate of contingent resources (2C) using the SPE-Petroleum Resources Management System. Reserves are commercially recoverable amounts of petroleum that remain in known accumulations, of which 2P reserves are the best estimate (the sum of Proved plus Probable Reserves). Australia’s 2P reserves for conventional gas in 2021 are estimated as 83,307 petajoules (PJ; 74.07 Tcf), a significant increase of 15.6 per cent from conventional reserve estimates in 2020 associated with final investment decisions on the offshore Barossa and Scarborough projects (Table 1 and Table 2; Figure 1 and Figure 2). Proven and probable reserve estimates for unconventional CSG also increased by 2.8 per cent to 29,752 PJ (26.45 Tcf) due to upgrades for reserves in the Bowen and Surat basins.
Contingent resources are potentially recoverable amounts of hydrocarbons in known accumulations, of which 2C contingent resources are the best estimate. Contingent resources are not yet considered to be commercially recoverable due to one or more technical, commercial or other factors. Australia’s 2C contingent conventional gas resources in 2021 are estimated as 104,531 PJ (92.65 Tcf), which represents a 13 per cent decrease from 2020 estimates associated mainly with the movement of contingent resources into reserves for the Barossa and Scarborough projects. Coal seam gas contingent resource estimates increased by 5.2 per cent to 27,564 PJ (24.51 Tcf; Table 1 and Table 2; Figure 1 and Figure 2).
At the end of 2021, annual gas production rates were 6,154 PJ—based on this production rate the currently identified conventional and unconventional 2P gas reserves may support the equivalent of 18 years of further production. Overall gas production decreased slightly, due in part to outages at the Prelude and Gorgon facilities related to technical issues and routine maintenance. Production remains primarily driven by the Australian LNG industry on both the west and east coasts. These gas projects feed into the domestic market as well as into the international export market. About 75 per cent of Australia’s natural gas production was exported in 2020–21.
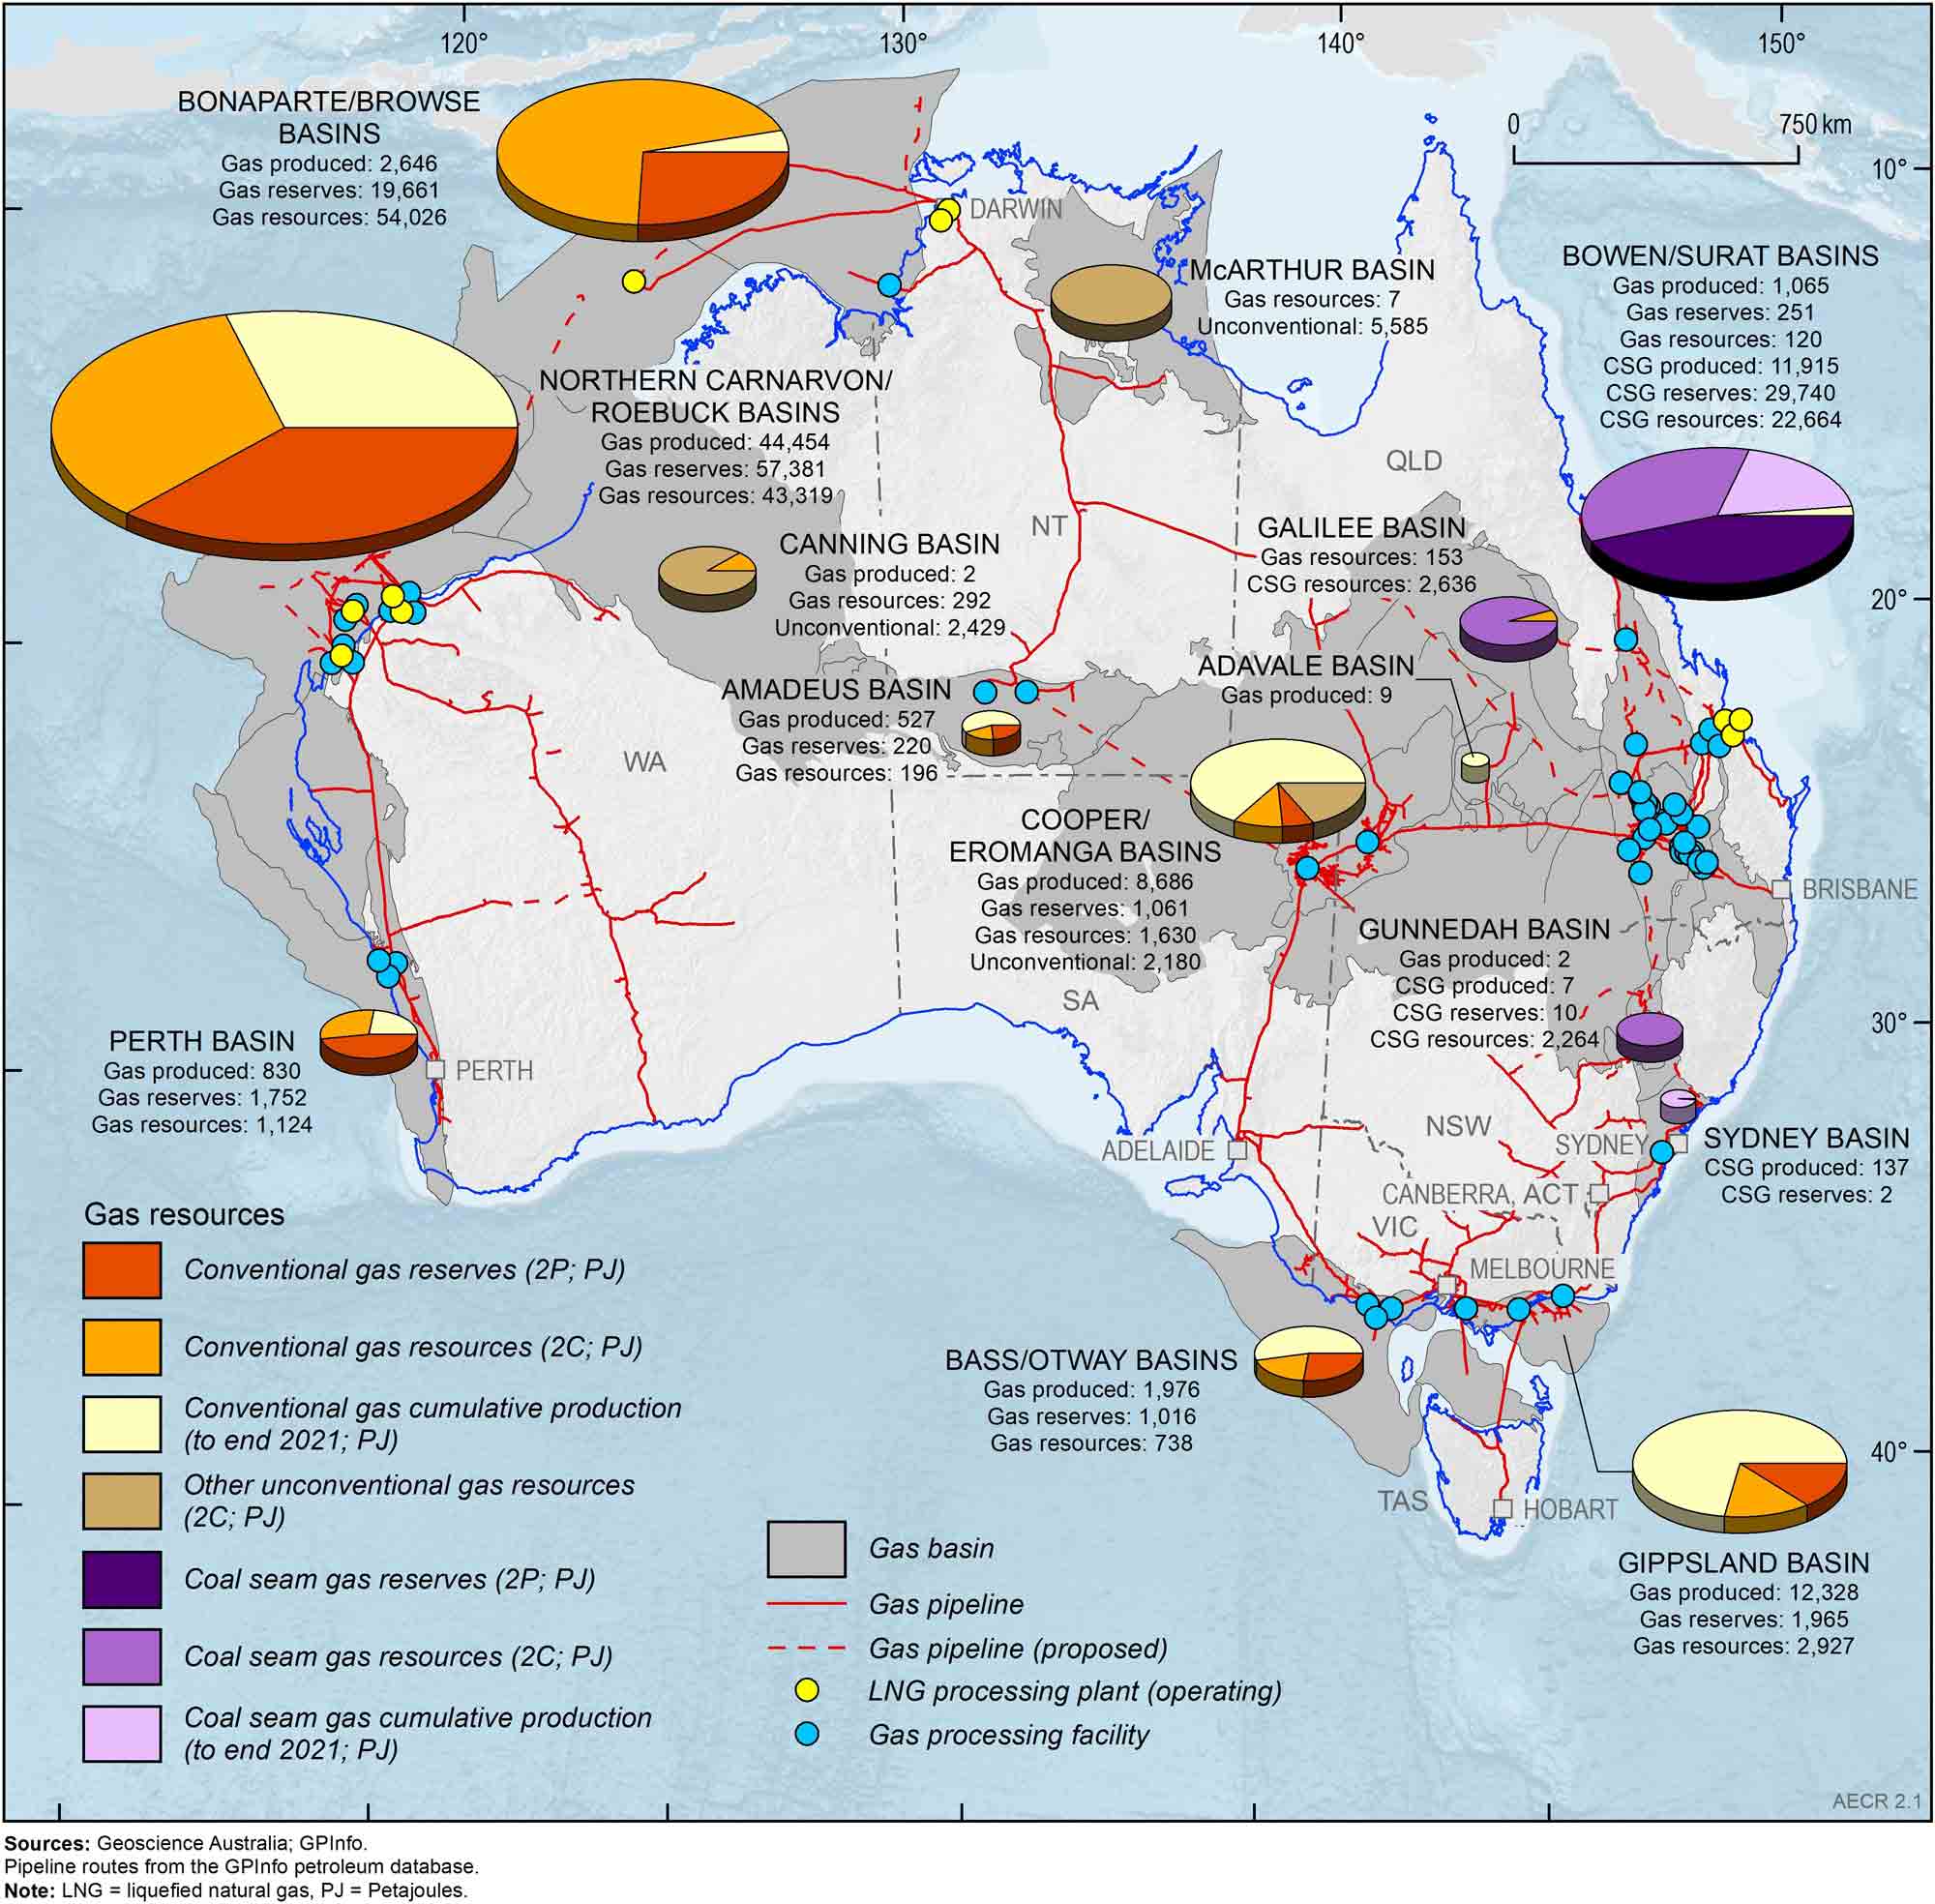
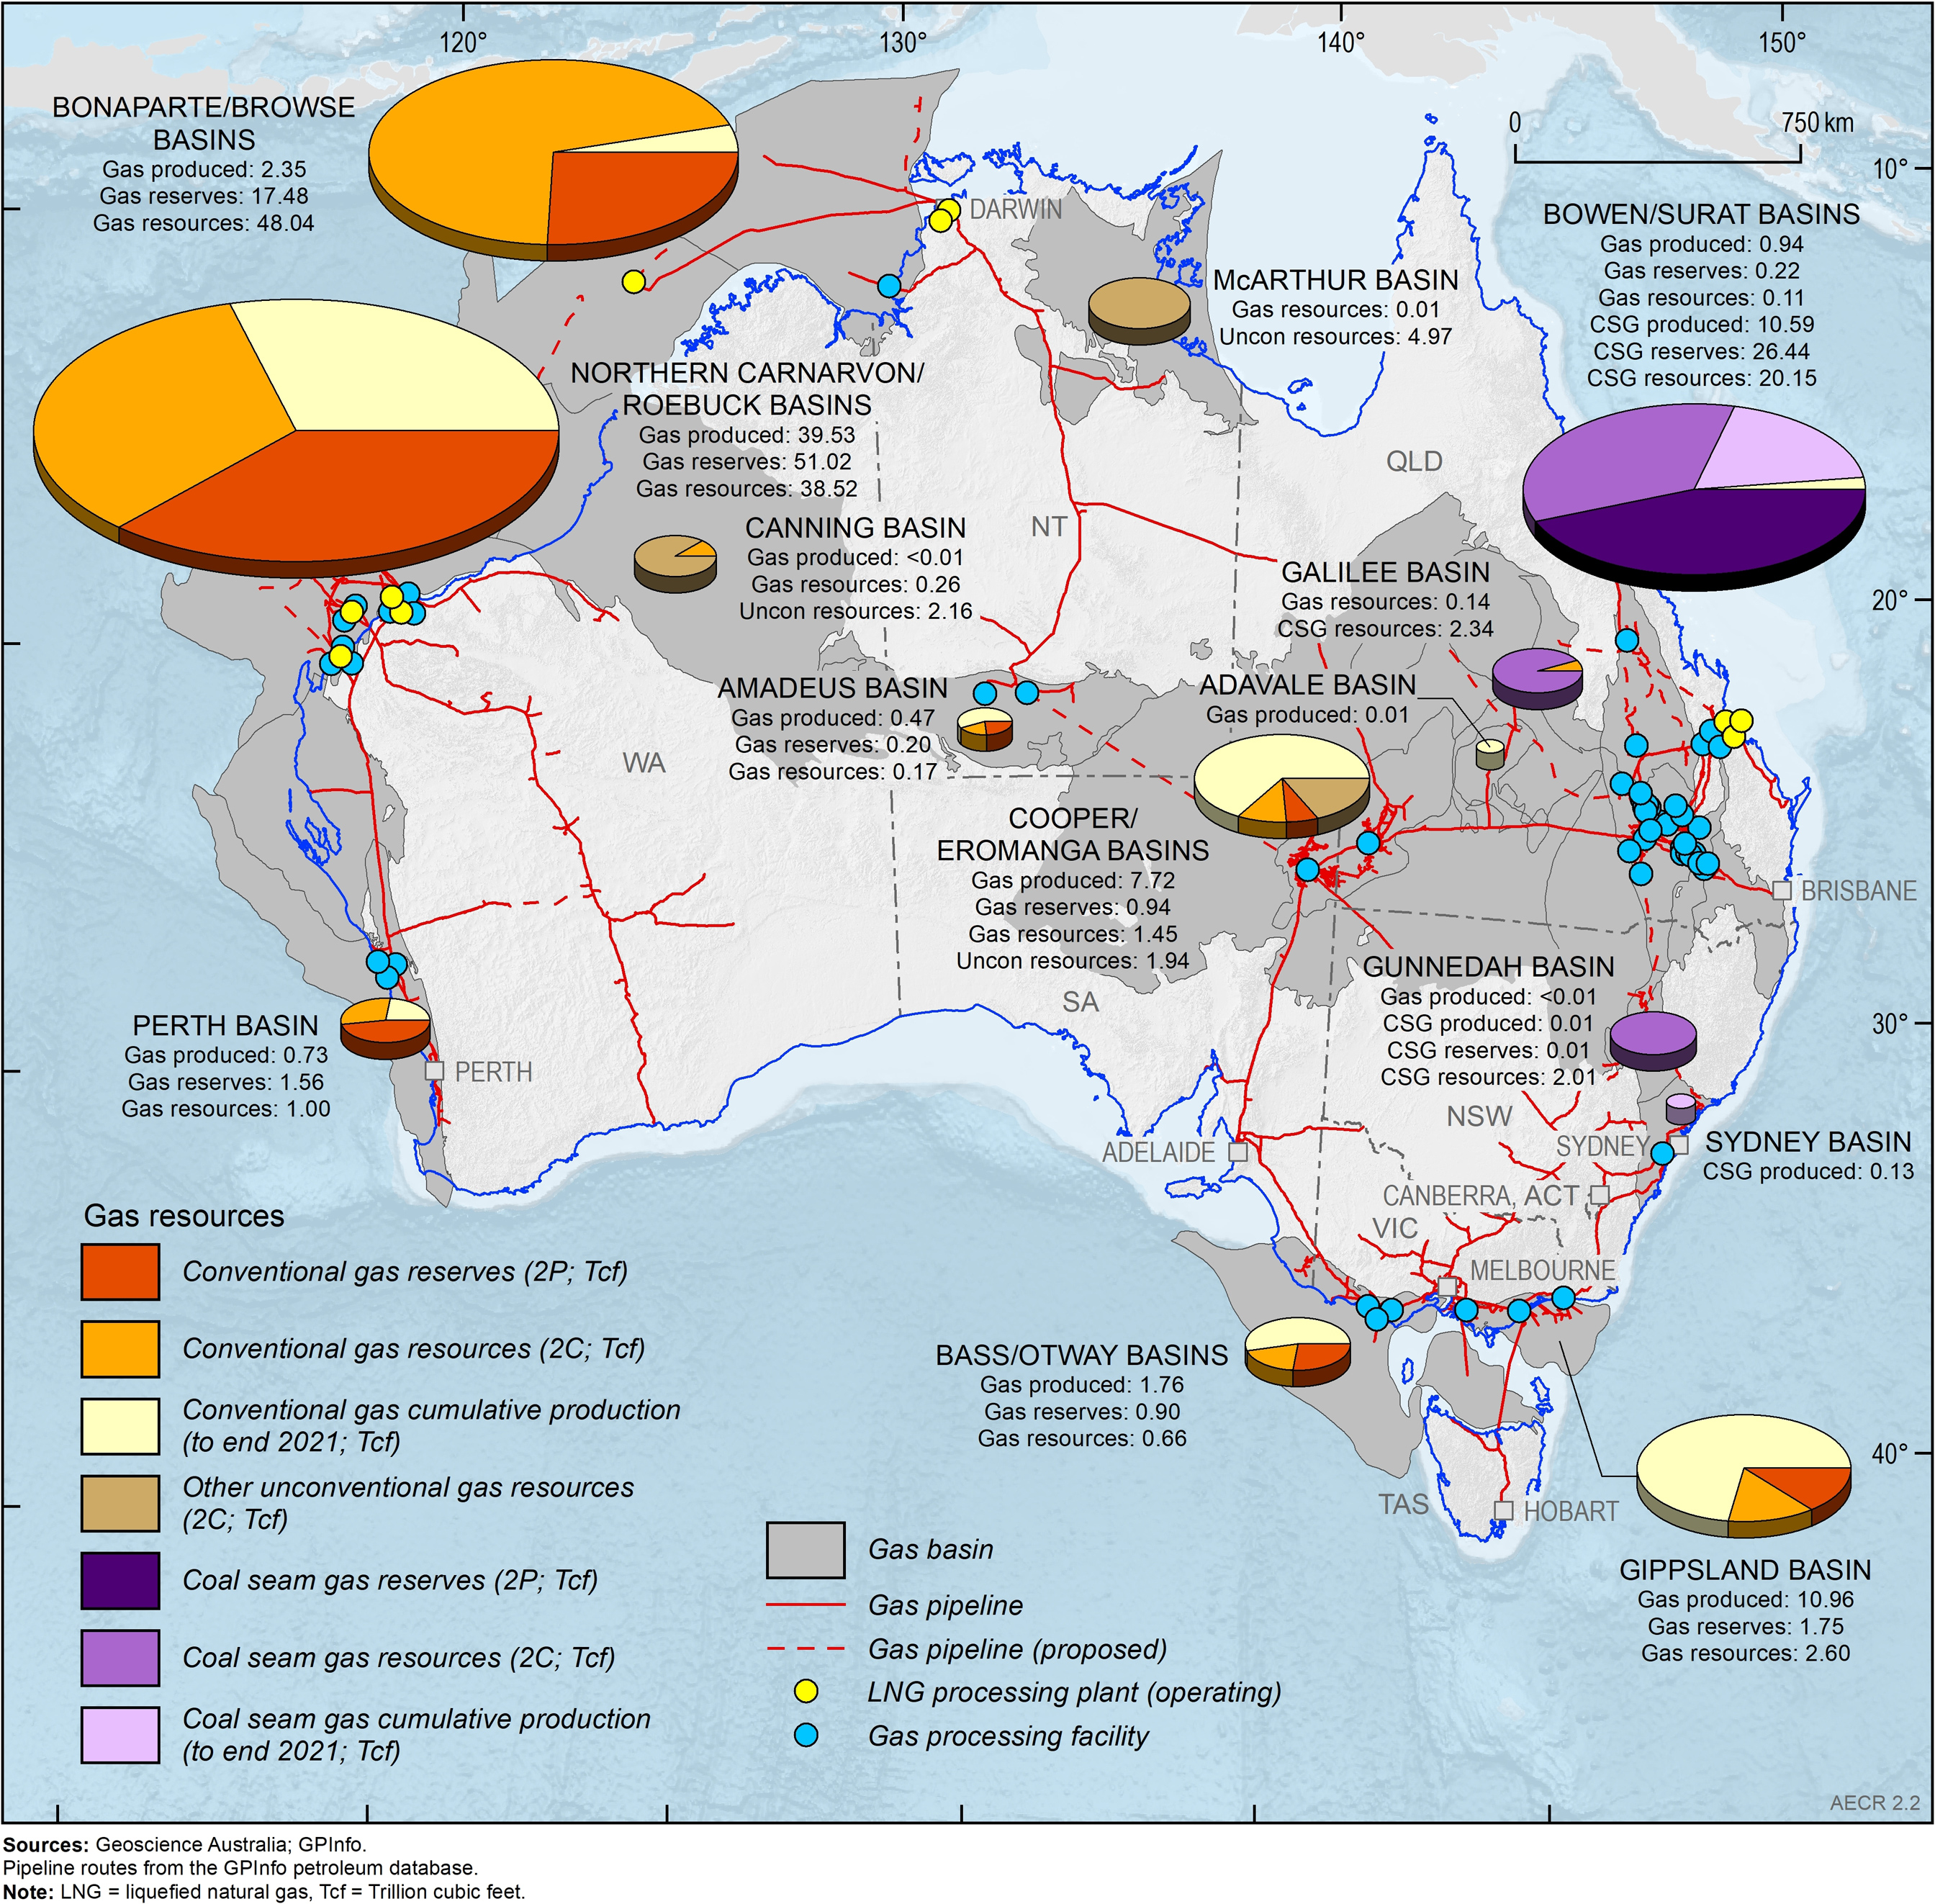
Table 1. Australia's remaining conventional gas reserves (2P), contingent resources (2C) and annual production during 2021, and cumulative production to end 2021
| Basin | Conventional gas (PJ) | Conventional gas (Tcf) | ||||||
|---|---|---|---|---|---|---|---|---|
| Annual Production | Cumulative production | Reserves (2P) | Resources (2C) | Annual Production | Cumulative production | Reserves (2P) | Resources (2C) | |
| Adavale | 0 | 9 | 0 | 0 | 0 | 0.01 | 0 | 0 |
| Amadeus | 16 | 527 | 220 | 196 | 0.01 | 0.47 | 0.20 | 0.17 |
| Bass/Otway | 49 | 1,976 | 1,016 | 738 | 0.04 | 1.76 | 0.90 | 0.66 |
| Bonaparte/Browse | 776 | 2,646 | 19,661 | 54,026 | 0.69 | 2.35 | 17.48 | 48.04 |
| Bowen/Surat | 2 | 1,065 | 251 | 120 | 0.00 | 0.94 | 0.22 | 0.11 |
| Canning | 0 | 2 | 0 | 292 | 0 | <0.001 | 0 | 0.26 |
| Northern Carnarvon/Roebuck | 3,263 | 44,454 | 57,381 | 43,319 | 2.90 | 39.53 | 51.02 | 38.52 |
| Cooper/Eromanga | 104 | 8,686 | 1,061 | 1,630 | 0.09 | 7.72 | 0.94 | 1.45 |
| Galilee | 0 | 0 | 0 | 153 | 0 | 0 | 0 | 0.14 |
| Gippsland | 319 | 12,328 | 1,965 | 2,927 | 0.28 | 10.96 | 1.75 | 2.60 |
| Gunnedah | 0 | 2 | 0 | 0 | 0 | <0.001 | 0 | 0 |
| McArthur | 0 | 0 | 0 | 7 | 0 | 0 | 0 | 0.01 |
| Perth | 13 | 830 | 1,752 | 1,124 | 0 | 0.73 | 1.56 | 1.00 |
| Total | 4,543 | 72,525 | 83,307 | 104,531 | 4.04 | 64.48 | 74.07 | 92.95 |
Notes: Data from the former Joint Petroleum Development Area (JPDA) have been omitted from Bonaparte Basin totals. PJ = petajoules; Tcf = trillion cubic feet. Source: Offshore data provided by NOPTA to year-end 2021; onshore data are sourced from government statistics and company estimates reported at various dates between June 2021 and June 2022.
Table 2. Australia's remaining coal seam gas reserves (2P), contingent resources (2C) and annual production during 2021, and cumulative production to end 2021 (Tcf)
| Basin | Coal seam gas (PJ) | Coal seam gas (Tcf) | ||||||
|---|---|---|---|---|---|---|---|---|
| Annual Production | Cumulative production | Reserves (2P) | Resources (2C) | Annual Production | Cumulative production | Reserves (2P) | Resources (2C) | |
| Bowen/Surat | 1,607 | 11,915 | 29,740 | 22,664 | 1.43 | 10.59 | 26.44 | 20.15 |
| Galilee | 0 | 0 | 0 | 2,636 | 0 | 0 | 0 | 2.34 |
| Gunnedah | 1 | 7 | 10 | 2,264 | 0.00 | 0.01 | 0.01 | 2.01 |
| Sydney | 3 | 137 | 2 | 0 | 0.00 | 0.13 | 0.00 | 0 |
| Total | 1,611 | 12,060 | 29,752 | 27,564 | 1.43 | 10.73 | 26.45 | 24.51 |
Notes: PJ = petajoules; Tcf = trillion cubic feet. Source: Coal seam gas data are sourced from government statistics and company estimates reported at various dates between June 2021 and June 2022.
Australia's identified gas resources
Identified resources are those that have been discovered and their locations, quantity and quality are known from measurements or direct geological evidence. Identified gas resources, for the purposes of this report, are the equivalent of discovered 2P reserves and 2C contingent resources in the SPE-Petroleum Resources Management System.
The 2021 resource estimates compiled for this report are based on publicly available onshore data aggregated with confidential offshore data submitted to the National Offshore Petroleum Titles Administrator (NOPTA). Offshore data are reported for calendar year 2021, while onshore data are based on government statistics and company estimates reported at various dates between June 2021 and June 2022. Where necessary, the data has been aggregated for composite basin regions to de-identify confidential offshore field data in the custody of NOPTA. A bibliography of all open file data sources for onshore reserves, resources and production data is provided at the end of the chapter.
Australia’s estimated conventional gas resources in 2021 include 83,307 PJ (74.07 Tcf) of 2P reserves, accounting for nearly three-quarters of Australia’s total remaining 2P gas reserves, and 104,531 PJ (92.95 Tcf) of 2C contingent resources. Aggregating Australia’s 2P reserves and 2C contingent resources provides a total of 187,839 PJ (167 Tcf) of identified conventional gas resources. During this period the proven and probable reserves increased by 15.6 per cent (11,225 PJ) following final investment decisions (FID) on the offshore Barossa and Scarborough gas projects. About 93 per cent of identified conventional gas resources are located offshore along the North West Shelf of Australia. Based on 2021 production rates of 4,543 PJ (4.04 Tcf), the estimated life for Australia’s identified conventional gas resources (2P reserves plus 2C contingent resources) is 41 years if all identified contingencies to development are mitigated, which includes 18 years of reserves life.
Coal seam gas is expected to remain Australia’s most important unconventional gas resource in the near term (Figure 1 and Figure 2). CSG is already a major source for domestic gas and LNG exports in eastern Australia. Almost all reported CSG reserves and contingent resources are located in Queensland; the remainder are in New South Wales. In 2021, Australia’s estimated total 2P reserves are 29,752 PJ (26.45 Tcf), accounting for over one-quarter of the total remaining 2P gas reserves, and 27,564 PJ (24.51 Tcf) of 2C contingent CSG resources. Proven and probable reserves for coal seam gas increased during 2021 by 2.8 per cent (818 PJ) following upgrades to reserves in the Bowen and Surat basins. Aggregating Australia’s 2P reserves and 2C contingent resources provides a total estimate of 57,316 PJ (50.96 Tcf) of CSG identified resources. Based on 2021 production rates of 1,611 PJ (1.43 Tcf), these identified CSG resources would have an estimated life of 36 years if all identified contingencies to development are mitigated, which includes 18 years of reserves life.
Other unconventional gas resources in Australia include tight gas, shale gas, basin centred gas and in-situ coal gasification resources. Tight gas and shale gas occur in reservoirs with low or no permeability, which require hydraulic stimulation for gas production. Basin centred gas occurs in abnormally pressured, gas-saturated, low-permeability reservoirs. In-situ coal gasification refers to gas being extracted from coal seams by in-situ heating to produce synthesis (syn) gas.
Unconventional contingent gas reserves for Australia, other than coal seam gas, are reported from an in-situ coal gasification demonstration plant at Leigh Creek in South Australia (NeuRizer Ltd, 2021). The total 2P reported reserves of syngas for the Leigh Creek Energy Project in the Telford Basin are 1,153 PJ (1.03 Tcf; Table 4).
Currently, there are no published reserves data for shale, tight or basin centred gas. This reflects the early stage of unconventional gas exploration and development of associated infrastructure in Australia. Santos initially reported 3 PJ (2.8 Bcf) of shale gas reserves from the Moomba gas field in the Cooper Basin in 2012 (Santos, 2012, 2013), but these were subsequently downgraded to contingent resources.
During 2021, unconventional 2C contingent gas resources for Australia, other than coal seam gas, totalled 11,663 PJ (10.37 Tcf; Table 3 and Table 4). Nearly 50 per cent (5,585 PJ; 4.97 Tcf) are represented by shale gas resources in the Beetaloo Sub-basin of the greater McArthur Basin, which are being appraised through drilling campaigns by Tamboran Resources, Empire Energy and Santos. Significant unconventional 2C contingent gas resources have also been identified in the Cooper Basin (2,180 PJ; 1.94 Tcf), Canning Basin (2,429 PJ; 2.16 Tcf) and Telford Basin (1,469 PJ; 1.31 Tcf; Table 3 and Table 4).
Australia's other unconventional gas reserves (2P) and contingent resources (2C) during 2021
| Basin | Type | Gas | Data Source | |||
|---|---|---|---|---|---|---|
| 2P Reserves (PJ) | 2P Reserves (Tcf) | 2C Resources (PJ) | 2C Resources (Tcf) | |||
| Beetaloo (Sub-basin) | Shale gas | 0 | 0 | 5,585 | 4.97 | Empire Energy (2022); Tamboran Resources (2022) |
| Canning | Basin centred gas; Tight gas | 0 | 0 | 2,429 | 2.16 | Buru Energy (2018); Black Mountain Energy Ltd (2022) |
| Cooper/Eromanga | Basin centred gas; Tight gas | 0 | 0 | 2,180 | 1.94 | Pure Hydrogen (2022); Icon Energy (2022) Beach Energy (2022) |
| Total | 0 | 0 | 10,194 | 9.06 | ||
Notes: PJ = petajoules. Tcf = trillion cubic feet.
Table 4. Australia's syngas gas reserves (2P) and contingent resources (2C) during 2020
| Basin | Type | Gas | Data Source | |||
|---|---|---|---|---|---|---|
| 2P Reserves (PJ) | 2P Reserves (Tcf) | 2C Resources (PJ) | 2C Resources (Tcf) | |||
| Telford | Syngas | 1,153 | 1.03 | 1,469 | 1.31 | NeuRizer Ltd (2022) |
| Total | 1,153 | 1.03 | 1,469 | 1.31 | ||
Notes: PJ = petajoules; Tcf = trillion cubic feet.
Australia's prospective gas resources
Undiscovered resources can be assessed and classified using the SPE-Petroleum Resources Management System (PRMS). These are defined as Prospective Resources as they estimate potentially recoverable quantities of hydrocarbons from undiscovered accumulations, referred to as prospects, assuming that a discovery is made and developed.
Individual prospects are defined by a range of possible resource outcomes and carry both a geological risk of discovering oil and gas, as well as a risk of developing any resources in the event of a discovery. Estimating prospective resources is therefore subject to a range of uncertainties regarding the potential recoverable quantities of hydrocarbons. The PRMS provides requirements for determining low, best and high case estimates of prospective resources. However, the methodologies used to assess prospective resources vary across basins, reservoir types, trap types and available sources of data. As such, each reporting entity has the flexibility to calculate resource estimates based on internal best practices.
Prospective resource estimates need to be evaluated in the context of the assessment areas for which they have been generated, the resource type assessed (conventional or unconventional), the assumptions and methodologies used in the assessments, and with an understanding of the risk associated with these resources being realised. There were a number of examples of this in the past year, including the Sasanof and Dancer prospects. The Sasanof prospect in WA-519-P (Northern Carnarvon Basin) had a best estimate prospective recoverable gas resource of 7 Tcf and 176 MMbbl of condensate with a 32 per cent chance of success prior to drilling (Western Gas, 2022a). However, following the drilling of the Sasanof-1 well in May 2022, it was subsequently found to contain no gas resources (Western Gas, 2022b). Similarly, the Dancer-1 well in WA-1-P (Northern Carnarvon Basin) was drilled in January 2022 as a potential backfill field for the Varanus Island gas processing plant, but found no hydrocarbons (Santos, 2022). The implications of such ‘well failures’ for related exploration targets and prospective resource estimates need to be evaluated through post-drill analysis to determine if it occurred due to local prospect factors, such as trap integrity, or more regional factors, such as lack of hydrocarbon charge.
Due to their risk and uncertain nature, only a limited set of prospective resource estimates are published each year by petroleum exploration companies and other reporting entities. Consequently, it is not possible to provide an accurate aggregation of all prospective gas resources in Australia using published prospective resource estimates. A bibliography of all published prospective resource estimates for the 2021 reporting year accessed by Geoscience Australia is provided at the end of this chapter for reference and for access to the available prospective resource data in each hydrocarbon-bearing basin.
Production
During 2021, gas production in Australia remained relatively steady at 6,154 PJ (5.5 Tcf), decreasing only slightly by 0.4 per cent (25 PJ) from 2020.Over 98 per cent of conventional gas was produced from basins on the North West Shelf and from the Gippsland and Cooper basins, while more than 99 per cent of CSG was produced from the Bowen and Surat basins (Figure 1 and Figure 2).
The gas-producing basins of the North West Shelf (Northern Carnarvon, Browse and Bonaparte basins) accounted for 66 per cent of Australia’s annual gas production to the end of 2021, at 4,039 PJ (3.59 Tcf). Gas production in the Bowen and Surat basins accounted for 26 per cent of the 2021 total, at 1,607 PJ (1.43 Tcf).
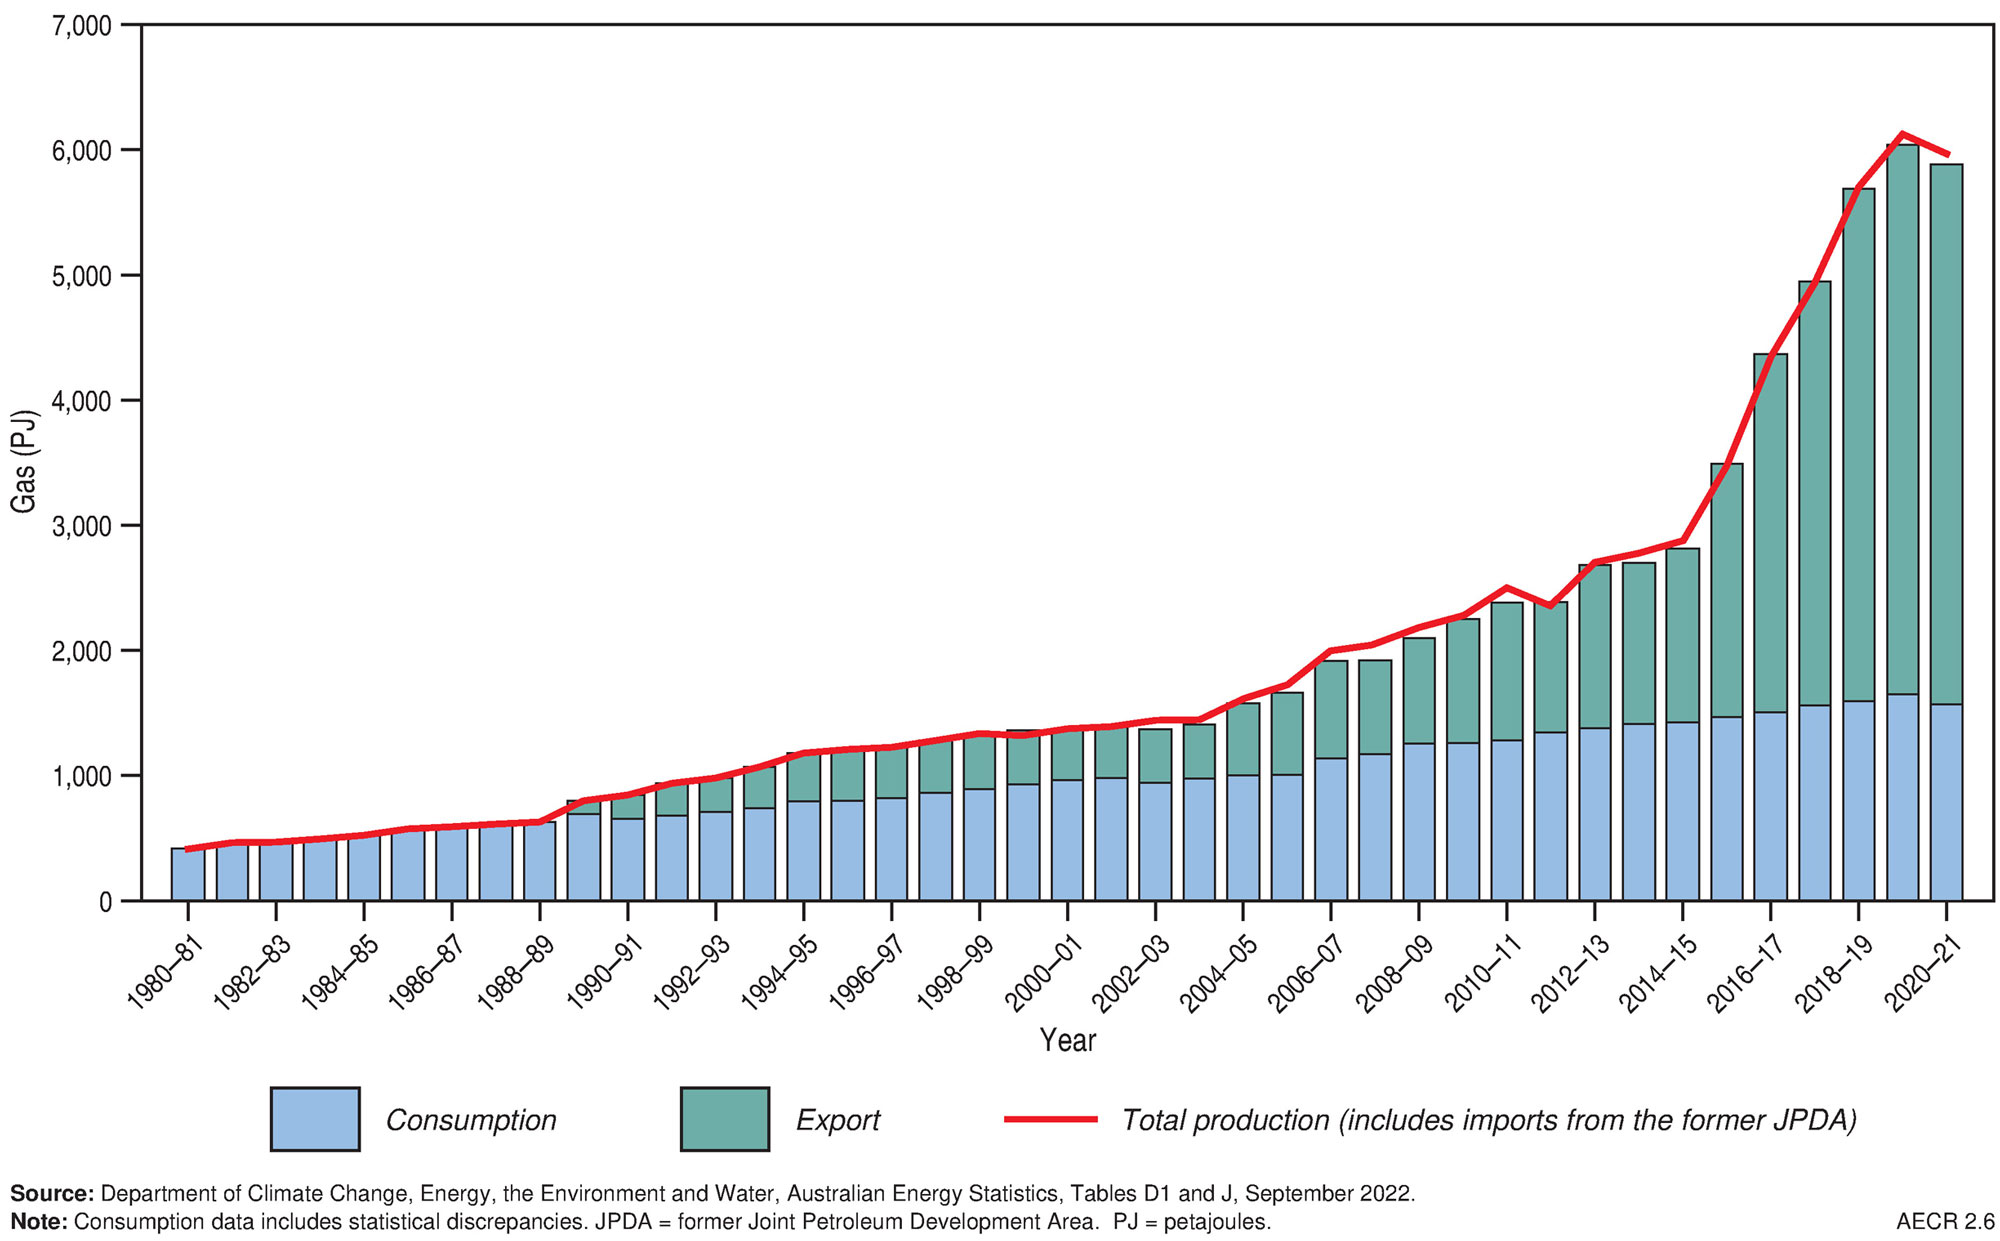
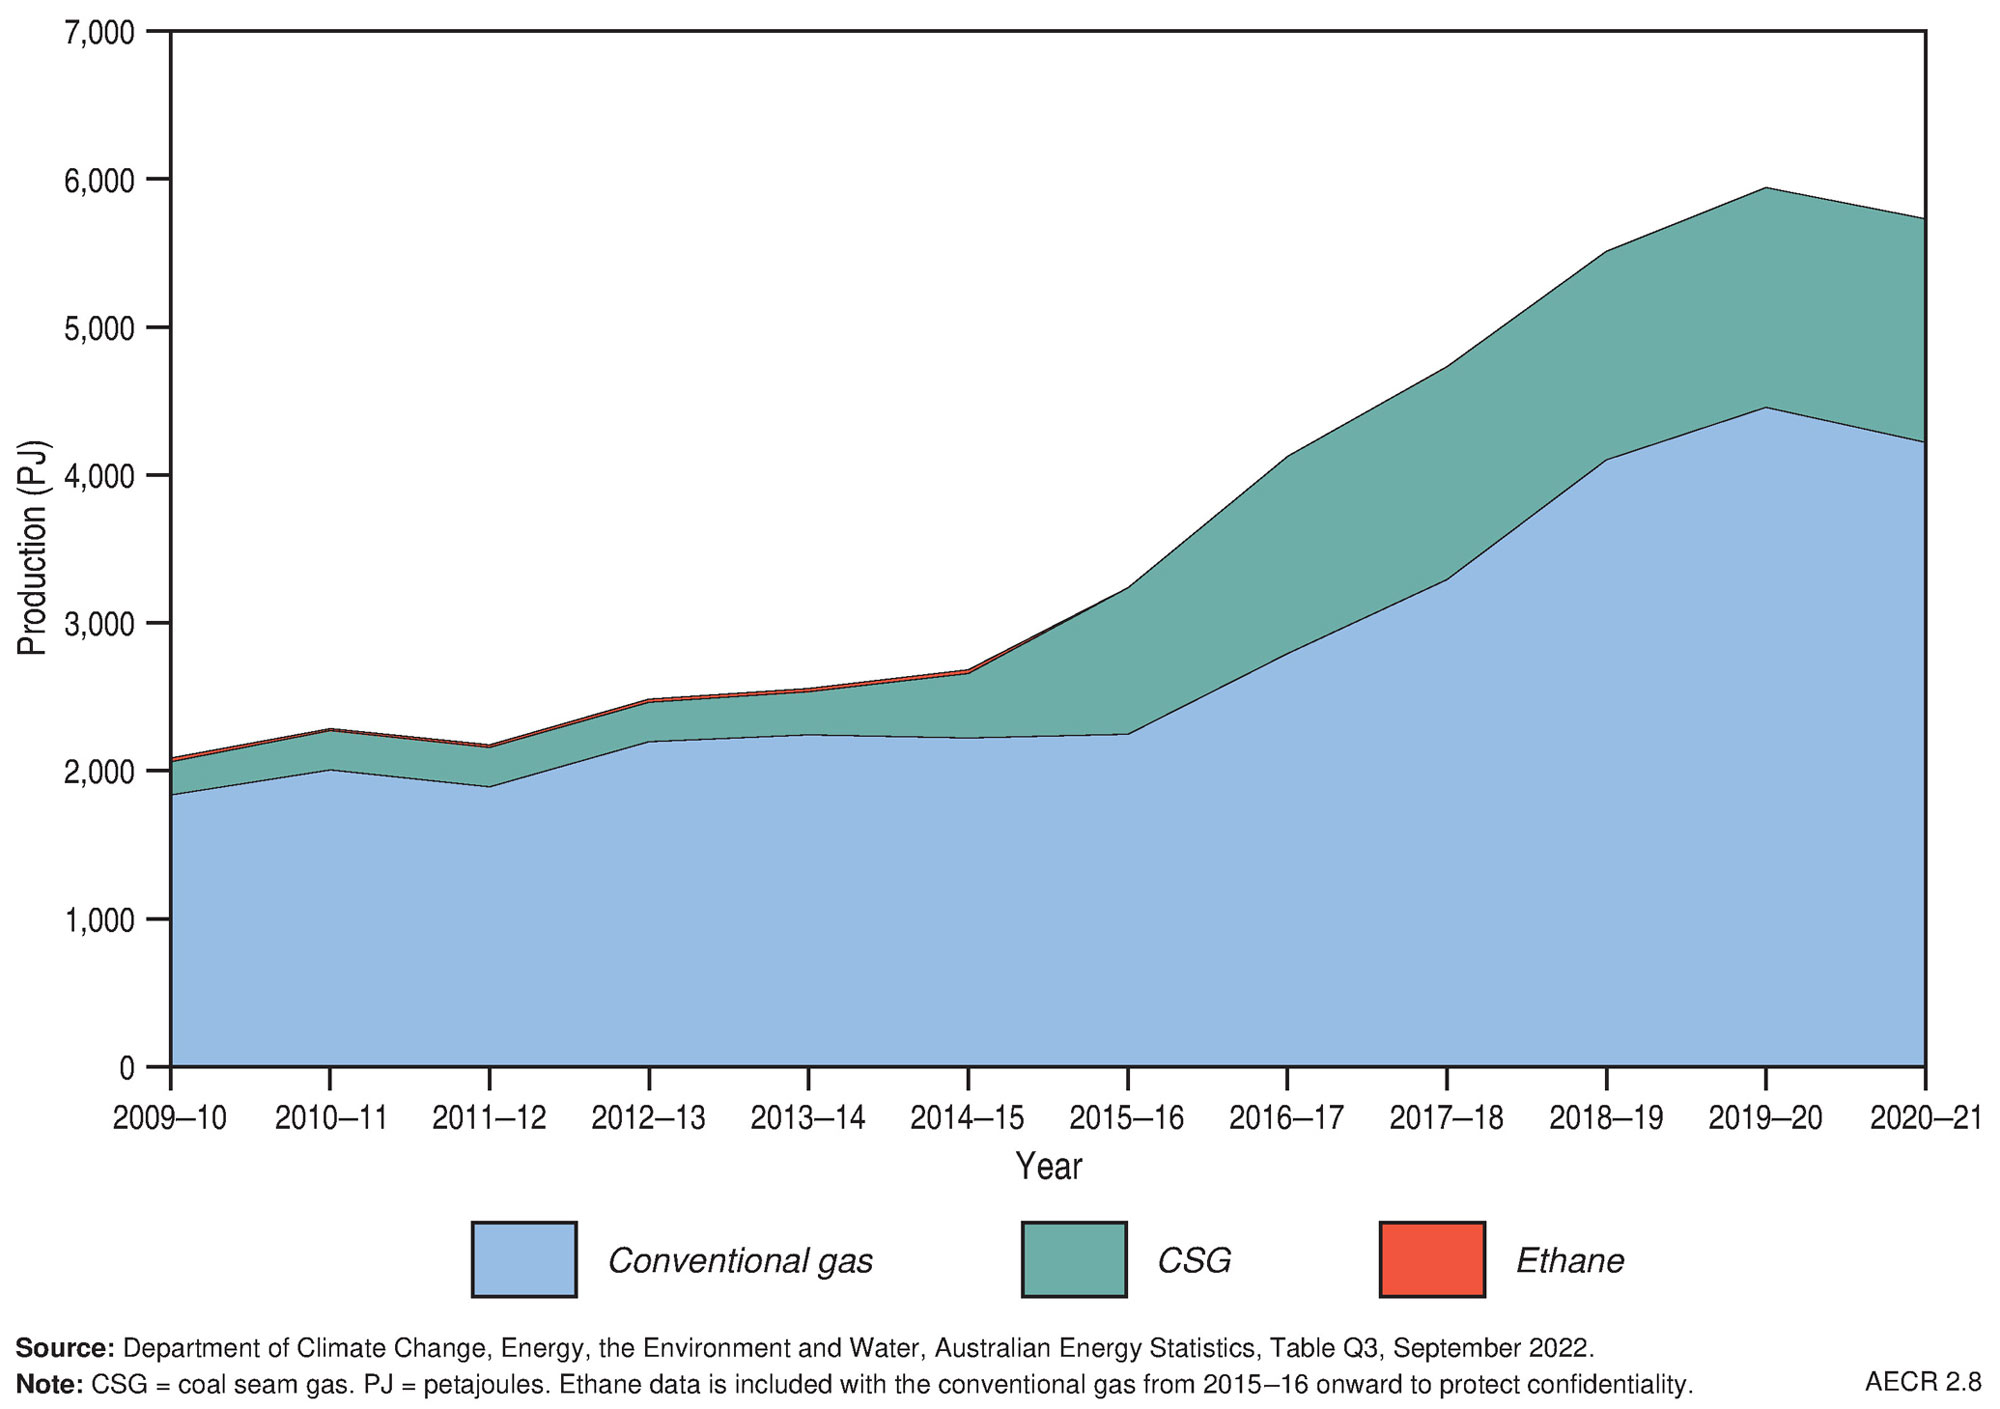
Recent trends in gas production are captured by the Australian Government’s Australian Energy Statistics on a financial year basis (Department of Climate Change, Energy, the Environment and Water, 2022). Natural gas production fell by 3.6 per cent to 5,730 PJ in the 2020–2021 financial year (Figure 3 and Figure 4) due to COVID-related reduced global demand for LNG exports and outages in LNG production at the Gorgon and Prelude facilities, but increased by an average of 9.7 per cent per year over the last decade (Department of Climate Change, Energy, the Environment and Water, 2022).
Conventional gas contributed 74 per cent of natural gas production on an energy content basis (Figure 5; Department of Climate Change, Energy, the Environment and Water, 2022). The significant production growth of CSG since 2014–15 is attributable to the expansion of LNG production from three major CSG to LNG plants near Gladstone, Queensland (Queensland Curtis LNG, Gladstone LNG, and Australia Pacific LNG).
In 2020–21, production of CSG accounted for 26 per cent of Australian gas production (Figure 5), and at 1,510 PJ, over two-thirds of east coast gas production (Department of Climate Change, Energy, the Environment and Water, 2022). Nearly all CSG is produced from the Bowen and Surat basins in Queensland, with a very small amount produced in New South Wales from the Camden Gas Project in the Sydney Basin. CSG production in the Camden Gas Project is scheduled to cease in 2023, as stated by project owners AGL.
Trade
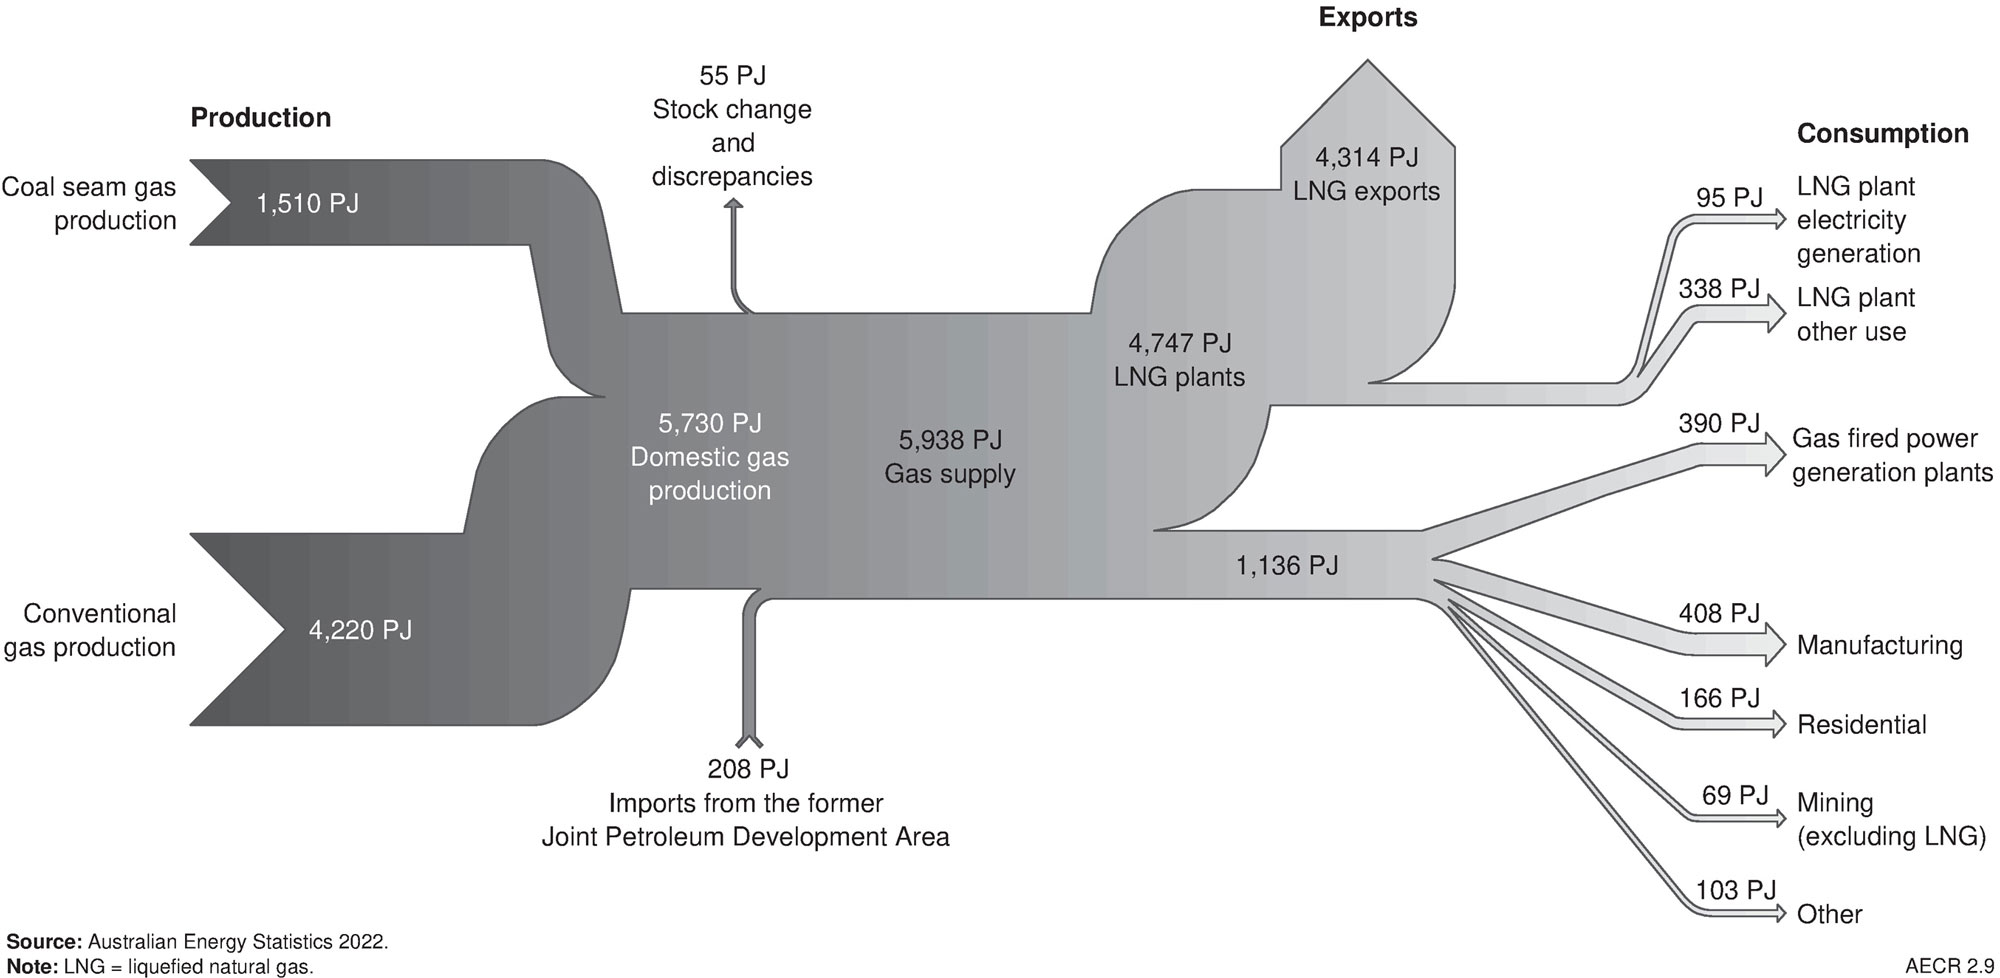
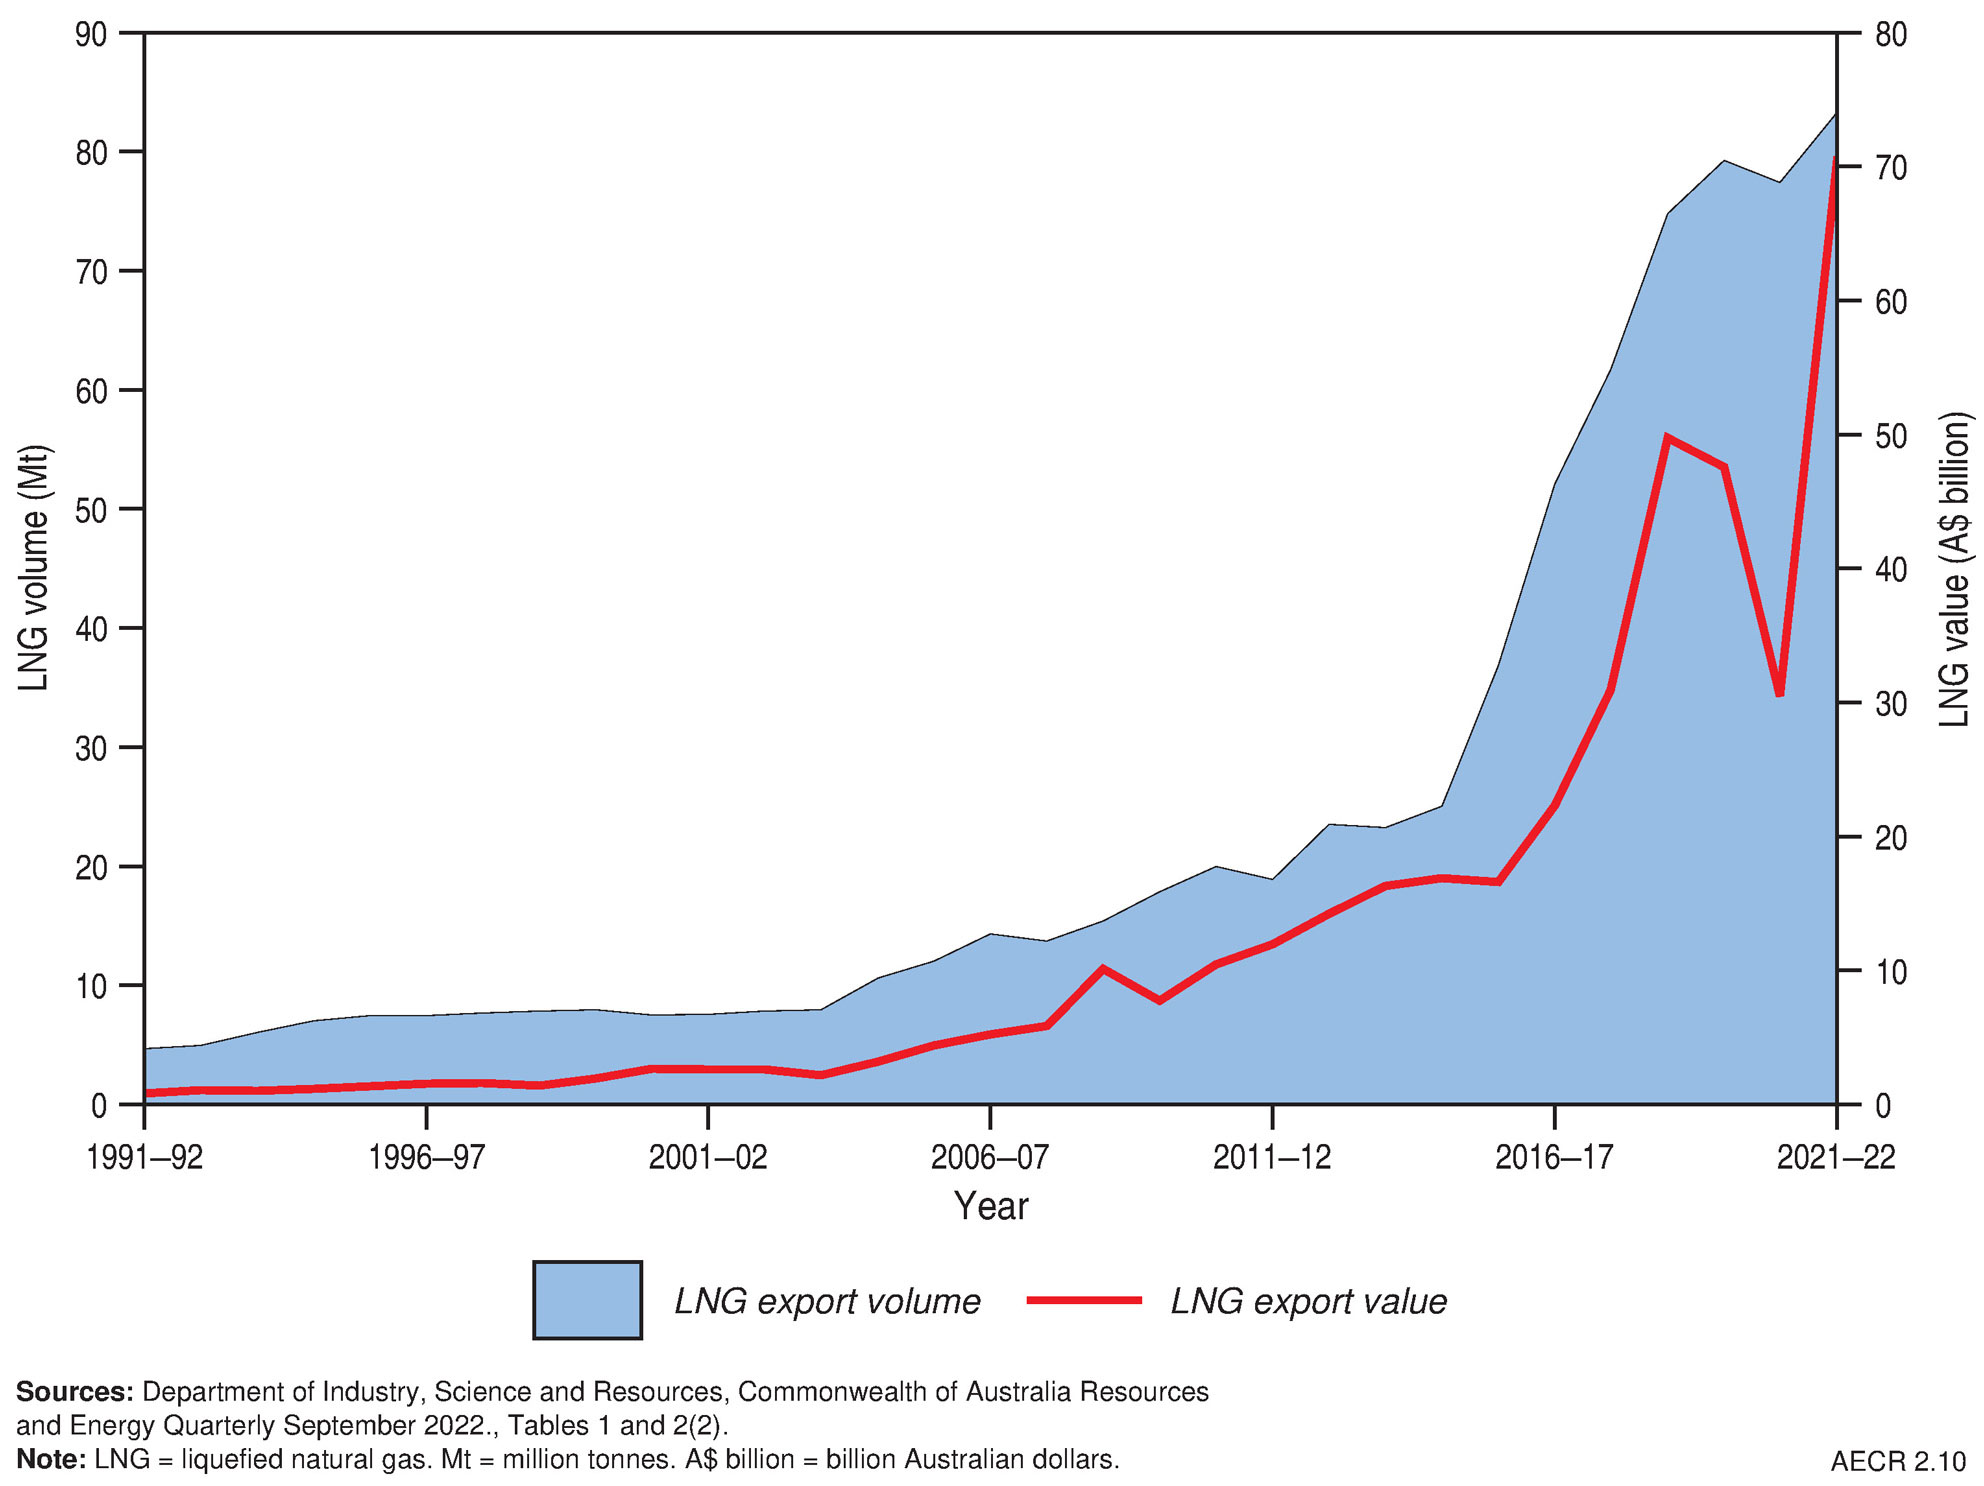
Australia is a substantial net exporter of natural gas (Department of Climate Change, Energy, the Environment and Water, 2022). In 2020–21, about 75 per cent of Australian produced natural gas was exported as LNG (Figure 6). Over the past decade, LNG exports from Australia have increased by an average of 15 per cent a year (Figure 7), with several new facilities commencing production during this period (Department of Climate Change, Energy, the Environment and Water, 2022).
During 2021 Australia’s increase in LNG exports was the seventh highest in the world, after Egypt, the United States, United Arab Emirates, Algeria, Oman and Malaysia (bp, 2022). In 2021–22 Australia’s LNG exports reached a record high of 4,528 PJ (83.2 Mt), maintaining our status as the world’s largest LNG exporter. The high LNG prices incentivised many LNG facilities to operate at or above nameplate capacity (Department of Industry, Science and Resources, 2022). In 2022, Australia’s LNG export earnings reached $90 billion, up 82 per cent from 2021. (Department of Industry, Science and Resources, 2023).
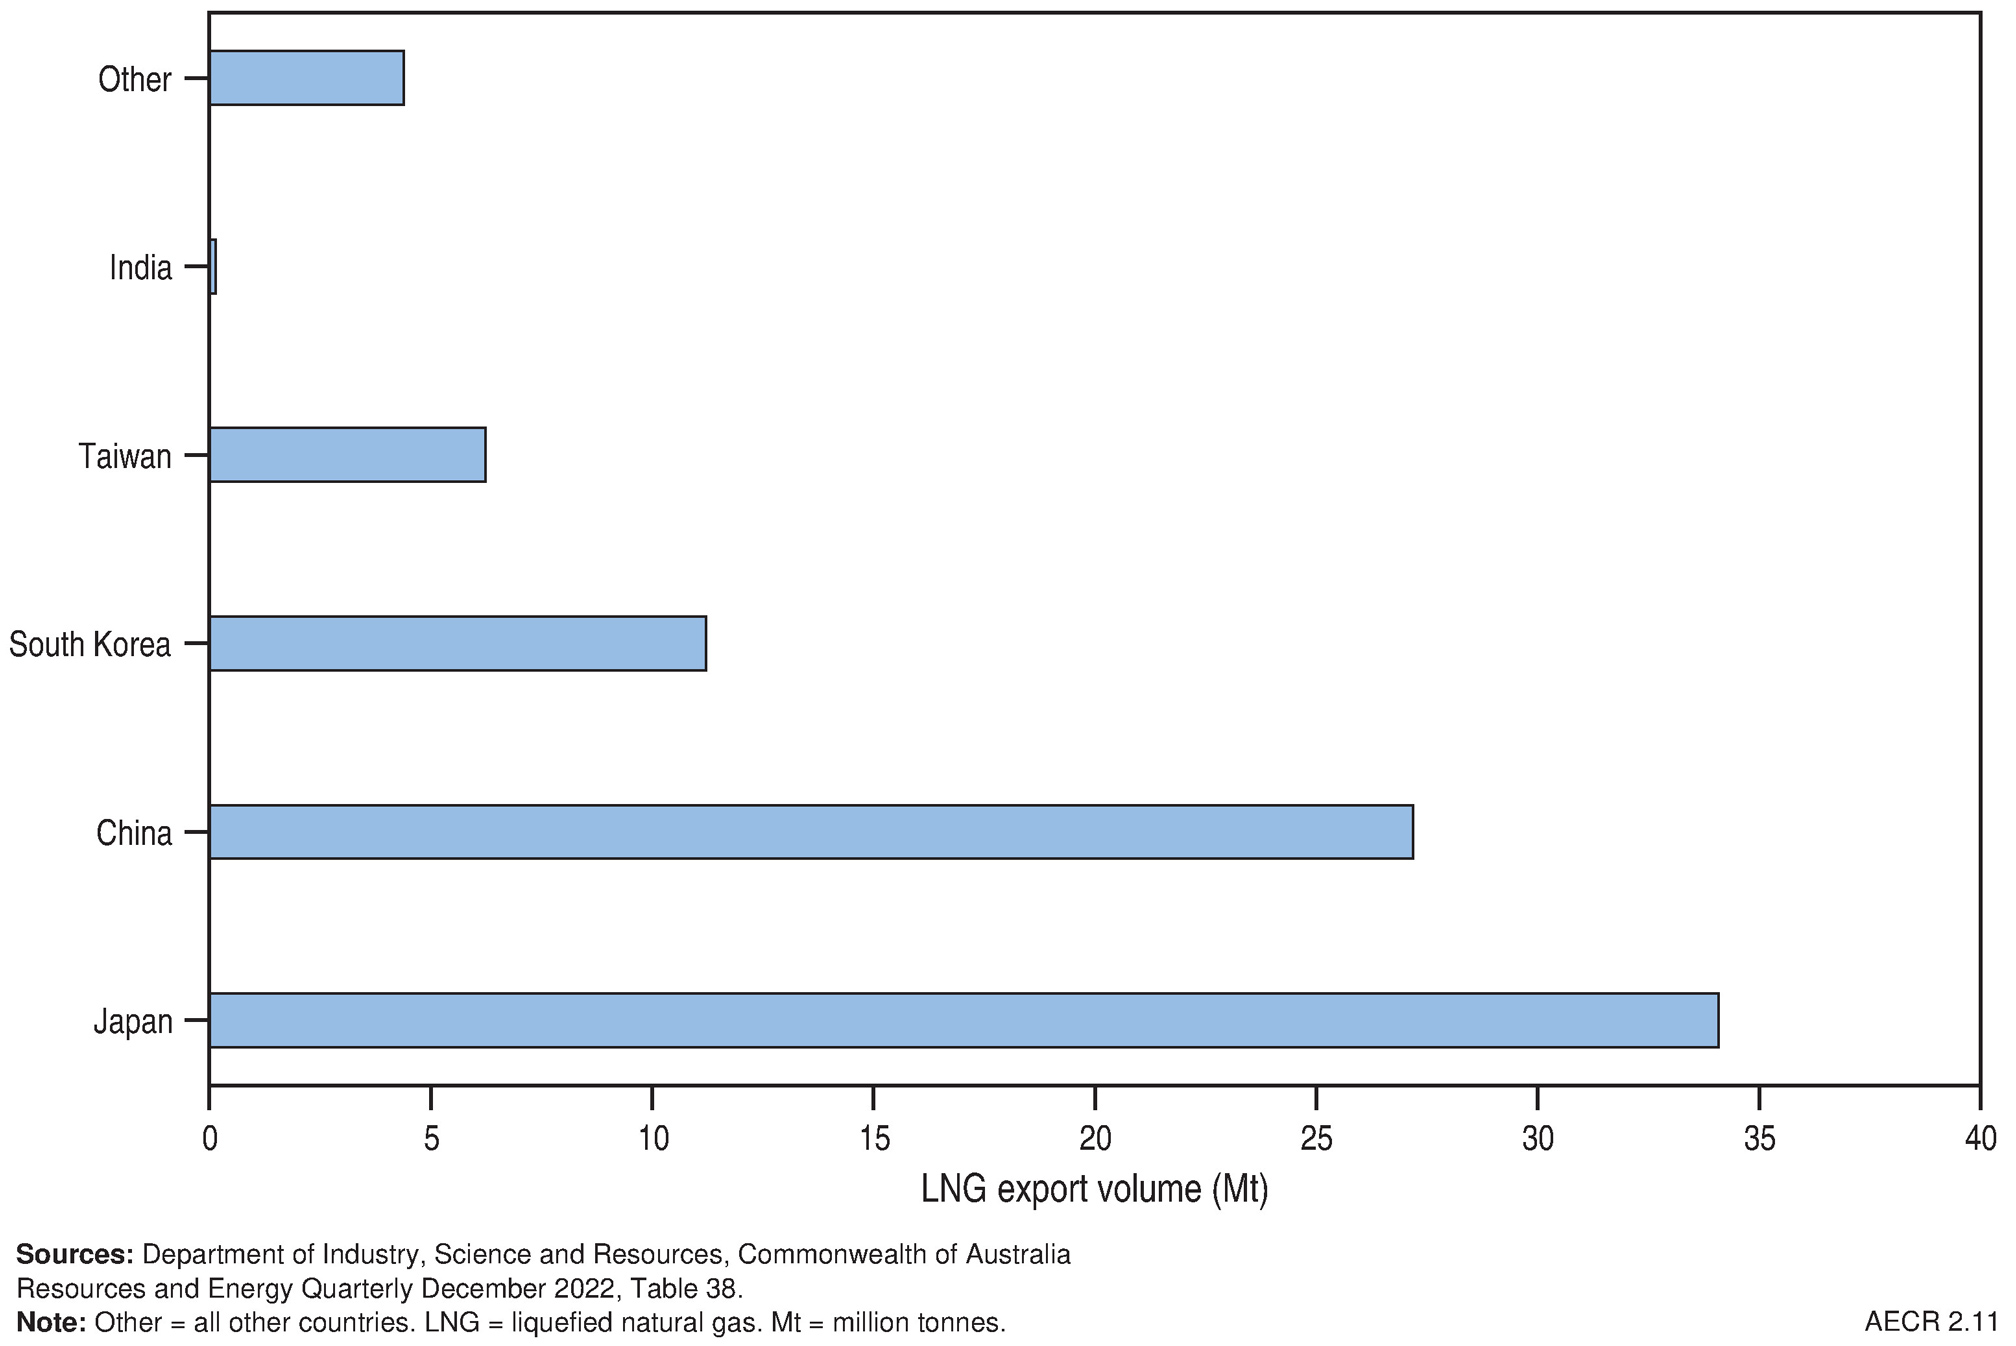
Nearly all of Australia’s LNG exports were delivered to Asian markets in 2020–21 (Figure 8). Japan accounted for 41 per cent (equivalent to 34.1 Mt), followed by China (33 per cent, equivalent to 27.2 Mt) and the Republic of Korea (13 per cent, equivalent to 11.2 Mt; Department of Industry, Science and Resources, 2022).
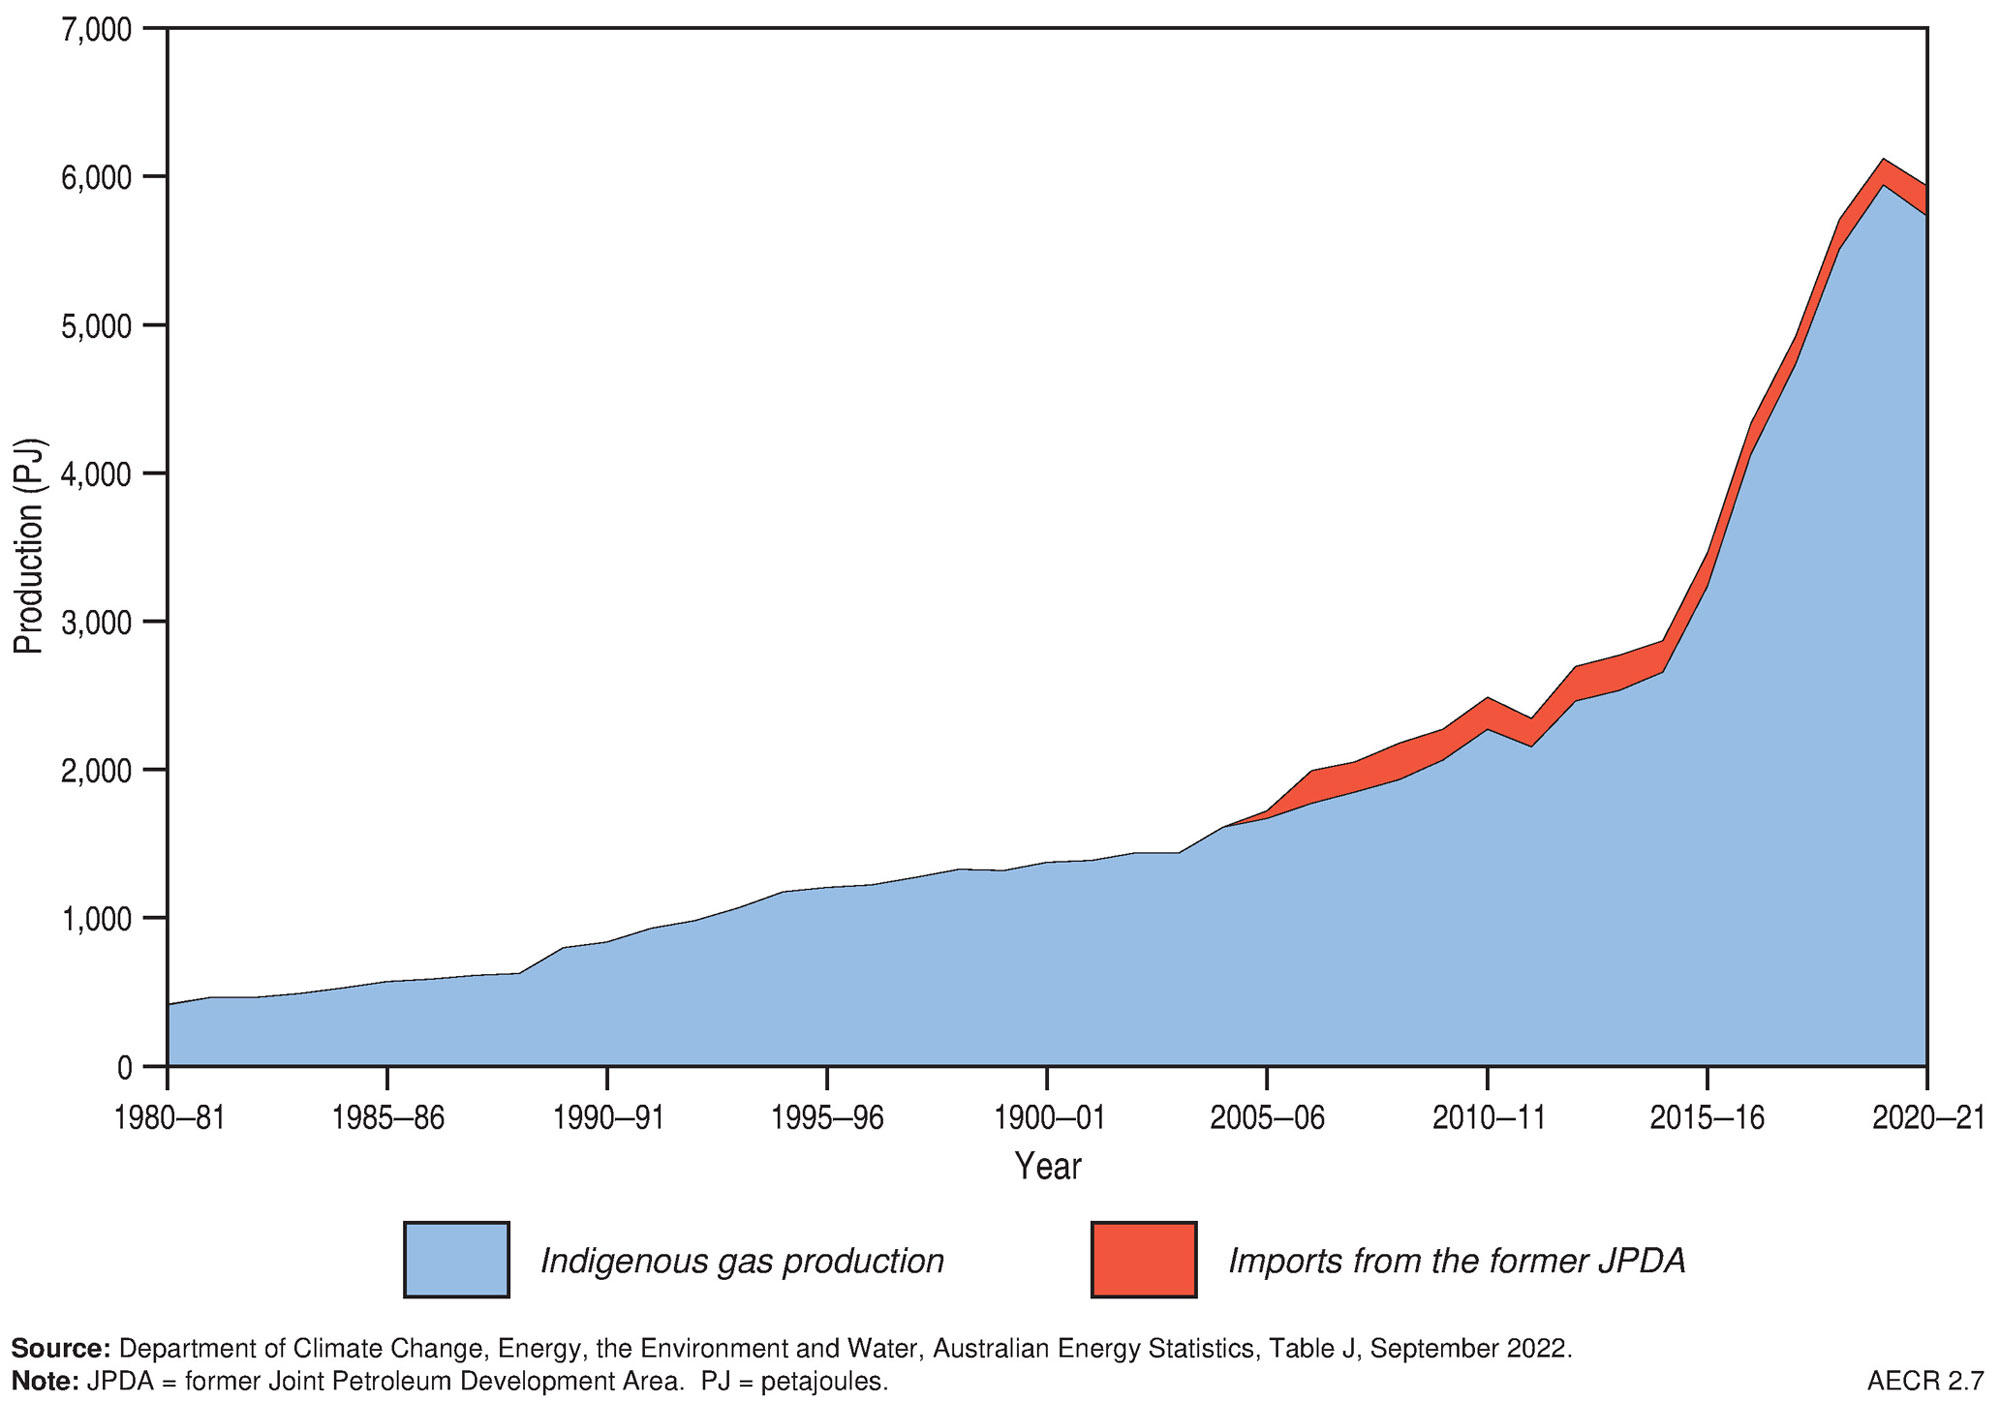
Natural gas imports are the gas produced in the former Joint Petroleum Development Area, which is liquefied in Darwin for export (Department of Climate Change, Energy, the Environment and Water, 2022).
World gas resources
Estimates of worldwide gas reserves for 2021 are not available as BP are undertaking process improvements in their Statistical Review of World Energy and have only been able to publish 2020 world reserve data in their 2022 report (bp, 2022; Table 5). It is most likely that Russia, Iran, and Qatar still hold the largest share of global reserves. Australia’s current global ranking for gas reserves is difficult to determine due to a lack of reported proved (1P) reserves since 2014, when Australia was ranked thirteenth, holding 1.9 per cent of the world’s gas reserves (Geoscience Australia, 2018).
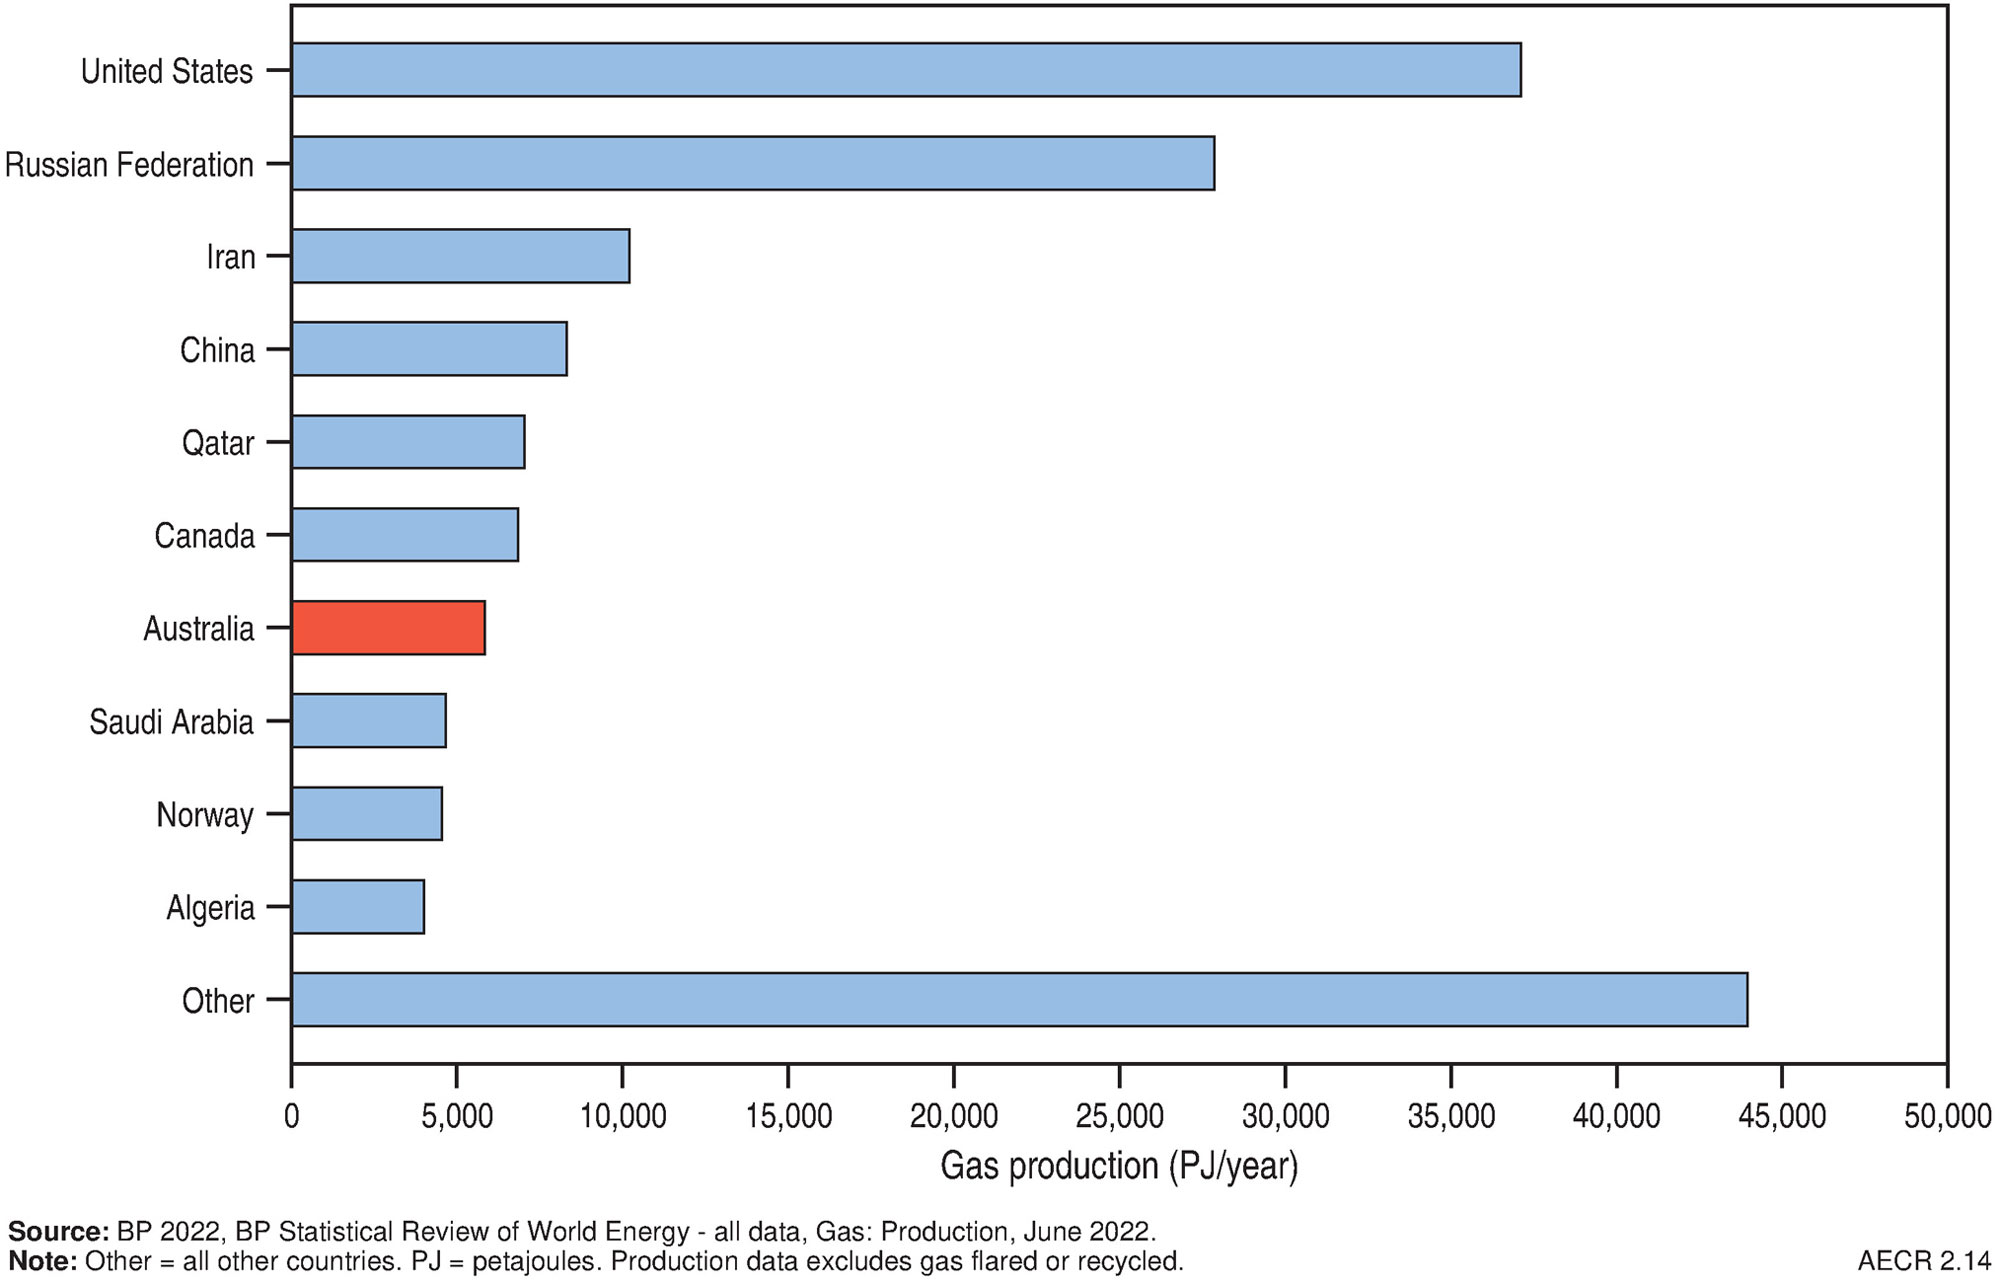
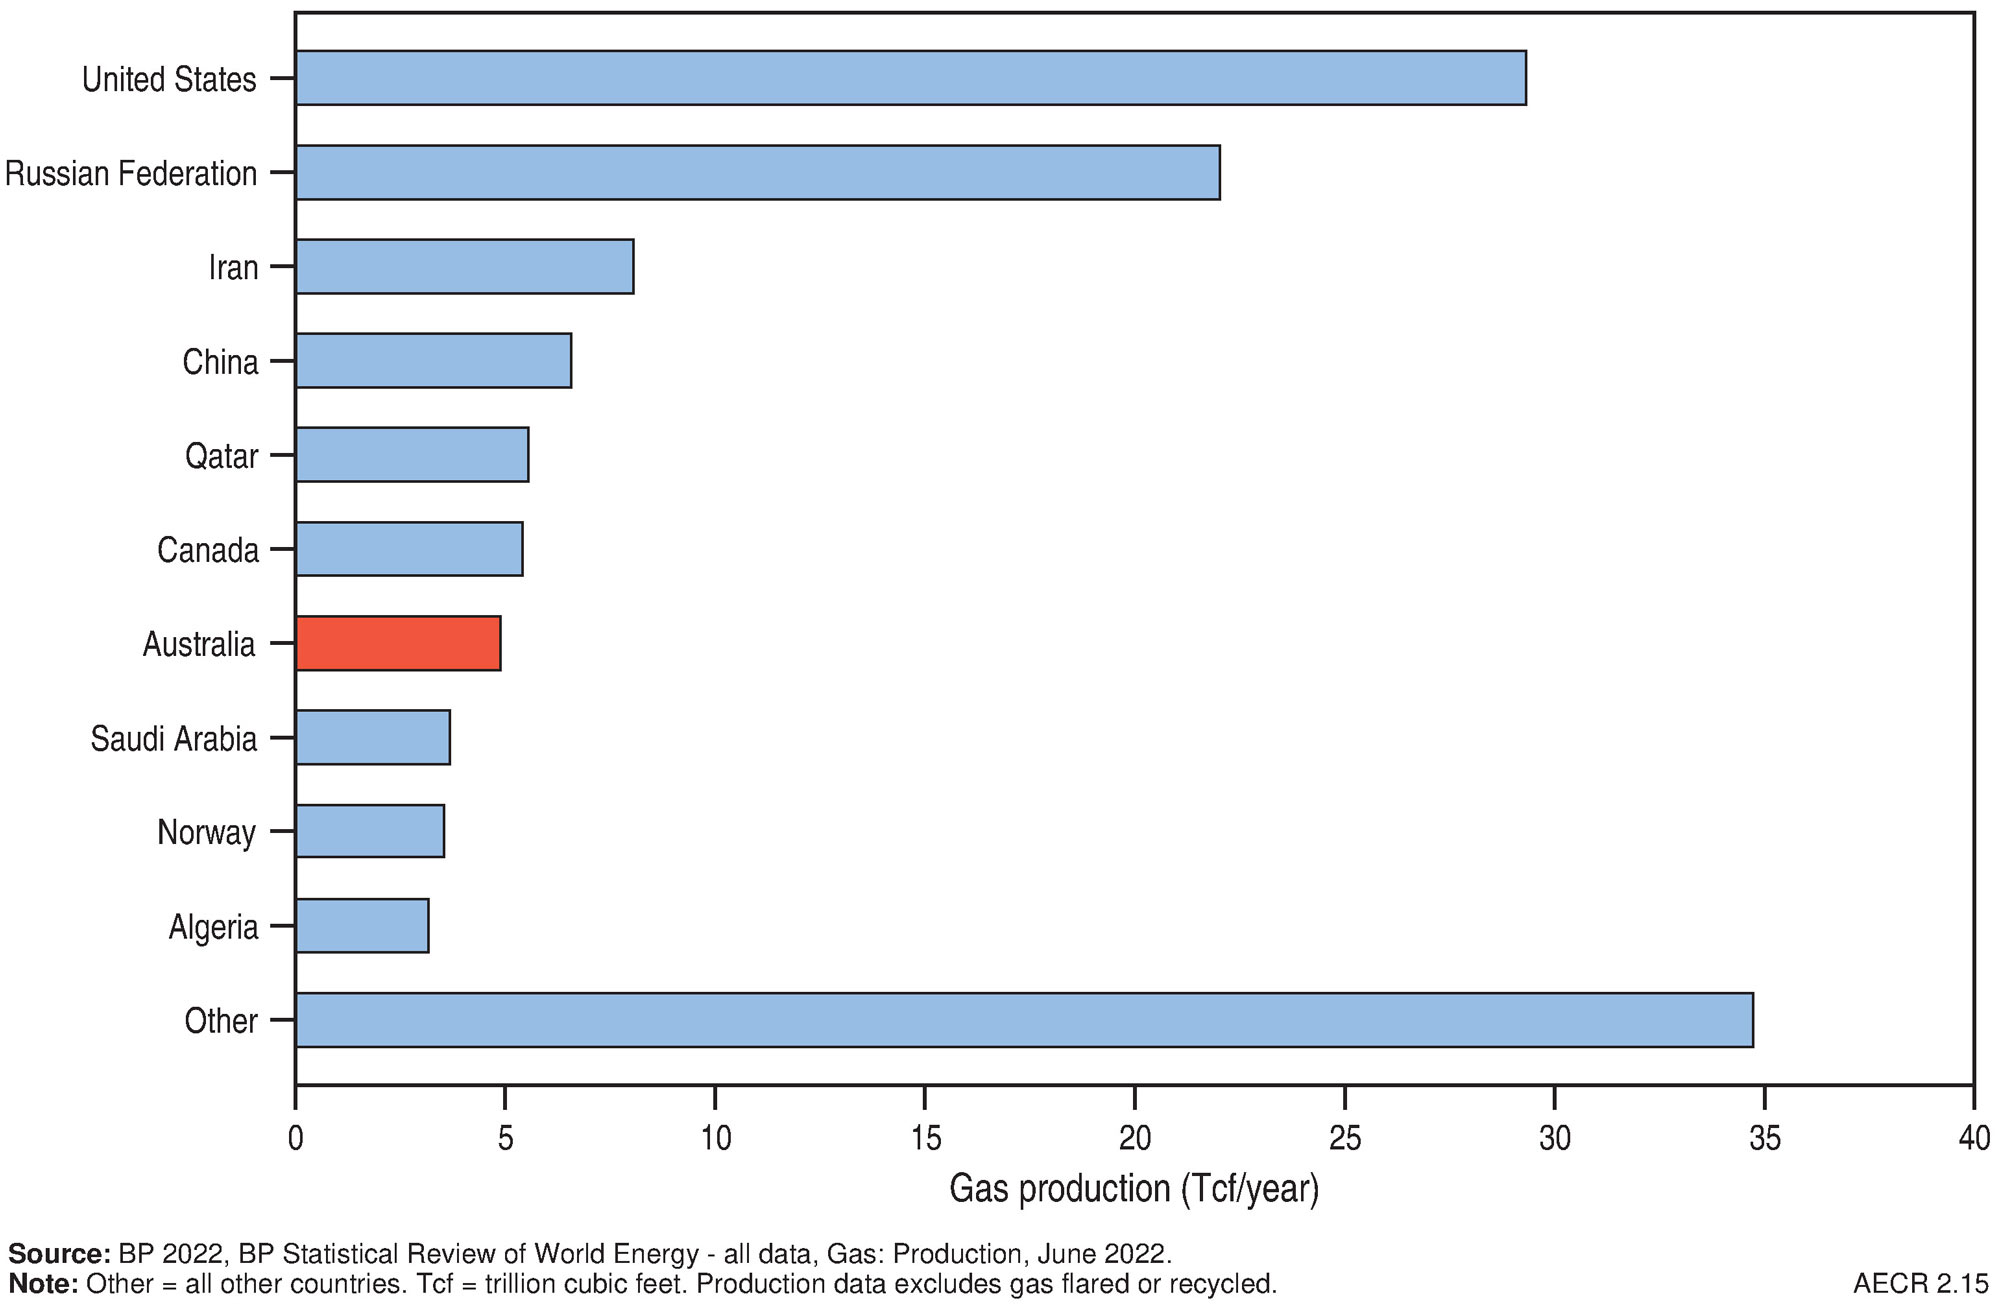
In 2021, world gas production increased by 4.8 per cent to a total of 145,328 PJ (143 Tcf; bp, 2022). Approximately 41 per cent of production came from the US and Russia (Figure 9 and Figure 10). Australia ranked seventh in the world, accounting for 3.6 per cent of total gas production during this period (Table 5).
Global trade of natural gas increased by 8.5 per cent (2.7 Tcf; ~3,082 PJ), along with an 11.6 per cent (1.8 Tcf; 2,046 PJ) increase in pipeline trade. Russian pipeline supply to Europe was steady at 5.9 Tcf (6,633 PJ) in 2021, but exports to the EU decreased by 8.2 per cent (0.4 Tcf; 477 PJ). Global LNG exports increased by 5.6 per cent (0.9 Tcf; 1,036 PJ) in 2021, in line with the 10-year average rate of 4.6 per cent (bp, 2022). Most of the growth in LNG exports occurred in the US (55.4 per cent; 1.2 Tcf; 1,339 PJ), while Australia showed a moderate increase of 2.2 per cent (0.07 Tcf; 81 PJ; bp, 2022).
Table 5. Key gas statistics
| Australia 2021 | OECD 2021 | World 2021 | ||
|---|---|---|---|---|
| Resources | ||||
| Proved Reserves (at end of year) | PJ | na | 729,778b | 6,767,972b |
| Tcf | na | 716.17b | 6,641.78b | |
| Proved plus Probable Reserves (at end of year) | PJ | 113,059a | na | na |
| Tcf | 100.52a | na | na | |
| Production | ||||
| Annual production | PJ | 6,154a | 54,110b | 145,328b |
| Tcf | 5.47a | 53.08b | 142.56b | |
| CAGR from 2011 | % | 10.5b | 2.7b | 2.2b |
| Share of world gas production | % | 3.6b | 37.2b | 100b |
| World ranking | no. | 7b | na | na |
| Exports | ||||
| LNG export volume | PJ | 3,890b | na | 18,584b |
| Tcf | 3.82b | na | 18.23b | |
| CAGR from 2011 | % | 15.3b | na | 4.6b |
| Share of world LNG exports | % | 20.9b | na | 100b |
| World ranking | no. | 1b | na | na |
| LNG export value | A$b | 70.57c | na | na |
Notes: BP gas reserves data are proved reserves while Geoscience Australia data are Proved plus Probable (2P) Reserves. BP are undertaking process improvements in their Statistical Review of World Energy, and have only been able to publish 2020 world reserve data in their 2022 report. As a result the world reserve data in Table 5 are current as of 2020, whilst world production data are current as of 2021. OECD = Organisation for Economic Co-operation and Development countries. na = not available. LNG = liquefied natural gas. CAGR = compound annual growth rate. Tcf = trillion cubic feet. PJ = petajoules. A$b = billion Australian dollars. Source: aGeoscience Australia; bBP (2022) BP Statistical Review of World Energy; cDepartment of Industry, Science, and Resources (2023) Resources and Energy Quarterly, March 23 (Table 2), for Financial year 2021–22.
References
bp 2022. bp Statistical Review of World Energy, 71st edition (Last accessed 02 May 2023).
Department of Climate Change, Energy, the Environment and Water 2022. Australian Energy Statistics (Last accessed 02 May 2023).
Department of Industry, Science and Resources 2022. Resources and Energy Quarterly, December 2022 (Last accessed 02 May 2023).
Department of Industry, Science and Resources 2023 Resources and Energy Quarterly, March 2023 (last accessed 02 May 2023)
Geoscience Australia 2018. Australian Energy Resources Assessment (AERA)
Santos 2012. Santos (2012) Cooper Basin Unconventional Gas Opportunities & Commercialisation: November 2012 (Last accessed 06 May 2023).
Santos 2013. Moomba 191 and beyond (Last accessed 06 May 2023).
Santos 2018. Historical highlights (Last accessed 06 May 2023).
Santos 2022. 2022 First Quarter Report (Last accessed 16 February 2023)
Tamboran Resources 2022. Tamboran increases EP 161 2C contingent gas resources by 164% (last accessed 02 May 2023)
Western Gas 2022a. Operational Update: Valaris MS-1 Rig Arrives at Sasanof-1 Location (Last accessed 16 February 2023)
Western Gas 2022b. Sasanof-1 Well Campaign Completed (Last accessed 16 February 2023)
References for onshore reserves, contingent resources and production data
AGL Energy Limited 2022. Annual Report 2022 (Last accessed 05 May 2023)
Armour Energy Limited 2022. Annual Report For the year ended 30 June 2022 (Last accessed 05 May 2023)
Australian Competition and Consumer Commission 2023. Gas Inquiry 2017–2025 Interim Report - January 2023 Table A.2 Reserves and Resources estimates as at 30 June 2022 (Last accessed 05 May 2023)
Australian Energy Market Operator 2020. 2020 Inputs and assumptions workbook, December 2020 (last accessed 05 May 2023)
Department of Industry, Science, Energy and Resources 2021. Australian Petroleum Statistics Data Extract December 2021 https://www.energy.gov.au/publications/australian-petroleum-statistics-2021 (Last accessed 05 May 2023)
Beach Energy Limited 2021. Enterprise Success Delivers Material 2P Reserve Booking (Last accessed 05 May 2023)
Beach Energy Limited 2021. FY21 Fourth Quarter Activities Report (Last accessed 05 May 2023)
Beach Energy Limited 2022. FY22 Second Quarter Activities Report (Last accessed 05 May 2023)
Beach Energy Limited 2022. Annual Report 2022 (Last accessed 05 May 2023)
Bengal Energy 2022. Bengal Energy Announces Independent Oil and Natural Gas Resource Report (Last accessed 05 May 2023)
Black Mountain Energy 2021. Prospectus (Last accessed 05 May 2023)
Blue Energy Limited 2022. 2022 Annual Report (Last accessed 05 May 2023)
Buru Energy Limited 2018. Independent Assessment of Resources at the Yulleroo Field 18 January 2018 (Last accessed 05 May 2023)
Buru Energy Limited 2022. Rafael resources report confirms major gas potential (Last accessed 05 May 2023)
Carnarvon Energy 2022. Corporate presentation - Good Oil Conference (Last accessed 05 May 2023)
Central Petroleum Limited 2022. 2022 Annual Report (Last accessed 05 May 2023)
Comet Ridge Limited 2022. Annual Report 2022 (Last accessed 05 May 2023)
Cooper Energy Limited 2022. Annual Report 2022 (Last accessed 05 May 2023)
Denison Gas 2022. Reserves and Resources as at 30 June 2022 (Last accessed 05 May 2023)
Emperor Energy Limited 2022. Presentation for PESA Deal Day Brisbane (Last accessed 05 May 2023)
Empire Energy Group Limited 2021. Substantial Resources and Reserves Increase (Last accessed 05 May 2023)
Empire Energy Group Limited 2022. 2021 Annual Report (Last accessed 05 May 2023)
Galilee Energy Limited 2022. Annual Report 2022 (Last accessed 07 May 2023)
GB Energy 2019. Annual Report 2020 (Last accessed 07 May 2023)
Icon Energy Limited 2015. Quarterly Activities Report 31-Jul-2015 (Last accessed 07 May 2023)
Icon Energy Limited 2022. 2022 Annual Report (Last accessed 08 May 2023)
Lakes Blue Energy NL 2022. Annual Report for the year ended 30 June 2022 (Last accessed 07 May 2023)
Metgasco Ltd 2022. 2022 Annual Report (Last accessed 07 May 2023)
NeuRizer Ltd (formerly Leigh Creek Energy Limited) 2021. Annual Report 2021 (Last accessed 10 May 2023)
New Hope Corporation 2022. Bridgeport Energy Limited- 2022 Petroleum Reserves and Contingent Resources statement (Last accessed 07 May 2023)
Northern Territory Department of Industry, Tourism and Trade 2022. NT onshore oil and gas production data (Last accessed 07 May 2023)
Northern Territory Geological Survey (NTGS) 2023. NT Resourcing The Territory Shale Gas and Liquids Factsheet April 2023 (Last accessed 07 May 2023)
Northern Territory Geological Survey (NTGS) 2023. NT Resourcing The Territory Conventional Oil and Gas Factsheet April 2023 (Last accessed 07 May 2023)
Origin Energy Limited 2021. 2021 Annual Report (Last accessed 07 May 2023)
Origin Energy Limited 2022. 2022 Annual Report (Last accessed 07 May 2023)
Pilot Energy 2022. Annual Report 2022 (Last accessed 07 May 2023)
Pure Hydrogen Corporation Limited 2022. Annual Report 2022 (Last accessed 07 May 2023)
Pure Hydrogen Corporation Limited 2022. Windorah Gas Project, Cooper Basin (Last accessed 07 May 2023)
Red Sky Energy Limited 2022. Presentation to Good Oil Conference (Last accessed 07 May 2023)
Santos Limited 2020. 2021 Fourth Quarter Report Data Tables (Last accessed 07 May 2023)
Santos Limited 2021. Annual Report 2021 (Last accessed 07 May 2023)
State Gas Limited 2021. Resource Estimates and Final Rougemont Well Results (Last accessed 07 May 2023)
Strike Energy Limited 2020. Exploration Portfolio Update (Last accessed 07 May 2023)
Strike Energy Limited 2022. Independent certification of Ocean Hill gas resource (Last accessed 07 May 2023)
Strike Energy Limited 2022. Independent certification of Walyering reserves (Last accessed 07 May 2023)
Strike Energy Limited 2022. Independent certification of South Erregulla Kingia gas discovery (last accessed 07 May 2023)
Strike Energy Limited 2022. Independent certification of South Erregulla Wagina gas discovery (last accessed 07 May 2023)
Strike Energy Limited 2022. West Erregulla Reserves upgraded by 41% (last accessed 07 May 2023)
Tamboran Resources Limited 2022. 2022 Annual Report (Last accessed 07 May 2023)
Tamboran Resources Limited 2022 Tamboran increases EP161 2C contingent gas resources by 164% (Last accessed 16 February 2023)
Vic Geological Survey of Victoria 2022. Earth Resources Regulation Annual Statistical Report FY2021-22 (Last accessed 07 May 2023)
Vintage Energy Ltd 2022 Annual Report 2022 (Last accessed 07 May 2023)
Published prospective resource estimates (2021 reporting year)
Amadeus Basin
Central Petroleum Limited 2022. 2022 Annual Report (Last accessed 05 May 2023)
Northern Territory Geological Survey (NTGS) 2023. NT Resourcing The Territory Shale Gas and Liquids Factsheet April 2023 (Last accessed 07 May 2023)
Northern Territory Geological Survey (NTGS) 2023. NT Resourcing The Territory Conventional Oil and Gas Factsheet April 2023 (Last accessed 07 May 2023)
Bamaga Basin
Fisher, W.S. 2021. The Bamaga Basin: a frontier play in a non-frontier location. The APPEA Journal 2021, 61, 192–204
Gulf Energy 2022. Projects (Last accessed 08 May 2023)
Bonaparte Basin
Melbana Energy 2021. Bonaparte Gulf - Beehive (Last accessed 08 May 2023)
Melbana Energy 2021. Vulcan Sub-basin Exploration (Last accessed 08 May 2023)
Canning Basin
Black Mountain Energy 2021. Prospectus (Last accessed 05 May 2023)
Buru Energy Limited 2018. Independent Assessment of Resources at the Yulleroo Field 18 January 2018 (Last accessed 08 May 2023)
Buru Energy Limited 2022. Rafael-resources-report-confirms-major-gas-potential (Last accessed 05 May 2023)
Cooper-Eromanga Basin
Bengal Energy 2022. Bengal Energy Announces Independent Oil and Natural Gas Resource Report (Last accessed 05 May 2023)
Icon Energy Limited 2022. 2022 Annual Report (Last accessed 08 May 2023)
Georgina Basin
Northern Territory Geological Survey (NTGS) 2023. NT Resourcing The Territory Shale Gas and Liquids Factsheet April 2023 (Last accessed 07 May 2023)
Northern Territory Geological Survey (NTGS) 2023. NT Resourcing The Territory Conventional Oil and Gas Factsheet April 2023 (Last accessed 07 May 2023)
Gippsland Basin
3D Oil Limited 2021.Update to VIC/P74 Prospective Resource Estimates (Last accessed 08 May 2023)
Cooper Energy 2021. RIU Good Oil and Gas Energy Conference (Last accessed 08 May 2023)
Cooper Energy 2022. Grant of Gippsland Basin exploration permit VIC/P80 (Last accessed 08 May 2023)
Emperor Energy 2021. Positive Initial Results of AVO Analysis 3D Seismic Data (Last accessed 08 May 2023)
Emperor Energy 2022. Presentation for PESA Deal Day, Brisbane (Last accessed 08 May 2023)
Geological Survey of Victoria 2021b. Conventional gas prospectivity assessment and resource estimation, Onshore Gippsland Basin, Victoria (Last accessed 08 May 2023)
Lakes Blue Energy NL 2022. Annual Report for the year ended 30 June 2022 (Last accessed 07 May 2023)
McArthur Basin (including Beetaloo Sub-basin)
Empire Energy Group Limited 2021. 2021 Annual Report (Last accessed 05 May 2023)
Empire Energy Group Limited 2022. Substantial Resources and Reserves Increase (Last accessed 05 May 2023)
Northern Territory Geological Survey (NTGS) 2023. NT Resourcing The Territory Shale Gas and Liquids Factsheet April 2023 (Last accessed 07 May 2023)
Northern Territory Geological Survey (NTGS) 2023. NT Resourcing The Territory Conventional Oil and Gas Factsheet April 2023 (Last accessed 07 May 2023)
Tamboran Resources Limited 2022. 2022 Annual Report (Last accessed 07 May 2023)
Northern Carnarvon Basin
Bounty Oil and Gas NL 2021. Cerberus Farmin Agreement, Carnarvon Basin, Western Australia and Placement to Raise $2.74 Million (Last accessed 08 May 2023)
Finder Energy 2022. Corporate Presentation, 6 April 2022 (Last accessed 08 May 2023)
Tamaska Oil & Gas Limited 2021. Napoleon Prospect Technical Report (Last accessed 08 May 2023)
Otway Basin
3D Oil Limited 2017. Annual Report 2017 (Last accessed 08 May 2023)
3D Oil Limited 2022. VIC/P79 Prospectivity Update, Otway Basin (Last accessed 08 May 2023)
Armour Energy 2022. Enterprise North – Project Update (Last accessed 08 May 2023)
Geological Survey of Victoria 2021a. Conventional gas prospectivity assessment and resource estimation, Onshore Otway Basin, Victoria (Last accessed 08 May 2023)
Perth Basin
Strike Energy Limited 2022. Independent certification of Walyering reserves (Last accessed 07 May 2023)
Strike Energy Limited 2022. West Erregulla Reserves upgraded by 41% (last accessed 07 May 2023)
Triangle Energy (Global) Limited 2021. Mt Horner L7 (R1) Prospective Resources Update (Last accessed 08 May 2023)
Triangle Energy (Global) Limited 2022. Annual Report 2022 for the year ended 30 June 2022 (Last accessed 08 May 2023)
Roebuck Basin
Carnarvon Petroleum Ltd 2021. Bedout Basin Update (Last accessed 08 May 2023)
South Nicholson Basin
Northern Territory Geological Survey (NTGS) 2023. NT Resourcing The Territory Shale Gas and Liquids Factsheet April 2023 (Last accessed 07 May 2023)
Surat Basin
Pure Hydrogen Corporation Limited 2022. Annual Report 2022 (Last accessed 07 May 2023)
Data download
Australia's Energy Commodity Resources Data Tables - 2021 reporting period
1 Offshore data provided by NOPTA to year-end 2021; onshore data are sourced from government statistics and company estimates reported at various dates between June 2021 and June 2022.