

Introduction
This is the third edition of Geoscience Australia’s assessment of Australia’s Energy Commodity Resources (AECR 2023). AECR 2023 provides estimates of the nation’s energy commodity resources as at the end of 2021. Resource estimates are grouped according to commodity type, reserves and annual production.
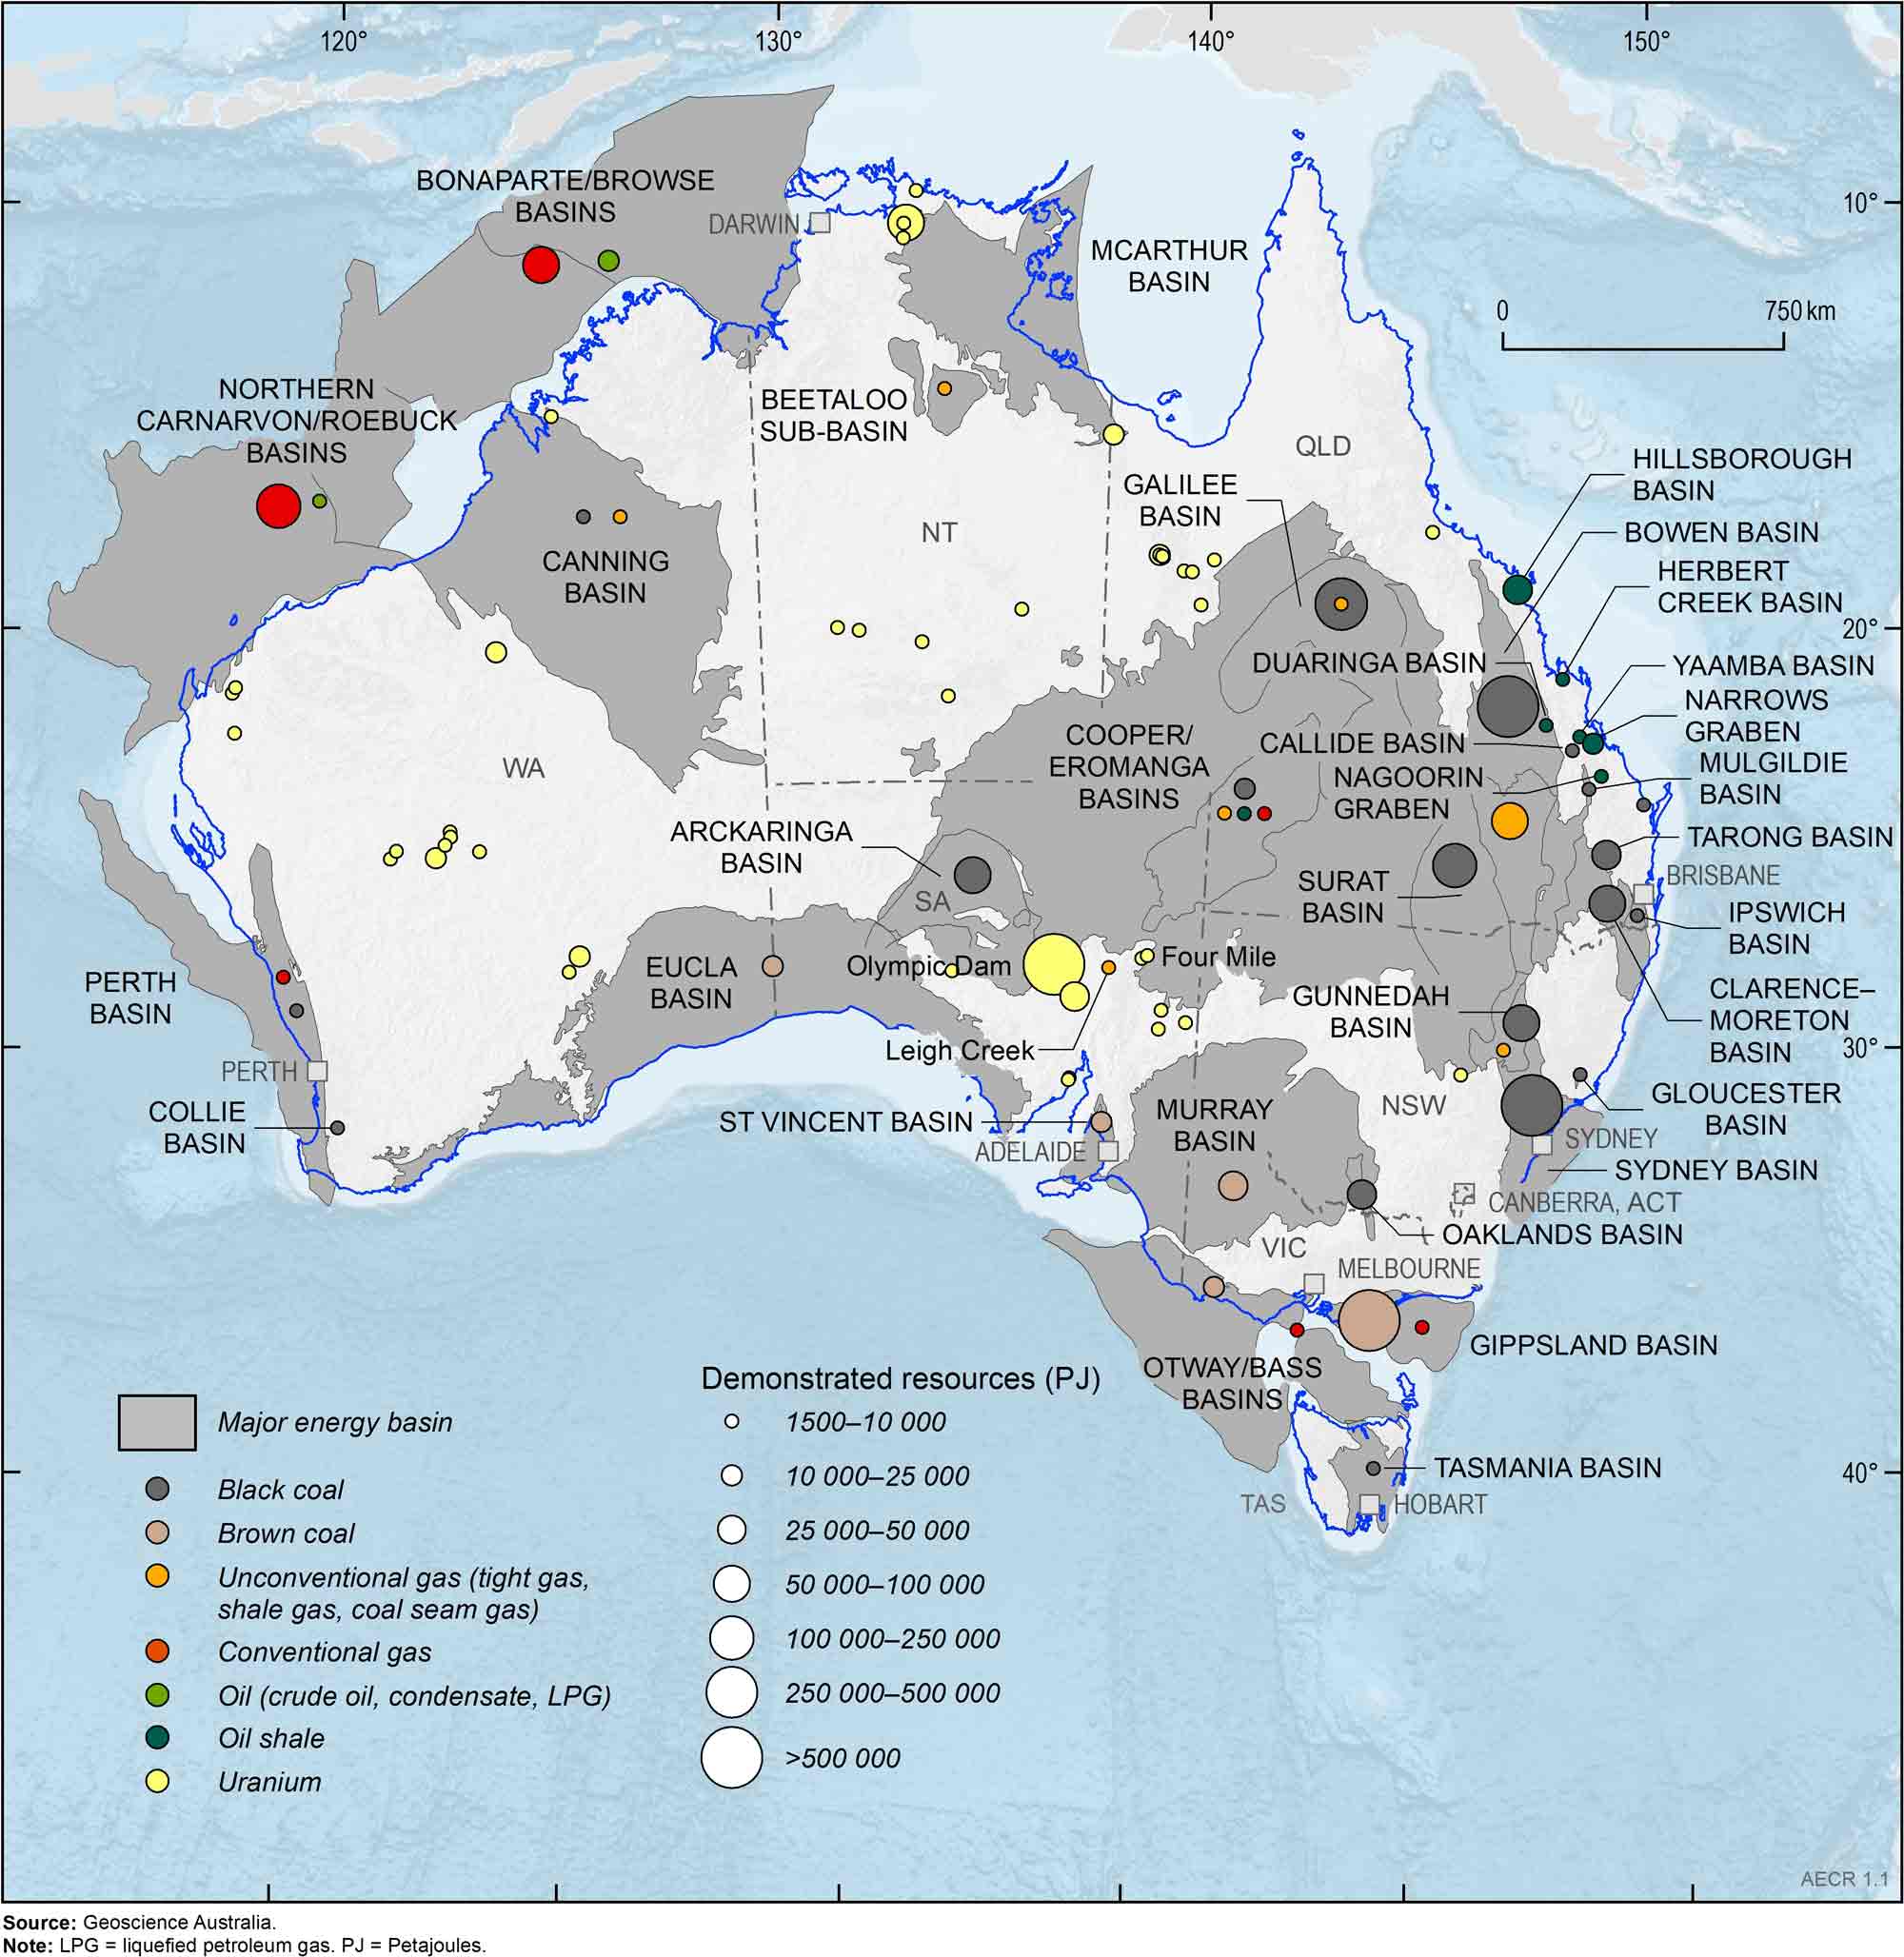
Australia remains a key global net energy exporter and producer with a strong and diverse mix of energy resources across the continent (Figure 1). Our global share of energy production in 2021 included 8 per cent of uranium commodities, 7 per cent of coal commodities and 4 per cent of gas commodities.
In 2021 Australia’s total demonstrated energy commodity resources increased by 0.2 per cent (14,773 PJ; Table 1). Most of this growth was associated with a 1.2 per cent (25,115 PJ) increase in the TDR for black coal and a 4.0 per cent (2,185 PJ) increase in the TDR for coal seam gas. While the TDR for conventional gas dropped by 2.3 per cent (4,413 PJ), the proven and probable reserves increased by 15.6 per cent (11,225 PJ) following final investment decisions on the offshore Barossa and Scarborough gas projects. There was also an increase in proven and probable reserves for coal seam gas during 2021 by 2.8 per cent (818 PJ), due to the reserves in the Bowen and Surat basins being upgraded. Australia’s oil resources continued their long-term decline, with crude oil TDR decreasing by 12.7 per cent (659 PJ).
Production of Australia’s energy commodity resources in 2021 continued the decline as seen in 2020 with an overall fall of 9.7 per cent (2,252 petajoules [PJ]; Table 1). This was despite a global increase in primary energy demand in 2021 of 5.8 per cent as reported by BP (2022). The fall in Australia’s energy commodity production during 2021 was due to ongoing COVID-19 related factors, together with other technical issues, trade sanctions and weather-related issues.
In 2021 there were major production declines for uranium (38.4 per cent; 1,331 PJ) due to the closure of the Ranger mine, and crude oil (14.0 per cent; 48 PJ) due to the ageing status of Australia’s remaining oil fields. Natural gas production (conventional and coal seam gas) dropped only slightly by 0.4 per cent (25 PJ) between 2020 and 2021, due in part to production outages at the Gorgon and Prelude LNG facilities. Black coal production declined by 6.9 per cent (848 PJ) during the 2020–21 financial year in response to trade restrictions by China and weather-related disruptions to production as reported in the Australian Energy Statistics Report (Department of Climate Change, Energy, the Environment and Water, 2022a). However, black coal production increased overall by 2 per cent during the 2021 calendar year as reported in Australia’s Identified Mineral Resources (Hughes et al., 2023).
Australia’s energy commodity resources proceeded to diversify during 2021 providing wide-ranging investment opportunities as the world transitions to net zero emissions by 2050. Clean energy projects continue to expand across Australia to meet the growing domestic and global demand for net zero energy resources. Currently, Australia has 22 hydrogen projects that are operational or under construction, and an additional 88 in development. Further, with the world looking at carbon capture and storage solutions, exploration and development of CCS projects are being considered a key necessity for meeting Australian and global emissions reduction targets and a clean energy future. Australia currently has one industrial-scale operating facility at Gorgon, and eight full-chain capture-to-geological-storage projects in various stages of development across the country.
Table 1. Australia's total demonstrated non-renewable energy resources (2014/16, 2018, 2019, 2020 and 2021) and estimated resources life in 2021
| Resource | Unit | Note | TDR 2014/2016 | TDR 2018 | TDR 2019 | TDR 2020 | TDR 2021 | % TDR Growth 2020-21 | Production 2021 | % Production Growth 2020-21 | Resource Life 2021 |
|---|---|---|---|---|---|---|---|---|---|---|---|
| Crude oil | PJ | 1, 2 | 7,066 | 6,474 | 5,661 | 5,205 | 4,546 | -12.7 | 258 | -14.0 | 18 |
| Condensate | PJ | 1, 2 | 16,463 | 16,213 | 15,951 | 15,448 | 15,581 | 0.9 | 432 | -1.5 | 36 |
| LPG | PJ | 1, 2 | 5,957 | 1,483 | 1,421 | 1,207 | 1,155 | -4.3 | 48 | 2.1 | 24 |
| Oil shale | PJ | 1, 2 | 0 | 84,436 | 84,436 | 84,436 | 84,436 | 0 | 0 | 0.0 | na |
| Unconventional oil (undifferentiated) | PJ | 1, 2 | 0 | 335 | 335 | 404 | 369 | -8.7 | 0 | 0.0 | na |
| Conventional gas | PJ | 1, 2 | 186,235 | 194,239 | 196,133 | 192,252 | 187,839 | -2.3 | 4,543 | -1.1 | 41 |
| Coal seam gas | PJ | 1, 2 | 79,450 | 63,732 | 58,248 | 55,131 | 57,316 | 4.0 | 1,611 | 1.6 | 36 |
| Coal seam gasification | PJ | 1 | na | 1,469 | 2,622 | 2,622 | 2,622 | 0.0 | 0 | 0.0 | na |
| Unconventional gas (undifferentiated) | PJ | 1, 2 | 14,000 | 13,426 | 12,203 | 12,252 | 10,194 | -16.8 | 0 | 0.0 | na |
| Black coal | PJ | 3, 4, 5 | 1,999,669 | 2,066,612 | 2,085,362 | 2,021,599 | 2,046,714 | 1.2 | 11,464 | -6.9 | 179 |
| Brown coal | PJ | 3, 4, 5 | 3,250,352 | 3,293,660 | 3,240,107 | 3,247,899 | 3,247,899 | 0.0 | 430 | 1.2 | 7,553 |
| Uranium | PJ | 4, 6 | 718,083 | 801,287 | 673,791 | 737,923 | 732,480 | -0.7 | 2,138 | -38.4 | 343 |
| Thorium | ktᵈ | 4, 7 | 130 | 130 | 560 | 635 | 604 | -4.9 | 0 | 0.0 | na |
| Total resources | PJ | 8 | 6,277,275 | 6,543,366 | 6,376,270 | 6,376,378 | 6,391,151 | 0.2 | 20,924 | -9.7 |
1. Based on the sum of 2P (proven and probable) reserves plus 2C (proven and probable) contingent resources as defined under the PRMS classification system (see Appendix 2 for further information).
2. Oil and gas data for the end 2014 are as reported by Geoscience Australia (2018).
3. Demonstrated recoverable coal resources.
4. Coal, uranium and thorium data for the end of 2016 are as reported by Geoscience Australia (2018).
5. Coal production data for 2021 is based on 2020-21 data published in the 2022 Australian Energy Statistics Report.
6. Recoverable resources at <US$130/kg.
7. A conversion into energy content equivalent for thorium was not available at the time of publication.
8. Excludes thorium resources.
kt = thousand tonne; LPG = liquefied petroleum gas; PJ = petajoule; TDR = total demonstrated resources.
Source: Geoscience Australia (2018; 2021; 2022); Hughes et al. (2023); Australian Energy Statistics 2022, published by the Department of Climate Change, Energy, the Environment and Water
Total demonstrated energy resources
Estimating energy resource volumes requires a consistent approach to describing commodity reserves and resources to ensure results are reliable and easily comparable. The resource classification appendix (Appendix 2) outlines the various resource classification systems used in AECR to describe the commerciality of energy resources. These systems use levels of geological knowledge and confidence to distinguish between identified and potential resources.
For the purposes of the AECR publication the following terminologies are used to describe the various energy resource classifications:
Identified resources are those for which measurements have been made to quantify their extent and grade or quality. A measurement may be, for example, a well drilled into an oil reservoir to provide a sample. The process of ‘proving’ that a resource is suitable for development is one of reducing uncertainty through the measurement of the nature of the resource, and its commercial and social viability.
‘Reserves’ and ‘economic demonstrated resources (EDR)’ are terms given to non-renewable energy resources that are known to exist in sufficient quantity and grade confirming their commercial and social viability. ‘Contingent resources’ or ‘sub‑economic resources’ are the terms given to resources that have been confirmed to exist but are not currently viable and/or economic to extract. Total demonstrated resources (TDR) is the sum of these two resource classes.
‘Potential resources’ are identified by indirect evidence with a high degree of uncertainty around their existence and viability. The potential resource base is often described by the terms ‘prospective’, ‘undiscovered’ or ‘inferred’. These potential resources require further exploration programs to demonstrate if a resource is actually present, followed by appraisal programs to determine the economic and technical viability of extracting any identified resources.
Furthermore, the resource base cannot be considered in isolation from energy conversion technologies. For example, energy security increased globally when the advancement of hydraulic fracturing technologies enabled once non‑viable shale oil and shale gas resources in the US to be commercially exploited.
Estimating the resource base requires setting a cut-off grade—for example, a minimum estimated ultimate recovery of gas in a reservoir for conventional hydrocarbons or well drainage area for unconventional hydrocarbons. An energy conversion technology is implicit in this—hence, the minimum viable resource is determined not only by the inherent nature of the resource, but also by the technology available to produce it.
Mineral and petroleum energy resource estimates are often documented as industry standard measurements of volume or mass. Coal and uranium are generally measured by weight (tonnes), while oil and gas are generally measured by volume (barrels/cubic feet). However, the energy content of different energy commodities varies significantly. In this assessment, energy resource estimates have been converted to a common energy unit—petajoules (PJ)—to allow direct comparisons of different energy commodities. The Measurement and Conversion appendix (Appendix 3) provides average energy contents and conversion factors for the various energy commodities.
Estimating energy resource life
The potential life of Australia’s non-renewable energy resources is estimated through dividing the total remaining identified resources by 2021 annual production rates (Table 1). Such estimates provide a snapshot in time that can only be used for general impressions as they are averages based on the assumption that:
- future production rates remain the same as the 2021 production rates used in the calculation;
- accumulations and deposits deemed in 2021 as identified resources will remain so in the future and not be reclassified into prospective or inferred resources; and
- depleted resources are not replaced by new discoveries.
Gas resources
Australia has substantial conventional gas resources that are located mostly off the north‑west coast of Western Australia, and significant onshore unconventional (coal seam gas, shale gas, and tight gas) resources. Australia’s TDR for all conventional and unconventional gas in 2021 is estimated at 257,971 PJ (229 Tcf trillion cubic feet [Tcf]). As such, based on 2021 rates of production and assuming all uncertainties associated with the development of the resources are addressed, it equates to a theoretical gas resource life of about 42 years.
As of December 2021, Australia’s TDR for conventional gas is estimated to be 187,839 PJ (167 Tcf), a decrease of 2.3 per cent from 2020. This decrease continues the trend of natural field decline seen since 2019 as conventional gas production exceeds the discovery rate for new resources.
- Based on 2021 production rates, the estimated life for Australia’s conventional gas resources is 41 years, which includes 18 years of life for proven and probable reserves.
Coal seam gas (CSG) resources are located primarily in east coast basins (Bowen, Surat, Galilee, Gunnedah, and Sydney basins). As of December 2021, TDR for Australia’s CSG are estimated at 57,316 PJ (51 Tcf), an increase of 4.0 per cent from 2020. The increase reflects the reserves upgrades and other upward revisions by LNG producers in the Bowen and Surat basins (ACCC, 2023).
- Based on 2021 production rates, Australia has an estimated 36 years of CSG resources, which includes 18 years of proven and probable reserves life.
Australia’s gas resource base includes one in-situ coal seam gasification project, the Leigh Creek Energy Project. In-situ coal gasification refers to gas being extracted from coal seams by underground heating to produce synthesis gas (‘syngas’). The Leigh Creek Energy Project has an estimated TDR of 2,622 PJ (2 Tcf). There has been no change to this resource estimate from the 2020 version in AECR 2022.
Prospective shale gas, tight gas and basin centred gas resources are held in low permeability reservoirs across Australia. Most of these resources are located in the Cooper Basin, Canning Basin and Beetaloo Sub-basin. In 2021, TDR for unconventional gas (excluding CSG and in-situ coal seam gasification) totalled 10,194 PJ (9.0 Tcf), representing a decrease of 16.8 per cent from 2020. This is due to company revisions in contingent resource estimates for the Beetaloo Sub-basin and Cooper Basin. There were also no identified unconventional gas reserves in 2021. There is no resource life estimate for these unconventional gas resources due to the lack of production and a limited understanding of reserves.
Oil resources
Australia’s conventional liquid hydrocarbon resources include crude oil, and the condensate plus liquefied petroleum gas (LPG) resources associated with gas accumulations (as phases of natural gas liquids).
As at December 2021, TDR for Australia’s crude oil is estimated to be 4,546 PJ, or 773 million barrels (MMbbl). Australia’s crude oil resources are small by world standards and are being depleted at a faster rate than they are being replenished by new discoveries. Total identified crude oil resources decreased by 12.7 per cent from 2020 to 2021.
- Based on 2021 production rates, the estimated life for Australia’s crude oil resources is 18 years, which includes only 5 years of life for proven and probable reserves.
Australia is reliant on crude oil and refined petroleum imports to meet its energy requirements, importing over 90 per cent of our crude oil and refined oil products. For the supply shortage of indigenous crude oil to be addressed increased exploration of Australia’s oil-prone basins will be needed. Australia’s liquefied petroleum gas (LPG) resources are also relatively small. In 2021, Australia had an estimated TDR of 1,155 PJ (268 MMbbl) a decrease of about 4.3 per cent from 2020.
- Based on 2021 production rates, the remaining life for Australia’s LPG resources is about 24 years, which includes 12 years of proven and probable reserves.
Australia has significantly more condensate than crude oil and LPG resources, with an estimated TDR of 15,581 PJ (2,650 MMbbl) in 2021, a small growth of 0.9 per cent from 2020. Most condensate resources are associated with LNG projects in the Northern Carnarvon and Browse basins on the North West Shelf.
- Based on 2021 production rates, condensate resources have an estimated life of about 36 years, which includes 15 years of life for proven and probable reserves.
Unconventional oil resources are currently undeveloped but include significant oil shale occurrences (TDR of 84,436 PJ; 14,360 MMbbl) and minor condensate and LPG associated with unconventional gas resources (TDR of 369 PJ; 63 MMbbl). Oil shale resources are exclusively located in Queensland and require mining and industrial processing to extract oil. Although minor amounts of oil shale resources were produced in the past, there are currently no identified reserves or operating projects.
Coal resources
Australia’s coal resources are world class in volume and quality. In December 2021, TDR for Australia’s recoverable black and brown coal are estimated to be 5,294,613 PJ (410,597 million tonnes [Mt]). In addition to these large TDR of coal, Australia also has significant inferred coal resources.
TDR for black coal is estimated to be 2,046,714 PJ (80,702 Mt). Black coal resources are found in most states, with the largest TDR in the Bowen–Surat basins in Queensland and the Sydney Basin in New South Wales. In 2021, Australia’s black coal TDR increased slightly by 1.2 per cent. This is consistent with the 2 per cent increase seen in the economic demonstrated resources for black coal (Hughes et al., 2023).
- Based on 2021 production rates, the estimated resource life for black coal is 179 years.
Australia has vast brown coal resources, although these have a much lower energy content than black coal. Brown coal TDR are estimated to be 3,247,899 PJ (331,423 Mt) and are located mainly in Victoria’s Gippsland Basin. Australia’s brown coal TDR remains unchanged since 2020 and will support over 7,000 years of production based on the very low current extraction rates.
Uranium and thorium resources
More than one-third of the world’s known uranium resources are located in Australia. In December 2021, TDR for Australia’s uranium are estimated to be 732,480 PJ (1,308 thousand tonnes [kt]). Although most Australian states have uranium deposits, EDR are concentrated in South Australia, the Northern Territory and Western Australia. Australia’s TDR for uranium resources showed a minor decrease of 0.7 per cent in 2021.
- Based on 2021 production rates, uranium resources have an estimated life of 343 years.
Australia also has a major share of the world’s thorium resources. Although not currently in use as an energy resource, thorium could play a role as a nuclear energy source in the future.
Australia's energy production and trade
The outlook for Australian energy production from gas, oil, coal and uranium is tied to global trends in demand, supply and pricing. This section provides an overview of Australia’s energy production and trade during the 2020–21 financial year as published in the Australian Energy Update (Department of Climate Change, Energy, the Environment and Water, 2022a), together with Resources and Energy Quarterly data published by the Office of the Chief Economist. Statistics from the Australian Energy Update 2022 cover the first full period impacted by the COVID-19 pandemic and the associated impacts on energy supply and trade.
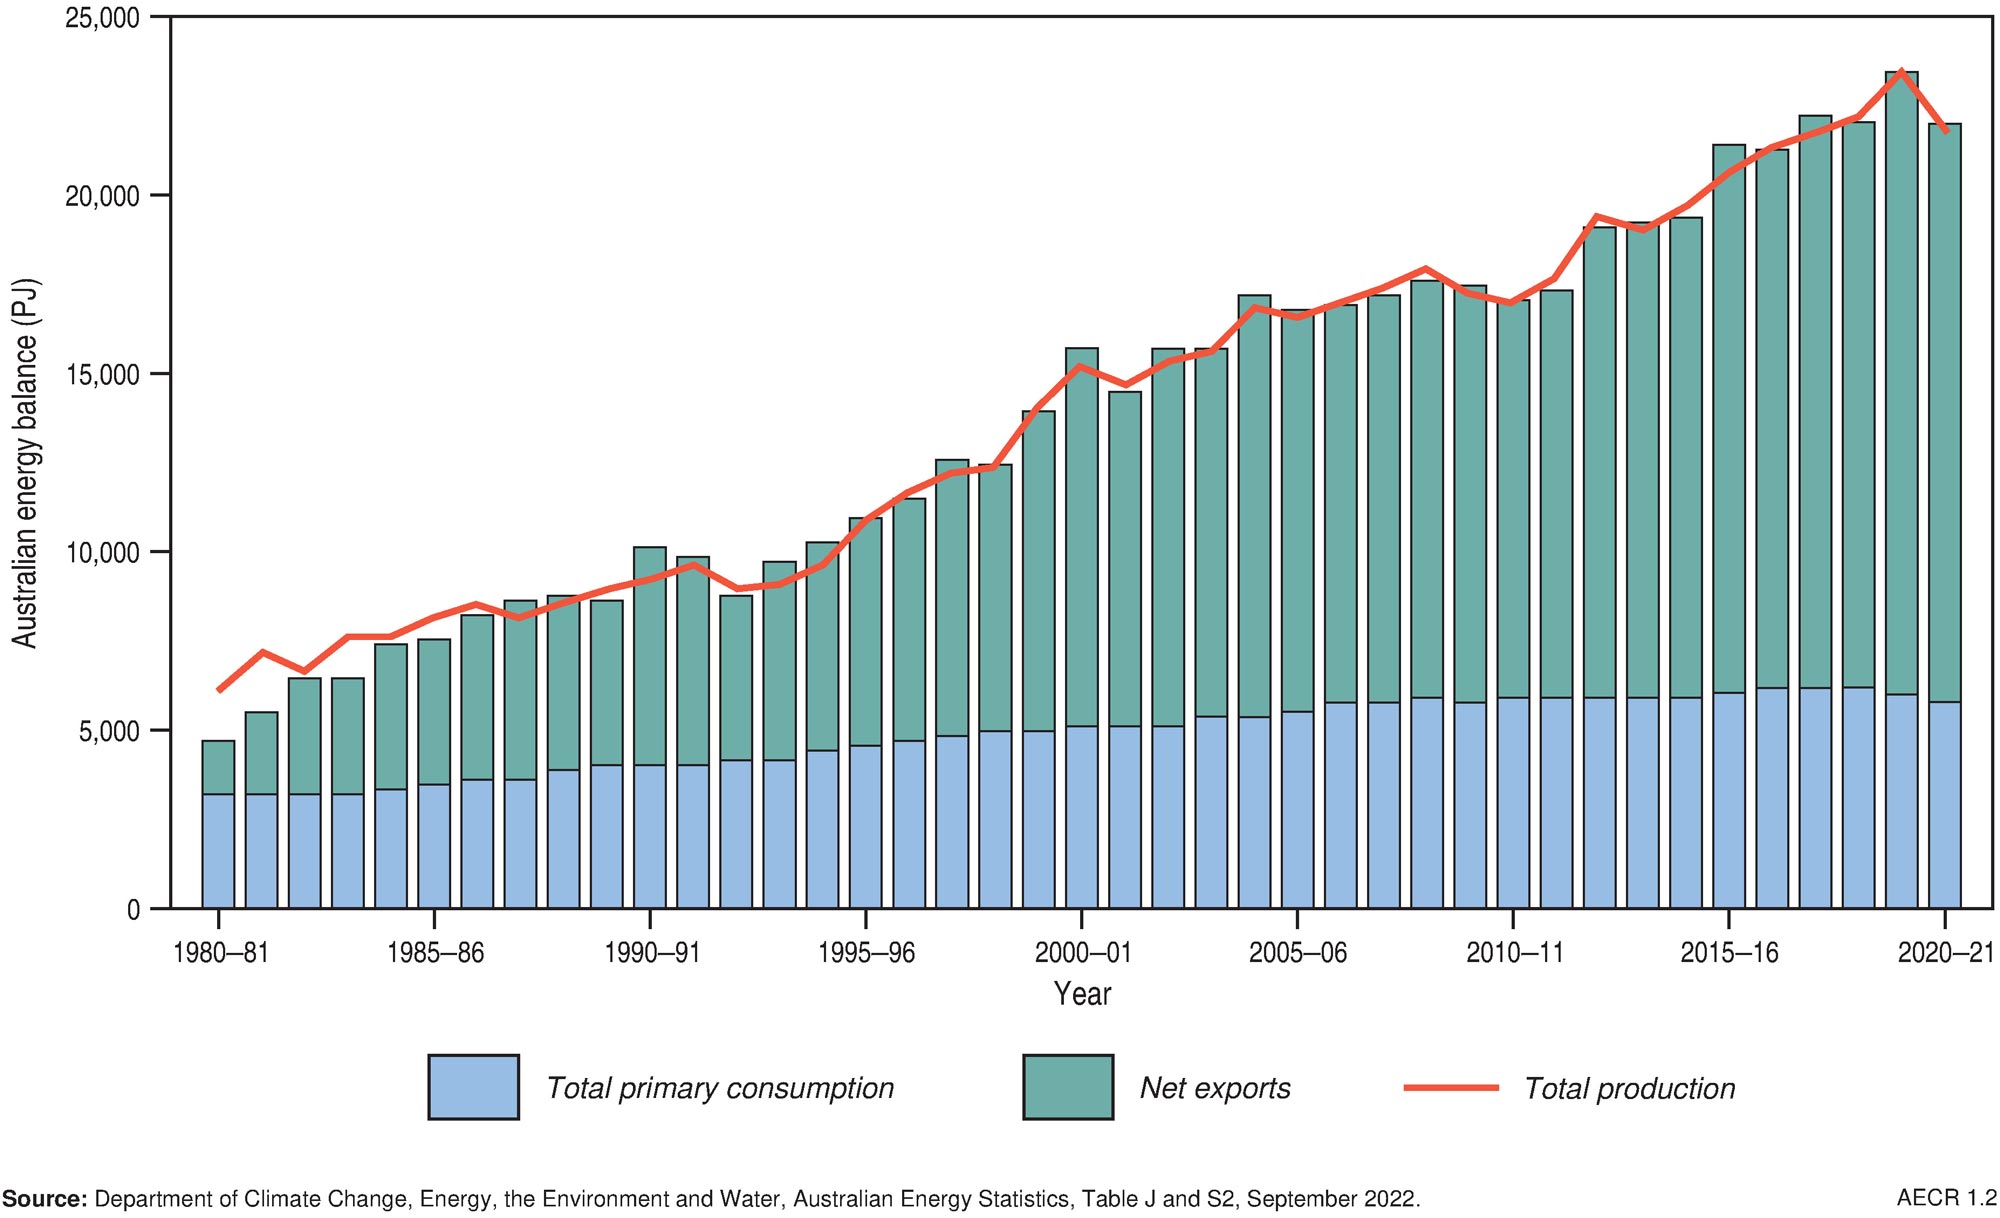
Australia’s energy resources contribute substantially to the nation’s gross domestic product and export earnings. Energy productivity (gross domestic product ‘GDP’ divided by energy consumption) improved by 5 per cent in 2020–21, and by 28 per cent over the past ten years (Department of Climate Change, Energy, the Environment and Water, 2022a). Australia now creates $347 million in GDP for every petajoule of energy consumed, almost $75 million more than a decade ago (Department of Climate Change, Energy, the Environment and Water, 2022a). Approximately 85 per cent of Australian produced energy (including uranium) was exported in 2020–21. Exports of LNG have been one of the main contributors to recent growth in our energy exports. Australia is a net exporter of energy commodities but, notwithstanding this, it remains a net importer of oil products.
Primary energy production in Australia
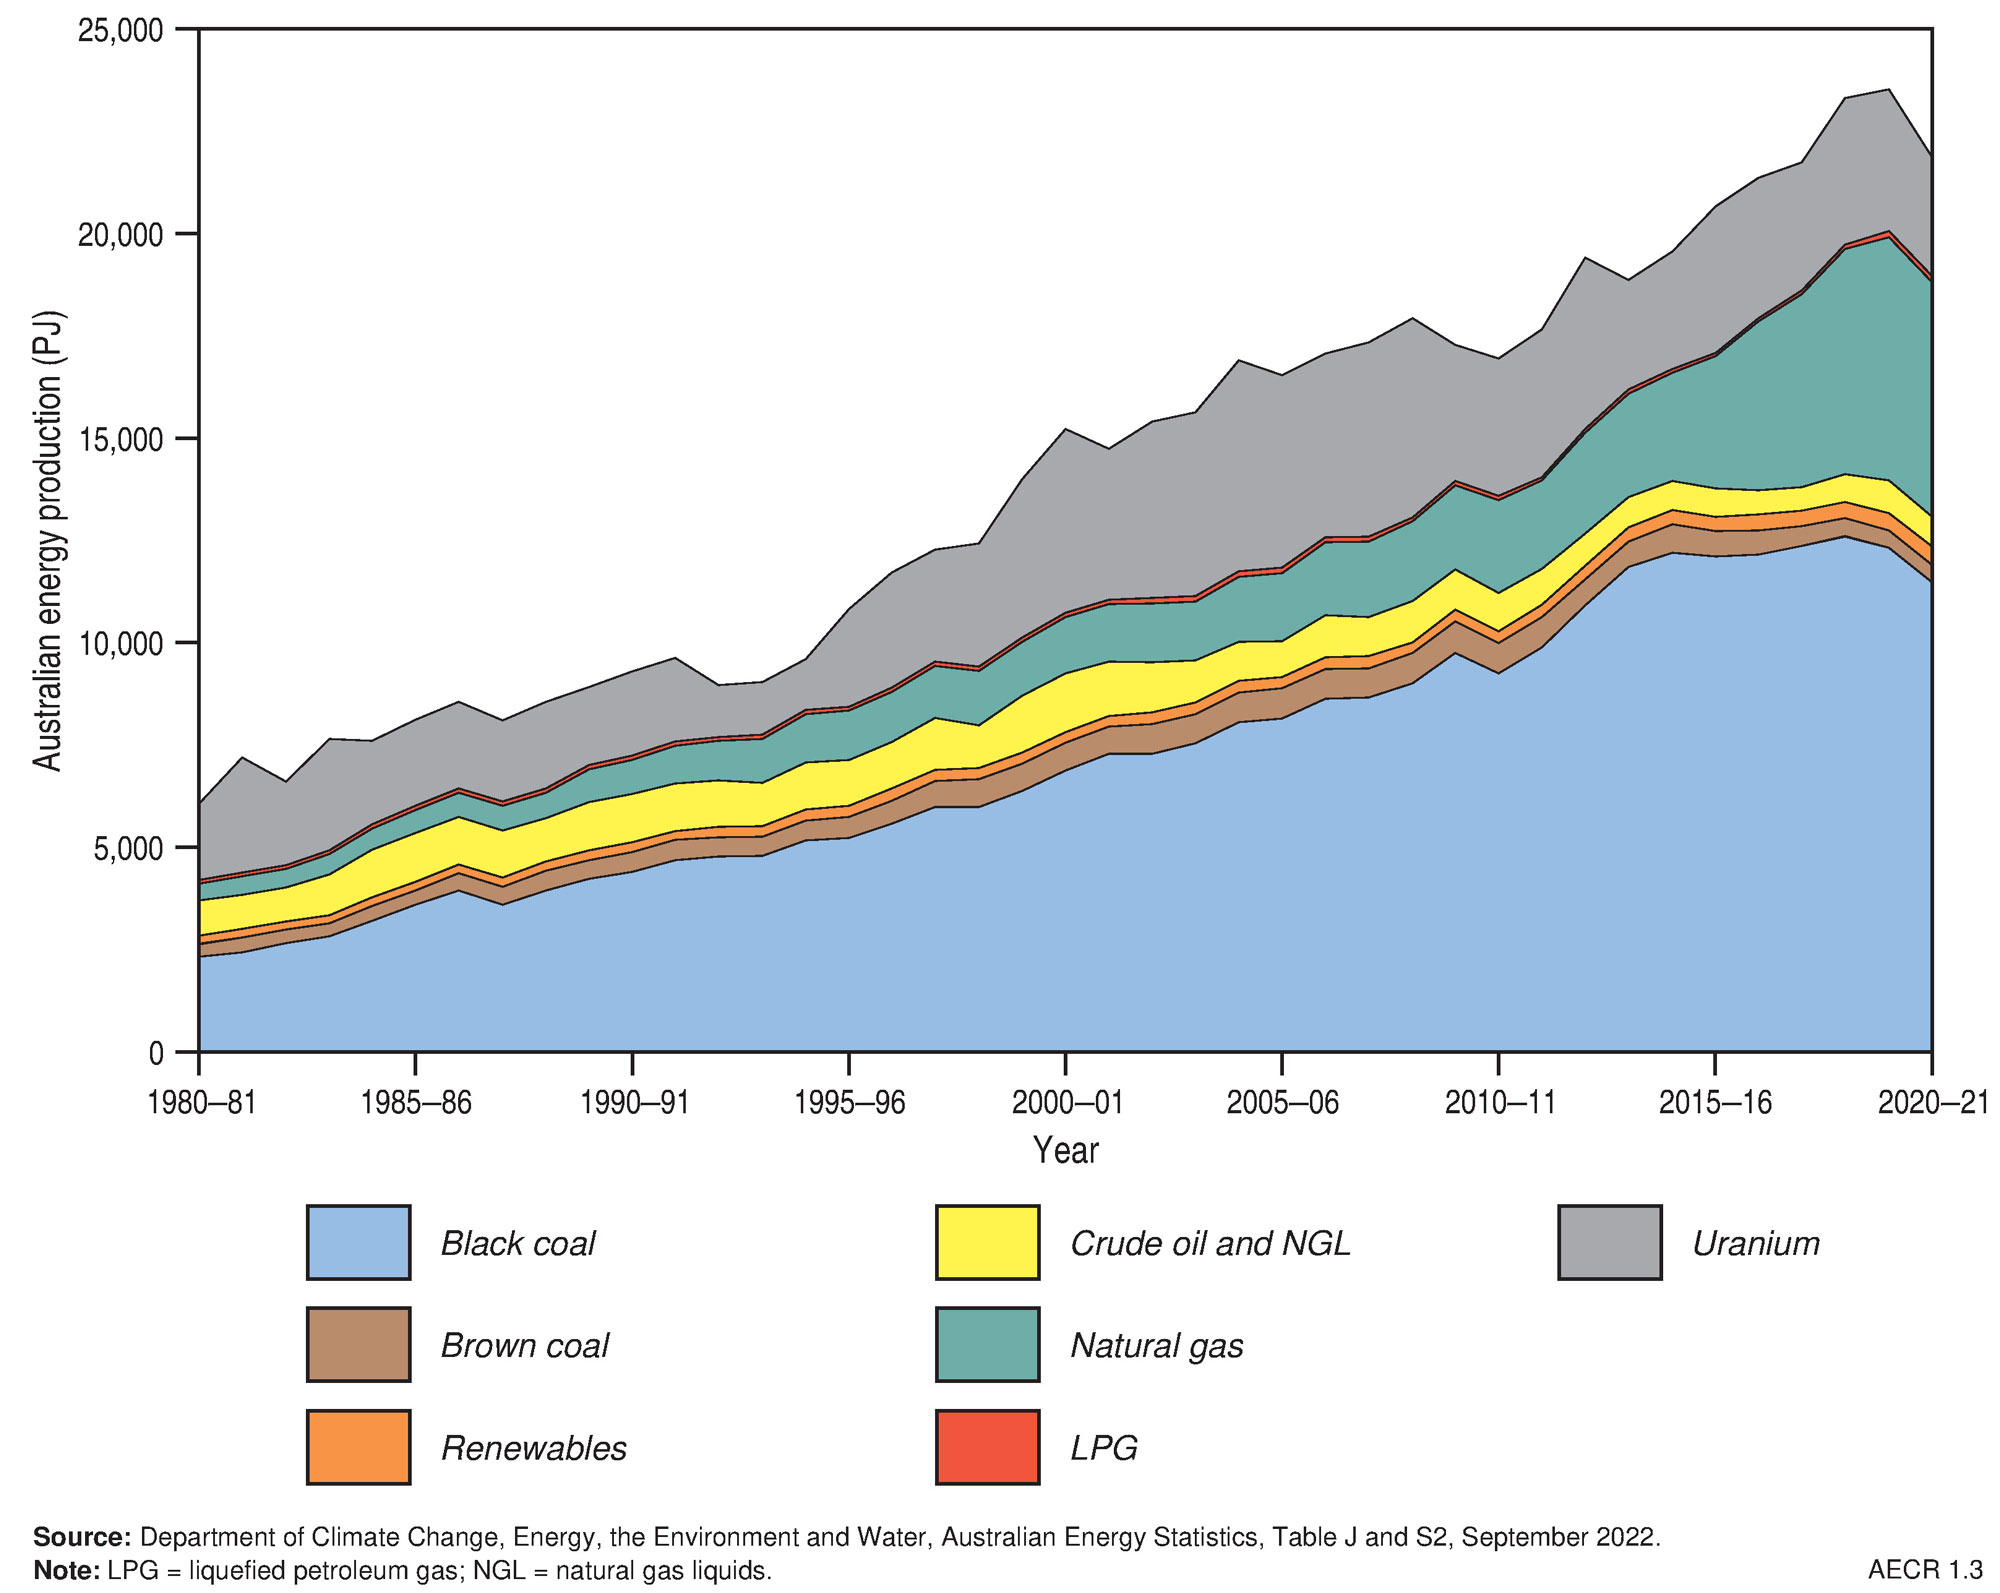
Australia’s total energy production decreased by 7.0 per cent in 2020–21 to 21,871 PJ (Table 2; Figure 2). Significant reductions occurred in production of most energy commodity resources, with the exception of brown coal which showed a slight increase of 1.1 per cent. Renewable energy production continued to show significant growth increasing by 10.4 per cent to 462 PJ.
Table 2. Australian primary energy production by fuel type (2020–21)
| Energy source | Production (PJ) | Share (%) | Average annual growth 2020-21 (%) | Average annual growth 2010-11 to 2020-21 (%) |
|---|---|---|---|---|
| Energy Commodities | ||||
| Black coal | 11,464 | 52.4 | -6.9 | 2.2 |
| Brown coal | 430 | 2.0 | 1.1 | -5.2 |
| Natural gas | 5,730 | 26.2 | -3.6 | 9.7 |
| Oil, NGL | 718 | 3.3 | -10.0 | -2.7 |
| LPG | 147 | 0.7 | -9.1 | 5.0 |
| Uranium | 2,920 | 13.4 | -15.5 | -1.4 |
| Total Energy Commodities | 21,409 | 97.9 | -7.3 | 2.6 |
| Renewable Energy Sources | 462 | 2.1 | 10.4 | 4.6 |
| Total Energy Production | 21,871 | 100.0 | -7.0 | 2.6 |
The share of production by fuel types differs from that published in the Australian Energy Statistics due to inclusion of uranium in this table.
Source: Department of Climate Change, Energy, the Environment and Water, Australian Energy Statistics, Tables J and S2, September 2022
Black coal production fell by 6.9 per cent in 2020–21 to 11,464 PJ, but still remained the principal source of energy production in Australia (Figure 3). Production declined in response to COVID-19 related falls in power consumption and transport, infrastructure damage from storms and floods, and restrictions of exports to China, (Department of Climate Change, Energy, the Environment and Water, 2022a). Brown coal production rose by 1.1 per cent to 430 PJ—a small reversal from the long-term trend reflecting an increased demand in brown coal fired electricity usage during 2020–21.
Natural gas production decreased by 3.6 per cent to 5,730 PJ in 2020–21 in response to COVID-related reduced global demand for LNG exports and outages in LNG production at the Gorgon and Prelude facilities (Department of Climate Change, Energy, the Environment and Water, 2022a). About 60 per cent of production was from conventional gas resources in Western Australia. Coal seam gas accounted for about one-quarter of Australia’s annual gas production, which was almost entirely from fields in the Bowen and Surat basins (Queensland).
Crude oil and condensate production fell 10.0 per cent in 2020–21 to 718 PJ. Natural LPG production also fell 9.1 per cent to 147 PJ. These declines were partially due to reduced condensate and LPG production linked to gas production facility outages and reduced crude oil production from Australia’s ageing oil fields (Department of Climate Change, Energy, the Environment and Water, 2022a).
Uranium contributed 13.4 per cent of Australia’s total primary energy production in 2020-21 at 2,920 PJ. Uranium production decreased by 15.5 per cent in 2020–21 due to the closure of the Ranger mine in January 2021.
Trade of Australia’s energy resources
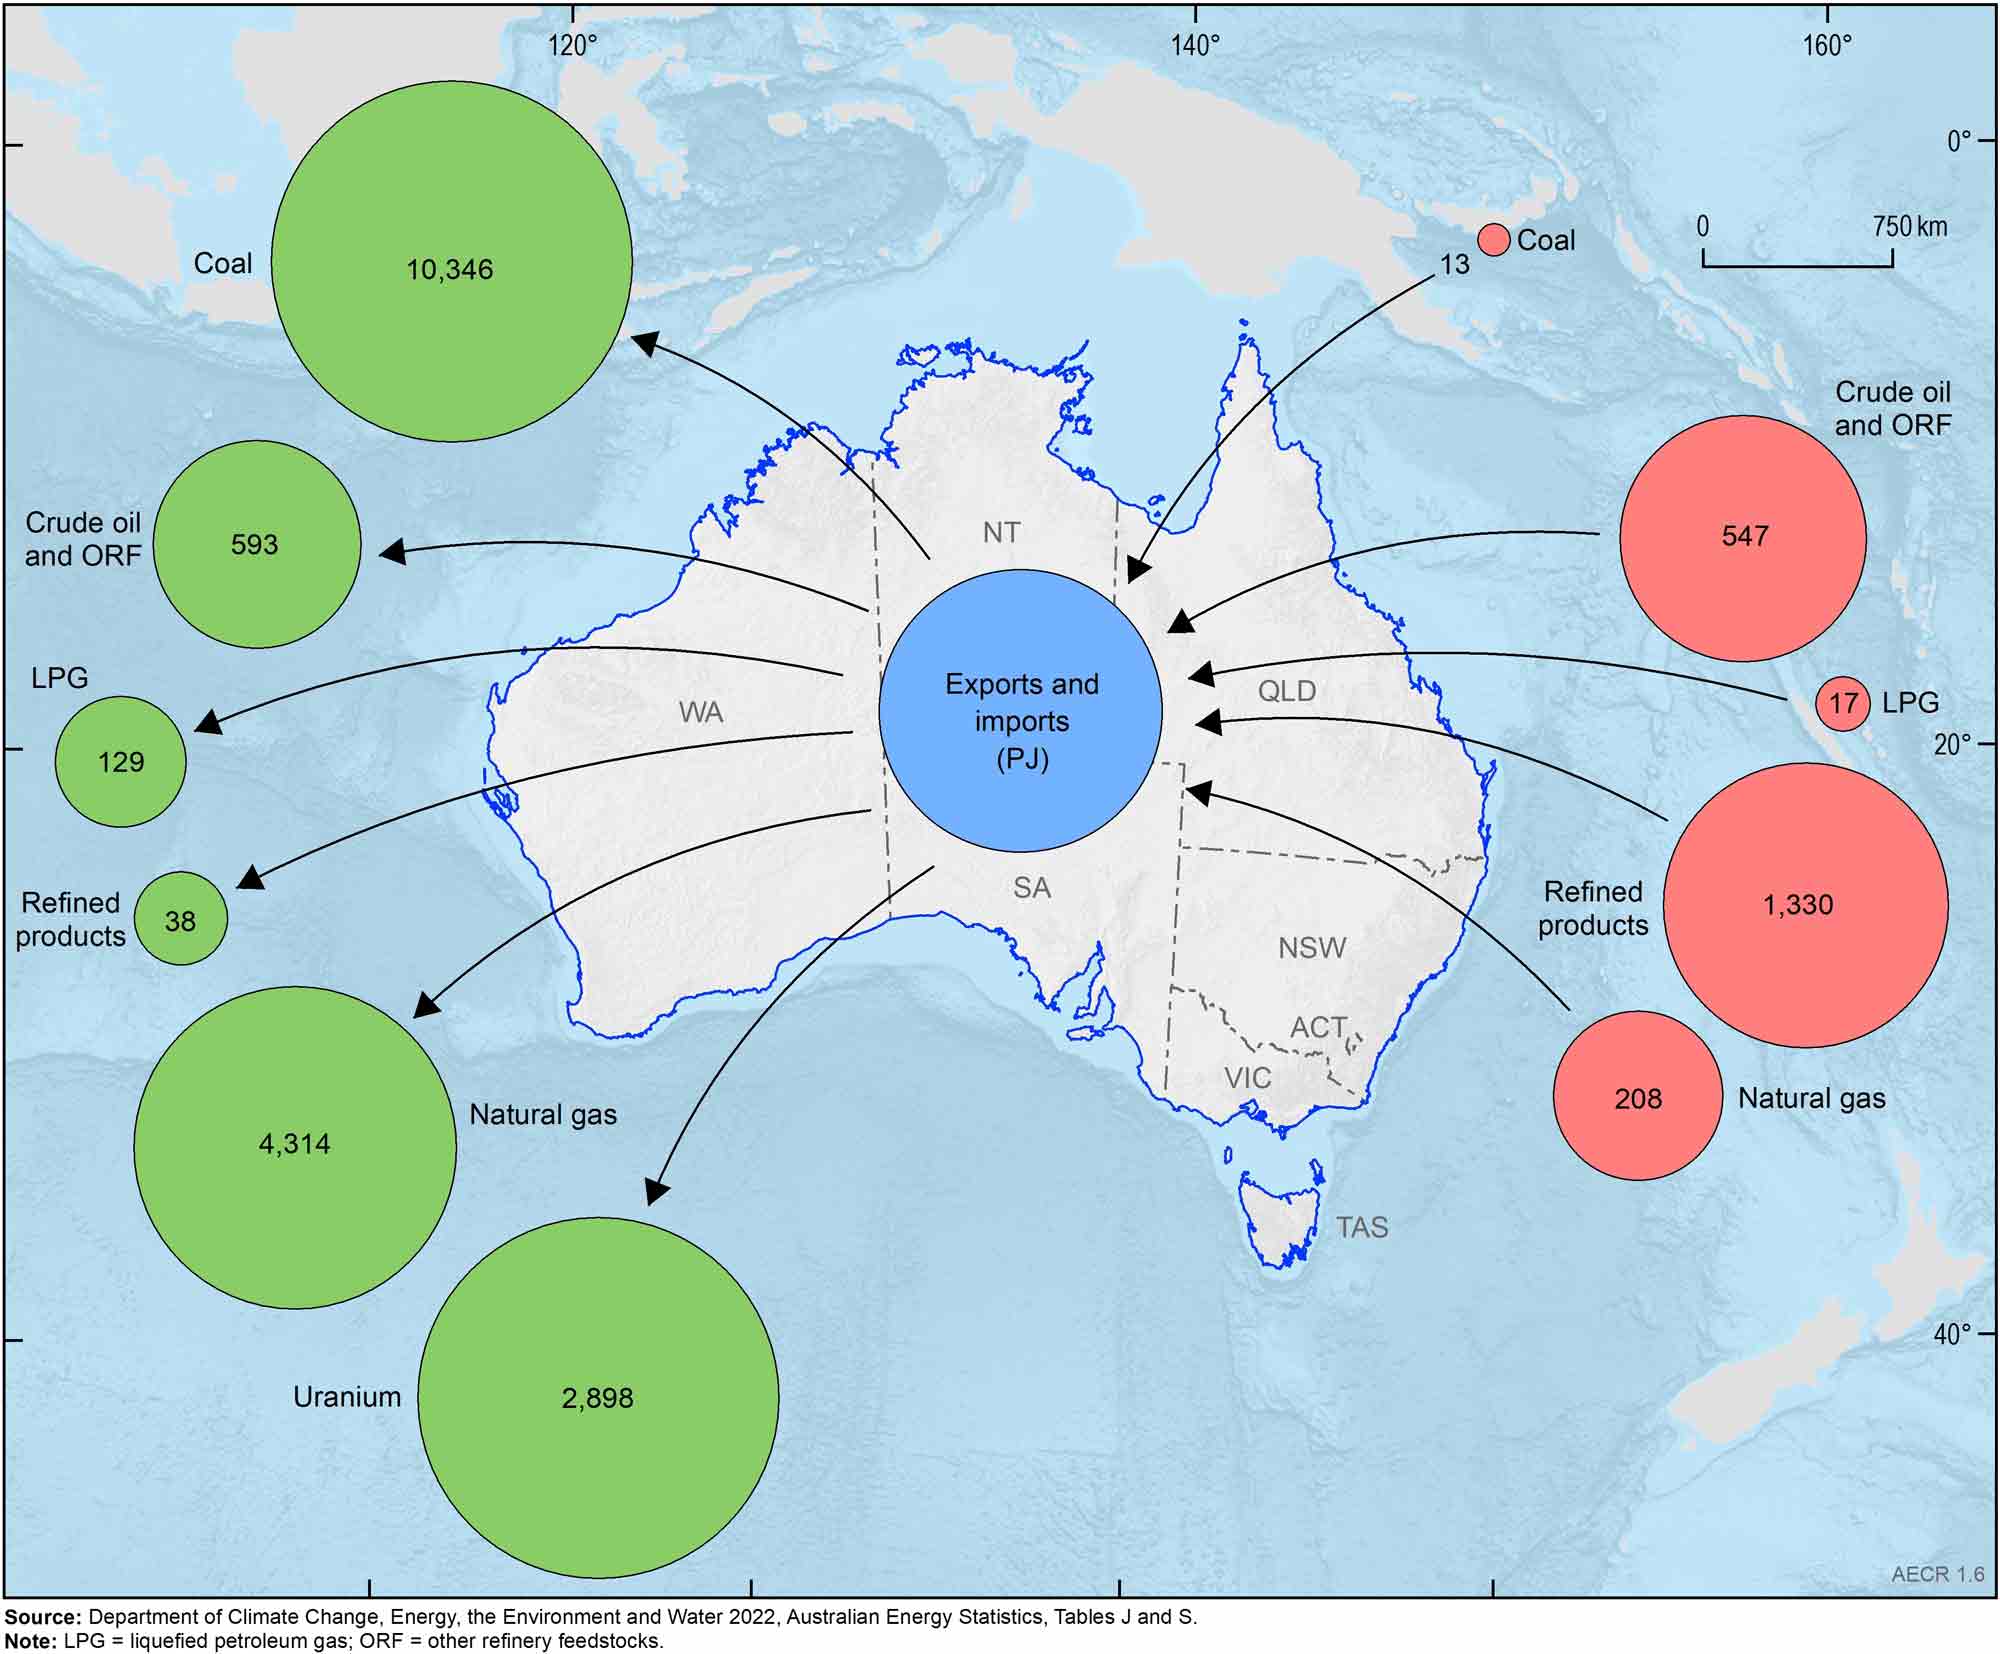
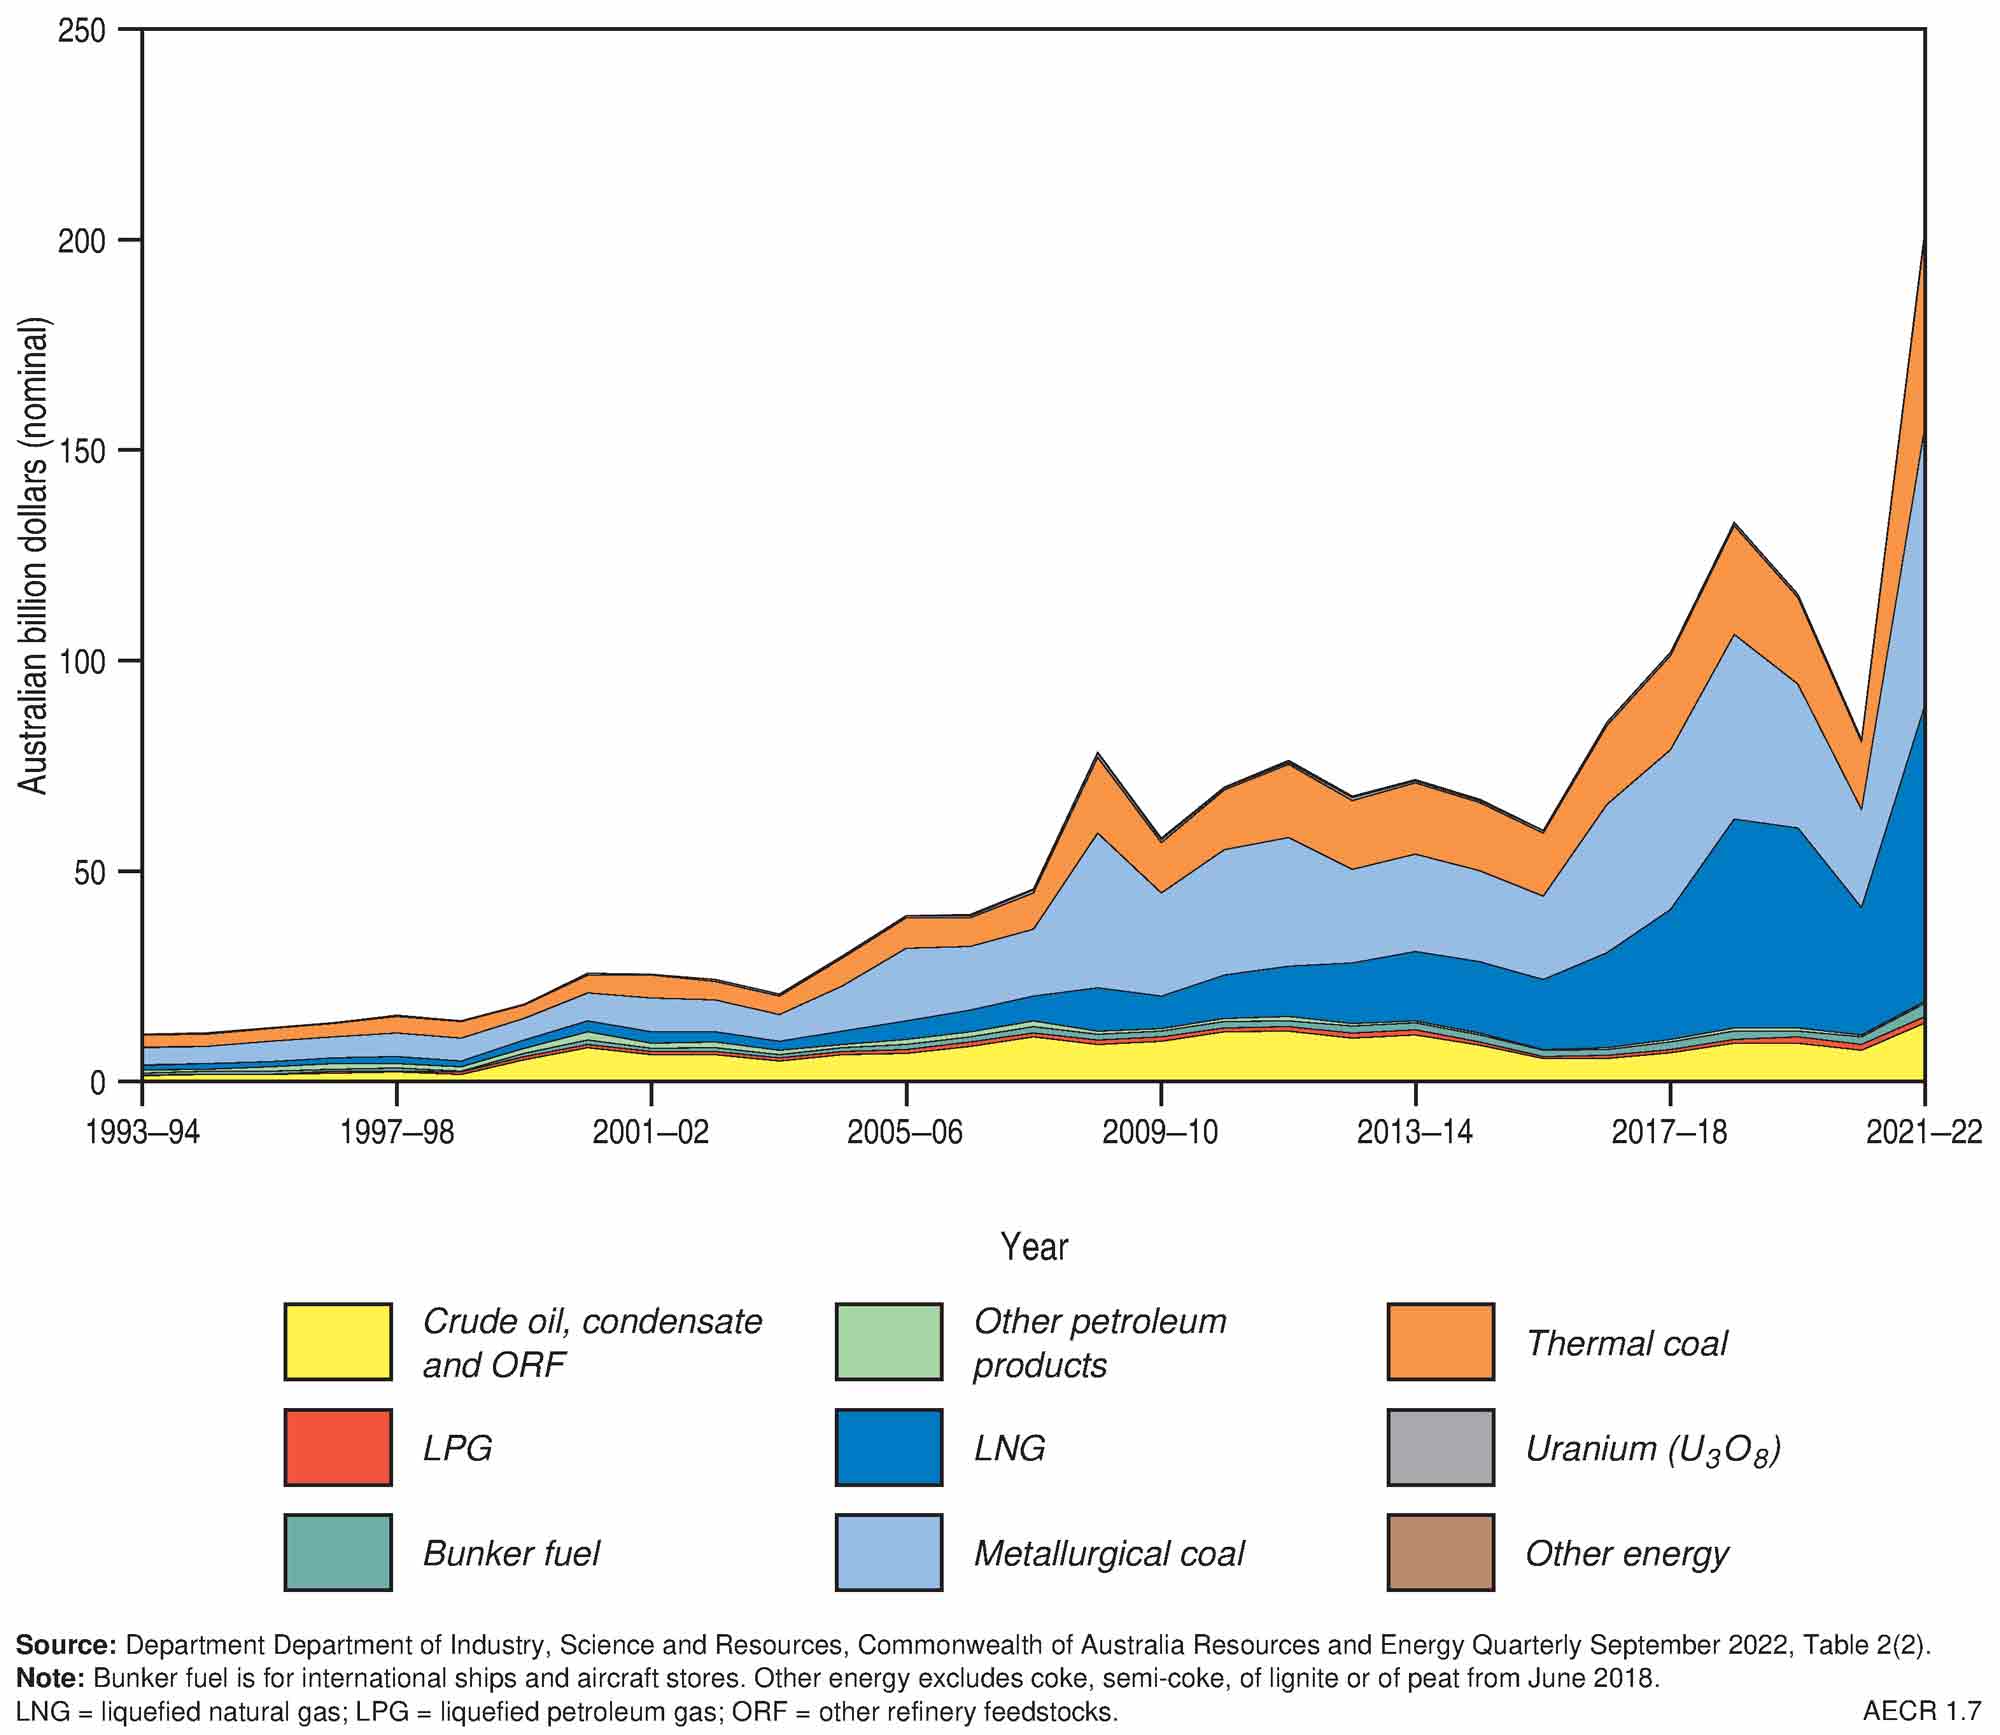
Australia’s trade of energy commodity resources in 2020–21 reflects the impacts of COVID-19 related reductions in global energy demand with declines in all energy commodity exports (Table 3). Australia continued to be a net exporter of energy commodities, with exports exceeding imports nearly nine-fold (Table 3; Figure 4, Table 4; Figure 5, Table 5; Figure 6). The 21.7 per cent reduction in Australia’s energy commodity resource exports during 2020–21 was a sharp reversal to the average annual growth rate over the past decade of 1.3 per cent (Table 3; Figure 4, Figure 6). During 2020–21, Australia’s energy commodity export earnings dropped by 29.7 per cent to AUD$81.2 billion—a significant fall from the AUD$115.5 billion in export earnings during 2019–20 (Table 5; Figure 7). Energy commodity imports also fell during 2020–21 by 5.7 per cent to 2,114 PJ.
Black coal remained the dominant energy commodity exported despite a 6.7 per cent decline in volumes from 11,062 PJ in 2019–20 to 10,324 PJ in 2020–21. This reduction was related to a global decline in steel production due to COVID-19 restrictions, together with China’s restrictions on coal imports from Australia and weather-related disruptions to production (Department of Climate Change, Energy, the Environment and Water, 2022a). Associated export earnings dropped from AUD$55 billion in 2019–20 to AUD$39 billion in 2020–21—almost half of the AUD$70 billion in export earnings during 2018–19.
- About 90 per cent of black coal produced in Australia was exported in 2020–21.
Table 3. Australian energy exports by fuel type (2020–21)
| Energy source | Exports (PJ) | Share (%) | Average annual growth 2020-21 (%) | Average annual growth 2010-11 to 2020-21 (%) |
|---|---|---|---|---|
| Black coal | 10,324 | 56.4 | -6.7 | 2.5 |
| Coal by-products | 23 | 0.1 | -14.3 | na |
| Natural gas (LNG) | 4,314 | 23.6 | -2.2 | 14.6 |
| Crude Oil and ORF | 593 | 3.2 | -5.2 | -2.0 |
| LPG | 129 | 0.7 | -8.8 | 6.8 |
| Refined Products | 38 | 0.2 | -9.8 | 1.0 |
| Uranium | 2,898 | 15.8 | -14.3 | -1.2 |
| Total | 18,318 | 100.0 | -21.7 | 1.3 |
The share of production by fuel types differs from that published in the Australian Energy Statistics due to inclusion of uranium in this table; na = not available
Source: Department of Climate Change, Energy, the Environment and Water, Australian Energy Statistics, Table J and S2, September 2022
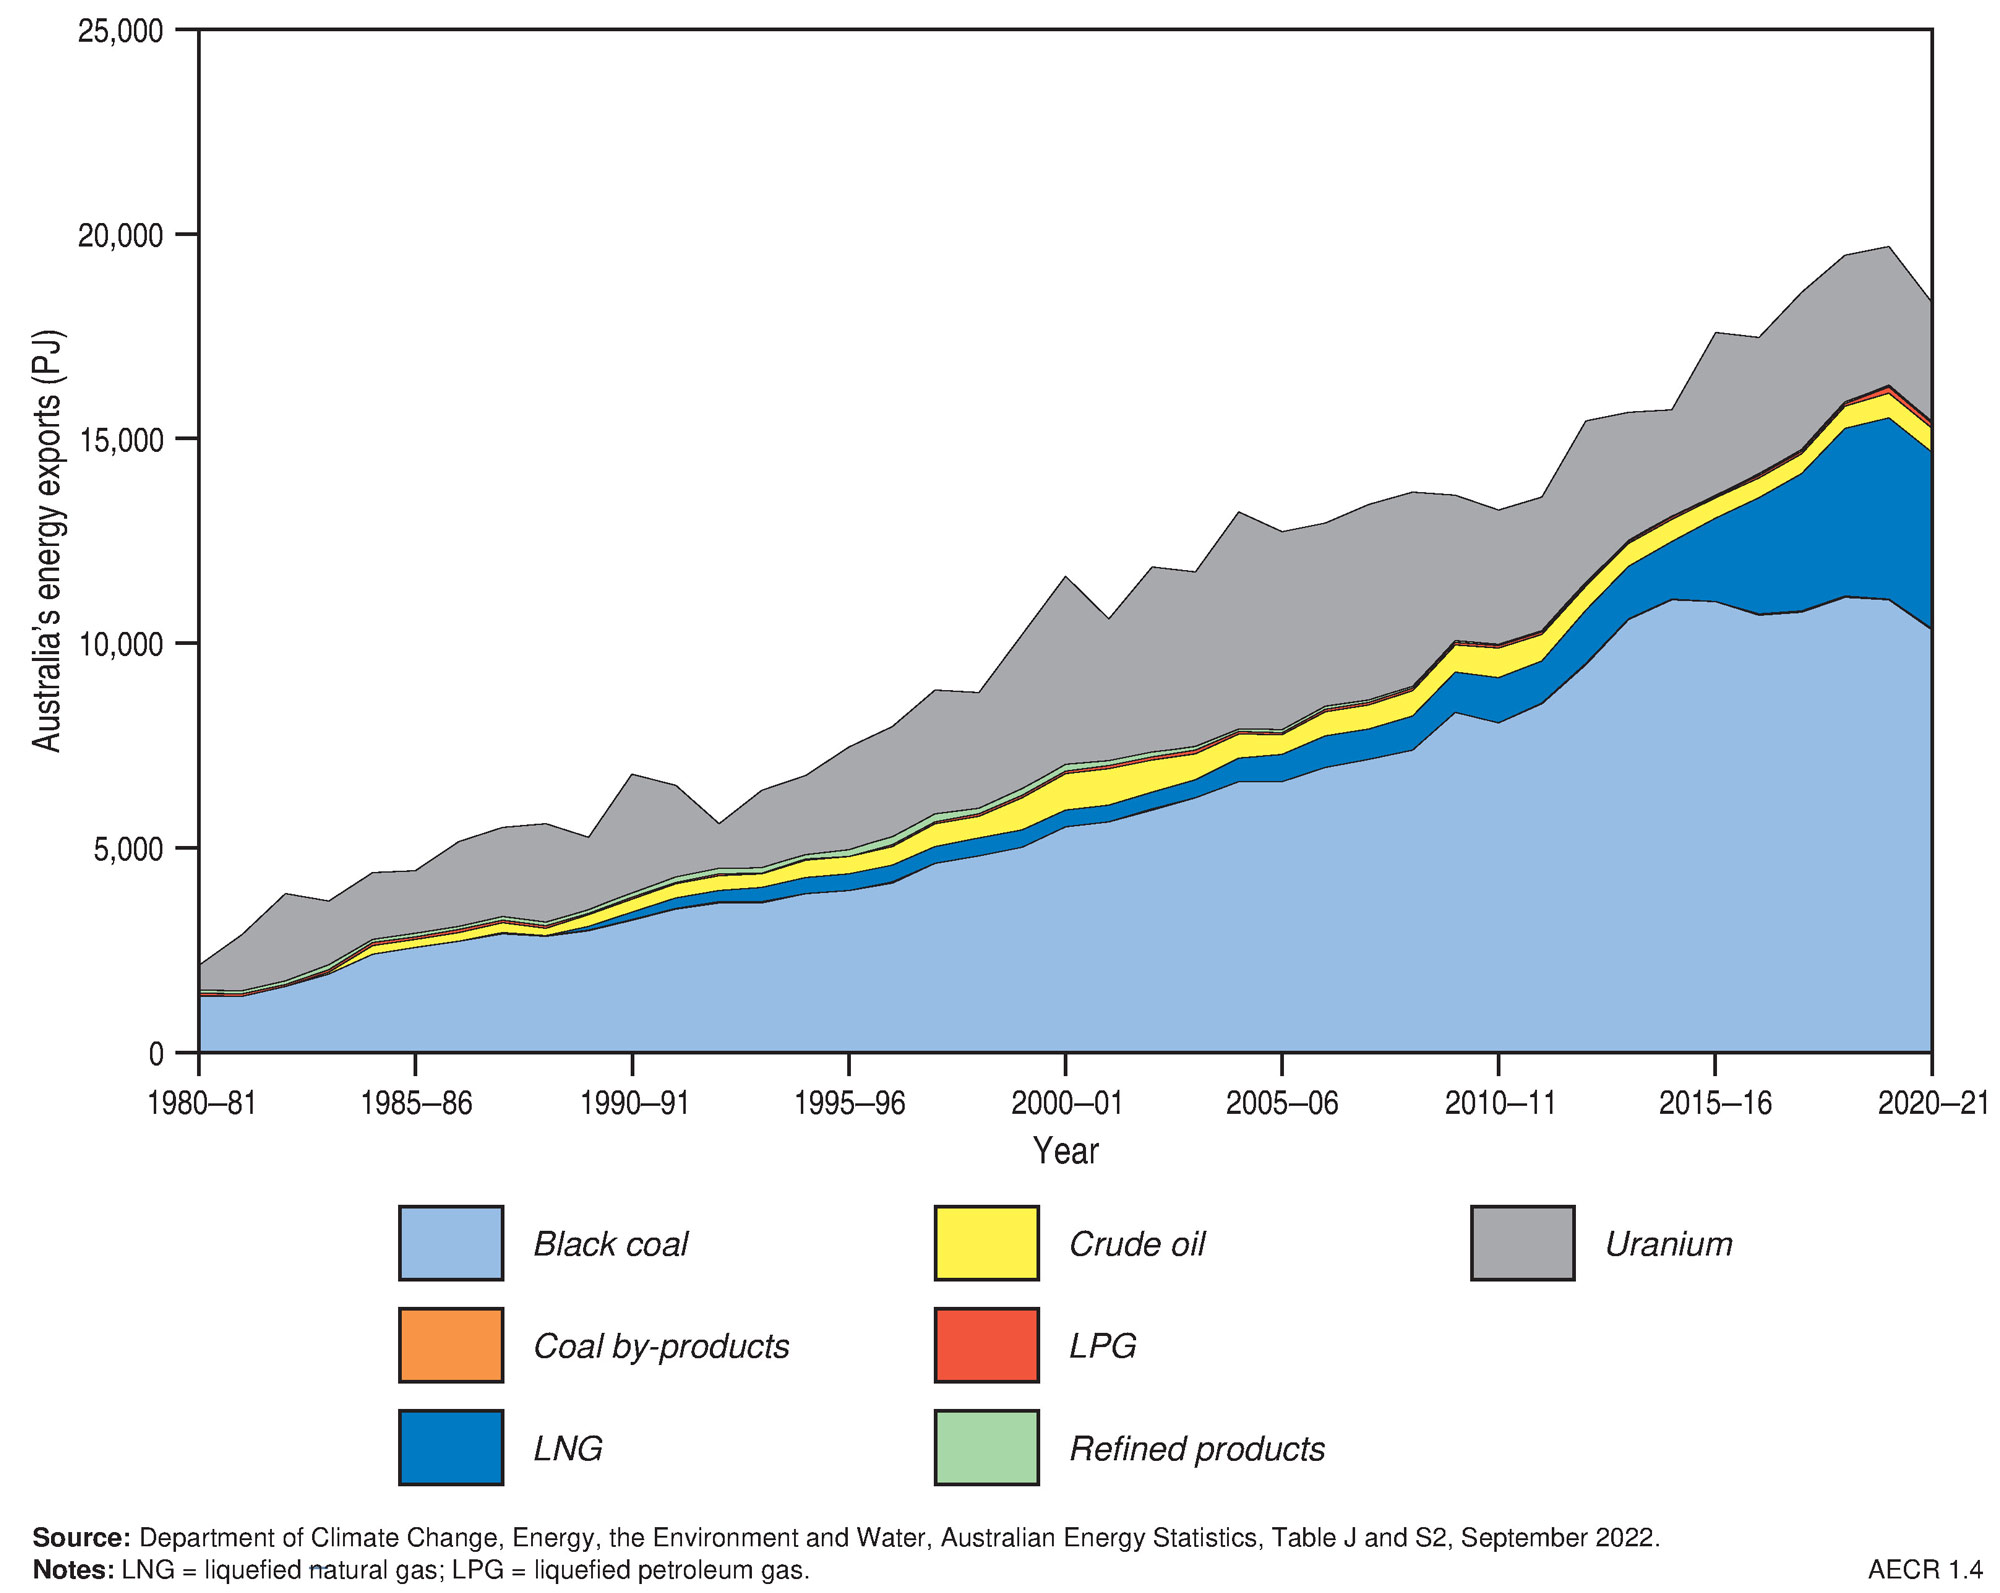
Australia’s LNG exports fell slightly by 2.2 per cent in 2020–21 to 4,314 PJ associated with reduced natural gas production. This is significantly lower than the average annual growth of 14.6 per cent over the previous decade, which was driven by a rapid expansion of Australia’s LNG capacity between 2015–16 and 2019–20. About 75 per cent of all natural gas produced in Australia was exported in 2020–21. LNG export earnings fell by 35.9 per cent in 2020–21 to AUD$30.5 billion—a major decline from the record AUD$49.7 billion in LNG export earnings reached in 2018–19 (Department of Industry, Science and Resources, 2022a). The only gas Australia imported in 2020–21 was sourced from the former Joint Petroleum Development Area in the Timor Sea, which was transported and liquefied in Darwin for export.
- During 2020–21 Australia maintained its position as one of the world’s largest LNG exporters, along with Qatar.
Crude oil and condensate exports also fell slightly in 2020–21 by 5.2 per cent to 593 PJ, ending the short growth trend that started in 2017–18. This decline in exports reflects the decreased domestic oil and condensate production and reduced global demand during the COVID-19 pandemic (Department of Climate Change, Energy, the Environment and Water, 2022a). LPG exports also decreased in 2020–21 by 8.8 per cent to 129 PJ. Export earnings from crude oil and condensate decreased by 17.5 per cent to AUD$7.4 billion in 2020–21, while export earnings for LPG also decreased by 15.6 per cent to AUD$1.4 billion. Australia continued to import the majority of its crude oil and refined petroleum products, which totalled 1,877 PJ in 2020–21. However during this period, crude oil imports declined significantly by 21.4 per cent. This was due to the closure of the Kwinana refinery in March 2021, along with reduced demand for refined petroleum products in the transport sector during COVID-19 related travel restrictions (Department of Climate Change, Energy, the Environment and Water, 2022a). Throughout 2020-21 Australia continued to export relatively light and sweet oils produced from fields on the North West Shelf to large Asian refineries and import the majority of refined petroleum products.
- In 2020–21 about 80 per cent of all crude oil and condensate produced in Australia was exported.
Australia is a significant exporter of uranium oxide for use in nuclear power plants. However, in 2020–21 uranium exports decreased by 14.3 per cent to 2,898 PJ reflecting the impacts of the Ranger mine closure. On average, uranium exports decreased by about 1.2 per cent per annum over the past decade. Export earnings for uranium also decreased in 2020–21 by 11.9 per cent to AUD$0.6 billion (Department of Industry, Science and Resources, 2022a).
Table 4, Australian energy imports by fuel type (2020–21)
| Energy source | Imports (PJ) | Share (%) | Average annual growth 2020-21 (%) | Average annual growth 2010-11 to 2020-21 (%) |
|---|---|---|---|---|
| Coal and coal by-products | 13 | 0.6 | -34.9 | 7.0 |
| Crude Oil and ORF | 547 | 25.9 | -21.4 | -7.8 |
| LPG | 17 | 0.8 | -14.9 | -3.0 |
| Refined Products | 1,330 | 62.9 | 0.1 | 7.9 |
| Natural Gas | 208 | 9.8 | 15.5 | -0.6 |
| Total | 2,114 | 100.0 | -5.7 | 0.0 |
Source: Department of Climate Change, Energy, the Environment and Water, Australian Energy Statistics, Table J, September 2022
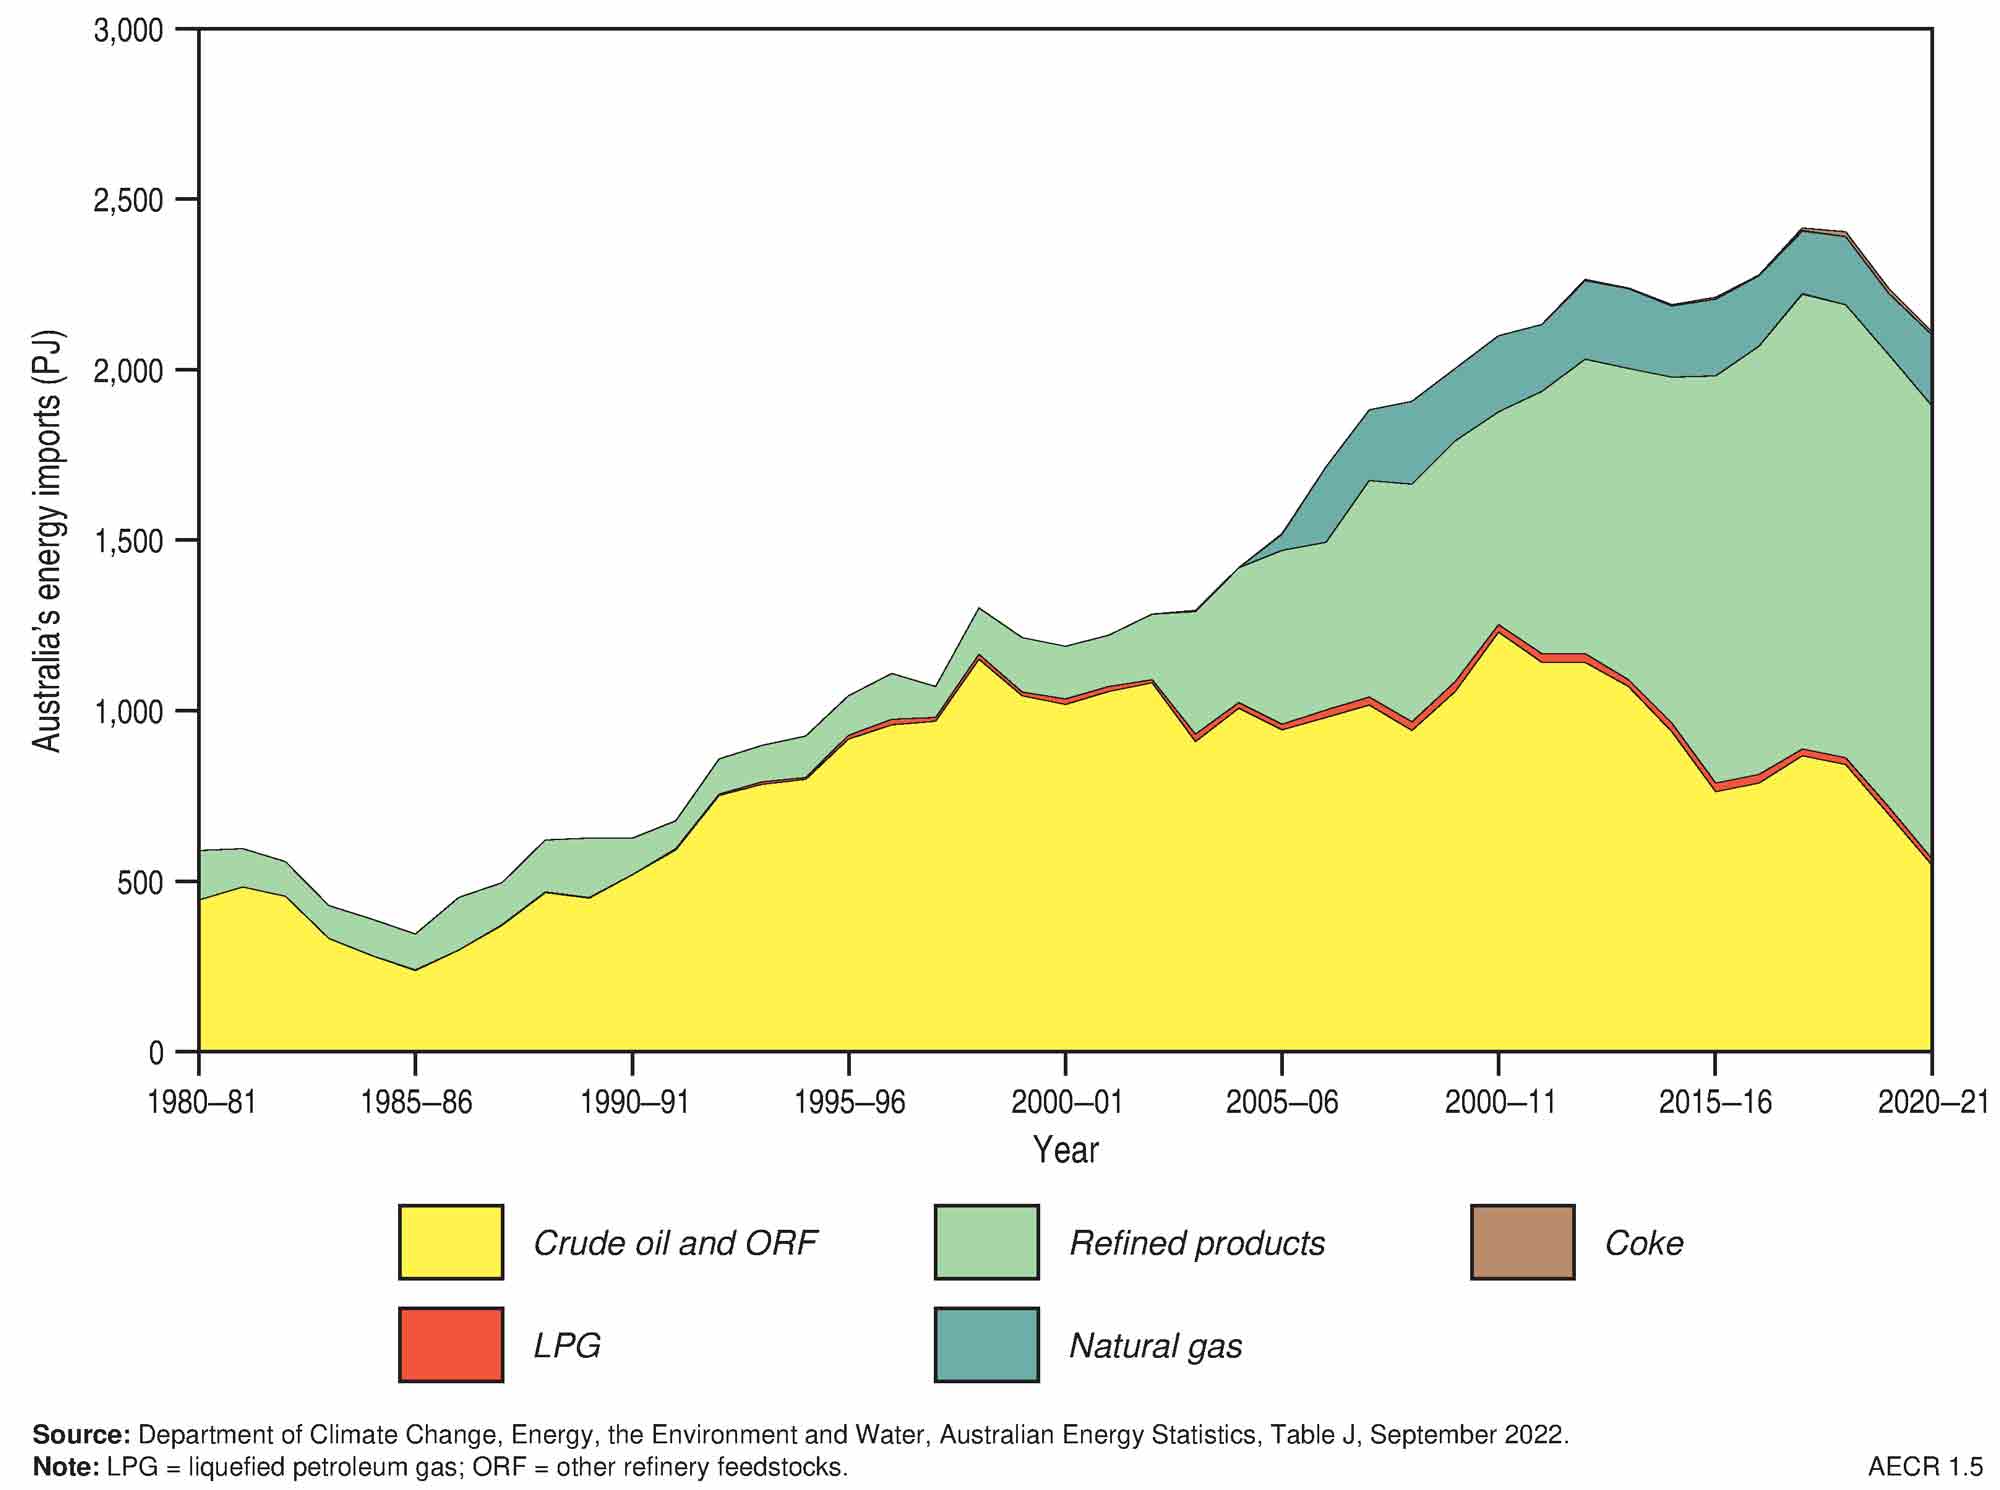
Table 5. Annual value of Australian energy commodity exports by fuel type (2020–21)
| Energy source | Vaue (AUD$billion) | Share (%) | Average annual growth 2020-21 (%) | Average annual growth 2010-11 to 2020-21 (%) |
|---|---|---|---|---|
| Crude oil and ORF | 7.4 | 9.2 | -17.5 | -4.5 |
| LPG | 1.4 | 1.7 | -15.6 | 2.5 |
| Bunker fuel | 1.8 | 2.2 | 19.5 | 1.6 |
| Other petroleum products | 0.4 | 0.5 | -34.9 | -3.0 |
| Natural gas (LNG) | 30.5 | 37.5 | -35.9 | 11.3 |
| Metallurgical coal | 23.2 | 28.5 | -32.3 | -2.5 |
| Thermal coal | 16.0 | 19.7 | -21.4 | 1.3 |
| Uranium | 0.6 | 0.7 | -11.9 | -0.1 |
| Total | 81.2 | 100.0 | -29.7 | 1.5 |
Source: Department of Industry, Science and Resources, Commonwealth of Australia Resources and Energy Quarterly September 2022, Table 2(2)
Australia in the world energy market
Data published by the International Energy Agency (IEA), the World Nuclear Association and by BP are examined in this section to understand Australia’s role in the production of energy commodity resources and their trade in the context of world energy markets in 2020 and 2021. The IEA provides data in their World Energy Balances Highlights (2022) publication on primary energy production and trade for the world and selected countries during 2020. Additional historical data for countries and regions are also provided on the IEA website. Statistics on reserves, production and trade of fossil fuel resources (oil, gas and coal) for key countries and regions during 2021 are available in the BP Statistical Review of World Energy (BP 2022). Uranium production data for 2021 are published by the Nuclear Energy Agency (NEA 2023).
In 2021, global energy demand returned to about pre-COVID-19 levels, with primary energy consumption increasing by 5.8 per cent. Renewable energy and fossil fuel consumption each increased by about 5.6 per cent between 2020 and 2021.
World primary energy production
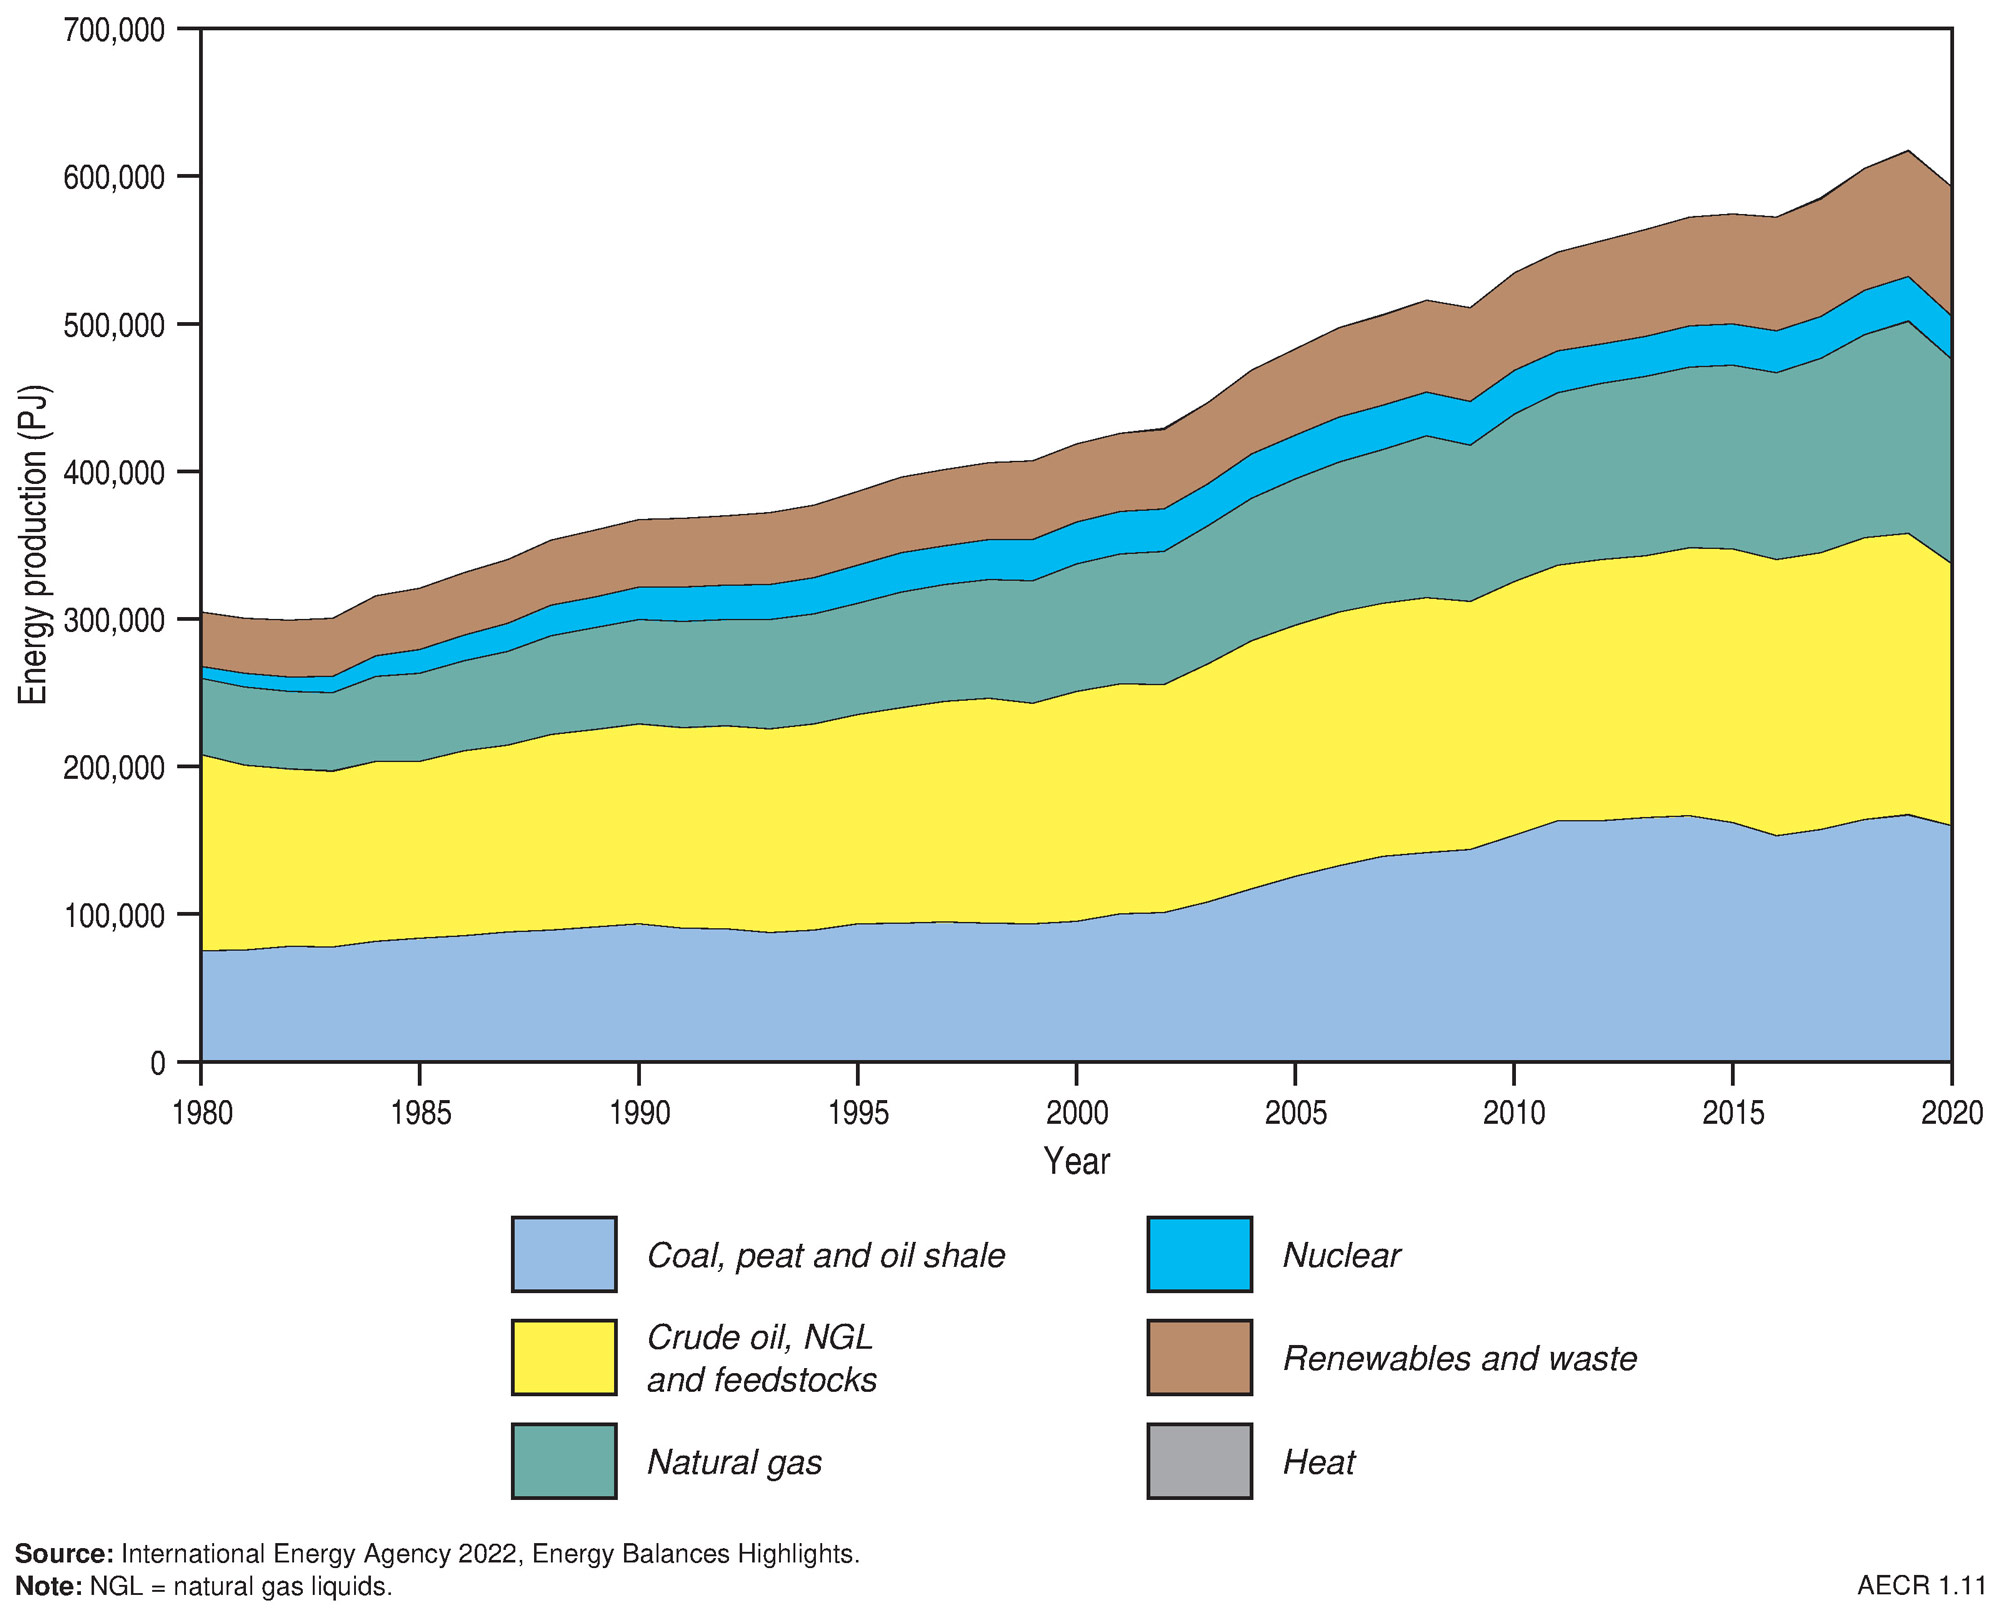
Primary energy production totalled 592,625 PJ in 2020, with about 45 per cent of all production originating in China, the US and Russia (Table 6). Australia was ranked the seventh highest primary energy producer in 2020 accounting for about 3 per cent (18,950 PJ) of all world energy production. Most global primary energy production was from oil (30 per cent), coal (27 per cent), and natural gas resources (23 per cent; Figure 8).
Global natural gas production increased in 2021 by 4.8 per cent (5.6 Tcf; 6,313 PJ) in response to a strong global rebound in gas demand, while the share of gas in primary energy consumption remained unchanged at 24.4 per cent. Gas production in Australia decreased slightly by 0.4 per cent (0.02 Tcf; 25 PJ) during 2021—similar to the 1.0 per cent (0.06 Tcf; 65 PJ) decline seen in 2020.
- At the end of 2021 Australia was the seventh largest natural gas producer, contributing about 3.6 per cent to global gas production.
Table 6. World energy production by country 2020
| Country | Energy production (PJ) | World share (%) | Rank | Major energy resources |
|---|---|---|---|---|
| People's Republic of China | 117,061 | 19.8% | 1 | Coal, renewables |
| United States | 90,437 | 15.3% | 2 | Natural gas, crude oil/NGL/feedstock |
| aRussian Federation | 61,472 | 10.4% | 3 | Natural gas, crude oil/NGL/feedstock |
| aSaudi Arabia | 25,477 | 4.3% | 4 | Natural gas, crude oil/NGL/feedstock |
| India | 23,781 | 4.0% | 5 | Coal, renewables |
| Australia | 18,950 | 3.2% | 7 | Coal, natural gas, uranium |
| World total | 592,625 |
The IEA defines nuclear energy as the electricity produced from nuclear power plants and therefore does not include extraction of uranium resources in their energy production data. See Table 2 for Australia's total energy production in 2020-21 including uranium extraction.
Source: International Energy Agency (2022a), World Energy Balances: Overview
a https://www.iea.org/countries
Global oil production increased by 1.6 per cent (1.4 MMbbl; 8.5 PJ) per day in 2021, with the largest production increases occurring in Libya (0.8 MMbbl/d; 5.2 PJ/d), Iran (0.5 MMbbl/d; 3.3 PJ/d), Canada (0.3 MMbbl/d; 1.8 PJ/d) and Russia (0.3 MMbbl/d; 1.7 PJ/d). Oil production in Australia decreased slightly by 6.1 per cent (0.03 MMbbl/d; 0.1 PJ/d).
- At the end of 2021, Australia was ranked 30th in the world for oil production, contributing only 0.5 per cent to global production.
Global production of black and brown coal increased by 5.9 per cent (8,936 PJ) in 2021, reversing the 5.2 per cent (8,300 PJ) decline in production seen in 2020. Much of this production increase was associated with domestic consumption in China (production up by 6.0 per cent; 4,631 PJ) and India (production up by 6.9 per cent; 840 PJ), together with increased exports from Indonesia (production up by 9.2 per cent; 1,240 PJ). Australia’s coal production increased in 2021 by 2.2 per cent (12 Mt; Hughes et al., 2023).
- In 2021, Australia was the world’s fourth largest producer of black and brown coal, contributing about 7.4 per cent to global production.
In 2021, global uranium production from mines increased by 0.3 per cent to 47,472 tonnes U (26,584 PJ). Increases in uranium production occurred in Canada (21.0 per cent; 814 tonnes; 456 PJ), Kazakhstan (12.0 per cent; 2,342 tonnes; 1,312 PJ) and Namibia (6.3 per cent; 341 tonnes; 191 PJ), while a significant production decline of 38.4 per cent (2,378 tonnes; 1,331 PJ) occurred in Australia associated with the closure of the Ranger mine.
- During 2021, Australia was the world’s fourth largest producer of uranium, contributing about 8.0 per cent to global production.
World trade
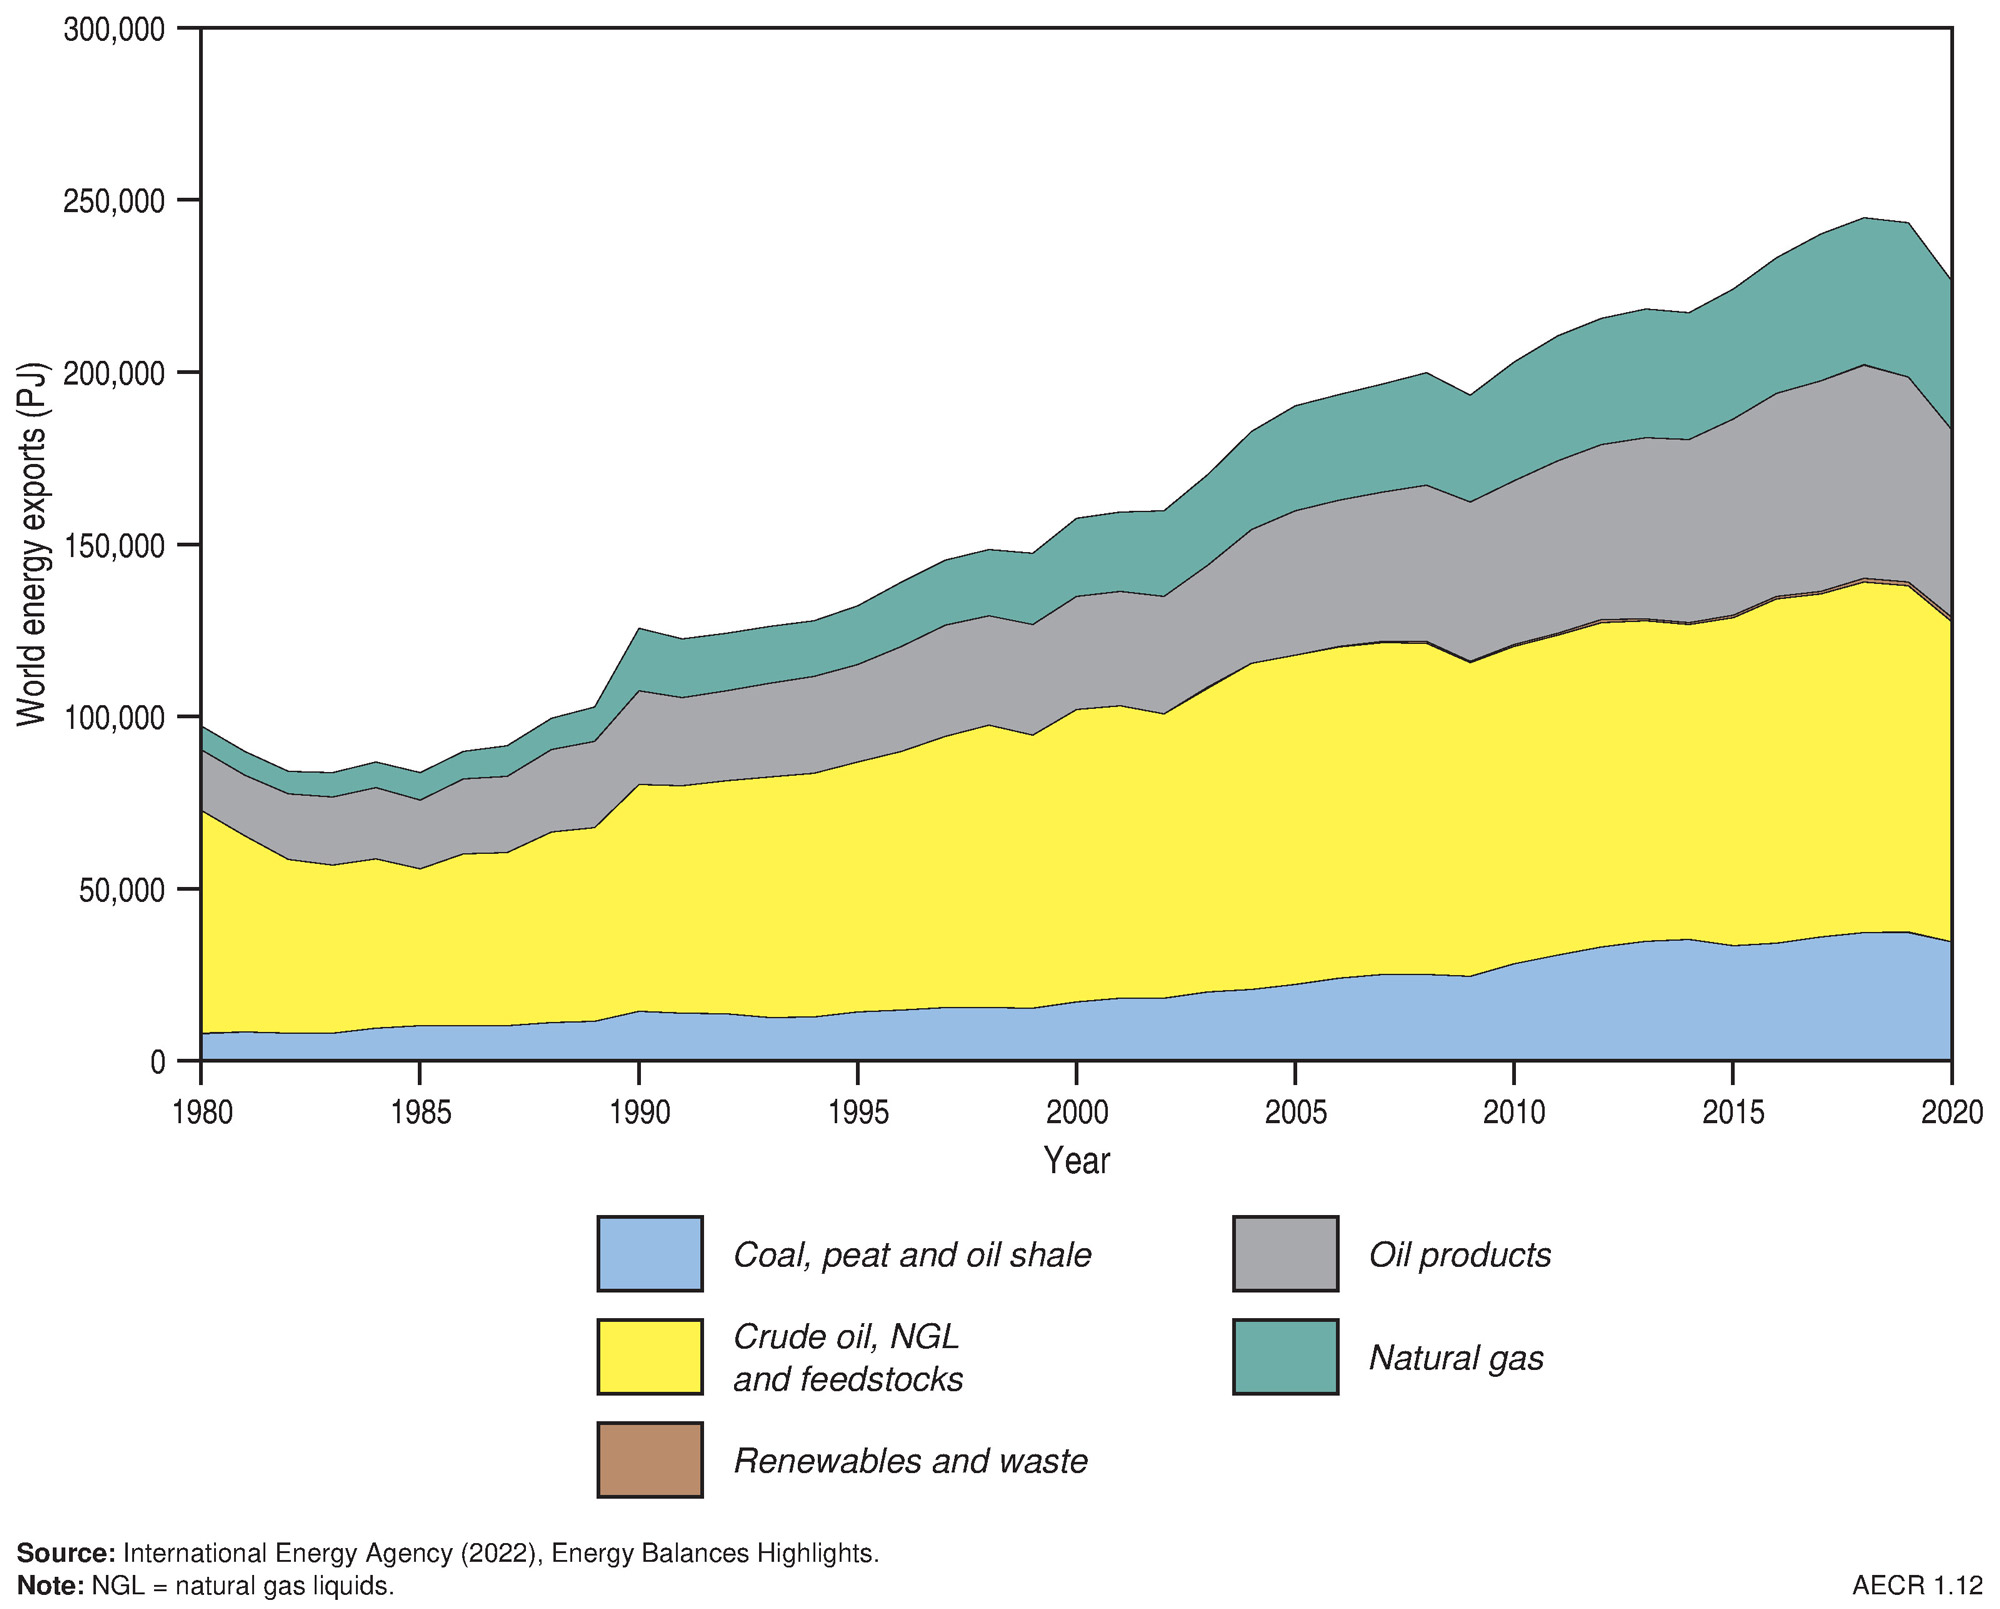
Fossil fuel exports in 2020 totalled 225,241 PJ, and included 93,079 PJ of oil resources (41 per cent share), 54,485 PJ of oil products (24 per cent share), 43,106 PJ of natural gas (19 per cent share), and 34,572 PJ of coal (15 per cent share; Figure 9). About 48.3 per cent of fossil fuel exports during this period originated from six countries—the Russian Federation (13.4 per cent), the United States (10.2 per cent), Saudi Arabia (7.9 per cent), Australia (6.7 per cent), Canada (5.5 per cent) and Indonesia (4.6 per cent; Table 7).
- In 2020, Australia was the world’s fourth largest exporter of fossil fuel resources.
During 2021 there was a 3.1 per cent (745 MMbbl; ~4,584 PJ) increase in the global trade of crude oil and refined products. The most significant growth in exports was from Russia (166 MMbbl; ~1,022 PJ) and Canada (88 MMbbl; ~541 PJ), while notable declines occurred in exports from the United States (2.9 per cent; 86 MMbbl; ~529 PJ) and Saudi Arabia (2.6 per cent; 76 MMbbl; ~467 PJ). Australia’s oil exports experienced a 5.5 per cent (5.0 MMbbl; ~29 PJ) decline in 2021.
Table 7. World energy commodity exports by country in 2020
| Country | Energy exports (PJ) | World share (%) | Rank | Major energy exports |
|---|---|---|---|---|
| Russian Federation | 30,101 | 13.4 | 1 | Largest natural gas exporter (pipeline & LNG) and major exporter of oil and coal |
| United States | 23,047 | 10.2 | 2 | Major exporter of oil and natural gas |
| aSaudi Arabia | 17,743 | 7.9 | 3 | Largest oil and NGL exporter |
| Australia | 15,169 | 6.7 | 4 | Largest exporter of coal, largest exporter of LNG |
| Canada | 12,456 | 5.5 | 5 | Major exporter of oil and natural gas |
| Indonesia | 10,314 | 4.6 | 6 | Second largest coal exporter |
| World Total | 225,241 |
Includes coal, natural gas, crude oil and natural gas liquids (NGL), and oil products Sources: International Energy Agency (2022a; https://www.iea.org/countries); a BP (2022) Statistical Review of World Energy
In 2021, global trade of natural gas increased by 8.5 per cent (2.7 Tcf; ~3,082 PJ), driven by an 11.6 per cent (1.8 Tcf; 2,046 PJ) increase in pipeline trade. LNG supply increased by 5.6 per cent (0.9 Tcf; 1,036 PJ), which is above the 10-year average of 4.6 per cent. Major growth in LNG exports occurred in the US (55.4 per cent; 1.2 Tcf; 1,339 PJ), while Australia showed a moderate increase of 2.2 per cent (0.07 Tcf; 81 PJ).
Coal exports experienced a 4.4 per cent (1,322 PJ) growth in 2021, with export increases seen in most major coal producing countries. Australia’s coal exports decreased by 1.5 per cent (5.6 Mt) in 2021, a continuation of the decline seen in 2020 (Department of Industry, Science and Resources, 2022a). Coal imports grew in most countries, with the exception of China which decreased coal imports by 0.8 per cent (73 PJ).
- In 2021–22, Australia was the world’s largest exporter of metallurgical coal and the second largest exporter of thermal coal (Department of Industry, Science and Resources, 2022a).
Ownership and administration of energy resources
The Australian Constitution specifies that mineral and petroleum resources are owned either by the Australian Government, or the state and territory governments. Exploration and development of these resources are undertaken by companies operating under licences and permits granted by the government. The Australian, state and territory governments actively encourage investment in Australia’s energy resources.
Petroleum exploration and production activities beyond three nautical miles from the territorial sea baseline and within Australia’s Exclusive Economic Zone (‘Commonwealth Waters’) are the responsibility of the Australian Government. These resources are governed under the Offshore Petroleum and Greenhouse Gas Storage Act 2006 and by maritime boundary treaties with neighbouring countries. The Joint Authorities (comprising the Commonwealth and state and territory governments), the National Offshore Petroleum Titles Administrator and the National Offshore Petroleum Safety and Environmental Management Authority grant, administer and regulate petroleum titles to ensure that exploration and development activities are compliant with the relevant regulatory frameworks.
Regulating the exploration for, and development of, non-renewable resources onshore and within three nautical miles offshore is the responsibility of state and territory governments. They are administered under the applicable state or territory legislation relating to minerals and petroleum. The legislation varies between jurisdictions but is similar in content and administration across the jurisdictions and is based on a two-stage award of exploration permit and production licence. An overview is provided in Australia's Energy and Mineral Resources Investor Guide, and more information is available from the relevant state and territory resources agencies.
Energy production and distribution infrastructure
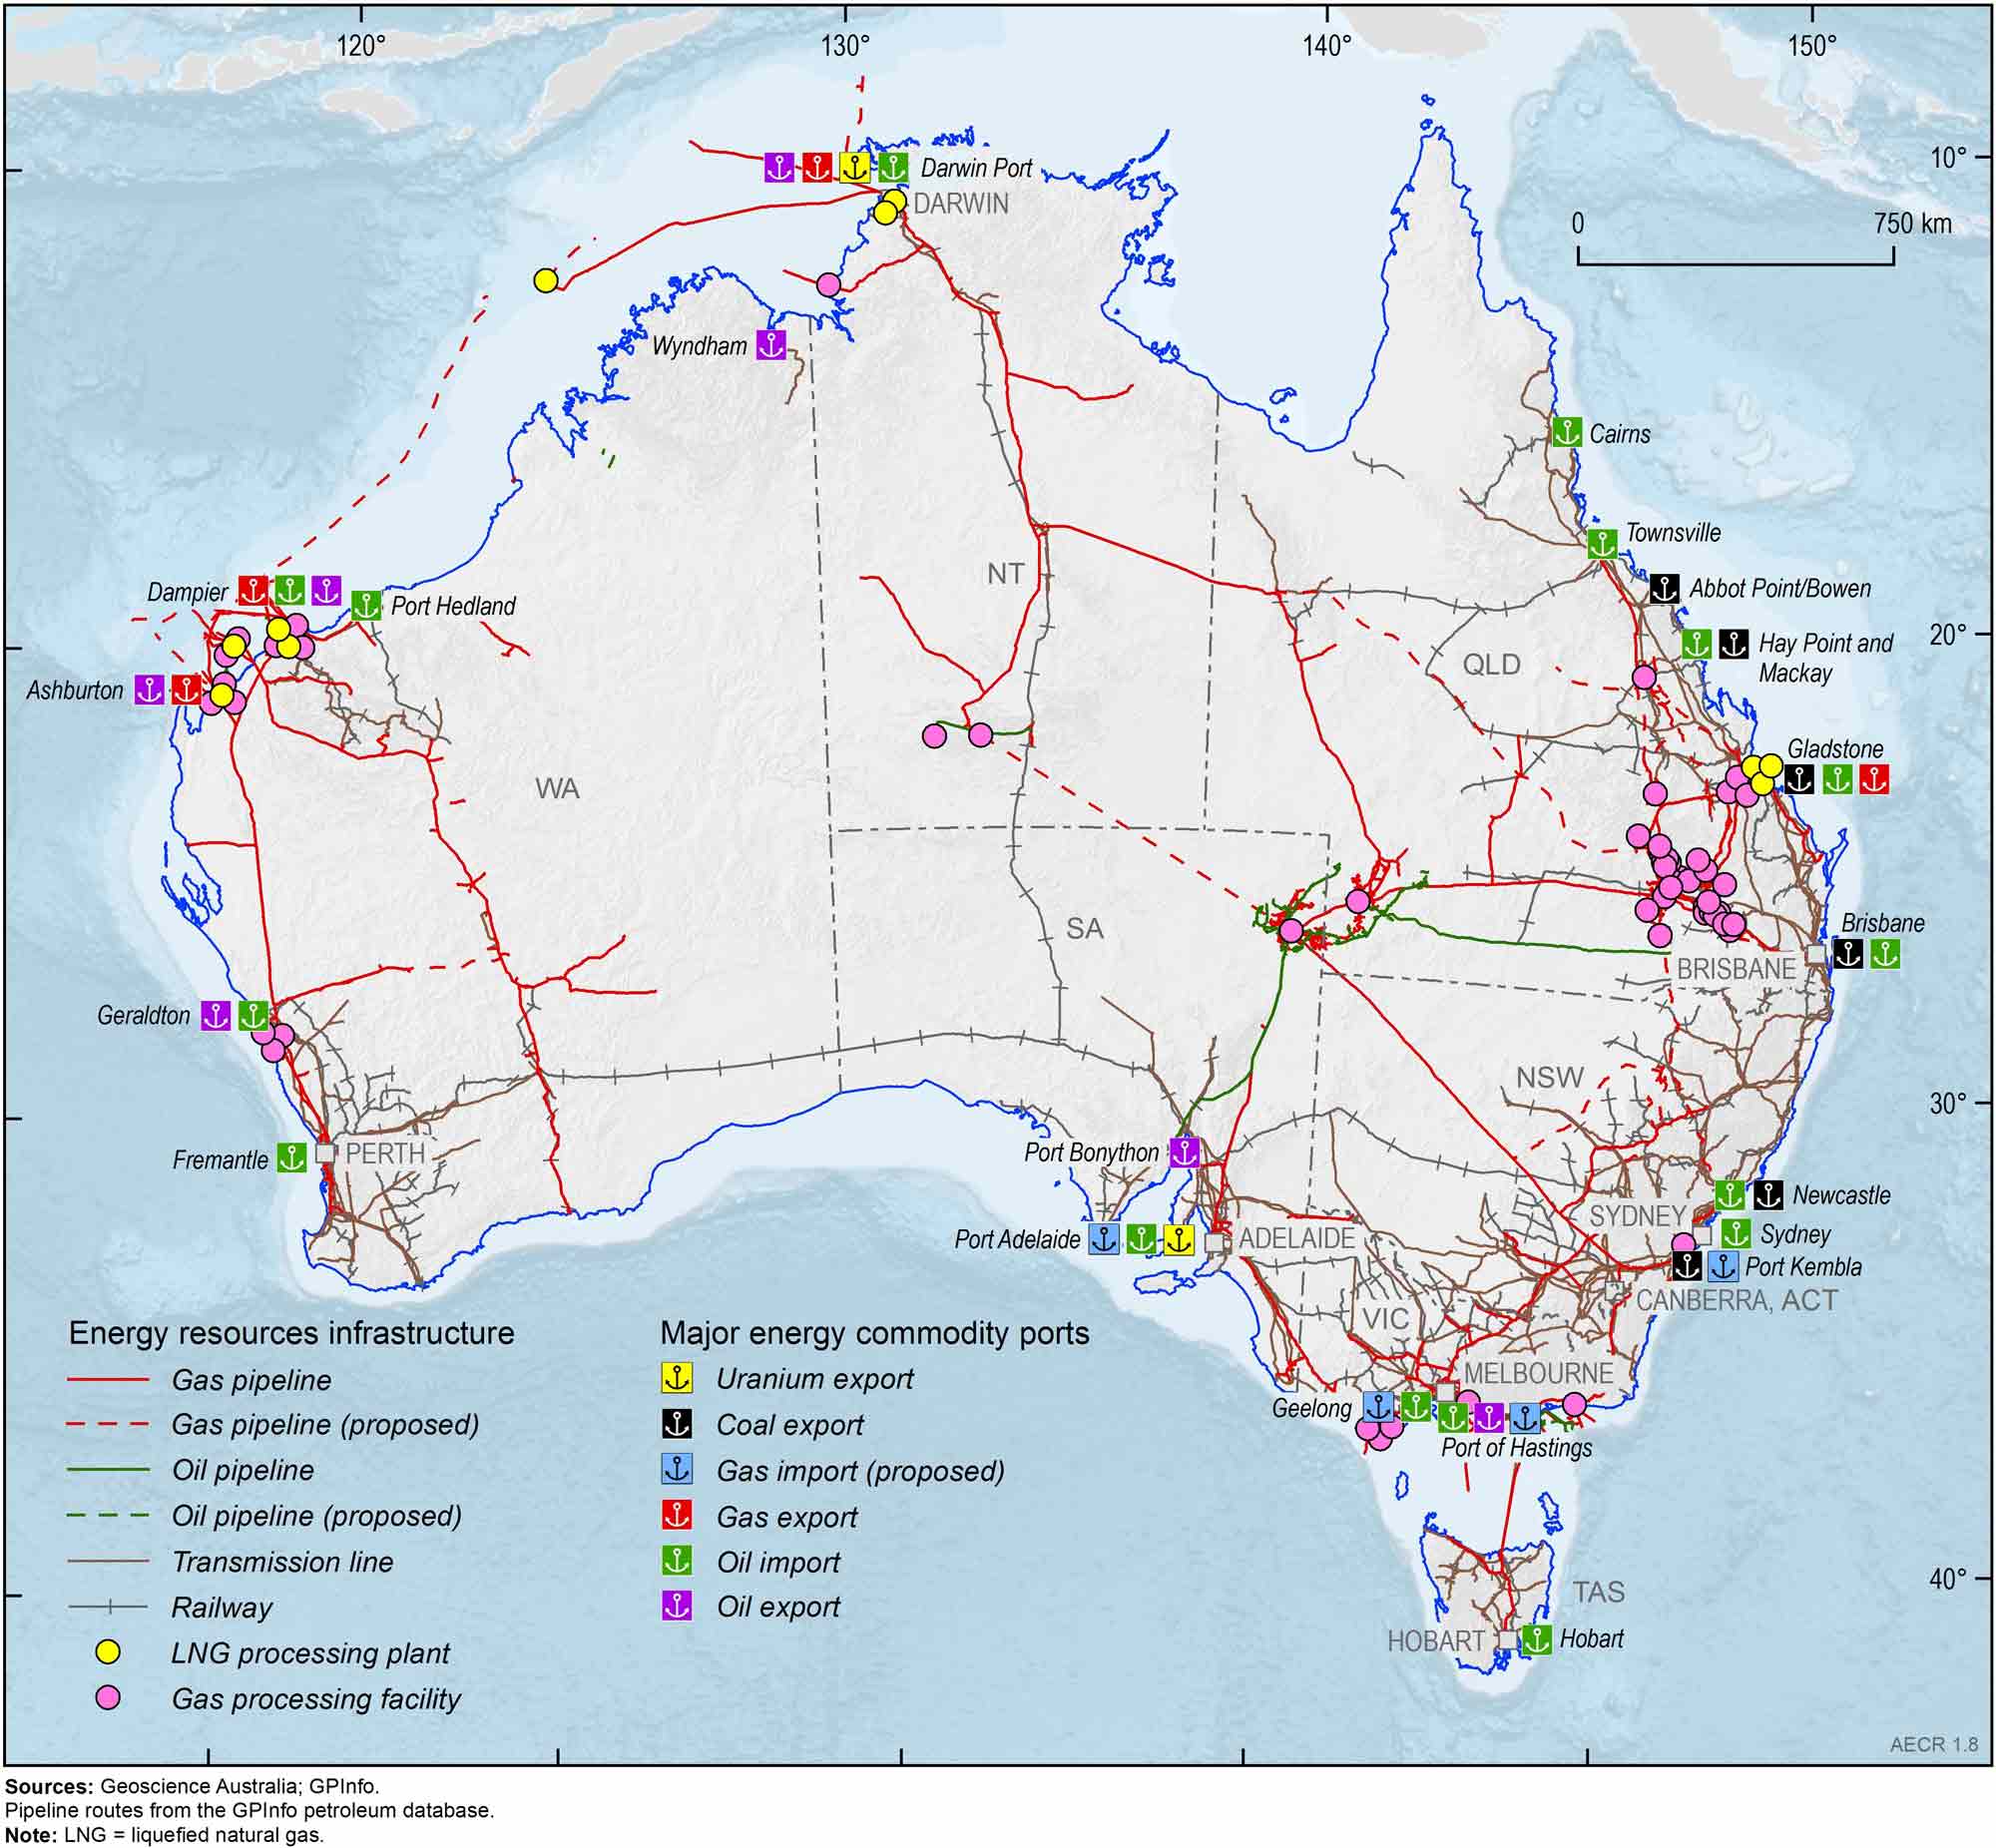
Utilisation of Australia’s abundant non-renewable energy resources requires investment in reliable energy supply infrastructure, including gas pipelines, gas processing and storage facilities, ports, and rail networks (Figure 10). Gas is distributed across a series of transmission pipelines from areas of extraction and processing plants to either ports for export as LNG, or to power stations, large industrial and commercial plants, mines, and local consumers via gas retailers for domestic consumption. Shipping is the main transport mode used to export Australia’s energy resources, including coal (six ports), petroleum liquids (nine ports and one floating facility), LNG (five ports and one floating facility), and uranium (two ports). Australia’s first hydrogen shipment was exported from Victoria’s Port Hastings in January 2022. Further details on Australia’s shipping trade are available from the Bureau of Infrastructure and Transport Research Economics (BITRE, 2023) and Ports Australia. Australia has a dedicated network of railway infrastructure for the transportation of coal and uranium resources from their extraction points to a number of major ports for export (Figure 10).
Gas pipelines
Gas pipelines in Australia consist of a series of major long-haul transmission pipelines, which deliver gas from production and processing facilities to domestic markets and export terminals (Figure 10). These pipelines typically have wide diameters and operate under high pressure to optimise transmission capacity.
An interconnected gas pipeline network, including sixteen major transmission pipelines, links gas fields in the Northern Territory, Queensland, South Australia and Victoria with industrial and domestic demand centres across eastern and southern Australia (AEMO, 2023). This interconnected gas transmission network has become increasingly important in recent years to ensure peak gas demand in southern states during winter is supplied by gas producing basins in northern Australia (AEMO, 2023). Five additional gas transmission pipelines have also been proposed to connect potential new gas projects in the Beetaloo Sub-basin, Galilee Basin, Gunnedah Basin and northern Bowen Basin (ACCC, 2023). The Western Australian gas market is serviced by ten major pipelines, which link gas fields in the Perth Basin and the North West Shelf to the mining sector and domestic markets (AEMO, 2022). Construction also began in 2021 on the 580 km Northern Goldfields interconnect, which will allow gas from the Perth Basin to meet demand in the Kalgoorlie region (AEMO, 2022).
Gas storage facilities
Gas storage facilities provide flexible capacity to meet domestic consumption requirements by storing surplus gas produced during low demand periods in summer to meet increased demand during winter. In 2022, gas storage facilities include two depleted gas fields in Western Australia (Mondarra and Tubridgi), four facilities using depleted gas fields in eastern Australia (Roma, Moomba, Silver Springs and Iona), and two LNG storage facilities in eastern Australia (Newcastle and Dandenong; AEMO, 2022, 2023). There are plans to expand the capacity of the Iona gas storage facility in the Otway Basin and develop a new underground gas storage facility in the Gippsland Basin (Golden Beach) to help manage the forecast gas supply shortfalls in southern states during very high demand conditions (AEMO, 2023).
Proposed LNG import terminals
LNG import terminals represent an alternative source of gas for consumers in eastern Australia. Four LNG import terminals have been proposed as of January 2023 (AIE Port Kembla, Venice Outer Harbour, Viva Geelong, Vopak Avalon; ACCC, 2023) to help offset declining production from gas fields in southern Australia, thereby securing seasonal and peak supply requirements. These terminals could source gas from both international and domestic markets, potentially providing a virtual pipeline from Australia’s northern gas fields to southern demand centres. The Port Kembla Energy Terminal is currently the only committed project with expected completion of onshore infrastructure in December 2024, and operations possibly commencing in early 2026 (AEMO, 2023).
Enabling Clean Energy Technologies
Clean energy technologies are rapidly being developed in Australia to meet emission reduction targets, including renewable energy, carbon capture and storage (CCS), as well as zero and low emissions hydrogen production. In 2021, the Australian Government committed to reach net zero carbon dioxide (CO2) emissions by 2050, and in 2022, a more ambitious emissions reduction target was established to cut emissions by 43 per cent on 2005 levels by 2030 (Department of Industry, Science, Energy and Resources, 2022). In 2023, reforms to the Safeguard Mechanism, scheduled to begin on 1 July 2023 were made and will further reduce emissions limits and set a trajectory for large emitters to achieve net zero emissions by 2050 (Department of Climate Change, Energy, the Environment and Water, 2023).
Hydrogen
The National Hydrogen Strategy identifies hydrogen as a key technology for decarbonising Australia’s economy (Commonwealth of Australia, 2019). The 2022 State of Hydrogen Report (Department of Climate Change, Energy, the Environment and Water, 2022b) states that Australian-produced hydrogen will be essential to Australia’s goals of becoming a renewable energy superpower and clean energy user and exporter. In particular, hydrogen and ammonia have an important role to play in decarbonising hard to abate sectors where there are no alternative solutions or where implementation of alternative decarbonisation technologies is expensive or impractical, such as heavy industry (e.g. iron, steel, alumina), large-scale and heavy duty transport (e.g. aviation, shipping, heavy-duty trucks), chemical and petrochemical, mining, agricultural and energy storage sectors (IEA, 2022b; Department of Climate Change, Energy, the Environment and Water, 2022b).
There are two primary methods currently available for producing low- and no-emissions hydrogen:
- using renewable energy sources such as solar and wind power to split hydrogen from water using a process known as electrolysis;
- through a thermochemical reaction using water and fossil fuel feedstocks such as coal (coal gasification) or natural gas (steam methane reforming), with the CO2 emissions created as a by-product captured and stored in deep sub‑surface geological formations.
In 2021 global demand for hydrogen was 94 Mt (IEA, 2022a). To date the majority of all hydrogen produced has been derived from fossil fuels without carbon capture and storage, and is responsible for the emission of 900 Mt of CO2 per year (IEA, 2022b). Current global production of low emissions hydrogen is minor, accounting for less than 1 per cent of all hydrogen production in 2021 (IEA, 2022b), but this is expected to increase to more than 30 per cent by 2030 (IEA, 2022b). The projected global demand for renewable hydrogen and ammonia by 2030 doubled in the last year to 30 Mt per annum, due to geo-strategic developments in Europe leading to increased national renewable hydrogen demand targets (Department of Climate Change, Energy, the Environment and Water, 2022b; IEA, 2022d).
Demand for hydrogen in Australia is still low, however, interest in this commodity is increasing. Examples of new opportunities for hydrogen use include chemical feedstock, for which renewable hydrogen and ammonia is used to replace fossil fuel-derived hydrogen. Also, as demonstrated by the Hydrogen Energy Supply Chain (HESC) project (Department of Climate Change, Energy, the Environment and Water, 2022b,) hydrogen volumes can be exported to support electricity generation overseas.
Australia’s hydrogen potential
Being recognised for its large potential for renewable energy generation, abundant identified resources of natural gas and coal, and potential large-scale geological storage sites for any co‑produced CO2, Australia is well placed to become a major hydrogen producer for both domestic consumption and export. Development of a domestic hydrogen industry will not only ensure Australia’s future energy security, but also enable its abundant non-renewable energy resources to be transformed into a carbon free energy source for overseas markets. There is already significant interest in Australia’s future hydrogen production. Some $230–300 billion are currently in the investment pipeline for hydrogen and derivatives (Department of Industry, Science, Energy and Resources, 2022). This represents 40 per cent of announced global renewable hydrogen projects. However as of December 2022, only one project greater than 10 MW capacity had passed Final Investment Decision (FID) ( Department of Climate Change, Energy, the Environment and Water, 2022b).
The level of hydrogen investment represents 43 per cent of all planned energy and mineral resource investment into Australia, up from 35 per cent in 2021 (Department of Industry, Science, Energy and Resources, 2022). Investment from Australian state/territory and federal governments is also increasing. The 2022 State of Hydrogen publication reports that there is a total of $6.3 billion of committed hydrogen specific support and up to $35.2 billion of hydrogen eligible support through a range of programs including the National Reconstruction Fund (Department of Climate Change, Energy, the Environment and Water, 2022b)
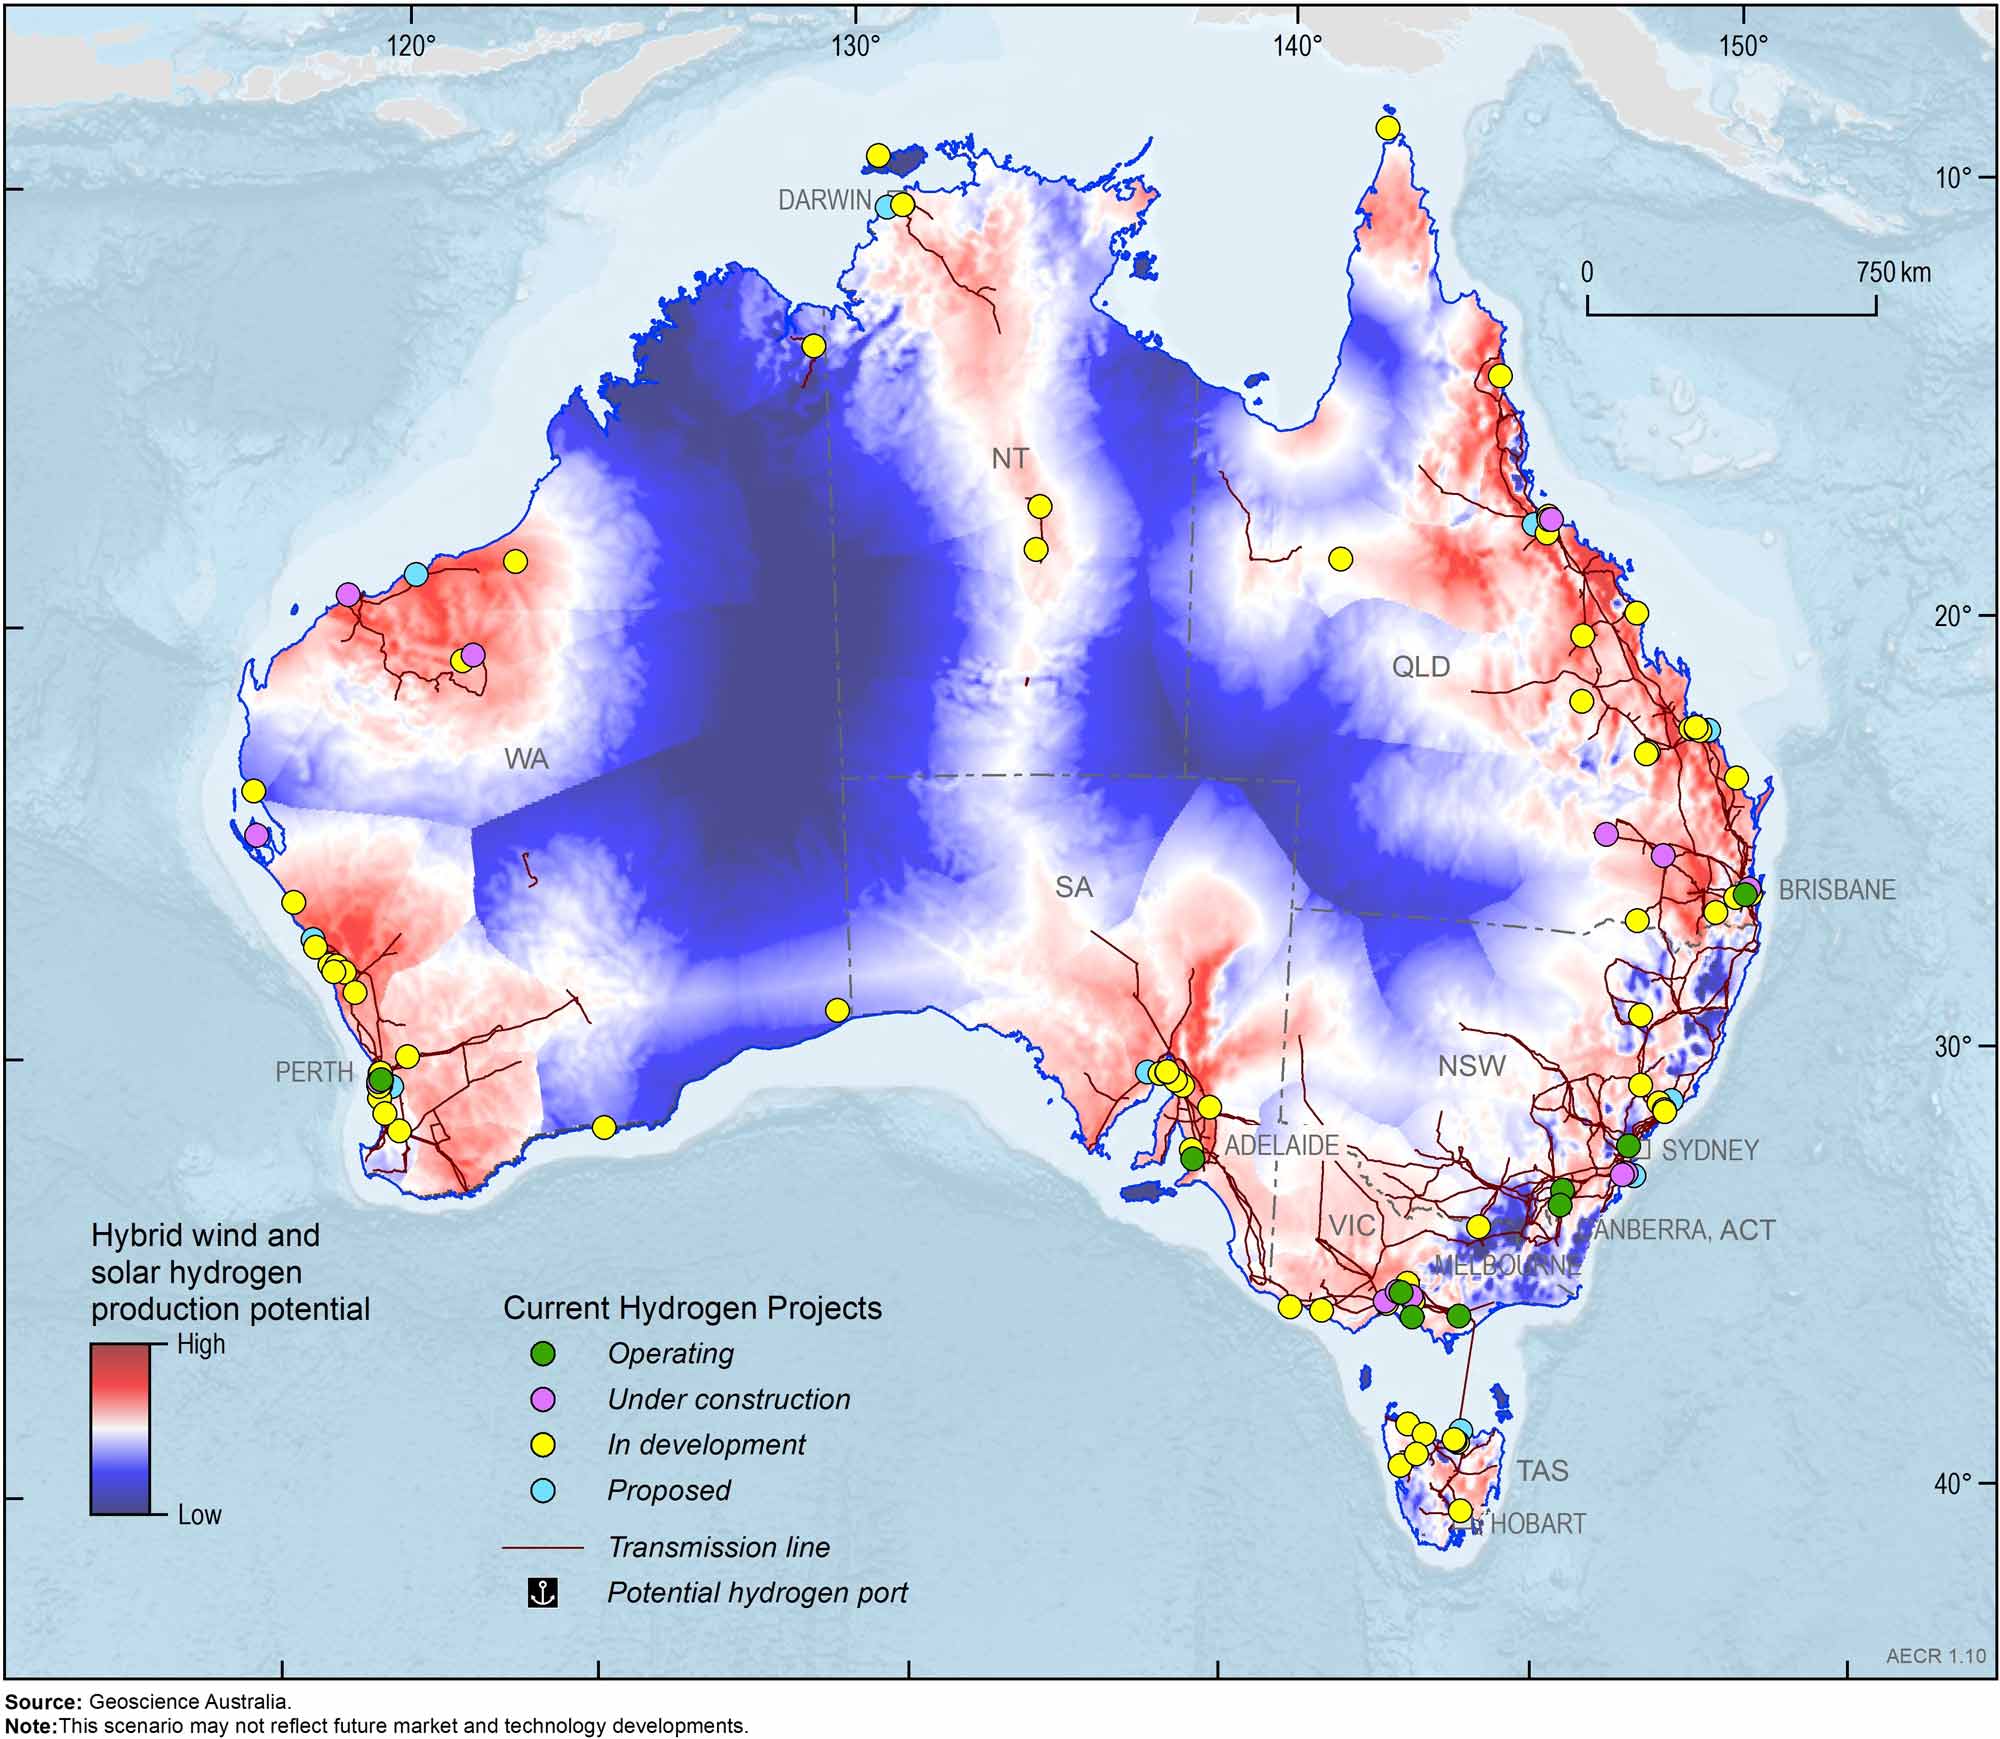
Geoscience Australia’s AusH2 data portal provides open access to data sets and tools to assist governments and industry to assess Australia’s hydrogen potential. One of these tools is the Hydrogen Economic Fairways Tool (HEFT). Released in 2021, HEFT helps policymakers and investors make decisions about the location of new infrastructure and the development of hydrogen hubs. The tool conducts detailed geospatial-economic analysis of future large-scale hydrogen projects and considers hydrogen produced by renewable energy and from fossil fuels with CCS.
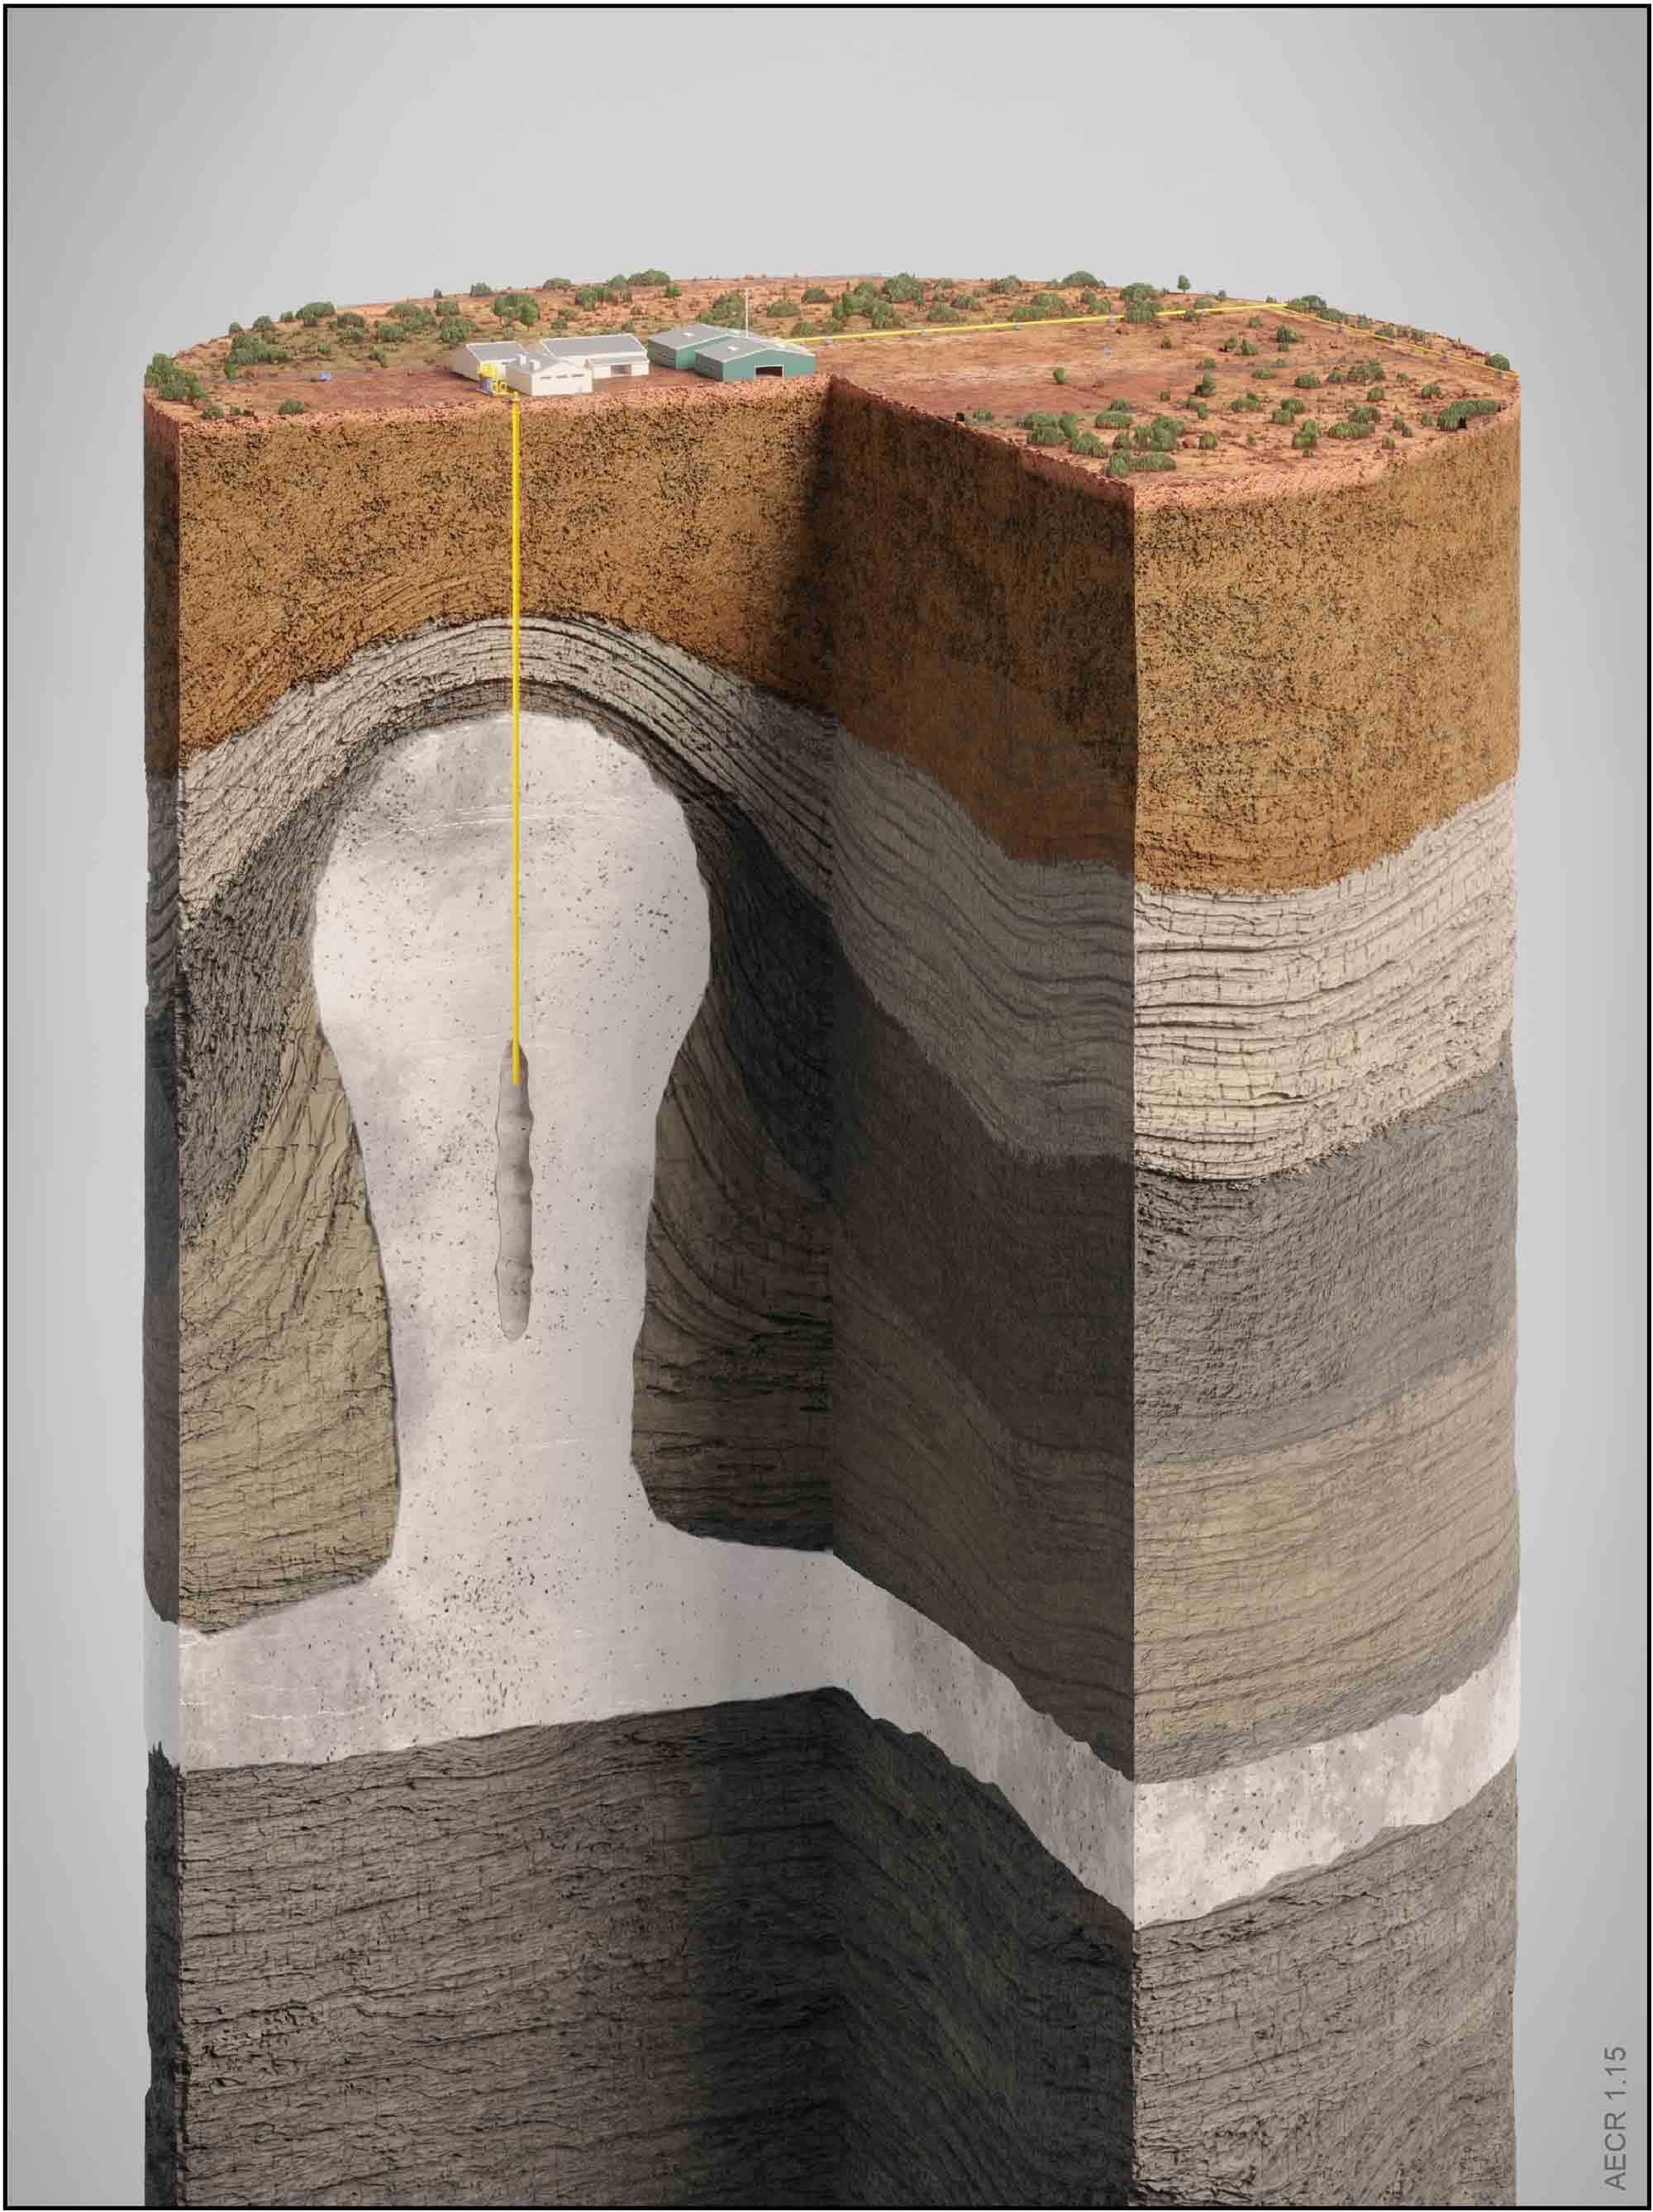
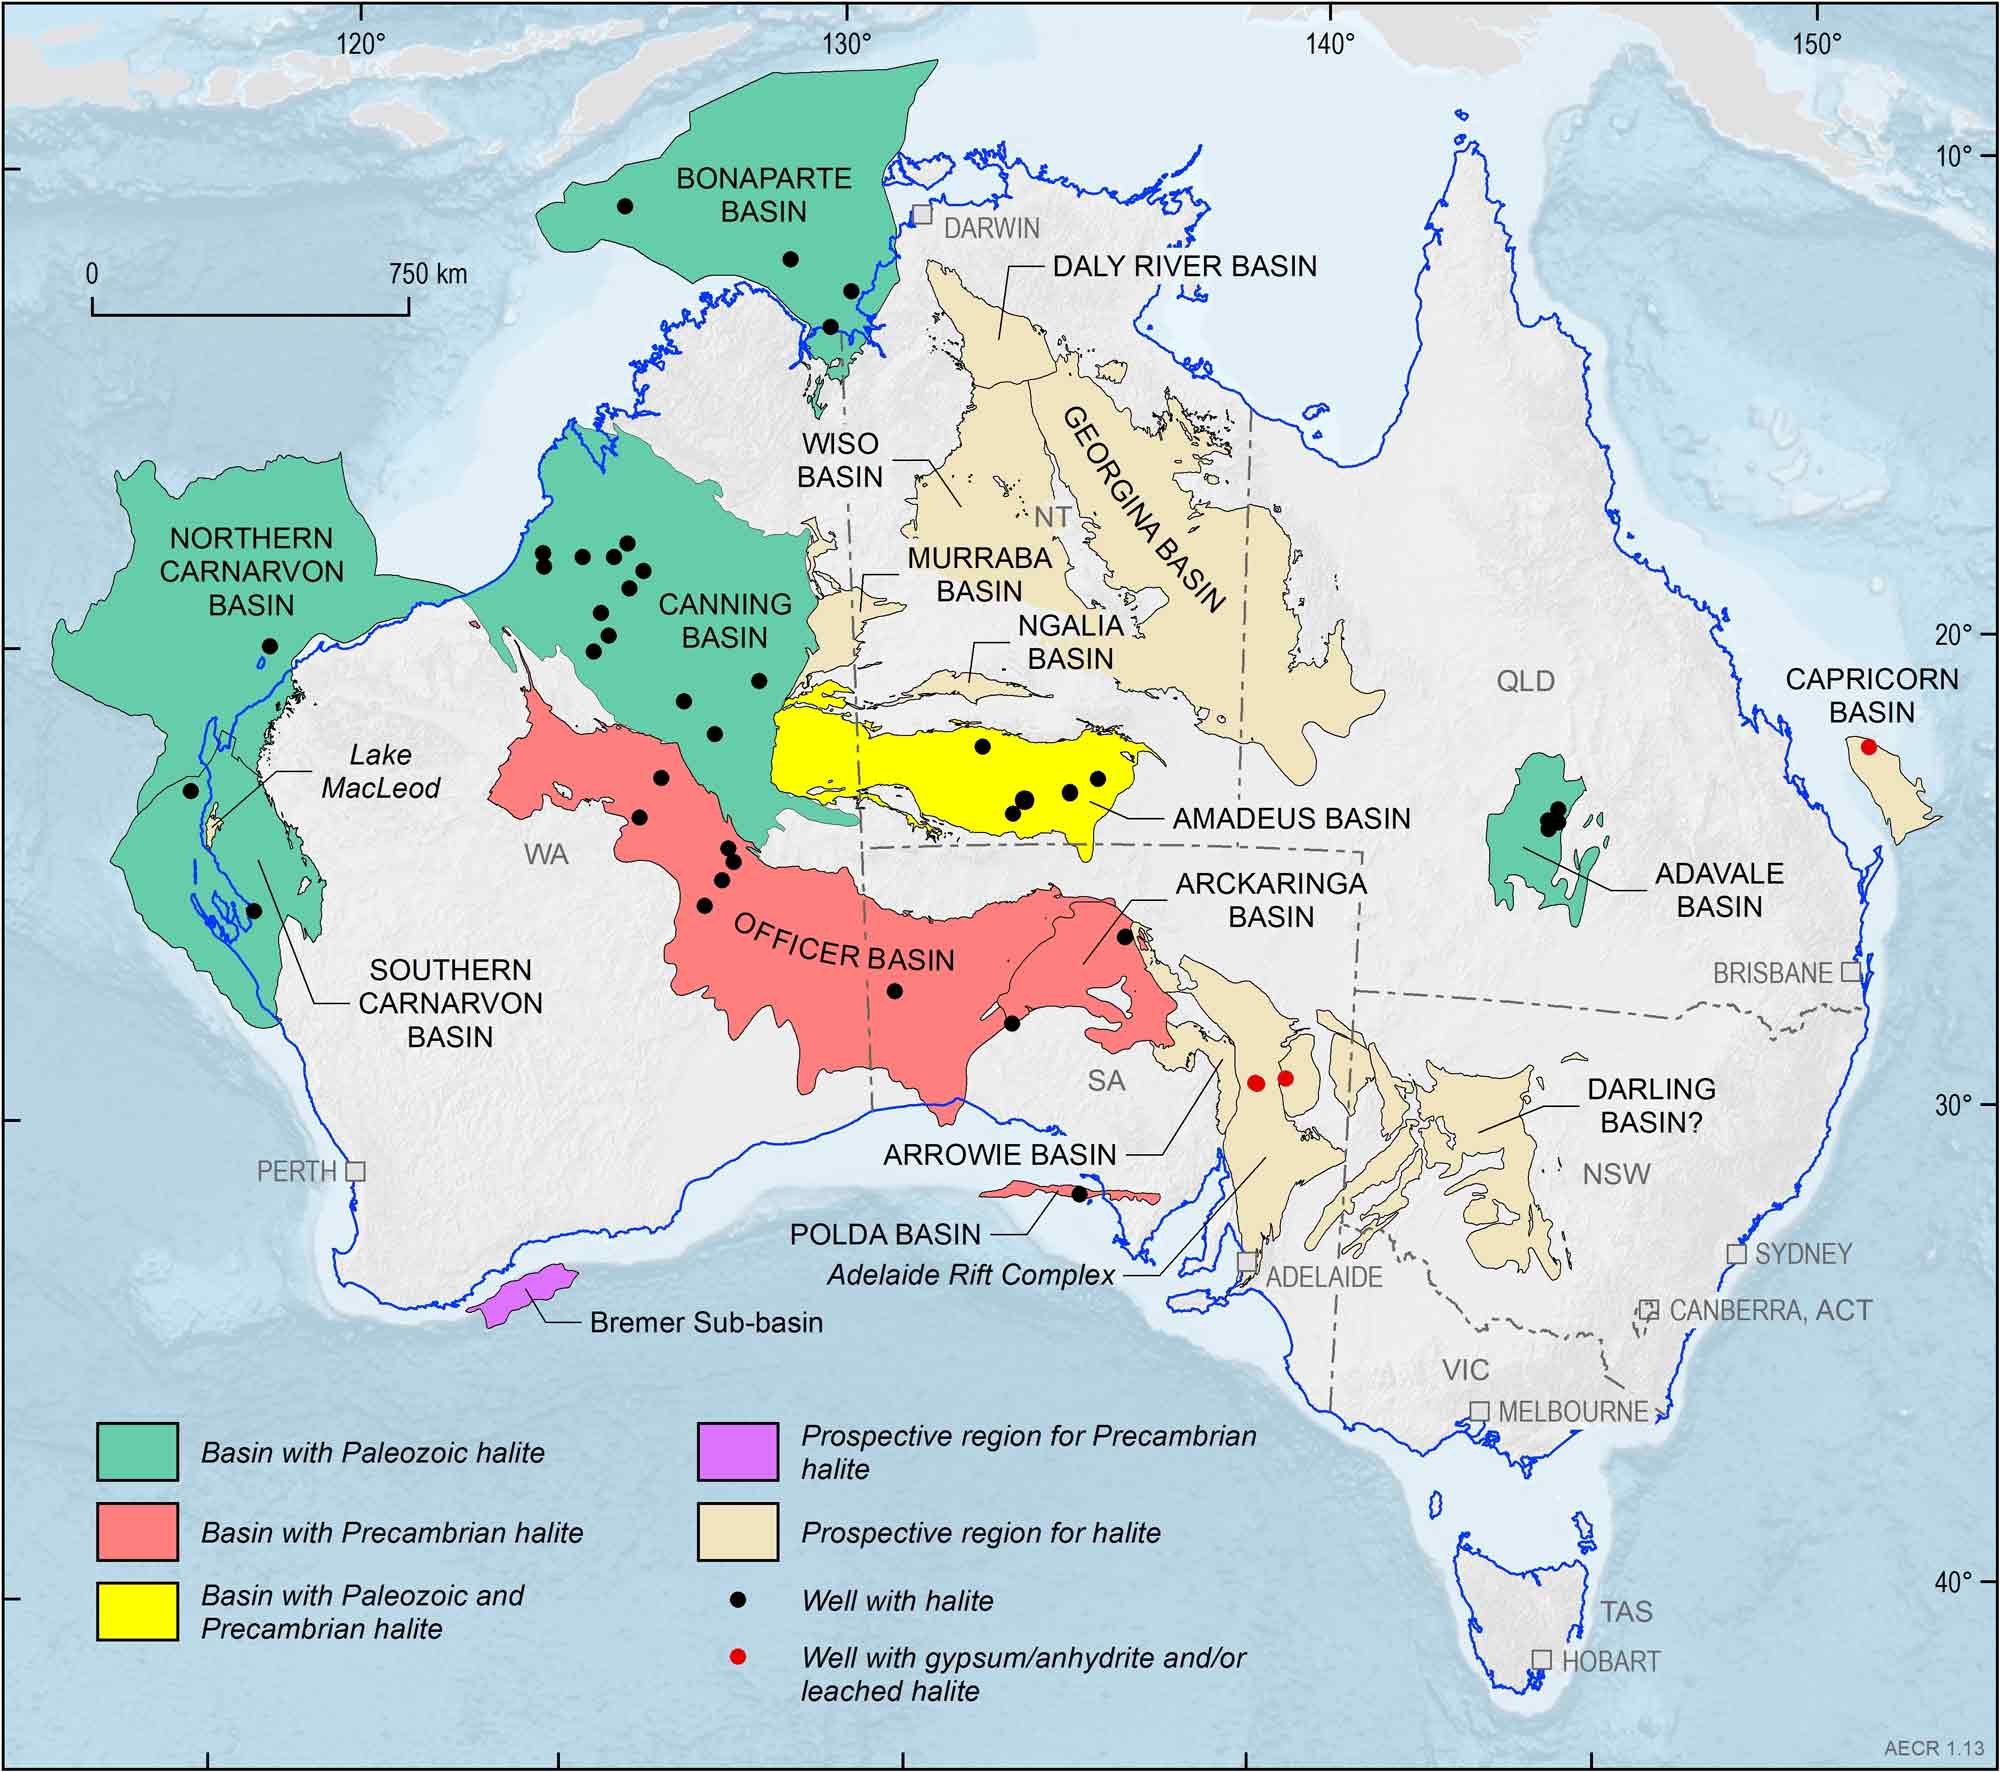
Like natural gas or LNG, hydrogen can be transported by pipelines, trucks or ships in compressed, liquefied form, or as a chemical compound such as ammonia or methylcyclohexane. Hydrogen can be stored in tanks on the surface, or in sub‑surface salt caverns or depleted gas fields. Storage infrastructure is essential to enable hydrogen to be produced and stored during periods of low energy demand, then distributed to demand centres during periods of high energy consumption. Geoscience Australia is currently mapping the distribution of potential hydrogen storage sites, particularly thick underground salt accumulations, under its Exploring for the Future Program (Figure 11; Figure 12), and using modelling to understand any technical issues related to subsurface injection and production of stored hydrogen. A recent feasibility study on underground hydrogen storage in a salt cavern with a diameter of 60 m (depth range 1,650–2000 m) estimates this scale hydrogen storage site would have an equivalent energy storage capacity of 240 GWh (Feitz et al., 2022), which is comparable to the Snowy 2.0 Project’s storage capacity of 350 GWh once operating in 2026 (Snowy Hydro, 2020).
Australia’s hydrogen projects
There are several pilot, demonstration and small-scale projects in various stages of operation in Australia. Figure 13 shows the location of current hydrogen projects in Australia and the results of a mapping scenario using the HEFT tool that considers hydrogen production from electrolysis and hybrid wind and solar. The total number of hydrogen projects has increased from 82 at the end of 2021 to 110 at the end of 2022. The number of operational projects or projects under construction has also increased from 20 in 2021 to 22 in 2022. These projects are still small, with the largest operational project Hydrogen Park South Australia (HyP SA), producing 175 tonnes per year from electrolysis using renewable energy.
Australia’s Gippsland Basin is the location for a world first project, the Hydrogen Energy Supply Chain (HESC) Project, which demonstrated the feasibility of producing clean liquid hydrogen from brown coal resources in the La Trobe Valley for export to Japan. This first pilot hydrogen export project commenced hydrogen production in early 2021, and in February 2022, the world’s first purpose-built liquefied hydrogen carrier, the Suiso Frontier, delivered liquid hydrogen from the HESC facility to Kobe, Japan (HESC, 2023). The success of the HESC demonstration has led to the establishment of the commercial-scale Liquefied Hydrogen Supply Chain Commercial Demonstration Project between Victoria and Japan, with funding of approximately AUD$2.35 billion from the Japanese Government’s Green Innovation Fund. Up to 225,000 tonnes of low-emissions, economically viable hydrogen could be produced each year through the gasification of coal, with storage of by-product CO2 in the Gippsland Basin.
Carbon Capture and Storage
Carbon Capture and Storage (CCS), also referred to as carbon capture, utilisation and storage (CCUS) is a mature technology that prevents the release of CO2 from stationary anthropogenic sources and can also be used to remove historic CO2 emissions directly from the atmosphere. The CCS value chain includes capturing, transporting, compressing, and utilising or injecting the anthropogenic CO2 into deep underground geological formations where it is monitored and permanently trapped.
The scientific consensus is that it will be almost impossible to reach net-zero emissions by 2050 without a significant global scale up of CCS (IEA, 2020, 2021; IPCC, 2022). Globally, around 35 commercial CCUS projects capture nearly 45 Mt of CO2 per year (IEA, 2022c). In the IEA’s updated net zero emissions scenario, this needs to increase to 1.2 Gt of CO2 per year by 2030 and 6.2 Gt CO2 per year by 2050 (IEA, 2022d).
The IEA scenarios conclude that even with full electrification, CCS will be required to abate emissions from industrial sectors, which cannot be fully electrified at this point in time and have no alternative feedstock to natural gas or coal, or for those sectors where CO2 is a by-product of the manufacturing process. CCS is one of the few solutions available for reducing emissions from heavy industries such as iron and aluminium, steel, cement, fertiliser and chemical manufacturing, as well as from natural gas processing and blue (fossil fuel plus CCS) hydrogen production. CCS also underpins direct removal and permanent geological sequestration of historically-emitted CO2 from the atmosphere through direct air capture and storage (or DACS), which is expected to play an increasingly important role in meeting the global carbon budget well into the future (IEA, 2022e).
CCS in Australia
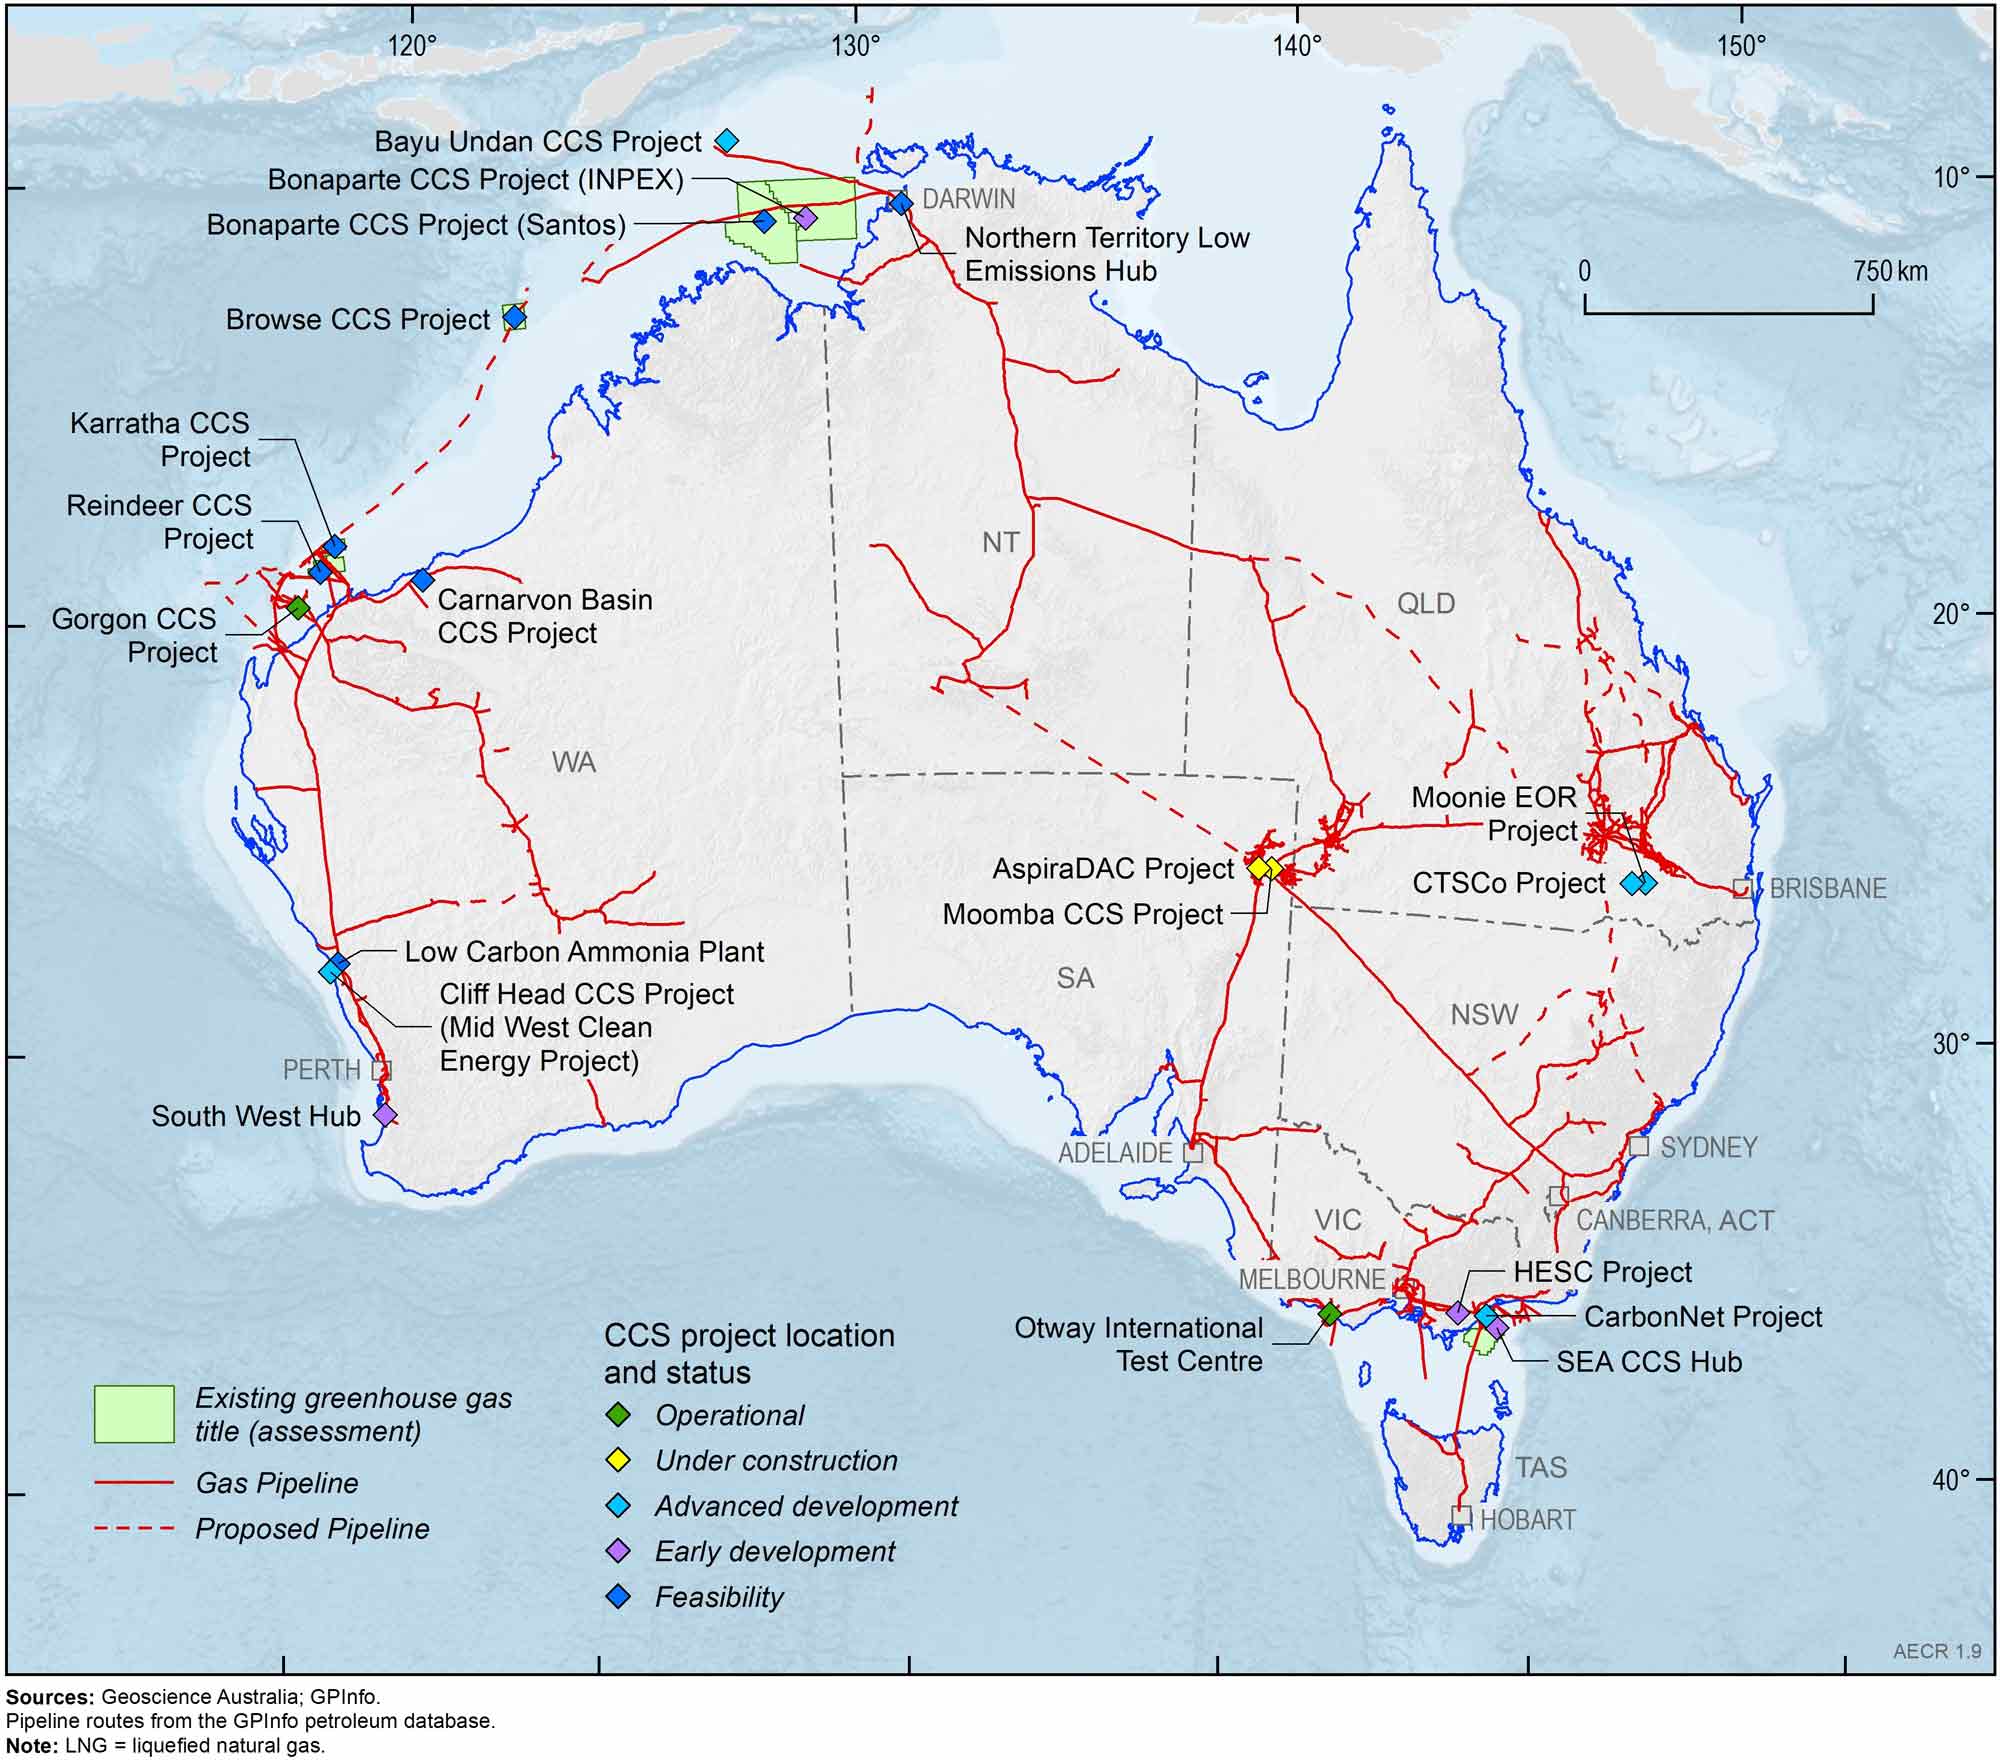
Australia currently has one operating commercial-scale full-chain capture and storage project (Gorgon CCS), one operational research and demonstration project (Otway International Test Centre), and a growing number of commercial-scale projects at various stages of development, both onshore and offshore (Figure 14; Table 8).
Table 8. Operating and planned CO2 storage projects in Australia
| Project | Basin | Operators | Storage Type | Status | Estimated scale | Start date |
|---|---|---|---|---|---|---|
| Bayu Undan | Bonaparte | Santos, SK E&S, INPEX, ENI, JERA, Tokyo Gas | Depleted Field | Advanced development | 2.3 Mtpa (up to 10 Mtpa) | 2027 |
| Bonaparte CCS (INPEX) | Bonaparte | Inpex Browse E&P, Total Energies CCS Australia, Woodside Energy | Saline aquifer | Early development | 2 Mtpa (up to 7 Mtpa) | > 2026 |
| Bonaparte CCS (Santos) | Bonaparte | Santos, Chevron Australia, SK E&S | Saline aquifer | Feasibility | ||
| Browse CCS | Browse | Woodside Energy, Shell, BP, MIMI, PetroChina | Depleted field, saline aquifer | Feasibility | ||
| CarbonNet | Gippsland | Victorian Government, Australian Government | Saline aquifer | Advanced development | 5 Mtpa (125 Mt at Pelican) | 2030 |
| Carnarvon Basin CCS | Carnarvon | Buru Energy, Energy Resources | Saline aquifer | Feasibility | ||
| Cliff Head CCS (Mid West Clean Energy Project) | Perth | Triangle Energy, Pilot Energy | Depleted Field | Advanced development | 0.665 Mtpa (9.7 Mt) | 2026 |
| CTSCo | Surat | CTSCo (Glencore), Australian Government, LETA, ANLEC R&D, Marubeni, J Power | Saline aquifer | Advanced development | Demonstration - 0.11 Mtpa (0.33 Mt) | 2025-26 |
| Gorgon CCS | Carnarvon | Chevron, ExxonMobil, Shell, Osaka Gas, Tokyo Gas, JERA | Saline aquifer | Operating | >100 Mt (>7 Mt stored to date) | 2019 |
| Karratha CCS | Carnarvon | Woodside Energy, BP, MIMI, Shell, Chevron | Depleted field | Feasibility | Up to 5 Mtpa (est) | |
| Moomba CCS | Cooper | Santos, Beach Energy | Depleted Field | Under construction | 1.7 Mtpa | 2024 |
| Moonie CO2-EOR | Surat | New Hope (Bridgeport Energy) | Depleted Field | Advanced development | 0.12 Mtpa (0.8-1 Mt) | 2023 |
| Otway International Test Centre | Otway | CO2CRC | Saline aquifer, depleted field | Operating | Research (>95 kt stored) | 2008 |
| Reindeer CCS | Carnarvon | Santos, Chevron Australia | Depleted field, saline aquifer | Feasibility | 4-5 Mtpa | 2028 |
| SeaCCS Hub | Gippsland | Esso Australia (ExxonMobil), BHP Petroleum (Woodside Energy) | Depleted Field | Early development | 2 Mtpa | 2025 |
| South West Hub | Perth | Western Australian Government, Verve Energy, Griffin Energy, Westfarmers Premier Coal, Alcoa Australia, Perdaman Chemicals & Fertilisers | Saline aquifer | Early development | 0.8 Mtpa |
Mt = Mega tonnes
Notes: The AspiraDAC, HESC, Low Carbon Ammonia and Nothern Territory Low Emissions Hub projects are carbon dioxide capture points for nearby storage hubs (Moomba, SeaCCS, CarbonNet, Cliff Head CCS, Bonaparte Basin CCS). Not mentioned are carbon utilisation projects including MCI Carbon Platform, Boral CCUS, Wallumbilla Renewable Methane Demonstration, Buckland Basalt Carbon Management Project, and CStore, a mobile offshore injection platform concept.
Enabling legislative framework
Offshore CCS projects in Commonwealth waters are conducted under the Offshore Petroleum and Greenhouse Gas Storage (OPGGS) Act 2006, while onshore projects are governed under equivalent state or territory legislation (in some jurisdictions legislation is still in development). Project proponents are able to nominate and bid for greenhouse gas acreage, which enables exploration for suitable geological storage formations and can ultimately lead to the granting of CO2 injection licences. Under the 2021 Offshore Greenhouse Gas Storage Acreage Release, the first since 2014, five permits were awarded for CO2 storage exploration offshore the Northern Territory (Bonaparte Basin) and Western Australia (Browse and Northern Carnarvon Basins) (Department of Industry, Science and Resources, 2022b; King, 2022; NOPTA, 2023).
CCS Projects
The majority of Australia’s planned CO2 storage projects are associated with the production of natural gas/LNG and new gas field developments. Natural gas can contain significant (>10 per cent) concentrations of CO2. Previously, common practice was to separate the CO2 from the natural gas stream and vent it to the atmosphere. Venting practices are becoming less acceptable, however, as concerns mount about increasing CO2 emissions to the atmosphere, and as requirements under legislation such as the Safeguard Mechanism come into effect.
The Gorgon CCS project on Barrow Island, Western Australia, is Australia’s first operating commercial-scale CCS project. The CO2 associated with natural gas from the Gorgon and Io-Jansz fields is captured and stored in the Upper Jurassic Dupuy Formation in the Barrow Sub-basin, around 2,000 m beneath Barrow Island. The project has stored in excess of 7 million tonnes of CO2 between the commencement of injection in August 2019 and October 2022, and is expected to store more than 100 Mt of CO2 during its 40-year plus lifetime (Chevron, 2023).
Australia currently has eight full-chain capture-to-geological-storage projects in various stages of development, and an additional five projects at the feasibility stage (Table 8; Figure 14). Projects associated with natural gas production are located offshore Northern Territory, Western Australia and Victoria, where both saline aquifers and depleted fields are targeted for injection (Table 8; Figure 14). These include INPEX and Santos’ projects in the Bonaparte Basin, Woodside Energy’s Browse and Karratha CCS projects, Santos’ Reindeer CCS project, and Exxon’s SeaCCS project in the Gippsland Basin. Santos’ Moomba CCS in the Cooper Basin, South Australia, is also currently under construction with operations planned to start up in 2024. CO2 storage projects in development in Australia also include those linked with hydrogen production, enhanced oil recovery, and direct air capture.
CCS is likely to play a significant role in the development of Australia’s nascent hydrogen industry. (Bruce et al., 2018). Although hydrogen can be generated with near-zero emissions through the use of renewable energy to electrolyse water, currently most hydrogen is produced from natural gas or coal combined with water. Producing hydrogen in such a manner produces significant amounts of CO2, which can be mitigated through CCS. The commercial-scale Liquefied Hydrogen Supply Chain Commercial Demonstration Project between Victoria and Japan, for example, plans to produce, liquefy and transport hydrogen from coal and biomass and store the resulting CO2 in the offshore Gippsland Basin. A successful pilot-scale demonstration of the production and transport of hydrogen to Japan was completed in February 2022 through the HESC project (HESC, 2023).
The use of anthropogenic CO2 in the enhanced oil recovery (EOR) process is one pathway to achieve permanent storage of CO2 in the subsurface (Verma, 2015). CO2–EOR involves injecting CO2 into mature oil fields to mobilise trapped oil and extend the life of the fields. This approach has been used widely in the USA for some 60 years where oil compositions, geological conditions, the proximity of CO2 sources to oil fields and tax credits for CO2 stored through CO2-EOR have made the process economically viable (United States Department of Energy, 2010; White House, 2023). Bridgeport Energy’s Moonie CO2-Enhanced Oil Recovery project in the Surat Basin, Queensland, will inject up to 960,000 t of CO2 captured from the nearby Millmerran power station over eight years to produce some of the remaining reservoir oil in a depleted oil field (New Hope Group, 2023).
Significant effort has been put towards capture and storage of CO2 from coal-fired power stations over the past twenty or more years, due to their historical importance in providing cheap baseload energy. The complicated process and high costs of capturing the large volumes of CO2 emitted from these facilities, however, is leading to the decommissioning of older coal-fired power stations in Australia rather than retrofitting them with capture facilities. The CTSCo project, located near the Moonie EOR project, will also capture CO2 emissions from the comparatively new Millmerran Power Station (operating since 2002) for geological storage in the Surat Basin. The demonstration project will capture and inject up to 110,000 t of CO2 per year for up to three years (CTSCO, 2022).
Direct removal of CO2 from the atmosphere is of growing interest to abate historical CO2 emissions and those emissions that cannot be captured or easily abated (e.g. from agricultural use or dispersed transport emissions). AspiraDAC are developing a demonstration direct air capture and storage project that will use renewable energy to power modular direct air capture units to capture 1tCO2 per day for at least one year (AspiraDAC, 2023). The captured CO2 will be stored at a nearby CCS storage site in the Cooper Basin. This is a first-of-a-kind demonstration of direct air capture with CO2 storage for Australia.
Several CO2 storage project proponents have stated their intention to develop CO2 storage hubs at various locations in the future for storage of emissions from other sources, including potentially CO2 that has originated from outside of Australia. Dedicated low emissions hubs are in development in the Northern Territory (NT Low Emissions Hub), Western Australia (Mid West Clean Energy Project, South West Hub), Victoria (CarbonNet), and Queensland (CTSCo). Moreover, DeepC Store are developing Australia’s first multi-user floating CO2 injection and storage hub, which will be located offshore in northern and western Australia and store between 1.5–7.5 Mt CO2 per year (DeepC Store, 2023).
In addition to the CO2 storage projects mentioned above, a number of projects are seeking to capture CO2 from their manufacturing or industrial processes, either for storage or for utilising the CO2 to create new products such as low carbon cement and synthetic fuels.
Australia’s geological storage resources
Australia has an enormous theoretical capacity for geological storage of CO2 in saline aquifers and depleted fields (Carbon Storage Task Force, 2009). The Oil and Gas Climate initiative (2022) has recently applied the technically-based CO2 Storage Management System to produce a global catalogue of global CO2 storage resources and their maturity (Figure 15), which estimates that Australia has approximately 31 Gt of sub-commercial storage capacity and 470 Gt in undiscovered storage resources. Much of this storage resource is found in the sedimentary basins offshore Victoria (Gippsland Basin), Western Australia (Browse, Perth, Northern Carnarvon basins) and Northern Territory (Bonaparte Basin), and onshore in South Australia (Cooper-Eromanga Basin) and Queensland (Surat Basin). To date, the Moomba CCS, Cliff Head CCS and WA-481-P CCS projects have publicly announced their 2P reserves and 2C resources (Table 9; Beach Energy Limited, 2022; Santos Limited, 2022; Triangle Energy, 2022; Pilot Energy 2022b).
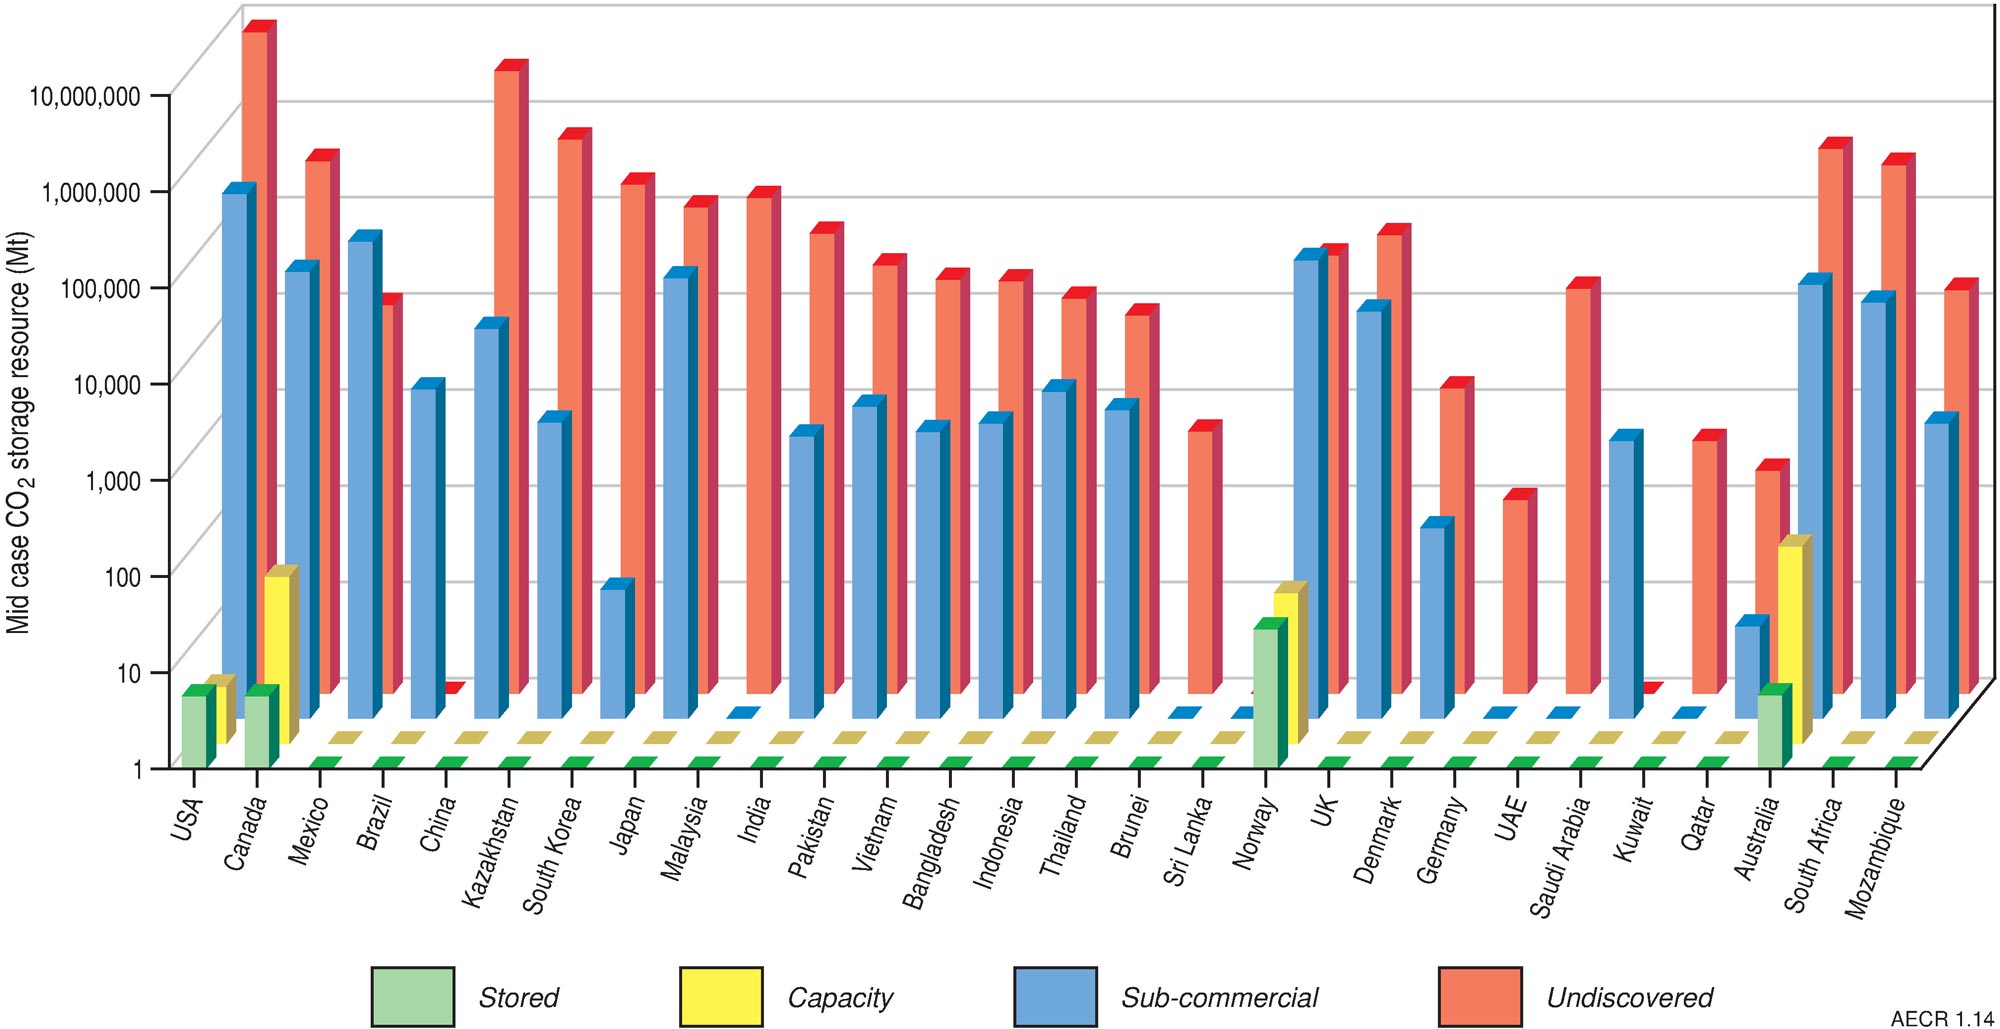
Table 9. Australia's carbon dioxide geological storage reserves and resources in 2022
| Project | Basin | Operators | Type | 2P Reserves (Mt) | 2C Resources (Mt) |
|---|---|---|---|---|---|
| Moomba CCS | Cooper | Santos Ltd; Beach Energy Ltd | Depleted Field | 13 | 103 |
| Cliff Head CCS | Perth | Triangle Energy Global Ltd; Pilot Energy Ltd | Depleted Field | n.a. | 9.7 |
| WA-481-P CCS | Perth | Pilot Energy Ltd | Depleted Field | n.a. | 4.4 |
| Total | 13 | 117.1 |
Mt = Mega tonnes
Sources: Beach Energy (2022); Santos (2021); Triangle Energy (2022); Pilot Energy (2022)
Australia has excellent potential for the application of CCS, with many onshore and offshore basins hosting suitable formations for injection and storage of CO2. Hydrocarbon fields in many basin areas are at mature stages of development and are providing early opportunities for CCS in their depleted reservoirs (Table 9). The associated geological knowledge and data from decades of exploration and development is also underpinning exploration and appraisal of potentially larger saline aquifer storage projects as the CCS industry scales up. Natural gas production is currently at relatively less mature stages of development in parts of offshore northern and western Australia. These will provide potential new CCS opportunities in the future as hydrocarbon fields are produced and depleted and saline aquifer storage opportunities are realised, adding to Australia’s inventory of potential storage sites.
References
AspiraDAC 2023. AspiraDAC (last accessed 31 March 2023).
Australian Energy Market Operator (AEMO) 2022. 2022 Western Australia gas statement of opportunities, December 2022 (last accessed 31 March 2023).
Australian Energy Market Operator (AEMO) 2023. Gas statement of opportunities, March 2023, for eastern and south‑eastern Australia (last accessed 31 March 2023).
Australian Competition and Consumer Commission (ACCC) 2023. Gas Inquiry 2017-2025 Interim Report - January 2023 (Last accessed 31 March 2023)
Beach Energy Limited 2022. Annual Report 2022 (last accessed 11 April 2023)
BP 2022. bp Statistical Review of World Energy, 71st edition (last accessed 31 March 2023).
Bridgeport Energy (a New Hope Group company) 2021. Moonie Oil Field CO2 EOR Project Initial Injection Plan (Last accessed 18 April 2023)
Bruce, S., Temminghoff, M., Hayward, J., Schmidt, E., Palfreyman, D., and Hartley, P. 2018. National Hydrogen Roadmap, CSIRO, Australia (last accessed 5 May 2022).
Bureau of Infrastructure and Transport Research Economics (BITRE) 2023. Australian sea freight 2020–21, Canberra, ACT (last accessed 31 March 2023)
Chevron Australia 2022. Gorgon CCS fact sheet (Last accessed 18 April 2023)
Chevron Australia 2023. Gorgon carbon capture and storage (last accessed 31 March 2023).
Commonwealth of Australia 2019. Australia’s National Hydrogen Strategy (last accessed 11 May 2023).
CO2CRC 2022. The Otway International Test Centre (Last accessed 18 April 2023)
CSIRO 2022. A business case for a low-emissions CCUS hub in the Northern Territory(Last accessed 20 April 2023)
CTSCo 2022. Environmental Impact Statement - Surat Basin Carbon Capture and Storage Project (Executive Summary).
DeepC Store 2023. CStore1 (last accessed 31 March 2023).
Department of Climate Change, Energy, the Environment and Water 2022a. Australian Energy Statistics (last accessed 31 March 2023).
Department of Climate Change, Energy, the Environment and Water 2022b. State of Hydrogen, 2022 (last accessed 20 April 2023)
Department of Climate Change, Energy, the Environment and Water 2023. Safeguard Mechanism. (last accessed March 2023).
Department of Industry, Science and Resources 2022a. Resources and Energy Quarterly, September 2022 (last accessed 11 May 2023).
Department of Industry, Science and Resources 2022b. 2021 Offshore Greenhouse Gas Storage Acreage Release (last accessed 31 March 2023).
Department of Industry, Science, Energy and Resources 2022. Australia’s Nationally Determined Contribution: Communication 2022.
ExxonMobil 2022. SEA CCS Pipeline Fact Sheet (Last accessed 18 April 2023)
Feitz, A., Wang, L., Rees, S., Carr, L. 2022. Feasibility of underground hydrogen storage in a salt cavern in the offshore Polda Basin. Geoscience Australia, Canberra. https://dx.doi.org/10.26186/146501
GCCSI 2023. CO2RE Facilities Database (Last accessed 18 April 2023)
Geoscience Australia 2022. Australia’s Energy Commodity Resources, 2022 Edition. Geoscience Australia, Canberra (last accessed 31 March 2023).
Geovault 2022. Projects (Carnarvon Basin) (Last accessed 18 April 2023)
Government of Western Australia Department of Mines, Industry Regulation and Safety 2019. South West Hub Project (Last accessed 18 April 2023)
HESC 2023. The world-first Hydrogen Energy Supply Chain (HESC) Project (last accessed 31 March 2023).
Hughes, A., Britt, A., Pheeney, J., Summerfield, D., Senior, A., Hitchman, A., Cross, A., Sexton, M., Colclough, H., and Hill, J. (Geoscience Australia) 2023. Australia’s identified mineral resources, 2022 (last accessed 31 March 2023).
INPEX 2022. INPEX Vision @2022 (Last accessed 18 April 2023)
International Energy Agency (IEA) 2020. Energy Technology Perspectives 2020: Special report on carbon capture utilisation and storage. IEA, Paris.
International Energy Agency (IEA) 2022a. World Energy Balances: Overview (last accessed 31 March 2023).
International Energy Agency (IEA) 2022b. Energy systems overview tracking report: Hydrogen. IEA, Paris.
International Energy Agency (IEA) 2022c. Carbon Capture, Utilisation and Storage, IEA, Paris (last accessed 31 March 2023).
International Energy Agency (IEA) 2022d. World Energy Outlook 2022d: An updated roadmap to Net Zero Emissions by 2050. IEA, Paris (last accessed 31 March 2023).
International Energy Agency (IEA) 2022e. Direct Air Capture: a key technology for net zero. IEA, Paris.
Intergovernmental Panel on Climate Change (IPCC) 2022. Climate Change 2022: Mitigation of Climate Change (last accessed 31 March 2023).
King, M. 2022. New offshore greenhouse gas storage acreage to help lower emissions. Press release, 24 August 2022.
NEA 2023. Uranium 2022: Resources, Production and Demand, OECD Publishing, Paris (last accessed 26 April 2023)
New Hope Group 2023. Moonie Oil Field – EA Amendment Application (last accessed 31 March 2023).
NOPTA 2022a. Greenhouse Gas Assessment Permit G-9-AP (Last accessed 18 April 2023)
NOPTA 2022b. Greenhouse Gas Assessment Permit G-11-AP (Last accessed 18 April 2023)
NOPTA 2022c. Greenhouse Gas Assessment Permit G-8-AP (Last accessed 18 April 2023)
NOPTA 2023. NEATS Public Portal (last accessed March 2023).
Oil and Gas Climate Initiative 2022. CO2 storage resource catalogue, cycle 3 report (last accessed 31 March 2023).
Pilot Energy 2022a. Delivering Clean Energy for the Mid West (Last accessed 18 April 2023)
Pilot Energy 2022b. Annual Report 2022 (Last accessed 11 May 2023)
Ports Australia 2019. Trade statistics for 2016-‑2017 (last accessed 5 May 2021).
Santos 2022a. Santos awarded CO2 storage permits for more CCS opportunities (Last accessed 18 April 2023)
Santos 2022b. Fact Sheet Moomba CCS (Last accessed 18 April 2023)
Santos 2022c 2021 Annual Report (last accessed 11 April 2023)
Santos 2023. Climate Change Report 2023 (Last accessed 18 April 2023)
Snowy Hydro 2020. Snowy 2.0 project update, August 2020. Available at https://www.snowyhydro.com.au/snowy-20/about/ (last accessed 20 April 2022).
Triangle Energy 2022. Cliff Head Joint Venture, Significant Upgrade to WA 31-L CO2 Storage Contingent Resource and Submission to NOPTA for Initial CCS Regulatory Approval (last accessed 11 April 2023).
United States Department of Energy (National Energy Technology Laboratory) 2010. Carbon Dioxide Enhanced Oil Recovery Report. 31 pages (last accessed 20 April 2023).
Verma, M.K. 2015. Fundamentals of carbon dioxide‑enhanced oil recovery (CO2‑EOR)—A supporting document of the assessment methodology for hydrocarbon recovery using CO2‑EOR associated with carbon sequestration. U.S. Geological Survey Open‑File Report 2015–1071 (last accessed 20 April 2023).
Victoria State Government Earth Resources 2022. The CarbonNet Project (Last accessed 18 April 2023)
White House 2023. Inflation Reduction Act Guidebook (last accessed 31 March 2023).
Woodside 2022a. Climate Report 2022 (Last accessed 18 April 2023)
Woodside 2022b. Woodside-led Joint Venture awarded greenhouse gas assessment permit in WA (Last accessed 18 April 2023)
Data download
Australia's Energy Commodity Resources Data Tables - 2021 reporting period