Multibeam Backscatter
Page last updated:19 July 2017
Backscatter data provides information on the ‘hardness’ of the sea floor and is used to differentiate between different types of sea floor, such as hard rock or soft sediment.
Backscatter data can be used as a proxy to understand the characteristics of the sea floor; including the sea floor hardness and surficial sediment characteristics. Backscatter data can also provide information on the sediment grain-size and sea floor roughness. These measurements can be used to characterise the environment (or habitat) where marine fauna live, and as such can be used to explain spatial patterns of sea floor biology and biodiversity at continuous scales.
Backscatter data is used for a range of purposes such as:
- environmental management, including establishing baseline data to support environmental monitoring by providing the environmental characteristics of the sea floor (for example sea floor hardness, surficial sediment characteristics, benthic habitat characteristics)
- assessment of environmental considerations for marine geology resource management including the identification of geohazards, such as underwater landslides
- environmental modelling (for example mapping habitat types at continuous scales)
- monitoring of anthropogenic changes in the sea floor (for example monitoring pipeline locations)
- safety navigation (for example monitoring and mapping of rocky areas or areas of hard ground)
Collecting backscatter data
Multibeam bathymetry and multibeam backscatter data are collected at the same time using a multibeam echosounder mounted on a survey vessel. While bathymetry measures ocean depth, backscatter can be used to measure sea floor hardness.
During data collection, multibeam echosounders send out multiple soundwaves that bounce off the sea floor and return to the ship. These soundwaves are emitted as acoustic pulses. From each pulse, a co-located bathymetry and backscatter measurement is collected. Each acoustic pulse propagates from the vessel in a line of beams from left to right, fanning out under the vessel; this is known as the beam pattern. The beam pattern is wide across-track, which means it covers the area immediately under the vessel, and on either side of the vessel, and narrow along-track, which means it does not cover the area in front or behind the vessel.
The delay between sending the signal from the transmit arrays and receiving the acoustic returns provides a measurement of ocean depth, or bathymetry data. The strength of the return signal provides an indication of how hard the sea floor is, or backscatter data.
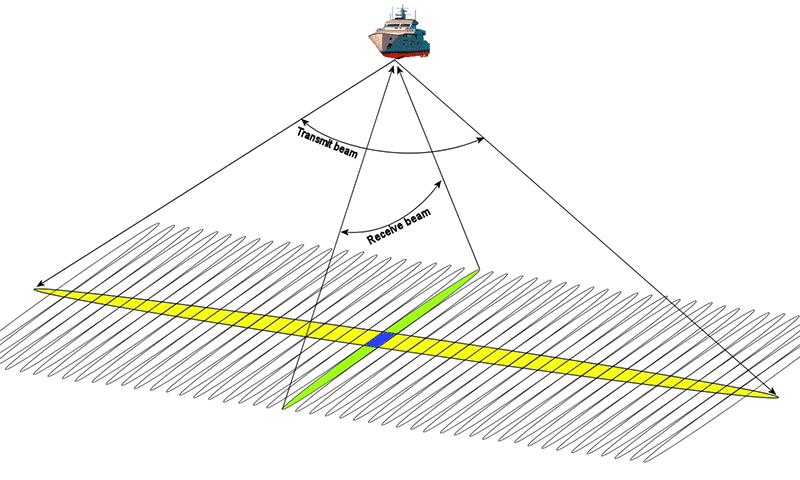
This figure shows an example of multibeam backscatter data collection where yellow represents the transmit beam, green is an example of one of the received beams and blue is a single footprint formed by the intersection of the two (©2017 Image from AML Oceanographic).
Processing backscatter data
The proportion of acoustic energy reflected back from the seabed is determined by the impedance contrast, sometimes referred to as ‘hardness’ and apparent surface roughness scale (i.e. roughness relative to the acoustic wave length). In general, backscatter intensity increases with surface roughness or hardness.
The surface scattering coefficient is a dimensionless quantity that accounts for the intensity (power) ratio of the incident and scattered waves determined per unit area at a reference distance of 1 m. When expressed in decibels (dB), this quantity is commonly called the backscatter strength (BS).
Backscatter processing involves radiometric and geometric corrections. The processing steps include the removal of the system transmission loss; removal of the sonar system’s specific angular dependence correction model; calculation of the angle of incidence; correction of the beam pattern; calculation of the angular backscatter response within a predefined window; and removal of the angular dependence and restoration to the backscatter strength at an chosen reference angle. Two processed backscatter datasets produced are a backscatter mosaic and a set of angular backscatter response curves.
Probability of Seabed Hardness
The probability of seabed hardness is derived from the angular backscatter response dataset. The angular backscatter response curves are extracted from known hard or ‘rocky’ seabed areas and an average of the angular backscatter response curves is calculated. This is completed to determine a reference curve of hard/"rocky" seabed. This curve is used as a reference and compared to all other angular backscatter response curves using the Kolmogorov-Smirnov goodness of fit test to estimate the probability of the hard/"rocky" seabed (p‑hard). Finally, the Inverse Distance Weighted interpolation technique is used to produce a continuous layer of the p‑hard for the whole survey area.
Backscatter Products
Geoscience Australia uses the backscatter data that it acquires and data acquired by external agencies and companies to produce a range of products to meet government and scientific needs. Key products include:
- Maps of individual surveys
- Raw and processed multibeam backscatter data and derivatives at the survey level, for example probability of rock spatial grids, seabed hardness grids
- Seabed interpretations, for example reef polygons
Geoscience Australia also uses backscatter data to produce seabed interpretations, and geomorphology and seabed hardness products.
Relevant Reports and Publications
Geoscience Australia has produced a range of publications on the analysis and application of backscatter, including:
- Siwabessy PJW, Tran M, Picard K, Brooke BP, Huang Z, Smit N, Williams DK, Nicholas WA, Nichol SL, Atkinson I (2017) Modelling the distribution of hard seabed using calibrated multibeam acoustic backscatter data in a tropical, macrotidal embayment: Darwin Harbour, Australia. Mar Geophys Res. doi:10.1007/s11001-017-9314-7.
- Daniell J, Siwabessy J, Nichol S, Brooke B (2015) Insight into environmental drivers of acoustic angular response using a self-organising map and hierarchical clustering. Geo-Mar Lett 35:387-403.
- Huang Z, Siwabessy J, Nichol SL, Brooke BP (2014) Predictive mapping of seabed substrata using high-resolution multibeam sonar data: A case study from a shelf with complex geomorphology. Mar Geol 357:37-52.
- Li J, Siwabessy J, Tran M, Huang Z, Heap A (2013) Predicting Seabed Hardness Using Random Forest in R. In: Zhao Y, Cen Y (eds) Data Mining Applications with R. Elsevier, Amsterdam, pp 299-329.
- Siwabessy PJW, Daniell J, Li J, Huang Z, Heap AD, Nichol S, Anderson TJ, Tran M (2013) Methodologies for seabed substrate characterisation using multibeam bathymetry, backscatter and video data: A case study from the carbonate banks of the Timor Sea, Northern Australia. Record 2013/11. Geoscience Australia, Canberra.
- Hamilton LJ, Parnum IM (2011) Acoustic seabed segmentation from direct statistical clustering of entire multibeam sonar backscatter curves. Cont Shelf Res 31:138-148.
- Lamarche G, Lurton X, Verdier A-L, Augustin J-M (2010) Quantitative characterisation of seafloor substrate and bedforms using advanced processing of multibeam backscatter-Application to Cook Strait, New Zealand. Cont Shelf Res 31 (S-1):93-S109.
- Parnum IM, Gavrilov AN (2011) High-frequency multibeam echosounder measurements of seafloor backscatter in shallow water: Part 2–Mosaic production, analysis and classification. J Underw Technol 30(1):13–26. doi:10.3723/ut.30.013.
- Parnum IM, Gavrilov AN (2011) High-frequency multibeam echosounder measurements of seafloor backscatter in shallow water: Part 1–Data acquisition and processing. J Underw Technol 30(1):3–12. doi:10.3723/ut.30.003.
- Gavrilov AN, Parnum IM (2010) Fluctuations of seafloor backscatter data from multibeam sonar systems. IEEE J Oceanic Eng 35 (2):209-219.
- Siwabessy PJW, Parnum IM, Gavrilov A, McCauley RD (2006) Overview of coastal water habitat mapping research for Coastal CRC. Coastal CRC Technical Report No. 86, 27 pp.
- Siwabessy PJW, Gavrilov AN, Duncan AJ, Parnum IM (2006) Statistical analysis of high-frequency multibeam backscatter data in shallow water. Acoustics 2006, Proceedings of the Conference of the Australasian Acoustical Societies, Christchurch, New Zealand, pp 507-514.