Sonar
Page last updated:22 May 2018
Multibeam sonar
Multibeam sonar is a common offshore surveying tool that uses multiple sound signals to detect the seafloor. Because of its multiple beams it is able to map a swath of the seabed under the ship, in contrast to a single beam sonar which only maps a point below the ship. With the capability to cover 100 per cent of the seafloor, multibeam sonars are becoming the industry standard for hydrographic and geological applications. Different frequencies are used to map different water depths, with higher frequencies (>100kHz) used for shallow water and low frequencies (<30 kHz) for deep water. With different frequencies there is also a trade-off in resolution, with higher frequency shallow water systems providing greater spatial resolution than lower frequency deep-water systems.
Generally, the multibeam sonar transducer is mounted rigidly to the hull of the survey vessel and its position can be calculated very accurately. Other parts of the multibeam system include auxiliary sensors such as motion-sensing systems and Global Positioning Systems (GPS) to ensure accurate positioning, motion sensing and sound speed measurement system.
A modern multibeam sonar transducer typically uses the Mills Cross array. The sound is transmitted from transducers that are perpendicular to the survey track. Consequently, the sound pulses forms a transmit swath that is wide across-track and narrow along-track. The returning sound pulses, which are mainly recording the impedance contrast and seafloor topography, are received by the receivers which are mounted parallel to the survey track. These return beams are narrow across-track. Unlike the sidescan sonar which commonly produces only acoustic backscatter data (i.e. hardness), the multibeam sonar generates both water depth and seafloor hardness data concurrently.
Sub-bottom profilers
Acoustic Sub-Bottom Profiling (SBP) systems are used to determine physical properties of the sea floor and to image and characterise geological information a few metres below the sea floor. In recent years, sub-bottom profilers have been used to measure small scale sedimentary structures and processes in high temporal and spatial resolution. The systems have been widely adopted by marine researchers because of their ability to collect data rapidly and non-intrusively.
Sub-bottom profilers are usually comprised of single channel source that sends sound pulses into the shallow sub-sea floor sediments. The sound pulses bounce off the sea floor and subsequent buried sediment layers according to differences in their acoustic impedance (hardness). Acoustic impedance is related to the density of the material and the rate at which sound travels through this material. The different times taken for this signal to be returned and recorded by the sub-bottom profiler indicate how deep the layers are below the sea floor. The surface of the different rock strata beneath the sea floor are mapped over the study area.
Sub-bottom profiler system
There are a number of shallow SBP systems which operate using various types of sound sources and frequencies (Table 1). Different SBP systems are used depending on the objectives of the survey, water depths and prior knowledge of the rock types (if known). The 'Pinger' is a high frequency system which operates on a range of single frequencies between 3.5 kHz and 7 kHz. Depending on various factors, such as the type of sediment and the sound source characteristics (frequency, power), SBPs can achieve sea floor penetration from just a few meters to more than 50 m and vertical resolution (layer thickness) down to approximately 0.3 m. SBPs are particularly useful for delineating shallow features such gas accumulations, buried channels. The non-linear parametric sub-bottom profilers simultaneously transmit two signals of slightly different high frequencies (e.g. 100 and 110 kHz). Their interaction generates by interference a new low-frequency signal (with the difference frequency). They can achieve very high vertical resolution and are particularly good to use in shallow water environments.
Table 1. Specifications of common SBP systems.
| Sub-bottom profiler systems | Common Frequency Range | Penetration depth |
|---|---|---|
Parametric | ~100 kHz | < 100 m, vertical resolution < 0.05 m |
'Chirper' | 3 to 40 kHz | < 100 m, vertical resolution ~0.05 m |
'Pinger' | 3.5 to 7 kHz | 10 m to 50 m, with vertical resolution of 0.2 m |
'Boomer' | 500 Hz to 5 kHz | 30 to 100 m, with vertical resolution of 0.3 to 1 m |
'Sparker' | 50 Hz to 4 kHz | To 1,000 m in ideal conditions, with vertical resolution of >2 m |
Sub-bottom profiler data
Sub-bottom profile data is used for a range of purposes including:
- Three-dimensional imaging of the sea floor shallow sub-surface and sediment layering.
- Assessment of environmental considerations for marine geological resource management including the identification of buried geohazards, such as underwater landslides, gas seepage.
- Environmental management, including establishing baseline data to support environmental monitoring.
- Classification maps for seabed habitats.
- Sea floor sedimentary environments for developing models of benthic environments and habitats.
Sidescan sonar
A sidescan sonar uses high-frequency sound pulses that are bounced off the sea floor to create an image of the sea floor morphology shape) and show differences in seabed texture and substrate types. Typically, a sidescan sonar consists of two transducers mounted in a towed body or 'fish'. Transducers can also be mounted on either side of a ship, on a remotely operated vehicle (ROV) or on an autonomous underwater vehicle (AUV). Each transducer generates a fan-shaped sound pulse perpendicular to the vessel track. When the sound pulse hits the sea floor, some of the sound is reflected back to the transducer and some is reflected away. The returned sound is known as backscatter.
Strong return (high backscatter) typically occur when the sound is reflected off hard and rocky surfaces, while weak return (low backscatter) occur if reflected off softer sediments (e.g. sand). Because of the geometry of the sound pulse sent toward the sea floor, an obstacle rising above the seabed, such as shipwreck or steep hill can cast shadows (no return) in the sonar image. The size of the shadow can be used to determine the size of the feature (Figure 1).
Over time, as the sonar moves along the vessel track, the recorded sound reflections form an acoustic image of the sea floor. Typical frequencies used in sidescan sonar range from 100 to 500 kHz with higher frequencies producing a higher resolution image.
The acoustic image can be viewed in real-time using a 'waterfall display' in which the data obtained are displayed as a sound by sound record while it is being collected (Figure 2). The data are also recorded for future analysis and interpretation. Using a GPS input the sidescan sonar system data can be displayed geographically.
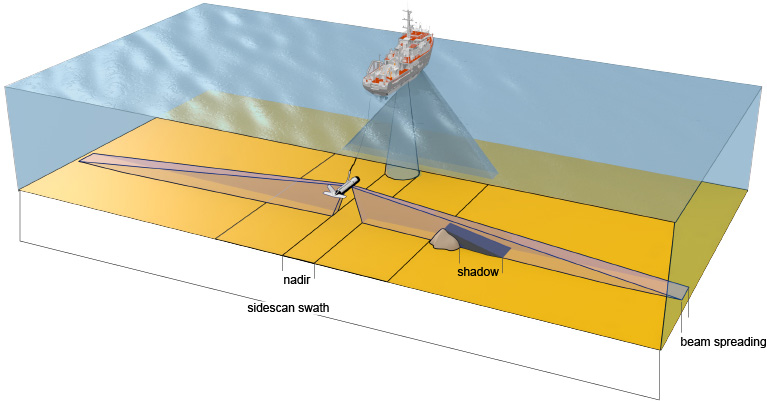
Figure 1. Beam pattern of sidescan sonar systems
Sidescan sonar data
Sidescan sonar data are used for a range of purposes including:
- Delineating naturally occurring and man-made sea floor features (reefs, sand waves, rocky outcrops, submarine infrastructures, wrecks).
- Assessment of environmental considerations for marine geology resource management including the location of ore and aggregate deposits.
- Resource management for targeting areas of suitability (e.g. feasibility of undersea cable placement), where identification of sea floor type and geohazards, such as underwater landslides and pockmarks, may have considerable impact on the development.
- Environmental management, including establishing baseline data to support environmental monitoring and habitat mapping.
- Military applications such as mine detection.
- Shipwreck detection and size calculation according to its shadow.
- Sidescan systems are used because of the high resolution they provide and the rapidity at which they can cover the sea floor (wide swath). Therefore, they are used for discriminating small features, geological or man-made origin.
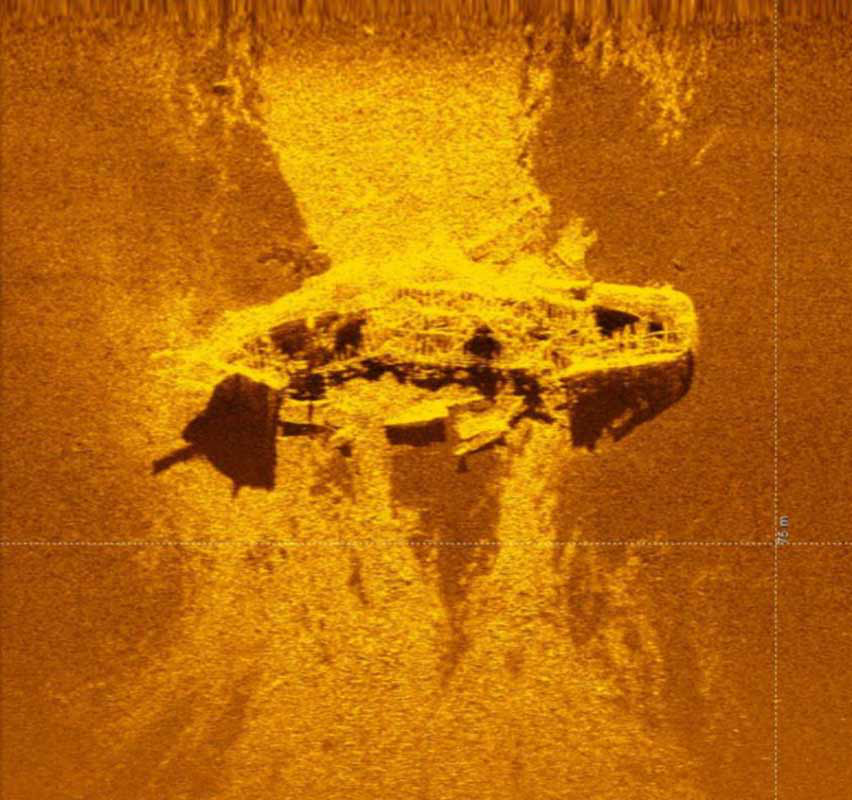
Figure 2. Sidescan sonar image showing a shipwreck located in the MH370 search area discovered in December 2015. Source: ATSB.
Water column sonar
Mapping of the water column (i.e. the marine environments between the ocean surface and the sea floor) is a non-destructive acoustic method using sonar systems, such as single beam and multibeam sonar imaging. Water column data is usually a by-product of the acquisition of information about the sea floor from the sonar. This information is captured from the sounds that are reflected back to the sonar transducer after being scattered by particles within the water column (Figure 3). These include features such as fish and gas bubbles. The information is often referred as water column backscatter data.
Water column sonar data
Water column sonar data is used for:
- Geophysical and oceanographic applications (gas and fluid seep detection, sediment plumes transported by ocean currents).
- Location of objects found above the sea floor (archaeology, debris mapping).
- Biological applications (mapping of fish schools and their characteristics, biomass of phytoplankton and marine mammal detection).
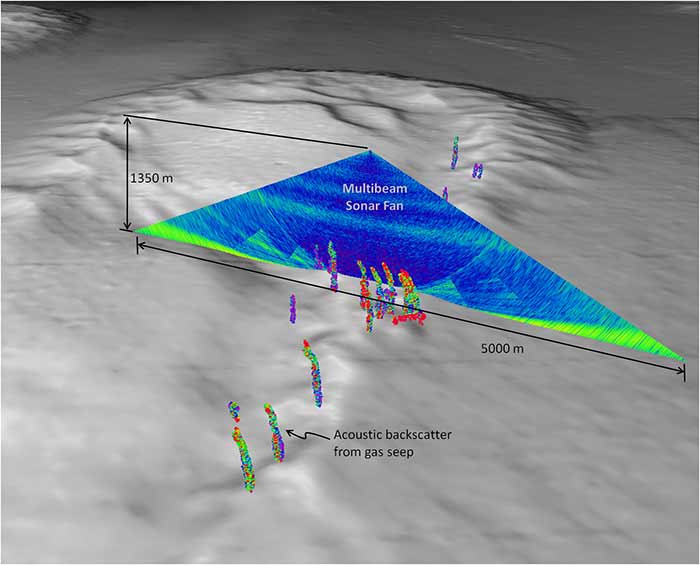
Image of water column acoustic 'slice' showing gas seeps along the sea floor. Credit: Image produced by the University of New Hampshire Center for Coastal and Ocean Mapping/Joint Hydrographic Center using IVS Fledermaus software
References
Heap, A.D. (2000). Composition and dynamics of Holocene sediment next to the Whitsunday Islands on the middle shelf of the Great Barrier Reef platform, Australia.PhD Thesis, James Cook University, Townsville, Queensland. 116pp.
Stoker, M.S., Pheasant, J.B., Josenhans, H. (1997). Seismic methods and interpretation. In T.A. Davies, T. Bell, A.K. Cooper, H. Josenhans, L., Polyak, A. Solheim, M.S. Stoker, J.A. Stravers (Eds.), Glaciated Continental margins: An Atlas of Acoustic Images. Chapman and Hall, London, 1997. 315pp.
Penrose, J.D., Siwabessy, P.J.W., Gavrilov, A., Parnum, I., Hamilton, L.J., Bickers, A., Brooke, B., Ryan, D.A., Kennedy, P., 2005. Acoustic techniques for seabed classification. Cooperative Research Centre for Coastal Zone Estuary and Waterway Management, Technical Report 32.