Australia's Energy Commodity Resources 2025 Gas
Page last updated:23 October 2025
Gas
|
TDR 247,427 PJ ( 1.1%) | |
|
Reserves (2P) 105,148 PJ ( 3.5%) |
|
Production 6,264 PJ ( 1.5%) | |
|
Exports 4,388 PJ ( 0.9%) $74.3 b ( 17.7%) |
|
Production World Ranking 7 (3.7%) | |
|
Export World Ranking 3 (19.6%) |
Notes
Statistics are for 2023, percentage increases or decreases are relative to 2022. World rankings are followed by percentage share in brackets. TDR – Total demonstrated resources (2P reserves plus 2C contingent resources); PJ – petajoules; $b – billion dollars (Australian).
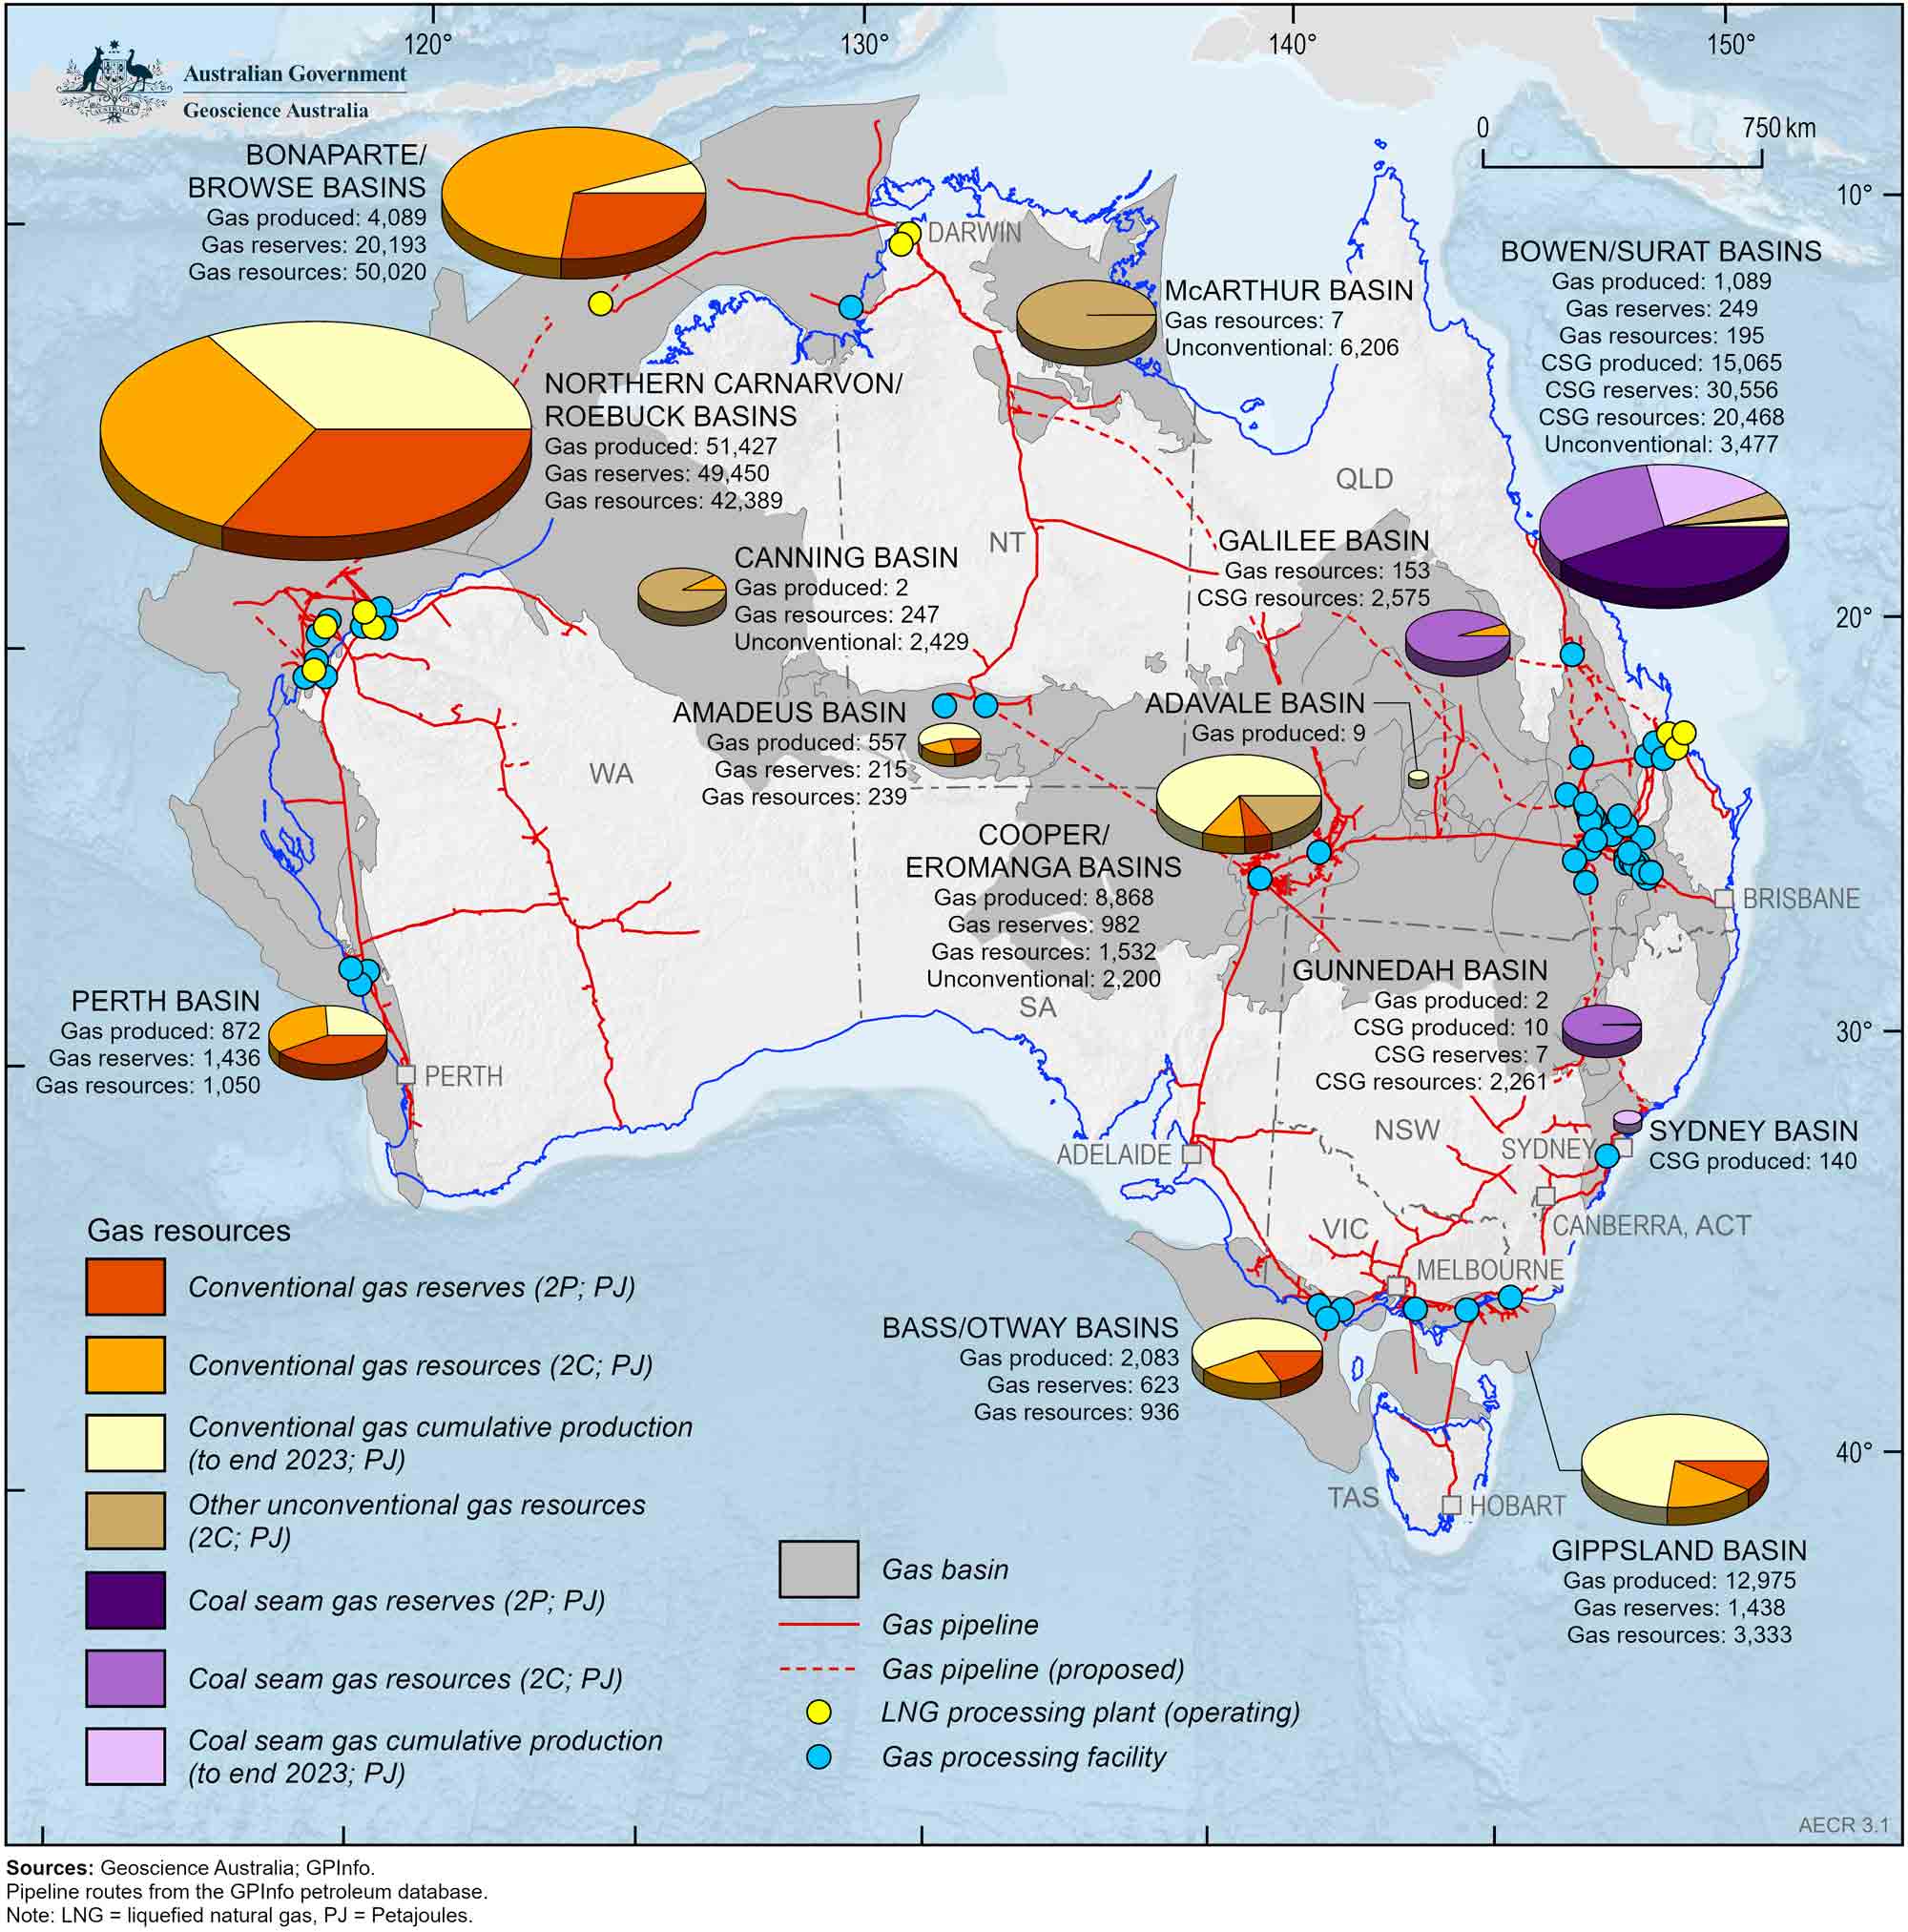
Figure 3.1 Australia’s remaining gas reserves (2P) and contingent resources (2C) during 2023 and cumulative production to end 2023 (PJ). For physical units (Tcf) refer to Table 3.1 Table 3.2 and Table 3.3
Highlights
- Australia has substantial conventional gas resources that are located mostly off the northwest coast of Western Australia, and significant onshore unconventional (coal seam gas, shale gas, and tight gas) resources (Figure 3.1). In 2023 Australia’s TDR for its conventional and unconventional gas is estimated at 247,427 PJ (220 trillion cubic feet [Tcf]), of which 106,301 PJ (95 Tcf) are classified as proven and probable (2P) reserves.
- Conventional gas and coal seam gas (CSG) remain Australia’s most important gas resources for energy generation and export. However, these resources are being depleted at a faster rate than they are being replaced by new discoveries (Figure 3.2).
- Australia’s proven and probable (2P) reserves for conventional gas in 2023 are estimated as 74,586 petajoules (PJ; 66.32 Tcf), a decline of 3,475 PJ (4.5%) from 2022, while for coal seam gas, proven and probable reserves are estimated at 30,562 PJ (27.17 Tcf) in 2023, a decrease of 297 PJ (1.0%) from 2022.
- In 2023, Australia’s identified contingent (2C) conventional gas resources are estimated as 100,039 PJ (88.95 Tcf), an increase of 1,390 PJ (1.4%) from 2022; while coal seam gas contingent resources are estimated at 25,305 PJ (22.50 Tcf), a decrease of 184 PJ (0.7%) from 2022 (Table 3.1 and Table 3.2; Figure 3.1).
- About 93% of conventional gas resources are located on the North West Shelf where gas is produced from the Northern Carnarvon, Browse and Bonaparte basins, providing feedstock to seven LNG projects (Gorgon, Wheatstone, North West Shelf, Pluto, Prelude, Ichthys and Darwin).
- Additional unconventional gas resources in Australia include tight gas, shale gas, basin-centred gas and in-situ coal gasification resources, which in 2023 totalled 16,935 PJ (15.06 Tcf; Table 3.3 and Table 3.4).
- In 2023, annual gas production was 6,264 PJ, representing a 1.5% decrease primarily due to lower output from the Bass Strait. Based on the 2023 production rate, the identified conventional and unconventional gas reserves (2P) may support the equivalent of 17 years of further production.
- About 69% of Australia’s natural gas production was exported in 2023.
- During 2023, Australia was the seventh largest gas producer globally and LNG exports remained at unprecedented levels, with 80.7 million tonnes (Mt; 4,388 PJ) of gas exported, making Australia the world’s third largest LNG exporter.
- As of October 2024, Australia had 13 committed major LNG and gas projects valued at A$37.7 billion, representing 58% of value for resource projects at this stage of development (DISR, 2024a).
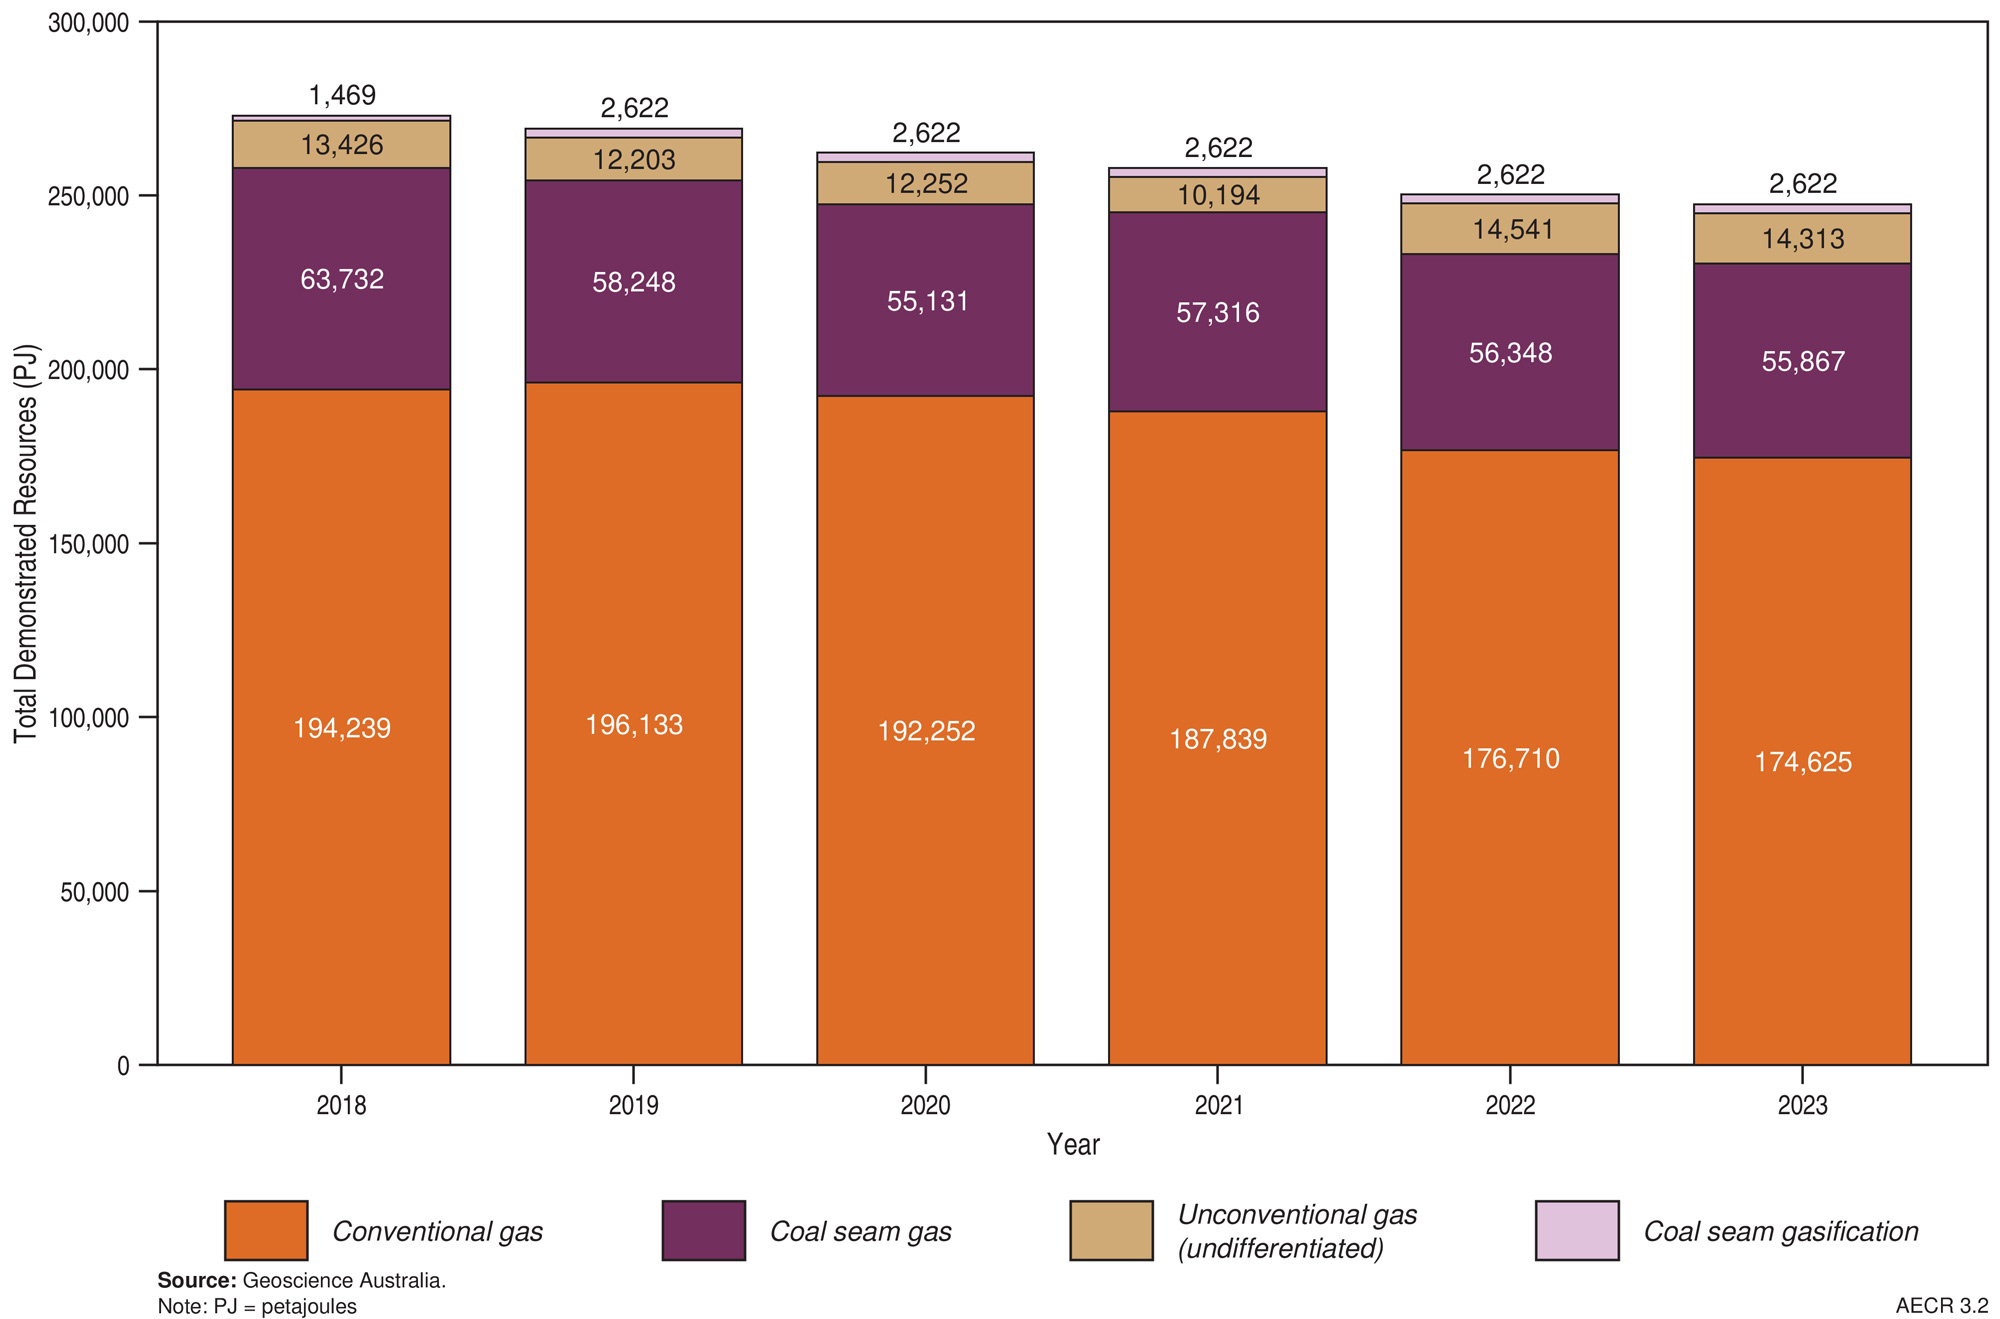
Figure 3.2 Trends in Australia’s total demonstrated gas resources, 2018 to 2023
Identified gas resources
The majority of the remaining identified conventional gas resources occur in basins on Australia’s North West Shelf, while onshore basins in Queensland hold the greatest quantity of identified remaining coal seam gas resources (Figure 3.1, Table 3.1, Table 3.2). Other unconventional gas resources are located in onshore basins in the Northern Territory, Western Australia and Queensland, these include tight gas, shale gas, basin-centred gas and in-situ coal gasification resources (Table 3.3, Table 3.4).
Australia’s estimated conventional gas resources in 2022 include 74,586 PJ (66.32 Tcf) of 2P reserves, accounting for nearly three-quarters of Australia’s total remaining 2P gas reserves and 100,039 PJ (88.95 Tcf) of 2C contingent resources. Aggregating Australia’s 2P reserves and 2C contingent resources provides a total of 174,625 PJ (155.27 Tcf) of identified conventional gas resources—a decrease of 2,085 PJ (1.2%) from 2022. About 93% of identified conventional gas resources are located offshore along the North West Shelf of Australia. Based on 2023 production rates of 4,671 PJ (4.15 Tcf), the estimated life for Australia’s reported conventional gas reserves is 16 years.
Table 3.1 Australia's remaining conventional gas reserves (2P), contingent resources (2C) and annual production during 2023, and cumulative production to 31 December 2023.
| Basin | Conventional gas | |||||||
|---|---|---|---|---|---|---|---|---|
| Annual Production | Cumulative Production | Reserves (2P) | Resources (2C) | |||||
| PJ | Tcf | PJ | Tcf | PJ | Tcf | PJ | Tcf | |
| Adavale | 0 | 0 | 9 | 0.01 | 0 | 0 | 0 | 0 |
| Amadeus | 14 | 0.01 | 557 | 0.50 | 215 | 0.19 | 239 | 0.21 |
| Bass/Otway | 48 | 0.04 | 2,083 | 1.85 | 623 | 0.55 | 873 | 0.78 |
| Bonaparte/Browse | 767 | 0.68 | 4,089 | 3.64 | 20,193 | 17.95 | 50,020 | 44.48 |
| Bowen/Surat | 12 | 0.01 | 1,089 | 0.97 | 249 | 0.22 | 195 | 0.17 |
| Canning | 0 | 0 | 2 | <0.001 | 0 | 0 | 247 | 0.22 |
|
Northern Carnarvon/ Roebuck | 3,426 | 3.05 | 51,427 | 45.73 | 49,450 | 43.97 | 42,389 | 37.69 |
| Cooper/Eromanga | 90 | 0.08 | 8,868 | 7.89 | 982 | 0.87 | 1,532 | 1.36 |
| Galilee | 0 | 0 | 0 | 0 | 0 | 0 | 153 | 0.14 |
| Gippsland | 288 | 0.26 | 12,975 | 11.54 | 1,438 | 1.28 | 3,333 | 2.96 |
| Gunnedah | 0 | 0 | 2 | 0.001 | 0 | 0 | 0 | 0 |
| McArthur | 0 | 0 | 0 | 0 | 0 | 0 | 7 | 0.01 |
| Perth | 26 | 0 | 872 | 0.77 | 1,436 | 1.28 | 1,050 | 0.93 |
| Total | 4,671 | 4.15 | 81,971 | 72.87 | 74,586 | 66.32 | 100,039 | 88.95 |
|
Change from 2022 (%) | 129 (-2.7%) | 0.11 (-2.7%) | 4,630 (6.0%) | 4.11 (6.0%) | 3,475 (-4.5%) | 3.09 (-4.5%) | 1,390 (1.4%) | 1.24 (1.4%) |
Abbreviations
PJ= Petajoules. Tcf=Trillion cubic feet.
Notes
Data from the former Joint Petroleum Development Area (JPDA) have been omitted from Bonaparte Basin totals. Refer to Box 1.1 in the Overview and Appendix 3 Resource classification for information on energy resource estimates and terminology.
Data Sources: Offshore data provided by NOPTA to year-end 2023; onshore data are sourced from government statistics and company estimates reported at various dates between June 2023 and June 2024.
Coal seam gas (CSG) is expected to remain Australia’s most important unconventional gas resource in the near term, making up around three-quarters of identified unconventional gas resources. CSG is already a major source for domestic gas and LNG exports in eastern Australia. Almost all reported CSG reserves and contingent resources are located in Queensland; the remainder are in New South Wales (Figure 3.1; Table 3.2).
In 2023, Australia’s estimated proven and probable (2P) reserves for CSG total 30,562 PJ (27.17 Tcf), and 25,305 PJ (22.50 Tcf) of 2C contingent CSG resources. Aggregating Australia’s 2P reserves and 2C contingent resources provides a total estimate of 55,867 PJ (49.7 Tcf) of CSG identified resources, a decline of 0.9% (481 PJ). Based on 2023 production rates (1,593 PJ; 1.42 Tcf), Australia’s CSG reserves have an estimated life of 19 years. Identified resources may support further production if all conditions, or contingencies, relating to their development can be satisfied.
Table 3.2 Australia's remaining coal seam gas reserves (2P), contingent resources (2C) and annual production during 2023, and cumulative production to end 2023.
| Basin | Coal seam gas | |||||||
|---|---|---|---|---|---|---|---|---|
| Annual Production | Cumulative Production | Reserves (2P) | Resources (2C) | |||||
| PJ | Tcf | PJ | Tcf | PJ | Tcf | PJ | Tcf | |
| Bowen/Surat | 1,591 | 1.42 | 15,065 | 13.40 | 30,556 | 27.17 | 20,468 | 18.20 |
| Galilee | 0 | 0 | 0 | 0 | 0 | 0 | 2,575 | 2.29 |
| Gunnedah | 2 | 0.001 | 10 | 0.01 | 7 | 0.01 | 2,261 | 2.01 |
| Sydney | 0.3 | 0.000 | 140 | 0.13 | 0 | 0 | 0 | 0 |
| Total | 1,593 | 1.42 | 15,215 | 13.53 | 30,562 | 27.17 | 25,305 | 22.50 |
|
Change from 2022 (%) | 31 (2.0%) | 0.03 (2.0%) | 1,593 (11.7%) | 1.42 (11.7%) | 297 (-1.0%) | 0.26 (-1.0%) | 184 (-0.7%) | 0.16 (-0.7%) |
Abbreviations
PJ= Petajoules. Tcf = Trillion cubic feet.
Notes
Refer to Box 1.1 in the Overview and Appendix 3 Resource classification for information on energy resource estimates and terminology.
Sources: Data are sourced from government statistics and company estimates reported at various dates between June 2023 and June 2023, with additional data for the Sydney Basin sourced from EnergyQuest (2024).
Other unconventional gas resources in Australia include tight gas, shale gas, basin-centred gas and in-situ coal gasification resources. Tight gas and shale gas occur in reservoirs with low or no permeability and require hydraulic stimulation for gas production. Basin-centred gas occurs in abnormally pressured, gas-saturated, low-permeability stacked reservoirs within thick sedimentary successions. In-situ coal gasification refers to gas being extracted from coal seams by in-situ heating to produce synthesis (syn) gas.
Unconventional contingent gas reserves for Australia, other than coal seam gas, are reported from an in-situ coal gasification demonstration plant at Leigh Creek in South Australia (NeuRizer Ltd, 2024). The total 2P reported reserves of syngas for the Leigh Creek Energy Project in the Telford Basin are 1,153 PJ (1.03 Tcf; Table 3.4). This project has been submitted to obtain regulatory approvals under the Environment Protection and Biodiversity Conservation Act, 1999. Currently, there are no published reserves data for shale, tight or basin centred gas, reflecting the early stage of unconventional gas exploration and development in Australia.
During 2023, unconventional 2C contingent gas resources for Australia, other than coal seam gas and coal gasification, totalled 14,313 PJ (12.73 Tcf; Table 2.3). Nearly half (6,206 PJ; 5.52 Tcf) are represented by shale gas resources in the Beetaloo Sub-basin of the greater McArthur Basin, which are being appraised by Tamboran Resources, Empire Energy and Santos. Significant unconventional 2C contingent gas resources have also been identified in the Cooper, Canning, Bowen, Surat and Telford basins (Table 3.3, Table 3.4).
Petroleum exploration expenditure increased to A$1,093 million in 2023, up from the levels recorded in 2022, which were the lowest since 2004. In 2023, onshore expenditure rose by 11% to A$674 million, while offshore exploration increased by 10% to A$419 million (ABS, 2024). However, exploration activity has remained low since 2016, with current spending at only a quarter of what it was a decade ago. The majority of spending is now directed onshore, accounting for over 60% of total expenditure.
Table 3.3 Australia's other unconventional gas reserves (2P) and contingent resources (2C) during 2022.
| Basin | Type | Unconventional Gas | Data Source | |||
|---|---|---|---|---|---|---|
| Reserves (2P) | Resources (2C) | |||||
| PJ | Tcf | PJ | Tcf | |||
| Beetaloo (Sub-basin) | Shale gas | 0 | 0 | 6,206 | 5.52 |
Empire Energy (2023); Tamboran Resources (2023) |
| Bowen/Surat |
Basin centred gas; Tight gas | 0 | 0 | 3,477 | 3.09 |
Elixir Energy Ltd (2024); Omega Oil & Gas Ltd (2023) |
| Canning |
Basin centred gas; Tight gas | 0 | 0 | 2,429 | 2.16 |
Black Mountain Energy (2022); Buru Energy (2018) |
| Cooper/Eromanga |
Basin centred gas; Tight gas | 0 | 0 | 2,200 | 1.96 |
Beach Energy (2024); Icon Energy (2022); Pure Hydrogen (2023) |
| Total | 0 | 0 | 14,313 | 12.73 | ||
|
Change from 2022 (%) | ̵ ̵ | ̵ ̵ | 228 (-1.6%) | 0.20 (-1.6%) | ||
Abbreviations
PJ = petajoules; Tcf = trillion cubic feet.
Notes
Refer to Box 1.1 in the Overview and Appendix 3 Resource classification for information on energy resource estimates and terminology. Tight gas and shale gas occur in reservoirs with low or no permeability, which require hydraulic stimulation for gas production. Basin-centred gas occurs in abnormally pressured, gas-saturated, low-permeability stacked reservoirs within thick sedimentary successions. Currently, there are no published reserves data for shale, tight or basin centred gas, reflecting the early stage of unconventional gas exploration and development in Australia.
Table 3.4. Australia's syngas gas reserves (2P) and contingent resources (2C) during 2023.
| Basin | Type | Unconventional Gas | Data Source | |||
|---|---|---|---|---|---|---|
| Reserves (2P) | Resources (2C) | |||||
| PJ | Tcf | PJ | Tcf | |||
| Telford* | Syngas | 1,153 | 1.03 | 1,469 | 1.31 | NeuRizer Ltd (2024) |
| Total | 1,153 | 1.03 | 1,469 | 1.31 | ||
|
Change from 2022 (%) |
̵ ̵ (0%) |
̵ ̵ (0%) |
̵ ̵ (0%) |
̵ ̵ (0%) | ||
Abbreviations
PJ = petajoules; Tcf = trillion cubic feet.
Notes
Refer to Box 1.1 in the Overview and Appendix 3 Resource classification for information on energy resource estimates and terminology. *Syngas reserves and resources in the Telford Basin are associated with the Leigh Creek Energy Project that involves an in-situ coal gasification demonstration plant. In-situ coal gasification refers to gas being extracted from coal seams by in-situ heating to produce synthesis gas (syngas). This project is subject to approvals under the Environment Protection and Biodiversity Conservation Act, 1999, and is currently under assessment.
Production and trade
During 2023, gas production in Australia remained relatively steady at 6,264 PJ (5.57 Tcf), decreasing by 1.5% (98 PJ) from 2022. Approximately three-quarters of the total gas volume was produced from conventional sources, dominantly hosted by basins of the North West Shelf (Northern Carnarvon, Browse and Bonaparte basins) which accounted for 90% (4,193 PJ; 3.73 Tcf) of conventional production to the end of 2023 (Table 3.1; Figure 3.1). The remainder of gas production was from CSG sources, totalling 1,593 PJ (1.42 Tcf) in 2023, with the Bowen and Surat basins in Queensland accounting for nearly all of this amount (Table 3.2; Figure 3.1).
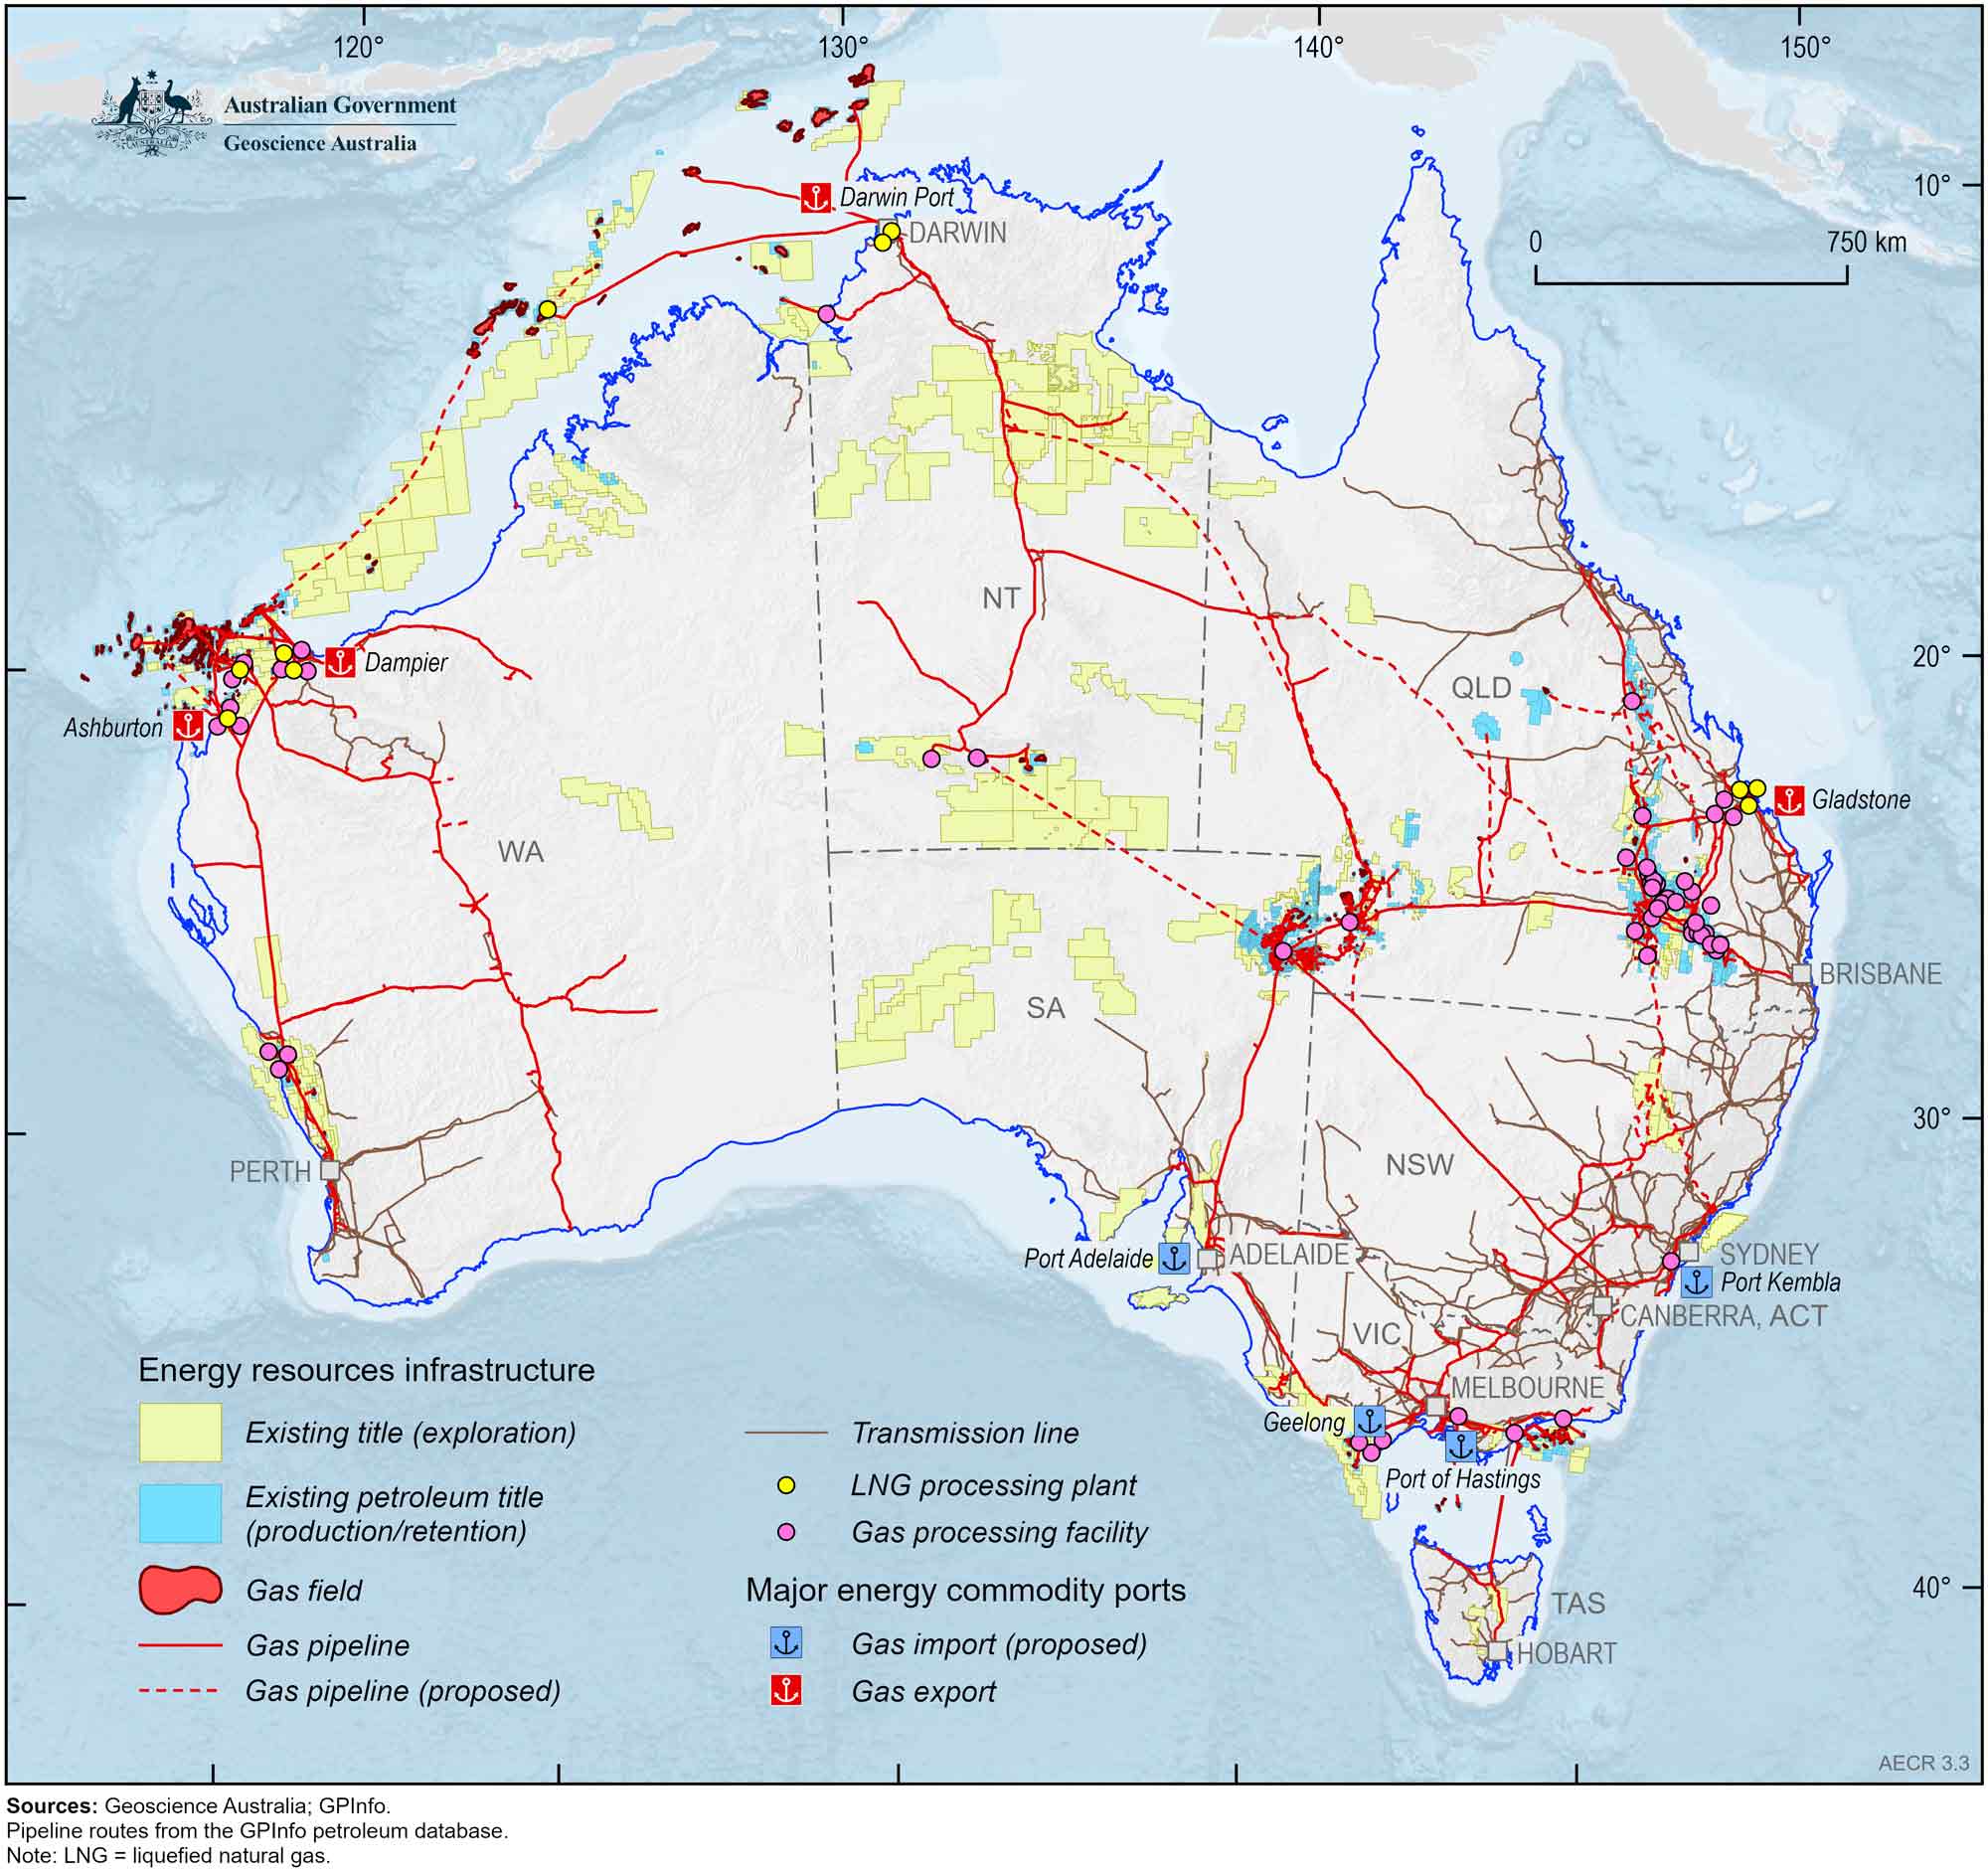
Figure 3.3 Australia’s petroleum permits, gas fields and infrastructure
Australia is a substantial net exporter of natural gas, exporting about 70% of produced volumes as LNG in 2023. Over the past decade, LNG exports from Australia have increased by an average of 13.5% per year (Figure 3.4), with several new facilities commencing production during this period. After peaking in 2021-22 at 4,637 PJ (83.2 Mt), Australia’s LNG exports remained high in 2023 with 4,388 PJ (80.7 million tonnes, Mt) exported, slightly below the 4,427 PJ (81.4 Mt) exported in 2022, placing Australia as the world’s third largest LNG exporter. In 2023, Australia’s LNG export earnings reached $74.3 billion (Figure 3.5), down 18% from 2022 (DISR, 2024b). In 2023, Australia imported 44 PJ (0.8 Mt) of gas from Timor Leste that was produced in the former Joint Petroleum Development Area; this gas is liquefied in Darwin and exported (DISR, 2024b).
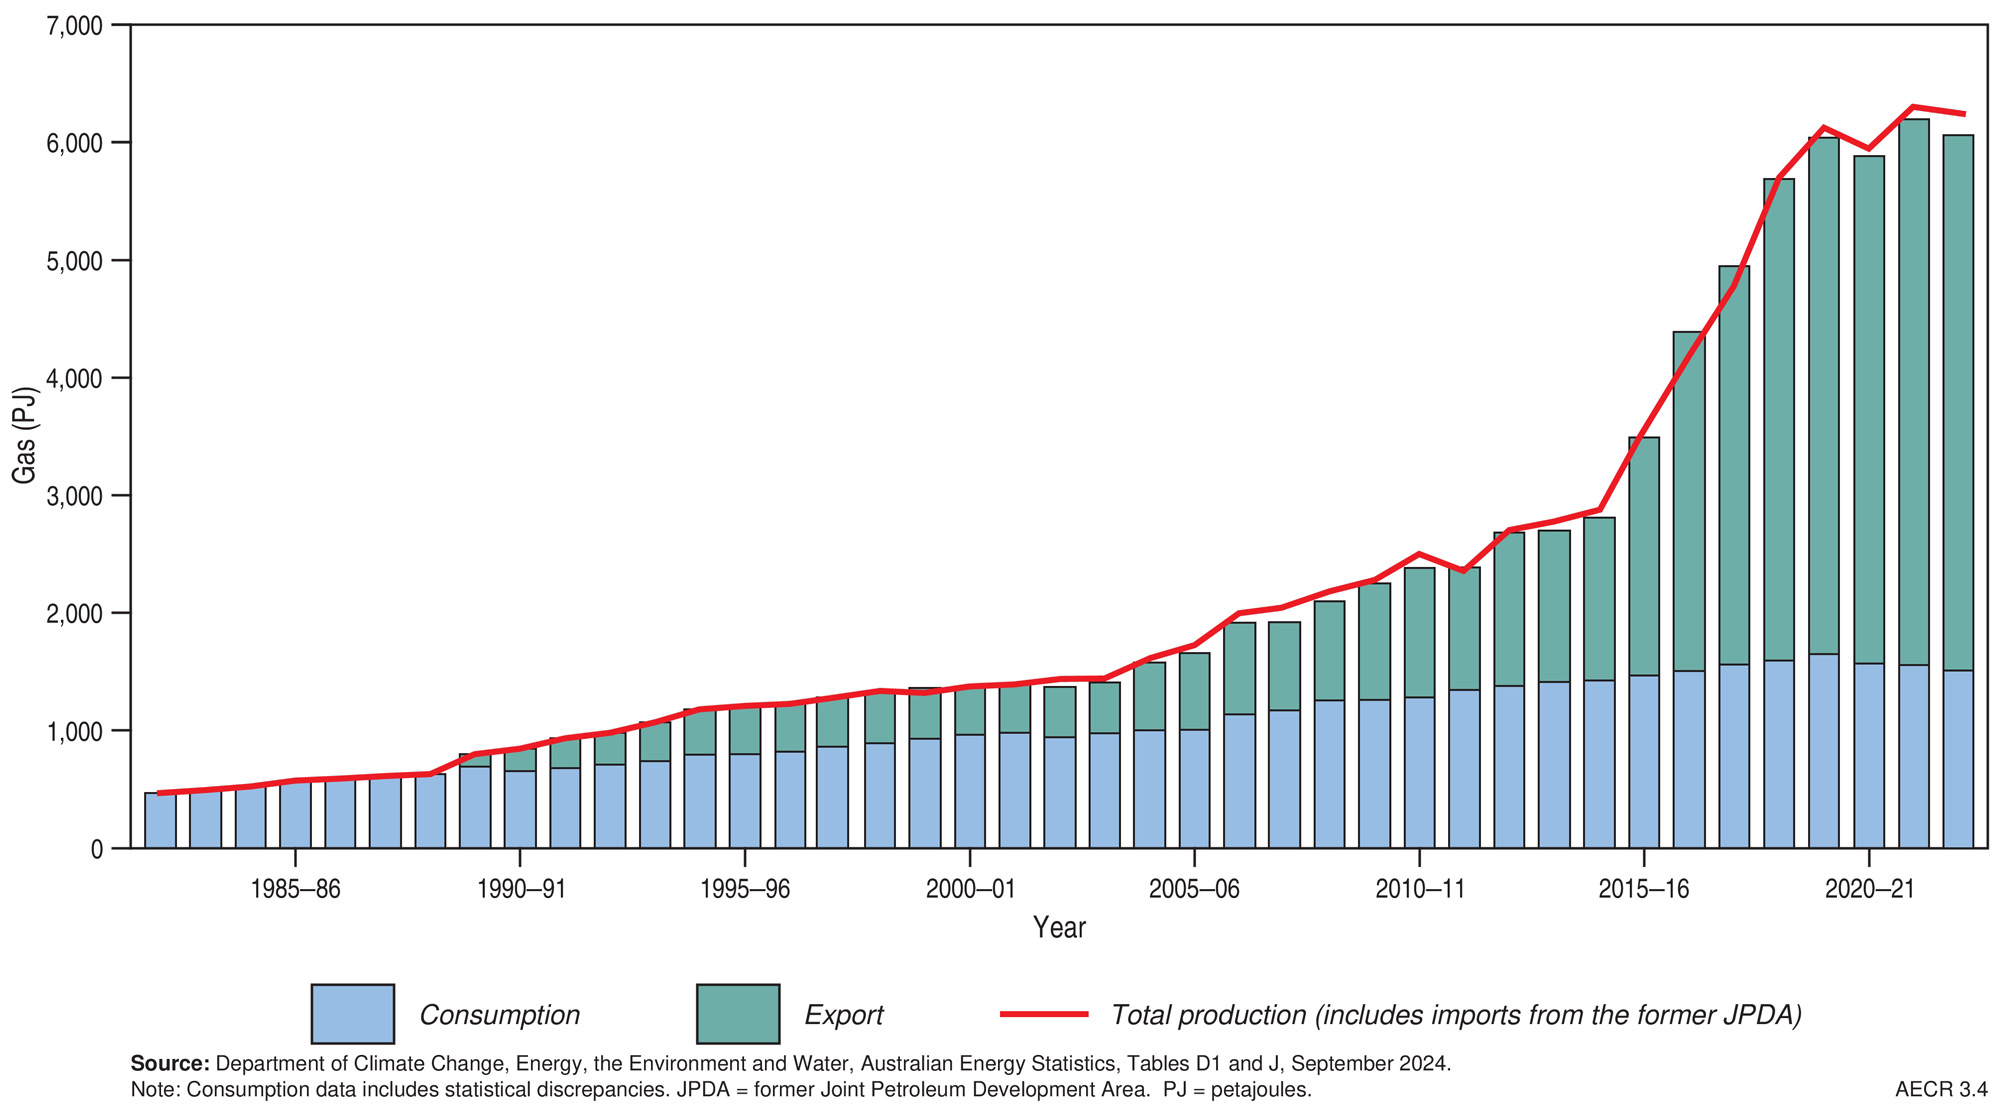
Figure 3.4 Australia’s gas production, consumption, and LNG exports, 1982–2023.
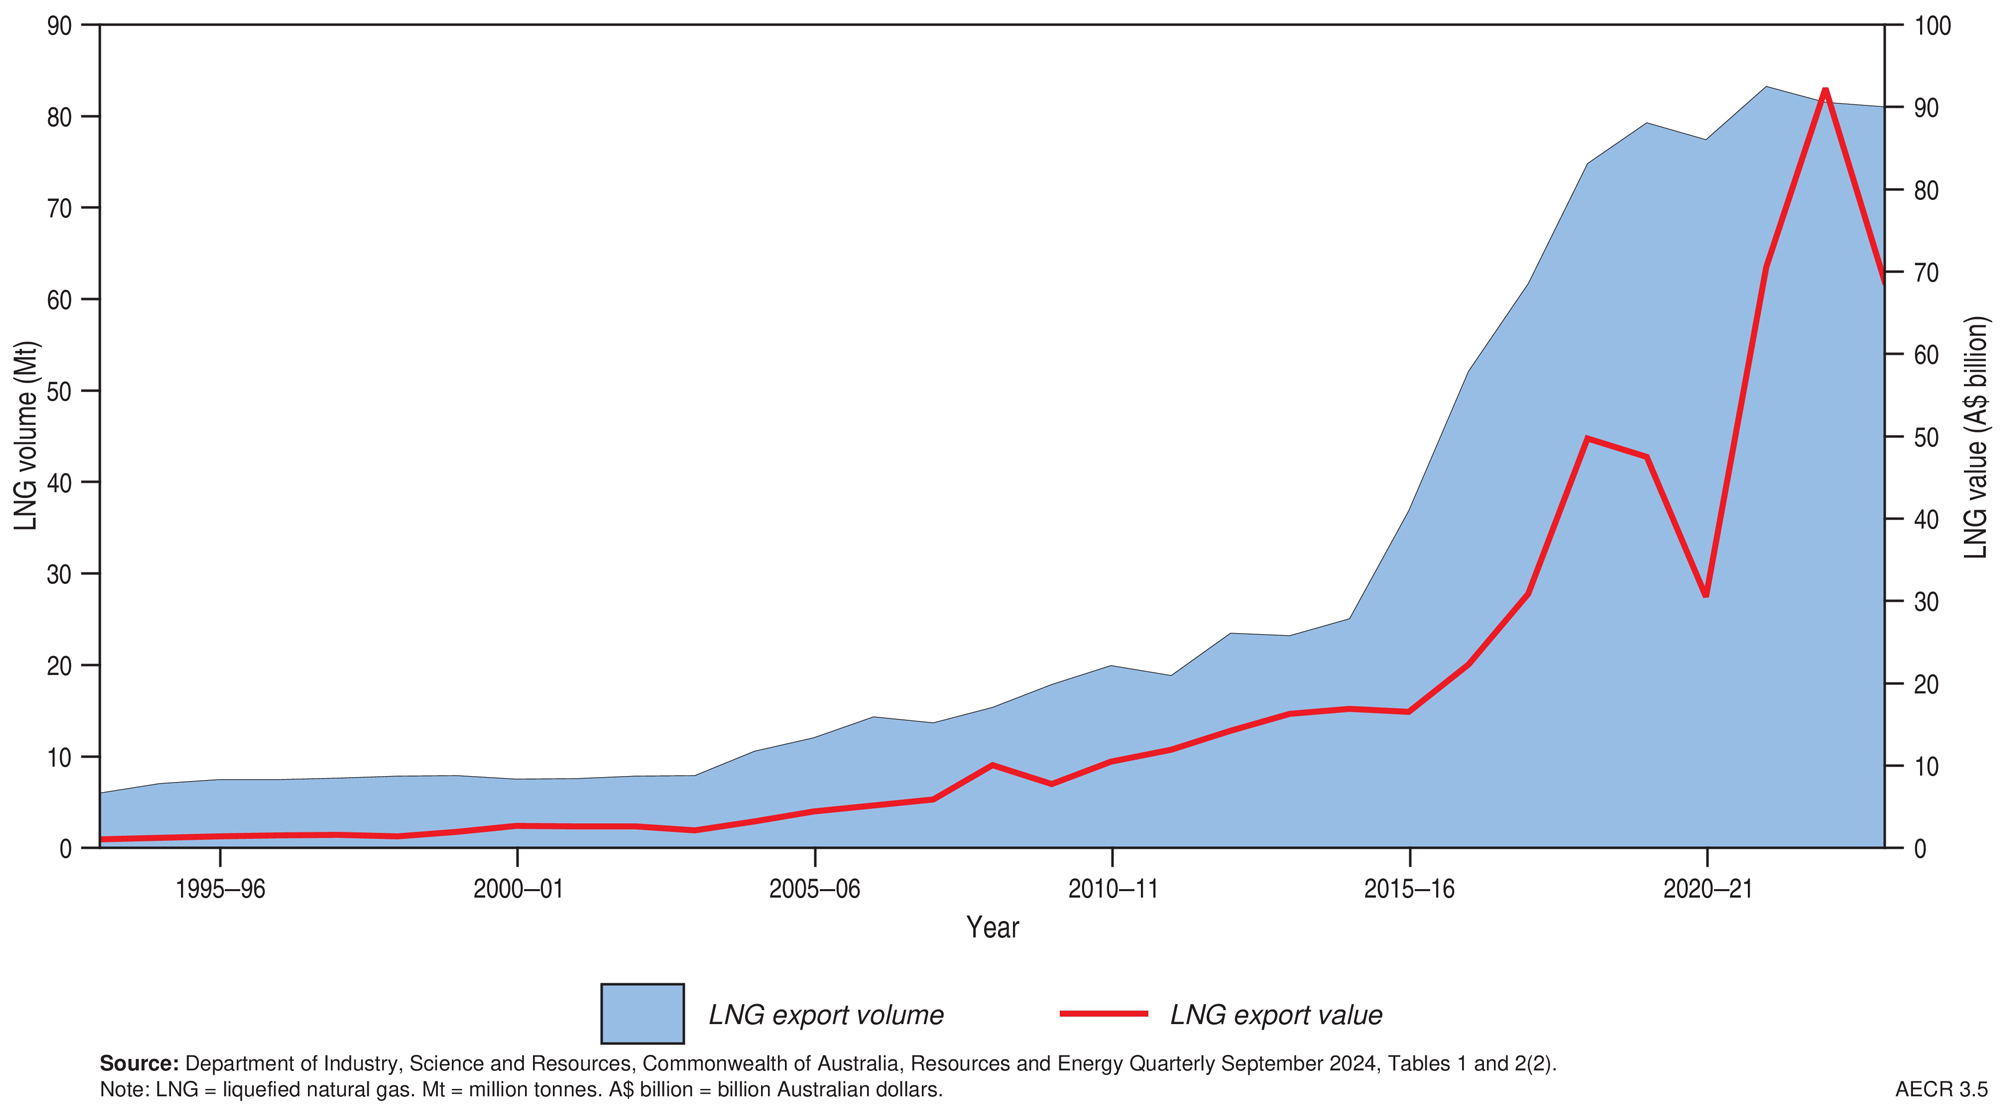
Figure 3.5 Australia’s LNG export volumes and values, 1993–2023.
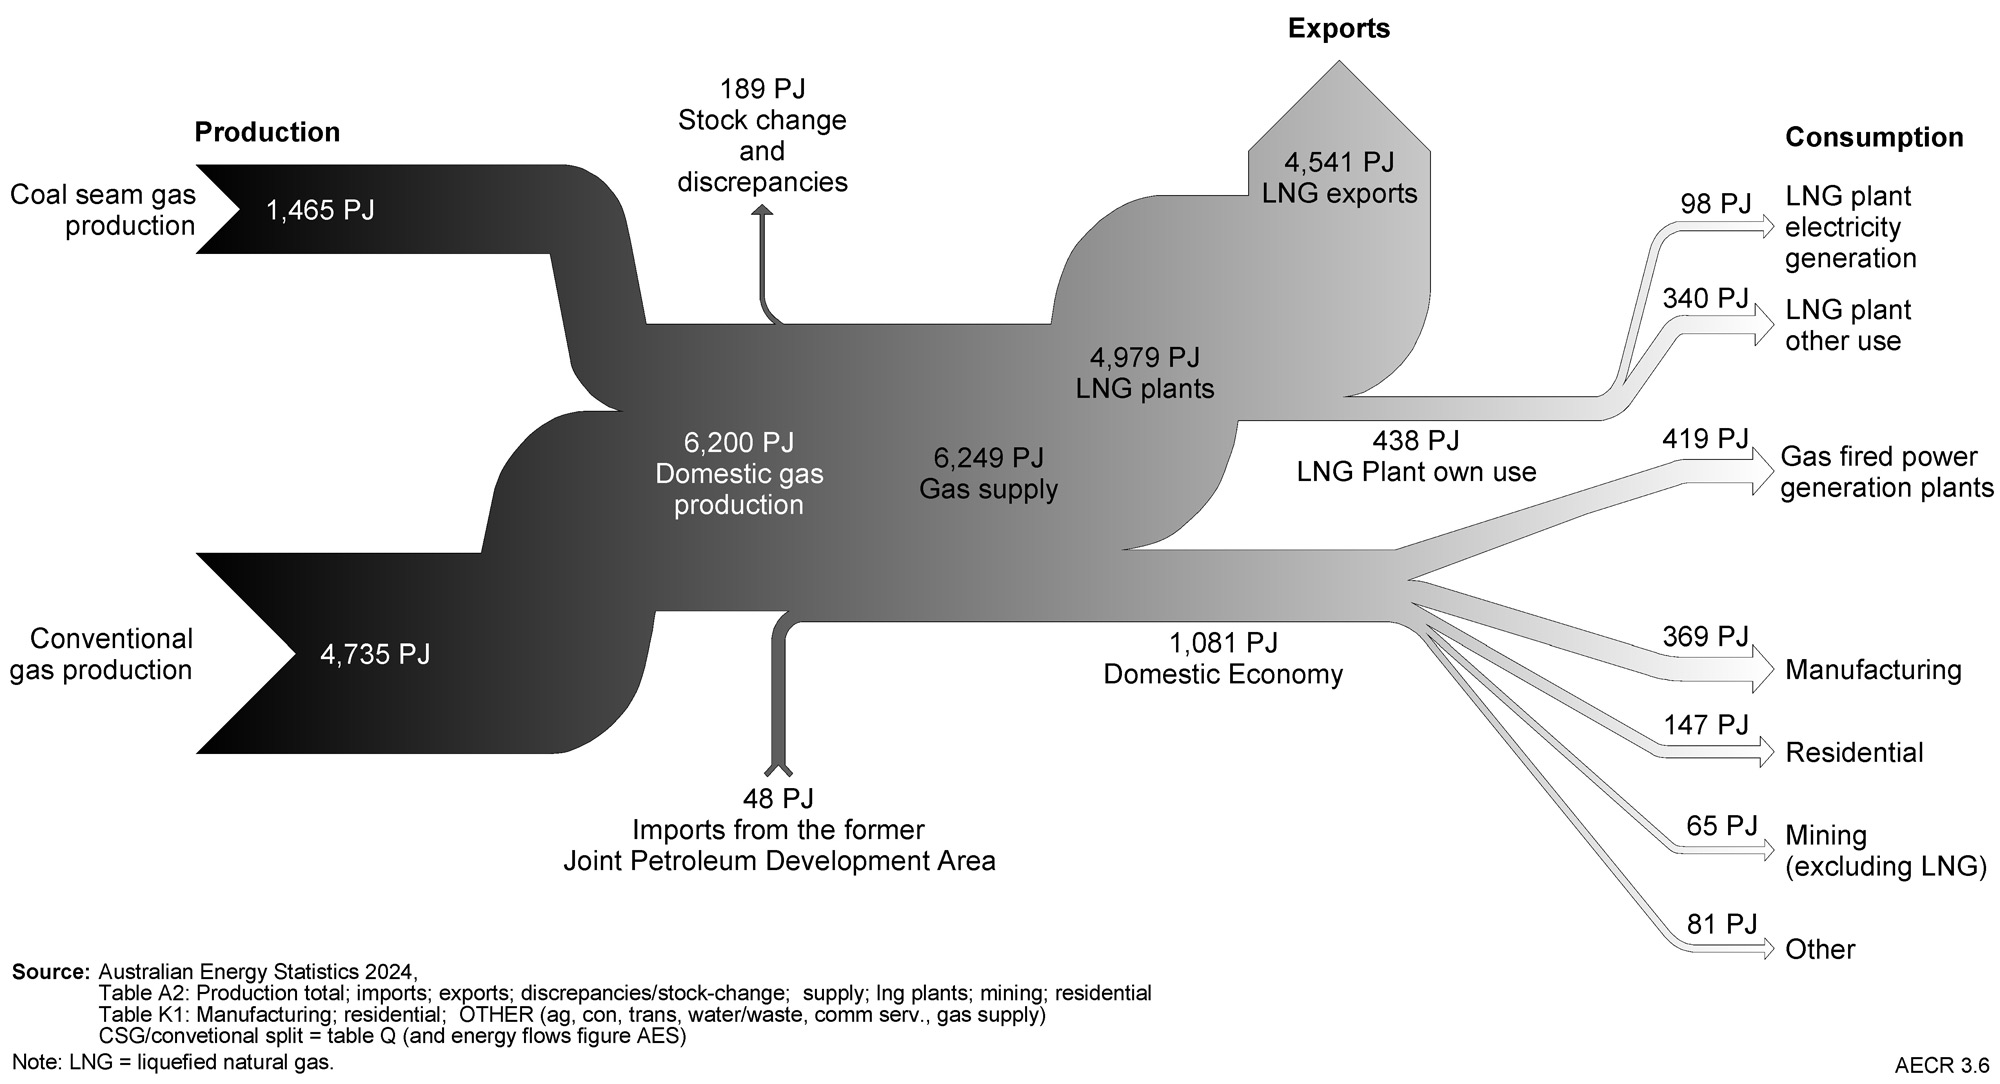
Figure 3.6 Australia’s gas flows, 2022-23
In 2023, global trade of natural gas decreased by 2.7% (0.9 Tcf; ~1,016 PJ), driven by an 8.3% (1.2 Tcf; 1,391 PJ) decrease in pipeline trade. This was offset by a 1.7% increase (0.3 Tcf; 375 PJ) in LNG supply, though this was well below the 10-year average growth rate of 5.3%. Major growth in LNG exports occurred in the US (9.4%; 0.3 Tcf; 392 PJ), Algeria (31.9%; 0.2 Tcf; 183 PJ) and Norway (46.8%; 0.1 Tcf; 69 PJ), while Australia’s exports remained steady (Energy Institute, 2024).
References
ABS (Australian Bureau of Statistics), 2024. Mineral and Petroleum Exploration, Australia, Table 5. Released 4 March 2024 (last accessed July 2025).
DCCEEW (Department of Climate Change, Energy, the Environment and Water), 2024. Australian Energy Update, 2024.
DCCEEW (Department of Climate Change, Energy, the Environment and Water), 2024. Australian Energy Statistics, 2024. Tables A2, D1, F, J and Q3, August 2024.
DISR (Department of Industry, Science and Resources), 2024a. Resources and Energy Major Projects: 2024.
DISR (Department of Industry, Science and Resources), 2024b. Resources and Energy Quarterly: September 2024.
Energy Institute, 2024. Statistical Review of World Energy.
Note: refer to Appendix 4 for references regarding onshore gas reserves, contingent resources and production data
Data download
Data tables and full report are downloadable from the Geoscience Australia website.