Australia's Energy Commodity Resources 2025 Oil
Page last updated:23 October 2025
Oil
|
TDR 100,255 PJ ( 0.3%) | |
|
Reserves (2P) 7,551 PJ ( 6.2%) |
|
Production 619 PJ ( 9.9%) | |
|
Exports 703 PJ ( 8.7%) $14.5 b ( 10.5%) |
|
Production World Ranking 31 (0.4%) | |
|
Export World Ranking na |
Notes
Statistics are for 2023, percentage increases or decreases are relative to 2022. World rankings are followed by percentage share in brackets. Production does not fully capture LPG. Exports include crude oil, refinery feedstocks and LPG. TDR – Total demonstrated resources (reserves and contingent resources); PJ – petajoules. na – not available. $b – billion dollars (Australian).
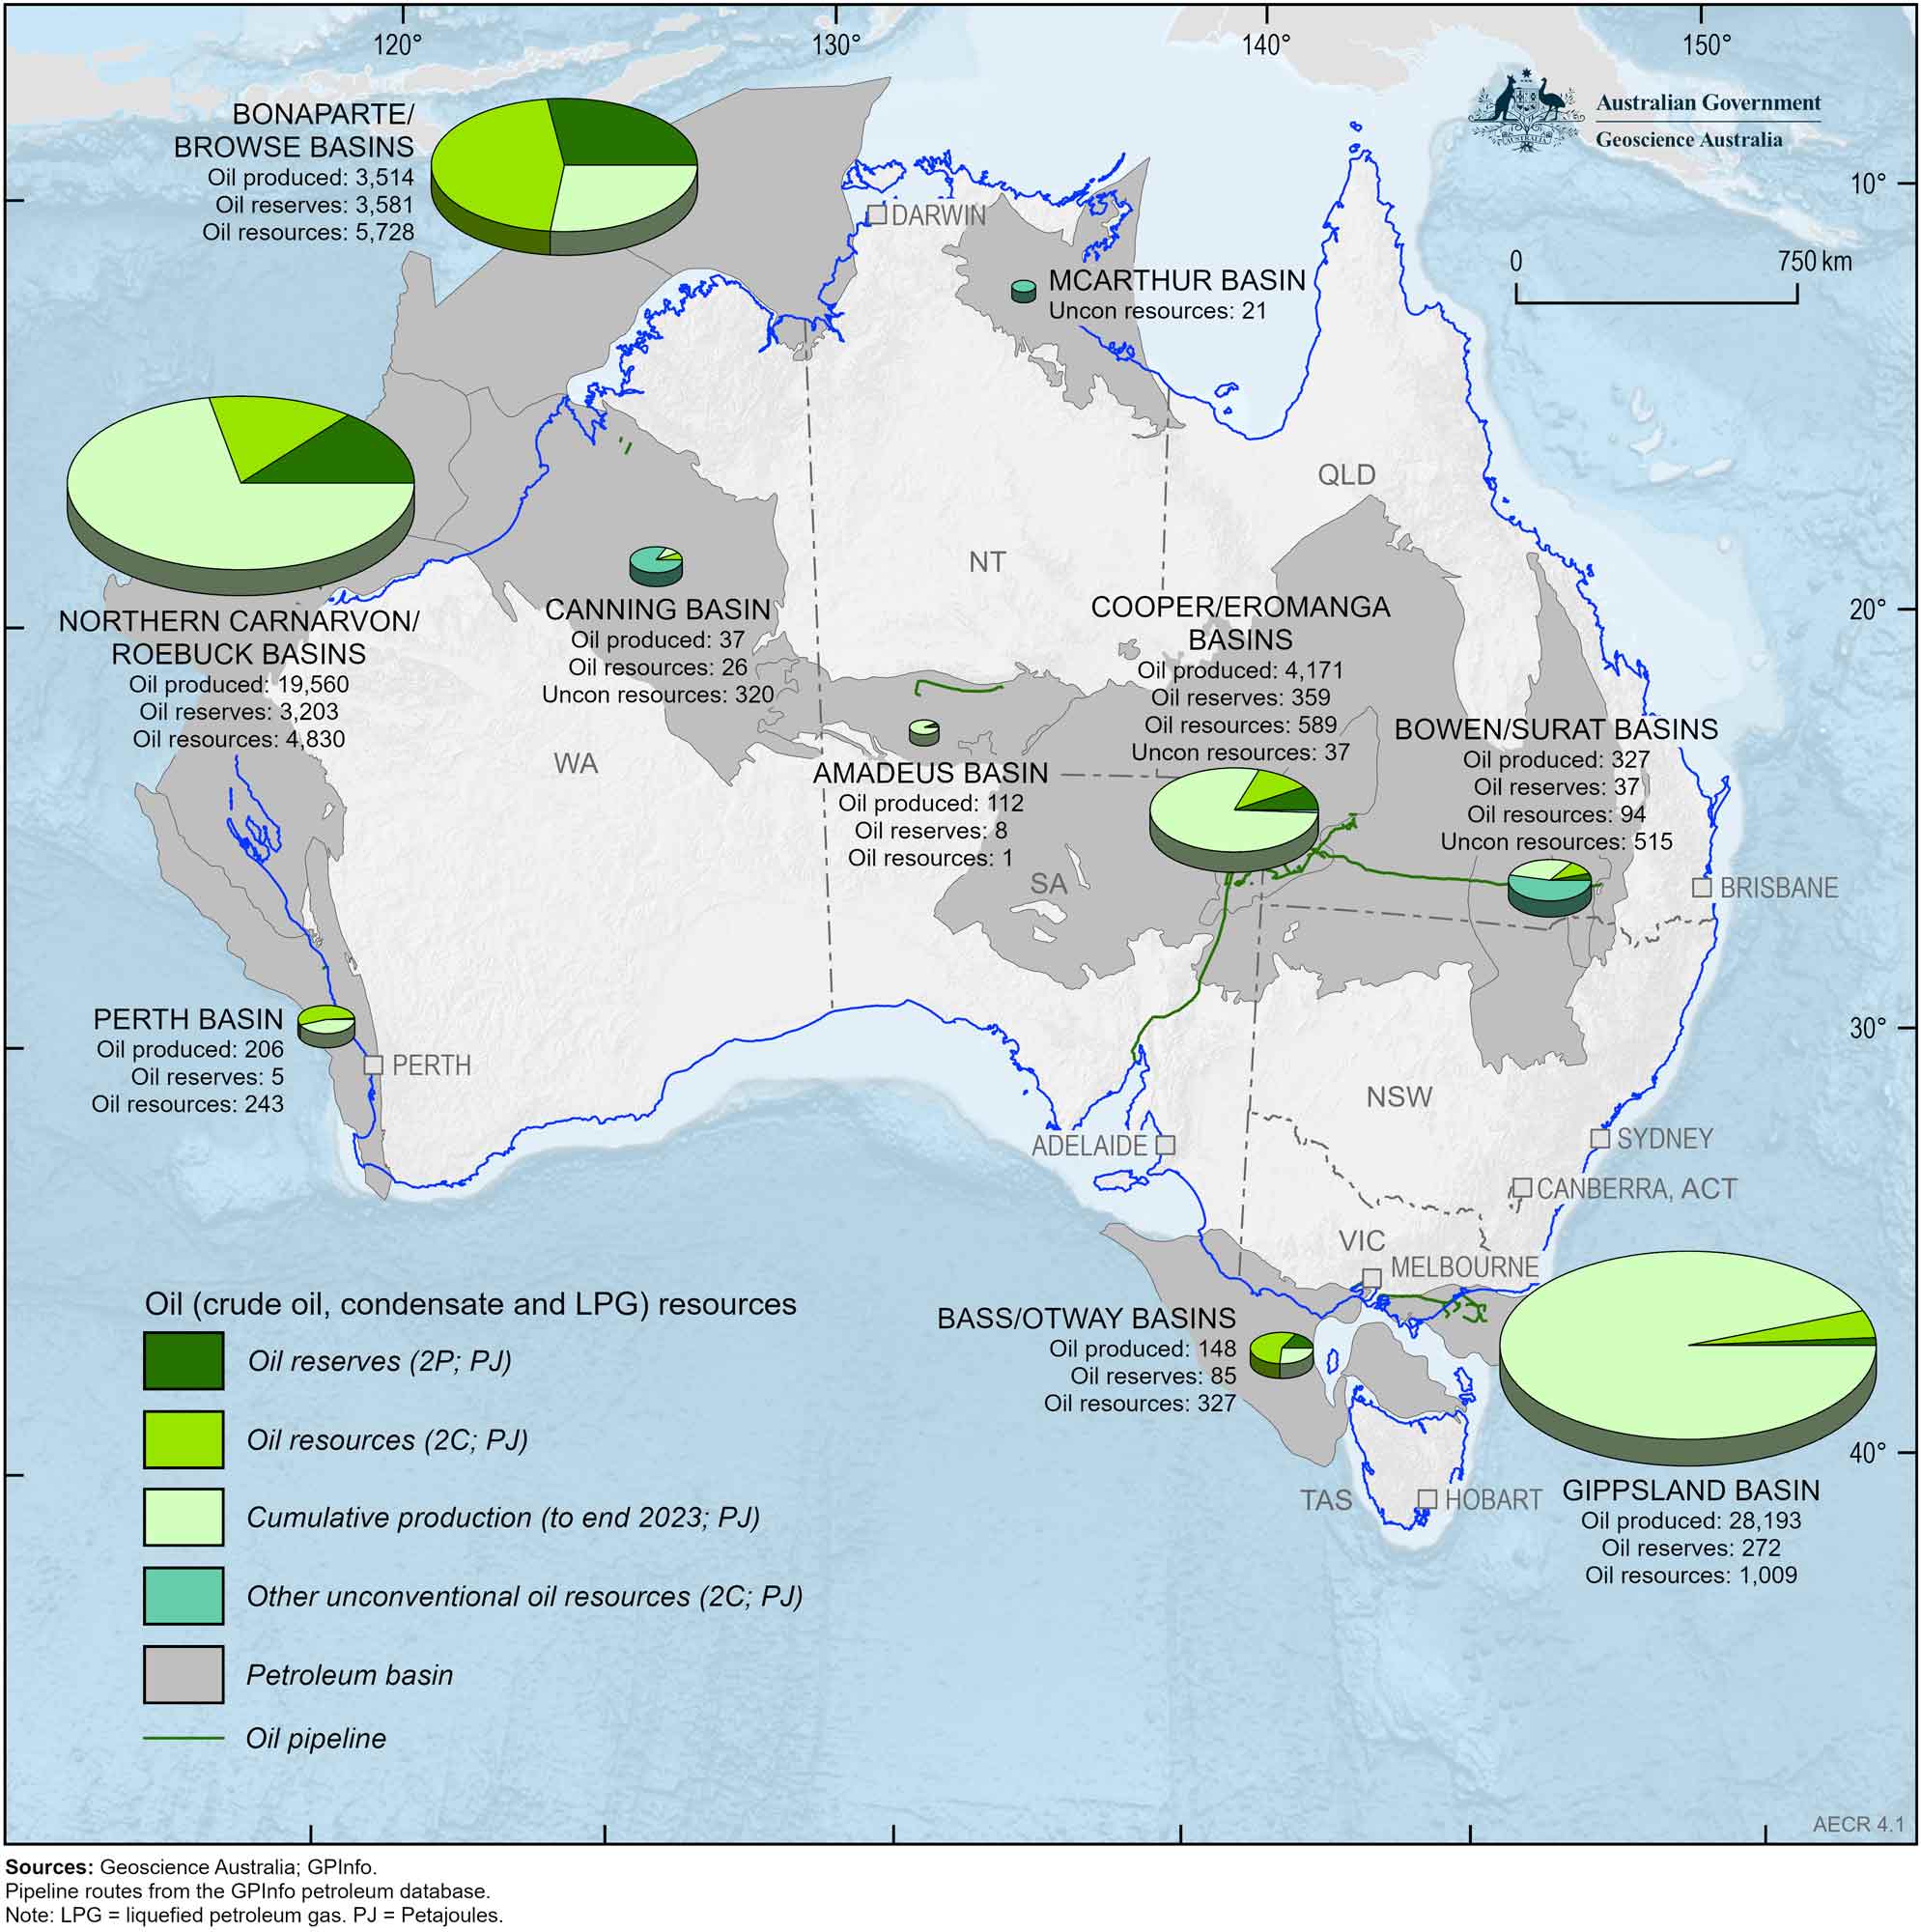
Figure 4.1 Australia’s remaining oil reserves (2P) and contingent resources (2C) during 2023 and cumulative production to end 2023 (PJ). For physical units (MMbbl) refer to Table 4.1, Table 4.2, Table 4.3 and Table 4.4.
Highlights
- In 2023 Australia’s total demonstrated oil resources are estimated as 100,255 PJ (17,142 million barrels [MMbbl]), of which 7,551 PJ (1312 MMbbl) are classified as proven and probable (2P) reserves. Approximately 80% of these resources are associated with unconventional oil shale deposits.
- Australia’s conventional liquid hydrocarbon resources include crude oil, and the condensate plus liquefied petroleum gas (LPG) resources associated with gas accumulations (as phases of natural gas liquids; Figure 4.1). Australia has limited identified conventional oil resources which are being depleted at a faster rate than they are being replaced by new discoveries (Figure 4.2).
- In 2023, Australia’s total demonstrated resources (TDR) of conventional oil are estimated as 20,398 PJ (3,557 MMbbl), including 7,551 PJ (1,312 million barrels, MMbbl) of proven and probable (2P) reserves and 12,845 PJ (2,245 MMbbl) of contingent (2C) resources (Figure 4.1).
- Australia has significant undiscovered unconventional oil resources potential, including shale oil, tight oil, oil shale and basin centred natural gas liquids. Unconventional oil resources are currently undeveloped and include oil shale occurrences (TDR of 78,966 PJ; 13,430 MMbbl) and minor condensate and LPG associated with unconventional gas resources (TDR of 848 PJ; 144 MMbbl). Currently there are no unconventional oil reserves or production in Australia.
- Australia is a minor oil producer, ranking 31st in the world and accounting for 0.4% of total oil production in 2023 (Energy Institute, 2024). In 2022-23 Australia produced 771 PJ (131 MMbbl) of crude oil, condensate and LPG, of which over 94% was exported (DCCEEW, 2024). In 2023, Australia imported about 90% of its oil requirements.
- In 2023, nearly 80% of all oil production was from offshore fields on Australia’s North West Shelf (Northern Carnarvon, Browse and Bonaparte basins), this included condensate produced from a few large gas fields. Australia’s domestic crude oil production continues to decline rapidly, and without new commercial discoveries, production is projected to cease within the next 7 years.
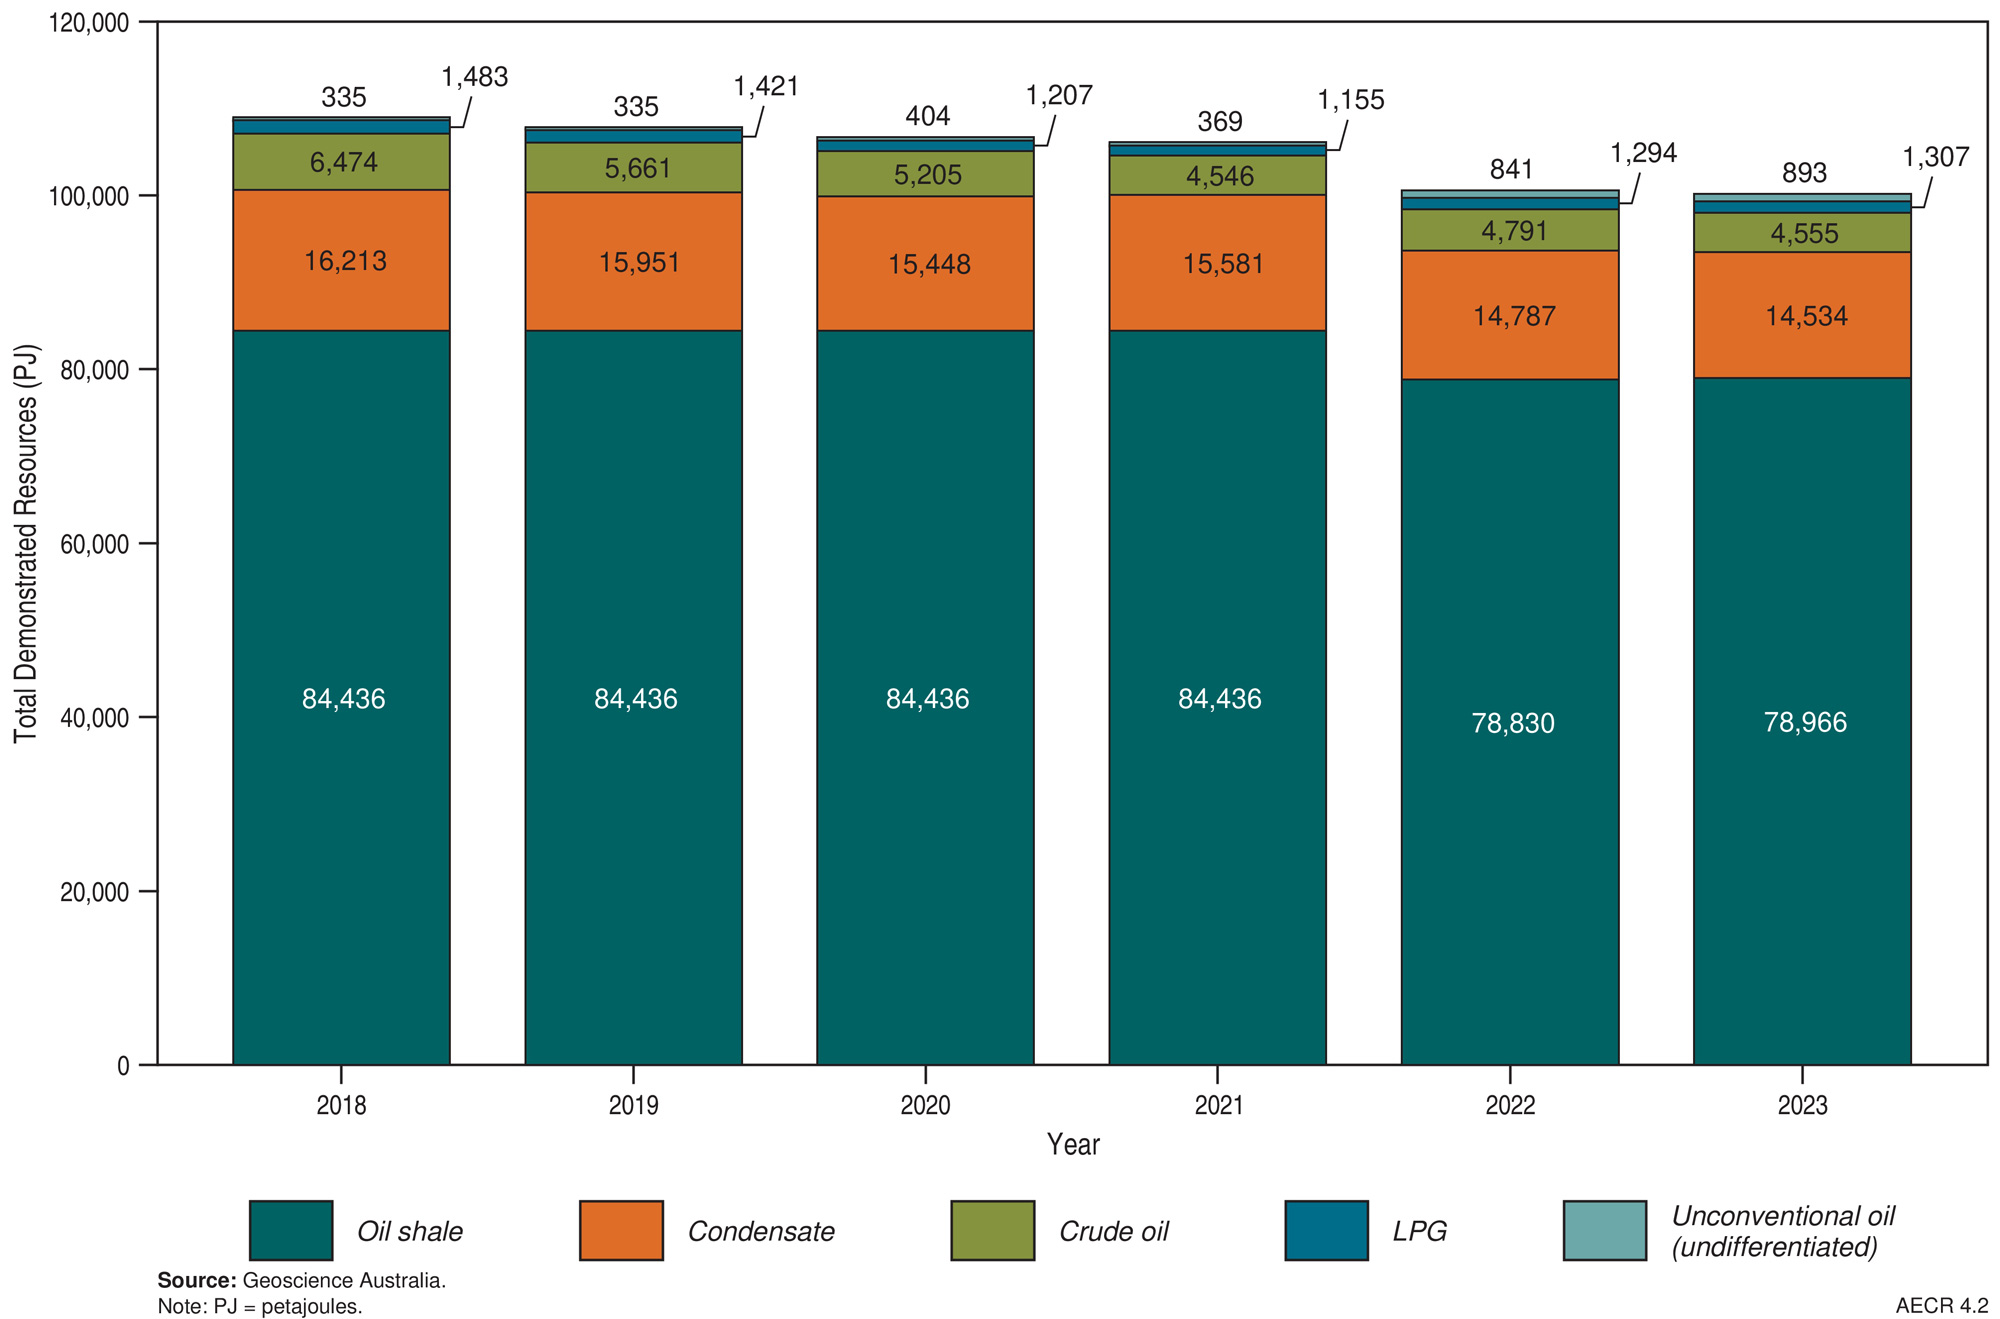
Figure 4.2 Trends in Australia’s total demonstrated oil resources, 2018–2023.
Identified oil resources
The majority of Australia’s remaining identified offshore oil resources occur in basins located in the continent’s north‑west and south‑east, with the Northern Carnarvon and Browse/Bonaparte basins holding the majority of these resources. Onshore, the Cooper–Eromanga basin in South Australia and Queensland holds the greatest quantity of identified remaining conventional oil resources (Figure 4.1; Table 4.1, Table 4.2 and Table 4.3).
In 2023, Australia’s TDR of conventional oil are estimated as 20,397 PJ (3,557 MMbbl), down 2% (474 PJ) from 2022. Australia’s conventional oil resources include:
- Crude oil with TDR estimated to be 4,555 PJ (775 MMbbl), a decrease of 4.9% from 2022, including 1,346 PJ (229 MMbbl) of reserves and 3,209 PJ (546 MMbbl) of contingent resources. Based on 2023 production rates, the estimated life for Australia’s crude oil reserves is 7 years.
- Total demonstrated LPG resources estimated as 1,308 PJ (311 MMbbl), an increase of 1.0% from 2022, comprising 419 PJ (99 MMbbl) of reserves and 888 PJ (211 MMbbl) of contingent resources. Based on 2023 production rates, the remaining life for Australia’s LPG reserves is estimated to be 10 years.
- Condensate TDR is estimated as 14,535 PJ (2,472 MMbbl), a decrease of 1.7% from 2022, this includes 5,786 PJ (984 MMbbl) of reserves and 8,748 PJ (1,488 MMbbl) of contingent resources. Most condensate resources are associated with LNG projects in the Northern Carnarvon and Browse basins on the North West Shelf. Based on 2023 production rates, Australia’s condensate reserves have an estimated life of 15 years.
Table 4.1 Australia's remaining crude oil reserves (2P), contingent resources (2C) and annual production during 2023, and cumulative production to end 2023.
| Basin | Crude oil | |||||||
|---|---|---|---|---|---|---|---|---|
| Annual Production | Cumulative Production | Reserves (2P) | Resources (2C) | |||||
| PJ | MMbbl | PJ | MMbbl | PJ | MMbbl | PJ | MMbbl | |
| Amadeus | 1 | 0.1 | 112 | 19 | 8 | 1 | 1 | 0.2 |
| Bass/Otway | 0 | 0 | 0 | 0 | 0 | 0 | 40 | 7 |
| Bonaparte/Browse | 8 | 1 | 2,717 | 462 | 139 | 24 | 352 | 60 |
| Bowen/Surat | 0 | 0.1 | 200 | 34 | 12 | 2 | 56 | 10 |
| Canning | 0 | 0 | 37 | 6 | 0 | 0 | 0 | 0 |
|
Northern Carnarvon/ Roebuck | 115 | 20 | 12,329 | 2,097 | 919 | 156 | 1,743 | 296 |
| Cooper/Eromanga | 39 | 7 | 2,494 | 424 | 241 | 41 | 371 | 63 |
| Gippsland | 17 | 3 | 22,717 | 3,864 | 23 | 4 | 429 | 73 |
| Perth | 1 | 0.2 | 199 | 34 | 3 | 0.5 | 217 | 37 |
| Total | 182 | 31 | 40,807 | 6,940 | 1,346 | 229 | 3,209 | 546 |
|
Change from 2022 (%) | 51 (-22%) | 9 (-22%) | 179 (0.4%) | 30 (0.4%) | 128 (-9%) | 22 (-9%) | 106 (-3%) | 18 (-3%) |
Abbreviations
PJ= Petajoules. MMbbl=million barrels.
Notes
Data from the former Joint Petroleum Development Area (JPDA) have been omitted from Bonaparte Basin totals. Sources: Offshore data provided by NOPTA to year-end 2023; onshore data are sourced from government statistics and company estimates reported at various dates between June 2023 and June 2024. Additional data for the Northern Carnarvon/Roebuck basin sourced from EnergyQuest (2024); additional data for the Browse-Bonaparte and Perth basins sourced from company reports.
Table 4.2 Australia’s remaining condensate reserves (2P), contingent resources (2C) and annual production during 2023, and cumulative production to end 2023.
| Basin | Condensate | |||||||
|---|---|---|---|---|---|---|---|---|
| Annual Production | Cumulative Production | Reserves (2P) | Resources (2C) | |||||
| PJ | MMbbl | PJ | MMbbl | PJ | MMbbl | PJ | MMbbl | |
| Amadeus | 0 | 0 | 0 | 0 | 0 | 0 | 0 | 0 |
| Bass/Otway | 4 | 1 | 107 | 18 | 42 | 7 | 210 | 36 |
| Bonaparte/Browse | 157 | 27 | 798 | 136 | 3,362 | 572 | 5,249 | 893 |
| Bowen/Surat | 4 | 1 | 57 | 10 | 9 | 2 | 22 | 4 |
| Canning | 0 | 0 | 0 | 0 | 0 | 0 | 26 | 5 |
|
Northern Carnarvon/ Roebuck | 210 | 36 | 7,231 | 1,230 | 2,205 | 375 | 2,820 | 480 |
| Cooper/Eromanga | 9 | 1 | 745 | 127 | 58 | 10 | 118 | 20 |
| Gippsland | 12 | 2 | 1,734 | 295 | 108 | 18 | 276 | 47 |
| Perth | 0 | 0 | 7 | 1 | 2 | 0.4 | 26 | 4 |
| Total | 397 | 67 | 10,677 | 1,816 | 5,786 | 984 | 8,748 | 1,488 |
|
Change from 2022 (%) | 8 (-2%) | 1 (-2%) | 419 (4%) | 71 (4%) | 196 (-3%) | 33 (-3%) | 56 (-1%) | 10 (-1%) |
Abbreviations
PJ= Petajoules. MMbbl=million barrels.
Notes
Data from the former Joint Petroleum Development Area (JPDA) have been omitted from Bonaparte Basin totals. Sources: Offshore data provided by NOPTA to year-end 2023; onshore data are sourced from government statistics and company estimates reported at various dates between June 2023 and June 2024.
Table 4.3 Australia's remaining LPG reserves (2P), contingent resources (2C) and annual production during 2023, and cumulative production to end 2023.
| Basin | LPG | |||||||
|---|---|---|---|---|---|---|---|---|
| Annual Production | Cumulative Production | Reserves (2P) | Resources (2C) | |||||
| PJ | MMbbl | PJ | MMbbl | PJ | MMbbl | PJ | MMbbl | |
| Amadeus | 0 | 0 | 0 | 0 | 0 | 0 | 0 | 0 |
| Bass/Otway | 2 | 0.5 | 41 | 10 | 43 | 10 | 75 | 18 |
| Bonaparte/Browse1,2 | 0 | 0 | 0 | 0 | 80 | 19 | 127 | 30 |
| Bowen/Surat | 0 | 0 | 70 | 12 | 16 | 4 | 16 | 4 |
| Canning | 0 | 0 | 0 | 0 | 0 | 0 | 0 | 0 |
|
Northern Carnarvon/ Roebuck1 | 0 | 0 | 0 | 0 | 80 | 19 | 266 | 63 |
| Cooper/Eromanga | 9 | 2 | 933 | 188 | 60 | 14 | 100 | 24 |
| Gippsland | 29 | 7 | 3,742 | 889 | 141 | 33 | 305 | 72 |
| Perth | 0 | 0 | 0 | 0 | 0 | 0 | 0 | 0 |
| Total | 40 | 9 | 4,784 | 1,099 | 419 | 99 | 888 | 211 |
|
Change from 2022 (%) | 9 (-19%) | 2 (-19%) | 47 (1%) | 11 (1%) | 170 (-29%) | 40 (-29%) | 182 (26%) | 43 (26%) |
Abbreviations
PJ= Petajoules, MMbbl=million barrels, na = not available.
Notes
1LPG production data for the Bonaparte/Browse and Northern Carnarvon/Roebuck basin areas is not available as this is not reported in the offshore NOPTA data for these basins. 2Data from the former Joint Petroleum Development Area (JPDA) have been omitted from Bonaparte/Browse basin totals. Sources: Offshore data provided by NOPTA to year-end 2023; onshore data are sourced from government statistics and company estimates reported at various dates between June 2023 and June 2024.
Australia has significant potential for unconventional liquid petroleum resources hosted in oil shales, and shale oil and tight oil accumulations. There are currently no identified contingent resources of shale oil, coal oil or tight oil in Australia. Large volumes of contingent resources are contained in unconventional oil shale accumulations, estimated at 78,966 PJ (13,430 MMbbl; Table 4.5; Figure 4.3). These resources require mining and industrial processing to extract oil and although minor amounts of oil shale resources were produced in the past, there are currently no identified reserves or operating projects. Other contingent unconventional oil resources are currently limited to a small quantity (893 PJ, 155 MMbbl) of condensate and LPG associated with basin centred gas and tight gas accumulations in the Bowen/Surat, Canning and Cooper/Eromanga basins, as well as shale gas in the Beetaloo Sub-basin (Table 4.4).
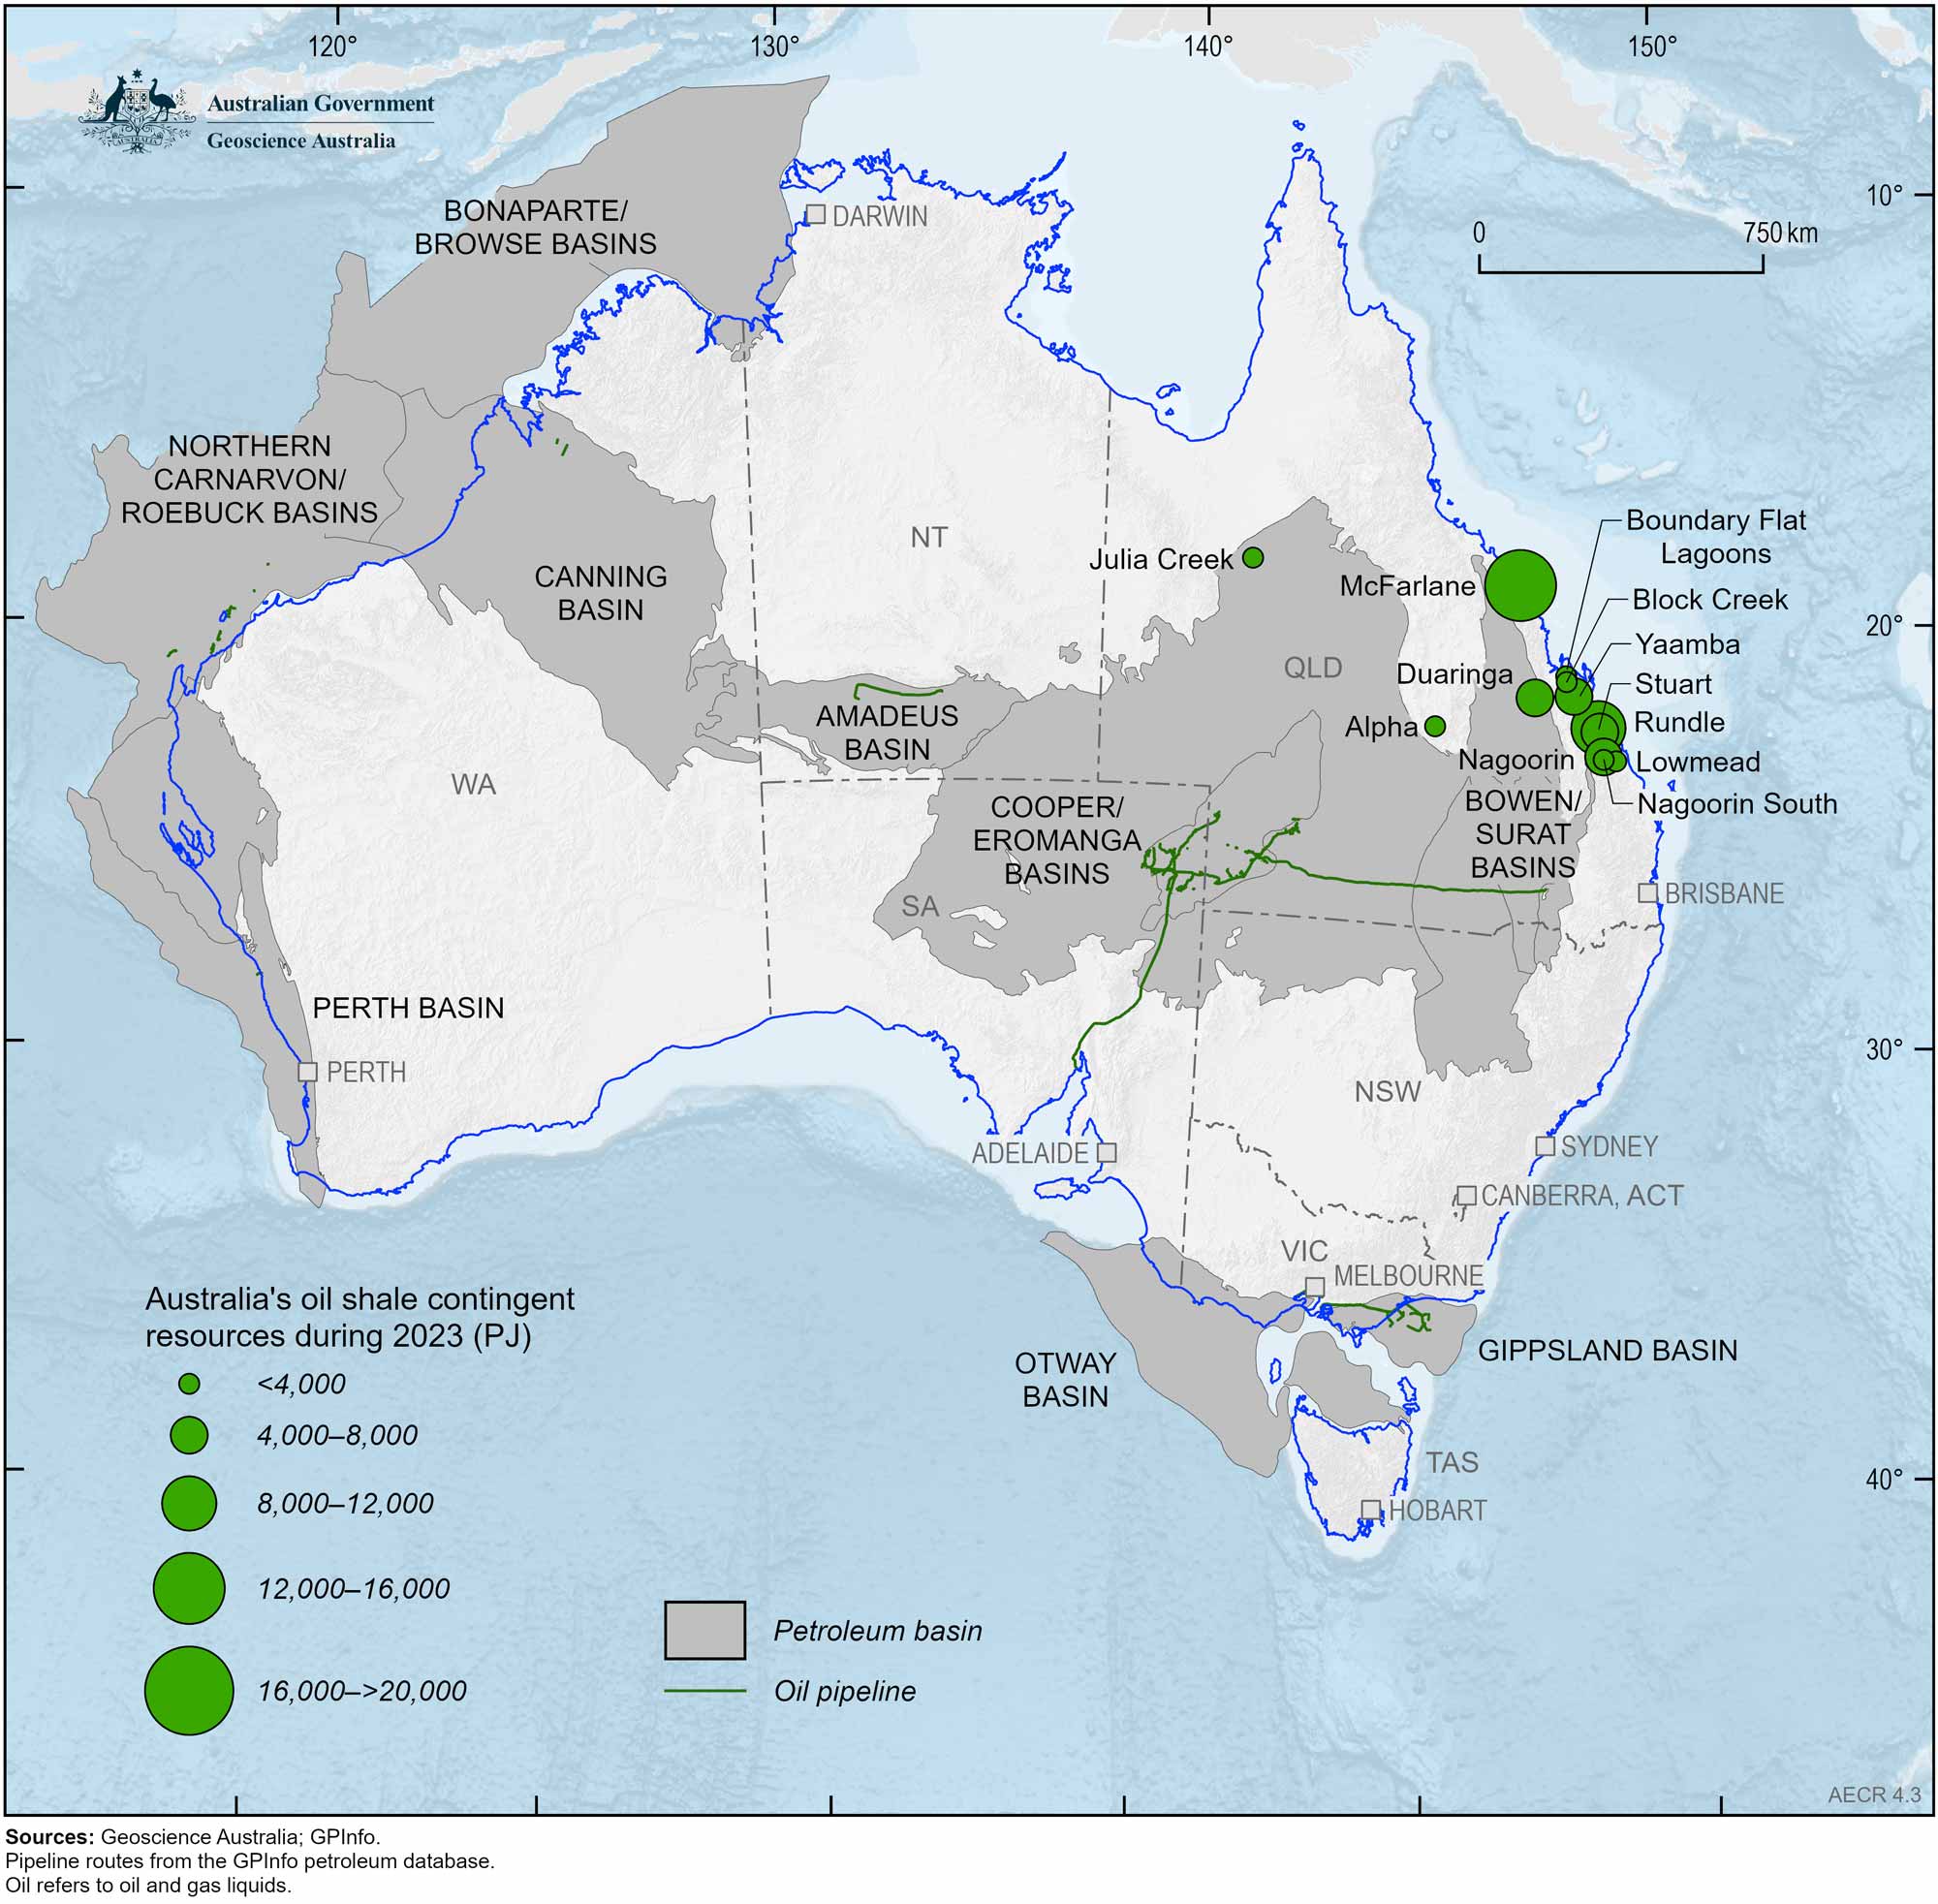
Figure 4.3 Australia’s oil shale contingent resources (2C) during 2023 (PJ). For physical units (MMbbl) refer to Table 4.5.
Table 4.4 Australia's unconventional oil contingent resources (2C) during 2023.
| Basin | Type | Unconventional Oil Resources (2C) | Data Source | |||||
|---|---|---|---|---|---|---|---|---|
| Oil | Condensate | LPG | ||||||
| PJ | MMbbl | PJ | MMbbl | PJ | MMbbl | |||
| Beetaloo Sub-basin | Shale gas | 0 | 0 | 21 | 4 | 0 | 0 | Empire Energy (2023) |
|
Bowen/ Surat |
Basin centred gas; tight gas | 0 | 0 | 485 | 82 | 30 | 7 |
Elixir Energy (2024); Omega Oil & Gas (2023); Qld Dept of Resources (2025) |
| Canning |
Basin centred gas; tight gas | 0 | 0 | 320 | 55 | 0 | 0 |
Black Mountain (2022); Buru Energy (2018) |
|
Cooper/ Eromanga | Undifferentiated | 0 | 0 | 22 | 4 | 15 | 3 | Beach Energy (2024) |
| Total | 0 | 0 | 848 | 144 | 45 | 11 | ||
|
Change from 2022 (%) | – | – | 47 (6%) | 8 (6%) | 5 (12%) | 1 (12%) | ||
Table 4.5 Australia's oil shale contingent resources (2C) during 2023.
| Deposit | Type | Oil Resources (2C)* | Data Source | |
|---|---|---|---|---|
| PJ | MMbbl | |||
| Alpha deposit | Oil Shale | 58 | 10 | Geoscience Australia (2018) |
| Block Creek deposit | Oil Shale | 1,355 | 230 | Geoscience Australia (2018) |
| Boundary Flat Lagoons deposit | Oil Shale | 1,535 | 261 | Geoscience Australia (2018) |
| Duaringa deposit | Oil Shale | 8,485 | 1,443 | Geoscience Australia (2018) |
| Julia Creek deposits (aggregated) | Oil Shale | 553 | 94 | QEM Limited (2024) |
| Lowmead deposit | Oil Shale | 1,253 | 213 | Geoscience Australia (2018) |
| McFarlane deposit# | Oil Shale | 28,745 | 4,889 | Geoscience Australia (2018) |
| Nagoorin deposit | Oil Shale | 6,305 | 1,072 | Geoscience Australia (2018) |
| Nagoorin South deposit | Oil Shale | 415 | 71 | Geoscience Australia (2018) |
| Rundle deposit | Oil Shale | 15,533 | 2,642 | Geoscience Australia (2018) |
| Stuart deposit | Oil Shale | 7,711 | 1,311 | Geoscience Australia (2018) |
| Yaamba deposit | Oil Shale | 7,018 | 1,194 | Geoscience Australia (2018) |
| Total | 78,966 | 13,430 | ||
|
Change from 2022 (%) | 135 (0.2%) | 23 (0.2%) | ||
Abbreviations
PJ = Petajoules; MMbbl = Million barrels.
Notes
#Queensland has a moratorium on the McFarlane oil shale development; in other cases, the Queensland Government will consider the development of oil shale deposits subject to the merits of the proposal. *With the exception of the Julia Creek deposits, these resources were reported as recoverable shale oil resources under the subeconomic “Paramarginal” and “Submarginal” categories of the JORC Code for reporting of Mineral Resources and Ore Reserves.
Production and trade
Based on the data compiled for this publication, Australia’s oil production in 2023 totalled 619 PJ (108 MMbbl), however, this total does not capture LPG production from basins on Australia’s North West Shelf1. This section draws on the Australian Government’s energy statistics published in the Australian Energy Update (DCCEEW, 2024), which captures trends in Australia’s oil production and trade. In 2022-23 Australia produced 771 PJ (131 MMbbl) of crude oil, condensate and LPG, of which over 94% was exported (DCCEEW, 2024). About 70% of Australia’s extracted oil in 2023 was condensate and LPG resources associated with producing gas fields. Figure 4.4 shows the distribution of Australia’s oil fields, pipelines, petroleum permits and ports.
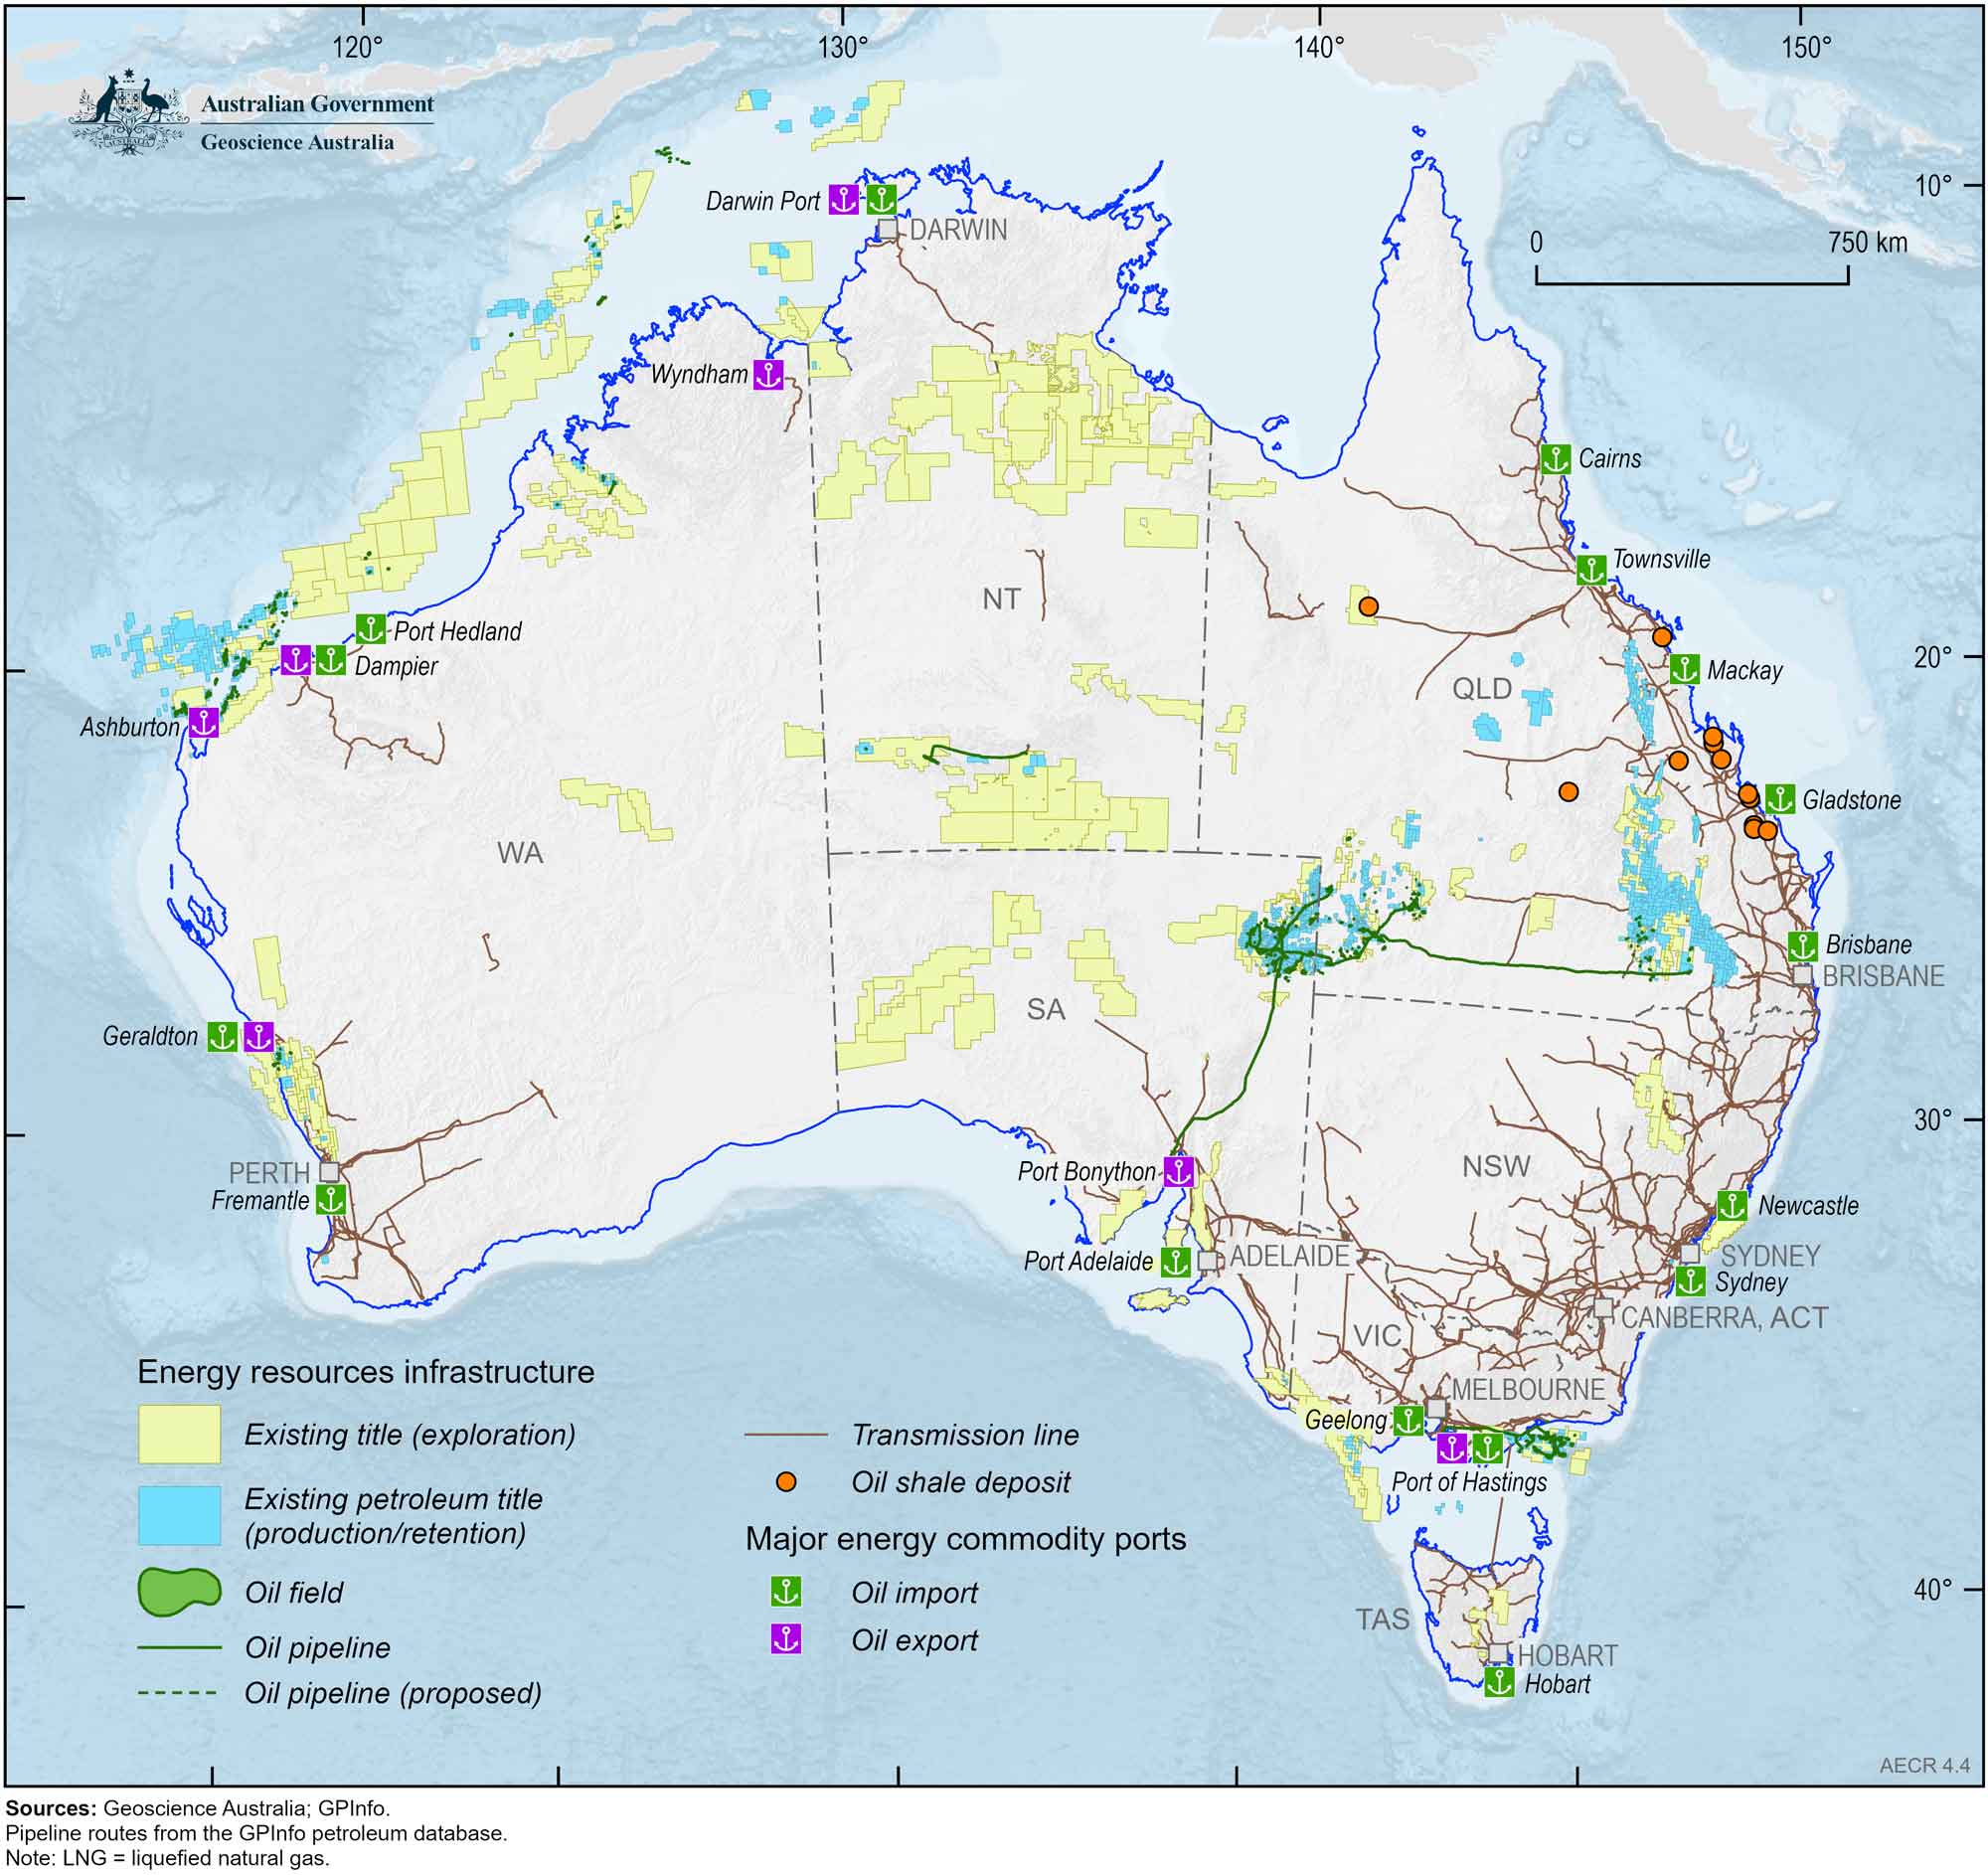
Figure 4.4 Australia’s oil fields, infrastructure and petroleum permits.
Australia is a net importer of refined oil products, crude oil and other refinery feedstocks, and also exports a major share of its crude oil production, predominantly from Western Australia (Figure 4.5). About 97% of Australia’s domestically produced oil resources were exported in 2022-23. Australia’s crude oil and condensate exports decreased by 3%, or 18 PJ, in 2022-23 to 604 PJ (DCCEEW, 2024) with associated export earnings down 6% to A$13.2 billion (DISR, 2024). Australia also exported a small volume (about 120 PJ) of refined products and LPG in 2022-23 (Figure 4.6), but this remained a small proportion of domestically refined products. Export earnings from Australia’s refined petroleum products and LPG were steady in 2022-23 at AUD$5 billion, with continued high earnings from bunker fuels (DISR, 2024).
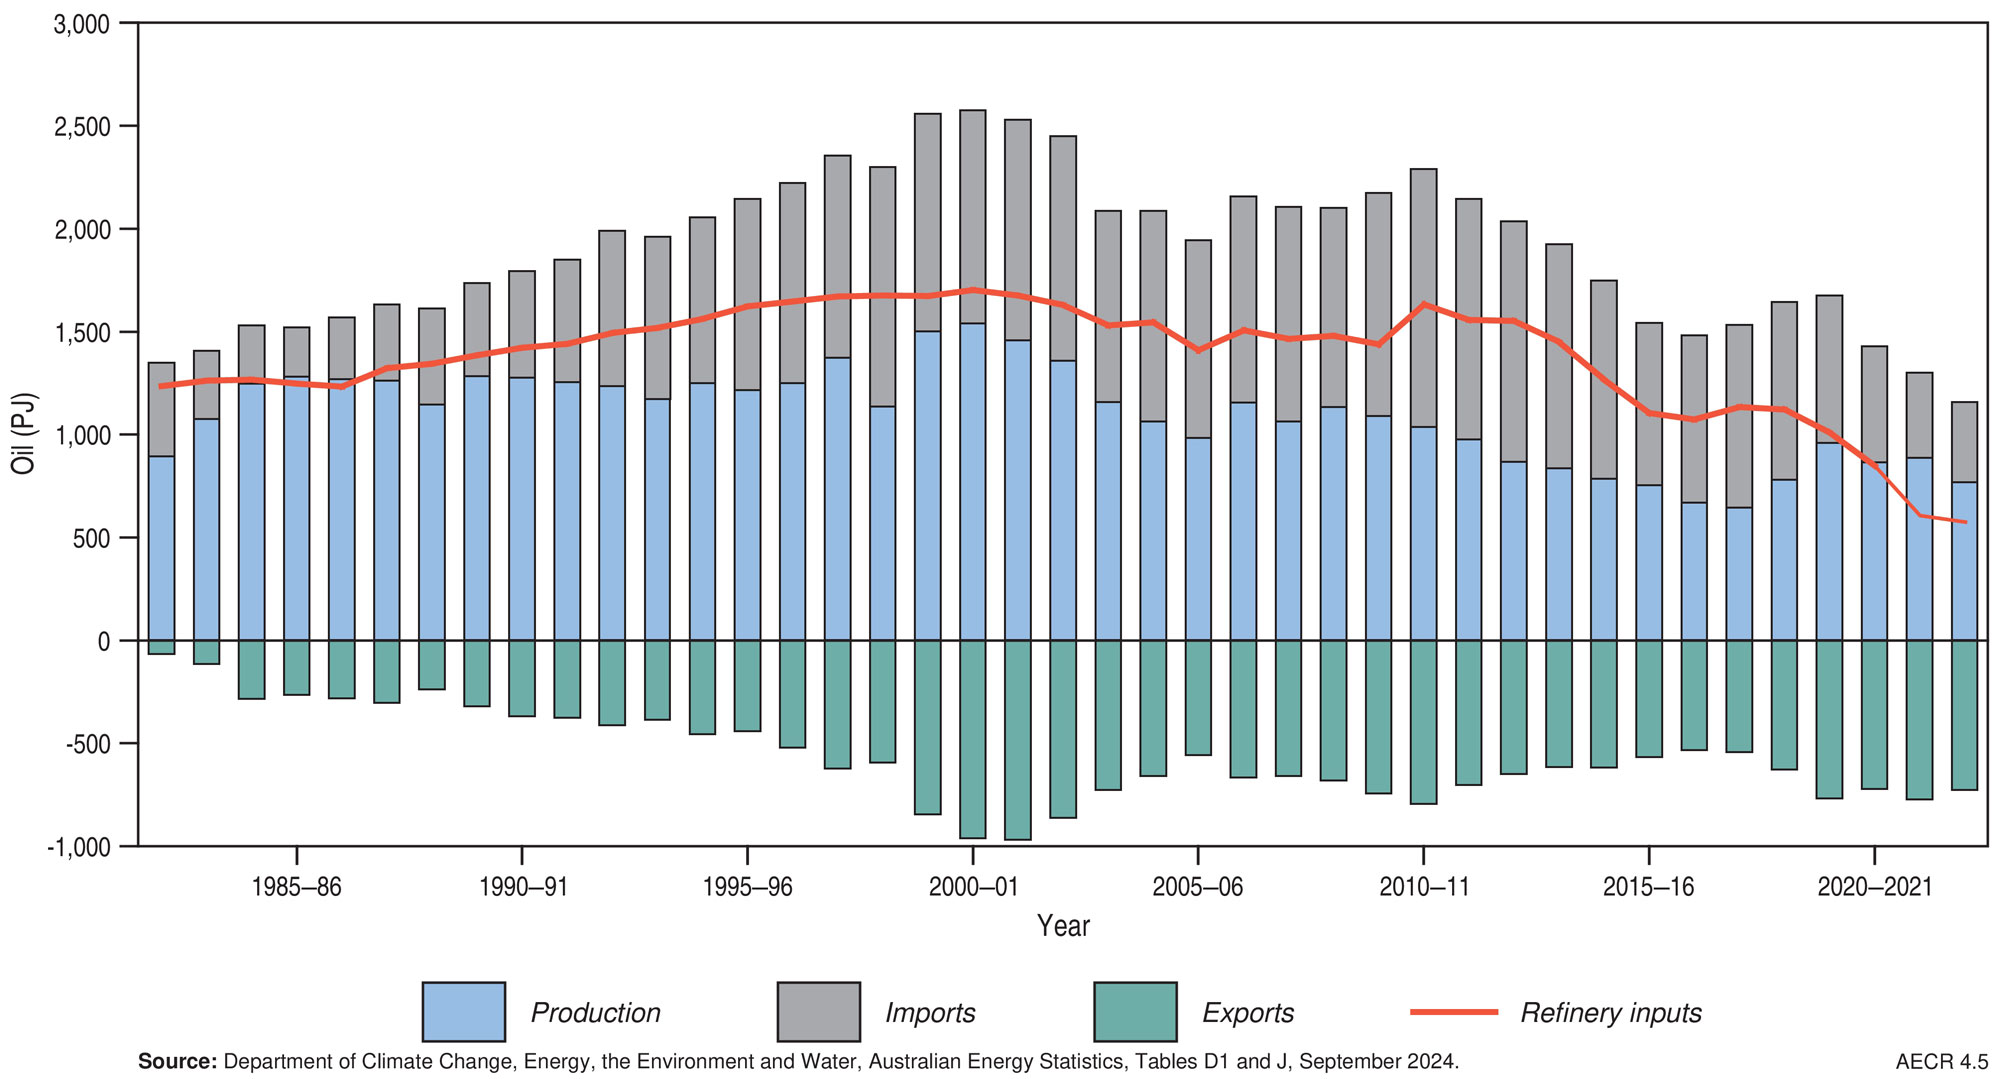
Figure 4.5. Trends in Australia’s oil balance, 1982-83 to 2022-23.
The majority of Australia’s energy imports are represented by refined petroleum products (including LPG) and crude oil (Figure 4.6). In 2022-23, crude oil imports fell by 6% to 362 PJ and output from Australia’s two remaining domestic refineries was also down due to maintenance, outages and supply disruptions. Imports of refined products and LPG rose by 17% to a record 1,846 PJ, in part to replace declining supply from domestic refineries (DCCEEW, 2024).
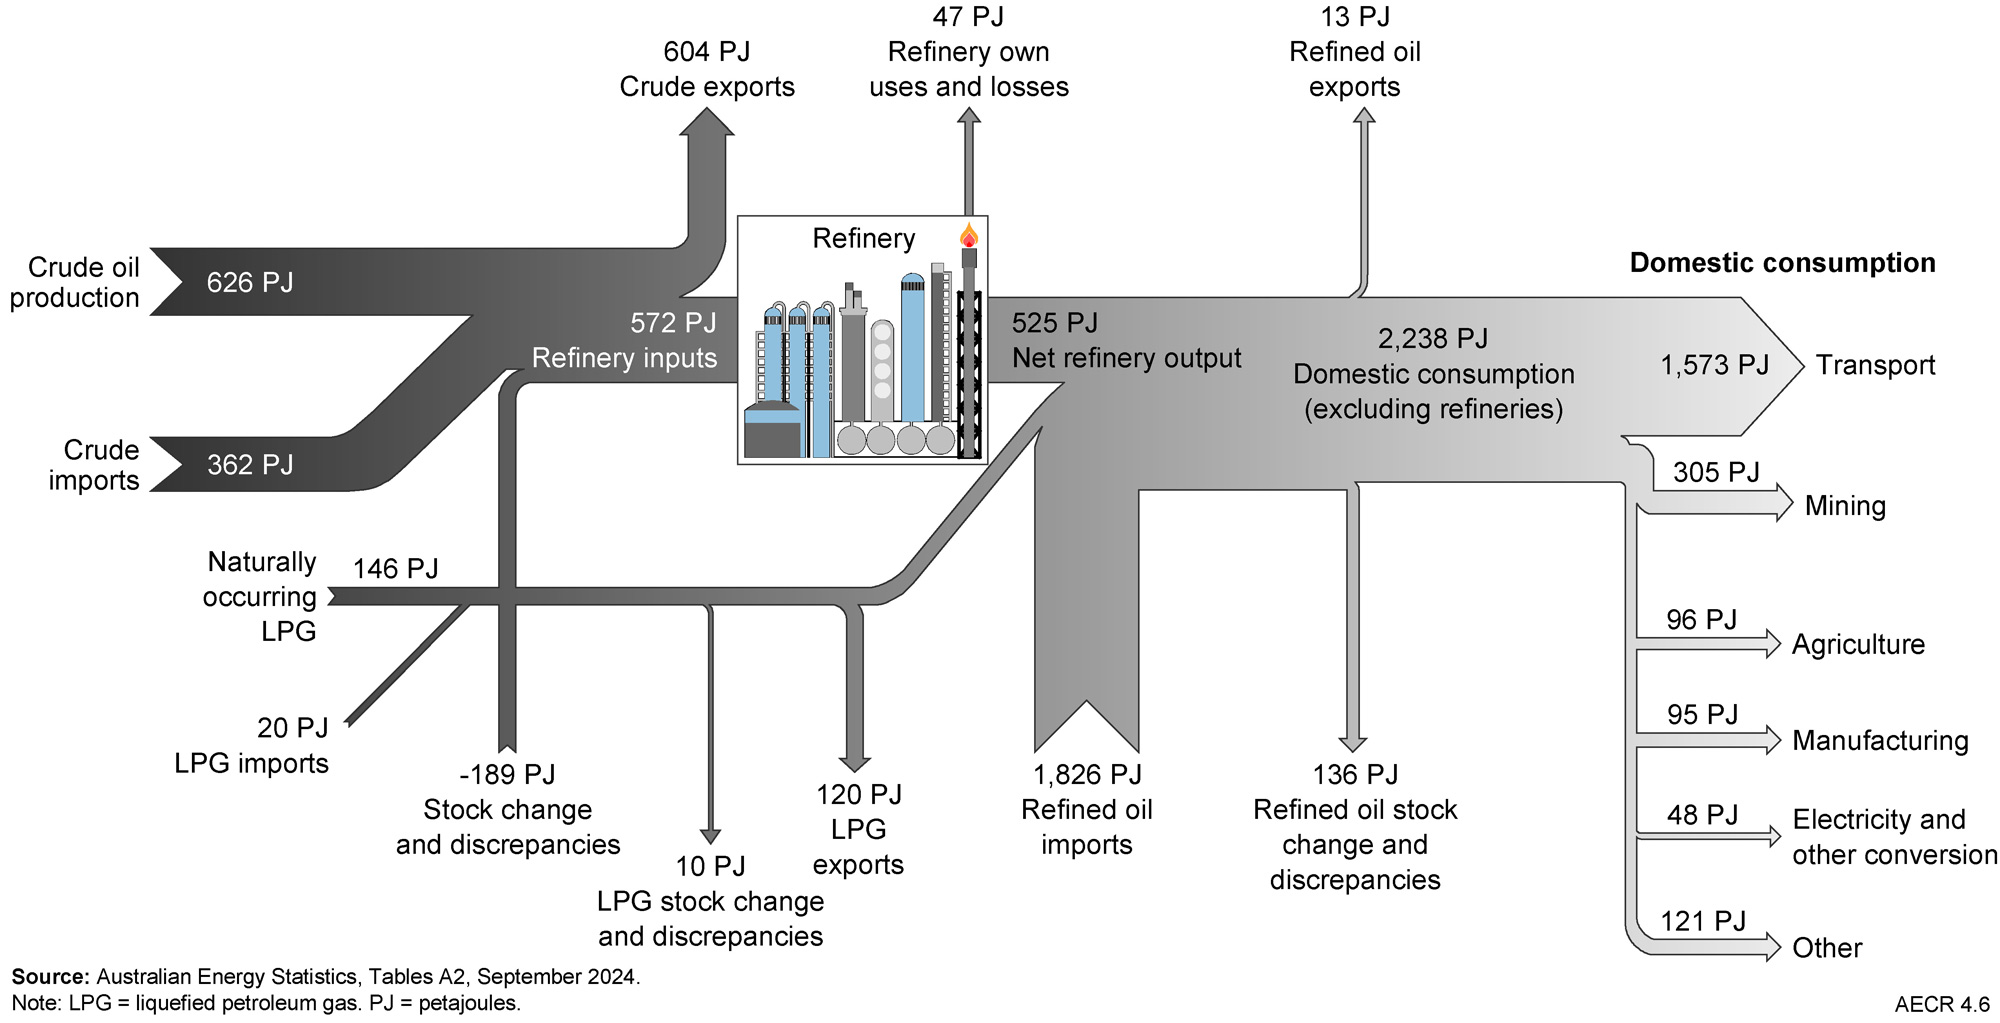
Figure 4.6 Australia’s oil flows, 2022-23
References
DCCEEW (Department of Climate Change, Energy, the Environment and Water), 2024. Australian Energy Update 2024.
DISR (Department of Industry, Science and Resources), 2024. Resources and Energy Quarterly, March 2024.
Energy Institute, 2024. Statistical Review of World Energy. (last accessed July 2025).
Note: refer to Appendix 4 for references regarding onshore oil reserves, contingent resources and production data
Data download
Data tables and full report are downloadable from the Geoscience Australia website.
1 Note that this total is an underestimate as LPG production data for the Bonaparte/Browse and Northern Carnarvon/Roebuck basin areas are not available as these are not reported in the offshore NOPTA data.