
Australia’s Estimated Ore Reserves
As part of the Australian Government’s annual assessment of the national minerals inventory, Geoscience Australia compiles all known estimates of Ore Reserves and Mineral Resources reported publicly by mining companies in compliance with the Joint Ore Reserves Committee (JORC) Code, or JORC-equivalent codes. In addition, reserve and resource estimates from private companies and foreign companies operating in Australia are also included in the annual compilation wherever possible.
Determining how much of a particular mineral commodity is in the ground and how much is extractable is not an exact science, hence Ore Reserves and Mineral Resources are always referred to as estimates, never calculations. Ore Reserves and Mineral Resources are categorised by confidence in both the geology of the deposit and the economic viability of production. Of all the different categories under the JORC Code (see Appendix 1), an Ore Reserve is the category of highest confidence. From a commercial point of view, this category is the most applicable to understanding the state of Australia’s minerals industry now and in the near future (say, the next five years).
Geoscience Australia began publishing amalgamated national totals for Ore Reserves in 2002. Prior to this, these estimates were included within the national inventory of EDR (and continue to be included) but were not specifically noted.
The JORC Code
In December 2020, the Australian Securities Exchange (ASX) listed 2,200 companies. Of these, approximately 40% were categorised as belonging to the energy and materials sectors, which includes mining and exploration companies. Recognising that confidence in such a large part of the Australian economy is paramount, the Joint Ore Reserves Committee (JORC) of The Australasian Institute of Mining and Metallurgy, the Australian Institute of Geoscientists and the Minerals Council of Australia have developed the JORC Code for reporting exploration results and estimates of Mineral Resources and Ore Reserves to the public.
The JORC Code has been adopted by the ASX as part of its listing rules and its use is mandatory for all mining companies listed on the ASX and New Zealand Stock Exchange. Variations of the JORC Code have been adopted in many other parts of the world and the code is compatible with the international CRIRSCO10 and United Nations Framework Classification for Resources templates.
In commencing the most recent periodic review of the JORC Code, the Committee noted that while the key focus of the Code remains to provide principles-based disclosure transparency, there are a number of areas where industry, regulator and public expectations have evolved since the last update in 201211. In July 2021, the Committee released its JORC Summary Paper of Key Issues and Work Plan in which it noted the strong support to update the Competent Person framework and to address environmental, social and governance (ESG) considerations in the JORC Code where appropriate12.
Operating mines
In 2020, Australia had over 300 operating mines producing 26 major and minor mineral commodities. In addition, there were a large number of excavations for a range of industrial materials and gemstones (not covered in this publication). In determining the outlook for the industry in Australia, it is useful to look at the Ore Reserves and Mineral Resources associated with operating mines (Table 1) as it is usually easier and cheaper to expand current mines than to start new ones. While some of the mines that operated in 2020 have since closed or been placed on care and maintenance, subject to favourable economic, environmental and regulatory conditions, most will continue mining for the foreseeable future.
One way of gaining an impression of future viability of a mine or resource is to calculate the ratio of reserves or resources to production, thus establishing a reserve or resource ‘life’ (Table 1). The resulting reserve and resource life must be treated with caution as it is an average and it assumes three things: (1) that production rates in the future will remain the same as those used in the calculation, (2) deposits deemed economic/uneconomic remain so in the future and (3) that depleted resources are never replaced. In reality, production rates vary from year to year, mining companies continually reassess the economic viability of their deposits and companies typically do upgrade resources or discover new resources to replace ore depletion. Nonetheless, this ratio provides a potentially useful ‘snapshot in time’ that can help reveal trends in Australia’s ability to supply a range of mineral resources into the future.
Ore Reserves at other mines and deposits
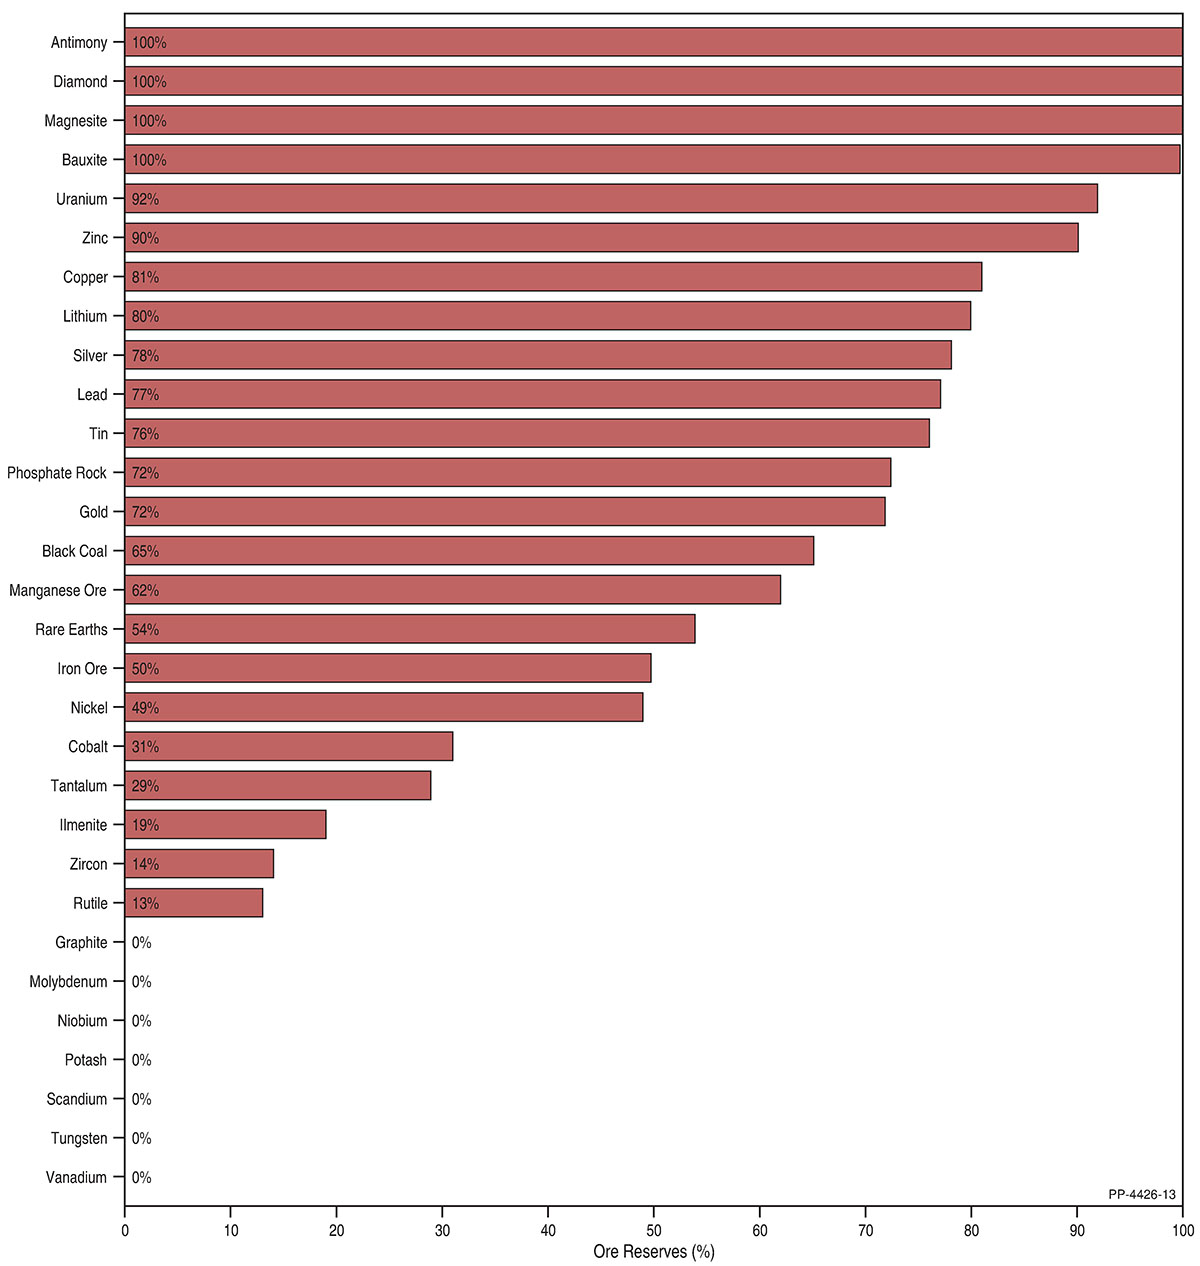
Australia’s Identified Mineral Resources covers 35 mineral commodities, of which 30 have estimated Ore Reserves and 26 were actually in production in 2020 (Table 2). For some commodities (e.g. antimony, bauxite and magnesite) the majority of Ore Reserves are associated with operating mines (Figure 1). For most commodities (e.g. lithium, black coal and rare earths), Ore Reserves are also attributable to mines on care and maintenance, mines under development and, in some cases, undeveloped deposits. Australia’s graphite, potash and scandium sectors, for example, did not have operating mines in 2020 so Ore Reserves are predominantly attributable to developing mines.
Table 1. Australia's Ore Reserves and Mineral Resources of selected commodities at operating mines in 2020.
| Commodity | Unit | No. of Operating Mines1 | Ore Reserves2 | Measured and Indicated Mineral Resources3 | Inferred Mineral Resources4 | Mine Production5 | Reserve Life (years) | Resource Life 1 (years) | Resource Life 2 (years) |
|---|---|---|---|---|---|---|---|---|---|
| Antimony | kt Sb | 1 | 21.8 | 39.7 | 6.1 | 3.96 | 6 | 10 | 12 |
| Bauxite | Mt | 9 | 1,732 | 1,716 | 3,646 | 103.6 | 17 | 17 | 52 |
| Black Coal | Mt | 91 | 11,491 | 27,1157 | 14,772 | 5428 | 21 | 50 | 77 |
| Copper | Mt Cu | 38 | 18.94 | 80.82 | 27.08 | 0.88 | 22 | 92 | 123 |
| Diamond | Mc | 1 | 10.30 | 10.97 | 20.3 | 9.98 | 1 | 0 | 0 |
| Gold | t Au | 164 | 3,046 | 8,387 | 2,860 | 328 | 9 | 26 | 34 |
| Iron Ore | Mt | 45 | 11,461 | 27,440 | 40,102 | 922 | 12 | 30 | 73 |
| Lead | Mt Pb | 19 | 8.92 | 27.41 | 8.65 | 0.49 | 18 | 56 | 74 |
| Lithium | kt Li | 5 | 3,040 | 3,947 | 933 | 409 | 76 | 99 | 122 |
| Manganese Ore | Mt | 3 | 83 | 188 | 17 | 4.810 | 17 | 39 | 43 |
| Mineral Sands | |||||||||
| Ilmenite | Mt | 11 | 11.9 | 41.4 | 8.3 | 1.1 | 10 | 36 | 43 |
| Rutile | Mt | 8 | 1.3 | 3.6 | 0.8 | 0.2 | 8 | 23 | 28 |
| Zircon | Mt | 10 | 3.4 | 10.3 | 1.8 | 0.4 | 9 | 28 | 33 |
| Nickel | Mt Ni | 13 | 4.7 | 8.4 | 2.8 | 0.17 | 28 | 49 | 66 |
| Rare Earths11 | Mt oxide | 2 | 1.6 | 2 | 1.38 | 0.02012 | 80 | 100 | 169 |
| Silver13 | kt Ag | 31 | 21.29 | 68.56 | 21.50 | 1.34 | 16 | 51 | 67 |
| Tin | kt Sn | 1 | 228 | 373 | 37 | 8.114 | 28 | 46 | 51 |
| Uranium | kt U | 3 | 237 | 1,007 | 379 | 6.195 | 38 | 163 | 224 |
| Zinc | Mt Zn | 20 | 20.78 | 55.30 | 21.60 | 1.31 | 16 | 42 | 59 |
Abbreviations
t = tonne; kt = kilotonne (1,000 t); Mt = million tonne (1,000,000 t); Mc = million carat (1,000,000 carats).
Where an element symbol follows the unit it refers to contained metal content.
Notes
Reserve Life = Ore Reserves ÷ Production.
Resource Life 1 = Measured and Indicated Resources ÷ Production.
Resource Life 2 = Measured, Indicated and Inferred Resources ÷ Production.
1. The number of operating mines counts individual mines that operated during 2020 and thus contributed to production. Some of these mines may belong to larger, multi-mine operations and some may have closed during or since 2020.
2. The majority of Australian Ore Reserves and Mineral Resources are reported in compliance with the JORC Code, however there are a number of companies that report to foreign stock exchanges using other reporting codes, which are largely equivalent. In addition, Geoscience Australia may hold confidential information for some commodities. NB: Not all operating mines report Ore Reserves. Ore Reserves are as at 31 December 2020.
3. Measured and Indicated Mineral Resources are inclusive of the Ore Reserves. NB: Not all operating mines report Mineral Resources. Mineral Resources are as at 31 December 2020.
4. Inferred Mineral Resources are as at 31 December 2020. NB: Not all operating mines report Mineral Resources.
5. Mining production from Resources and Energy Quarterly, December 2021, published by the Office of the Chief Economist, Department of Industry, Innovation and Science unless otherwise stated. Production data often have a higher level of certainty than reserve and resource estimates and, thus, may be presented with more significant figures.
6. Antimony production from company reports (Mandalay Resources Ltd).
7. Measured, Indicated and Inferred Mineral Resources for black coal are presented on a recoverable basis (these are Geoscience Australia estimates unless provided by the company).
8. Mine production refers to raw coal.
9. Lithium production data (tonnes of spodumene concentrates) from Department of Mines, Industry Regulation and Safety, Western Australian Government, 2020 Major commodities resources file. Production of lithium calculated assuming 6% Li2O in spodumene concentrates.
10. Australian manganese production from company reports and total reported production from Department of Mines, Industry Regulation and Safety, Western Australian Government, 2020 Major commodities resources file.
11. Rare earths comprise rare earth oxides (REO) and yttrium oxide (Y2O3).
12. Rare earths production is based on Western Australian production of concentrates from Mount Weld (14,564 t) and from 44,000 t of zircon - monazite concetrate produced at Eneabba. Assuming 20% of concetrate is monazite and 60% of monazite is REO (5,280 t).
13. Major silver producing mines only; many gold and copper mines also produce silver as a by-product but these are not counted here.
14. The Office of the Chief Economist reports tin production of 8.1 kt in 2020. Renison, Australia’s only significant tin mine, reports 7.5 kt. Additional production is as by-product from other operations such as Greenbushes.
Table 2. Australia's Estimated Ore Reserves1 as at December 2020.
| Commodity | Unit | Proved Ore Reserves | Probable Ore Reserves | Proved & Probable Ore Reserves2 | Total Ore Reserves | Mine Production3 | Reserve Life |
|---|---|---|---|---|---|---|---|
| Antimony | kt Sb | 12.7 | 9.1 | 0 | 21.8 | 3.94 | 6 |
| Bauxite | Mt | 794 | 945 | 0 | 1,739 | 103.6 | 17 |
| Black Coal | Mt | 7,302 | 8,517 | 1,738 | 17,557 | 5425 | 32 |
| Brown Coal | Mt | n.a. | n.a. | n.a. | n.a | 41.56 | n.a. |
| Chromium | kt Cr | 0 | 0 | 0 | 0 | 0 | 0 |
| Cobalt | kt Co | 213 | 459 | 2 | 674 | 5.67 | 120 |
| Copper | Mt Cu | 7.00 | 16.30 | 0.05 | 23.35 | 0.88 | 27 |
| Diamond | Mc | 0 | 10.30 | 10.3 | 10.30 | 9.98 | 1 |
| Fluorine | kt F | 0 | 0 | 0 | 0 | 0 | 0 |
| Gold | t Au | 938 | 3,230 | 61 | 4,229 | 328 | 13 |
| Graphite | Mt | 1.42 | 3.58 | 0 | 5.00 | 0 | 0 |
| Iron | |||||||
| Iron ore | Mt | 7,710 | 15,291 | 0 | 23,001 | 922 | 25 |
| Contained iron | Mt Fe | 3,725 | 6,875 | 0 | 10,600 | 571 | 19 |
| Lead | Mt Pb | 6.95 | 4.64 | 0 | 11.59 | 0.49 | 24 |
| Lithium | kt Li | 555 | 3,222 | 0 | 3,777 | 408 | 94 |
| Magnesite | Mt MgCO3 | 10 | 3 | 24 | 37 | 0.89 | 46 |
| Manganese Ore | Mt | 58 | 60 | 17 | 135 | 4.810 | 28 |
| Mineral Sands | |||||||
| Ilmenite | Mt | 27.1 | 34.4 | 0 | 61.5 | 1.111 | 56 |
| Rutile | Mt | 5.1 | 4.6 | 0 | 9.7 | 0.211 | 49 |
| Zircon | Mt | 11.3 | 13 | 0 | 24.3 | 0.411 | 61 |
| Molybdenum | kt Mo | 0 | 4 | 0 | 4 | 0 | 0 |
| Nickel | Mt Ni | 3.4 | 6.1 | <1 | 9.5 | 0.17 | 56 |
| Niobium | kt Nb | 58 | 0 | 0 | 58 | n.a.12 | n.a. |
| PGE | t metal | 0 | 0 | 0 | 0 | 0.52213 | n.a. |
| Phosphate | |||||||
| Phosphate rock14 | Mt | 15 | 28 | 81 | 124 | 1.315 | 95 |
| Contained P2O5 | Mt P2O5 | 4 | 9 | 20 | 33 | n.a. | n.a. |
| Potash | Mt K2O | 2.9 | 17.8 | 0 | 20.7 | 0 | n.a. |
| Rare Earths16 | Mt oxide | 1.63 | 1.35 | 0 | 2.98 | 0.02017 | 149 |
| Scandium | kt Sc | 6.02 | 5.63 | 0 | 11.65 | 0 | n.a. |
| Silver | kt Ag | 15.29 | 11.94 | 0 | 27.23 | 1.34 | 20 |
| Tantalum | kt Ta | 6.8 | 32.2 | 0 | 39.0 | 0.118 | 361 |
| Thorium | kt Th | 0 | 0 | 0 | 0 | 0 | 0 |
| Tin | kt Sn | 37 | 166 | 98 | 301 | 8.1 | 37 |
| Tungsten | kt W | 21 | 209 | 0 | 230 | <119 | 440 |
| Uranium | kt U | 123 | 132 | 0 | 255 | 6.195 | 41 |
| Vanadium | kt V | 708 | 981 | 0 | 1,689 | 0 | n.a. |
| Zinc | Mt Zn | 14.23 | 9.00 | 23 | 23.20 | 1.31 | 18 |
Abbreviations
t = tonne; kt = kilotonnes (1,000 t); Mt = million tonnes (1,000,000 t); Mc = million carats (1,000,000 carats); GL = gigalitre (1,000,000,000 L); n.a. = not available; PGE = platinum group elements (platinum, palladium, osmium, iridium, ruthenium, rhodium).
Where an element symbol follows the unit it refers to contained metal content.
Notes
Reserve Life = Ore Reserves ÷ Production.
Figures are rounded so Proved, Probable and Proven & Probable Ore Reserves may not add up to Total Ore Reserves exactly.
1. The majority of Australian Ore Reserves are reported in compliance with the JORC Code, however there are a number of companies that report to foreign stock exchanges using other reporting codes, which are largely equivalent. In addition, Geoscience Australia may hold confidential information for some commodities.
2. 'Proven & Probable Ore Reserves' is a distinct reporting category that is no longer supported by the JORC Code. Some overseas reporting codes still use this category and some historical resources fall into this category.
3. Mining production from Resources and Energy Quarterly, December 2021 published by the Office of the Chief Economist, Department of Industry, Innovation and Science unless otherwise stated. Production data often have a higher level of certainty than reserve and resource estimates and, thus, may be presented with more significant figures.
4. Antimony production from company reports (Mandalay Resources Ltd).
5. Black coal production refers to raw coal.
6. Australian production of brown coal is a Geoscience Australia estimate from supplied International Energy Agency data.
7. Cobalt production data from Department of Mines, Industry Regulation and Safety, Western Australian Government, 2020 Major commodities resources file.
8. Lithium production data (tonnes of spodumene concentrates) from Department of Mines, Industry Regulation and Safety, Western Australian Government, 2020 Major commodities resources file. Production of Lithium calculated assuming 6% Li2O in spodumene concentrates.
9. The Department of State Development, South Australia (Report Book 2020/00010) reported magnesite production of 5,931 t in 2020.The Queensland Department of Natural Resources and Mines (Queensland Annual Mineral Summary 2019–20 reported magnesite production of 793,272 t in 2019–20.
10. Australian manganese production from company reports and total reported production from Department of Mines, Industry Regulation and Safety, Western Australian Government, 2020 Major commodities resources file.
11. Minerals sands production from company reports.
12. There are no mines producing niobium as a primary product in Australia but it is likely produced as a by-product at some lithium/tantalum operations, but these data have not been reported.
13. Platinum and palladium production data from Department of Mines, Industry Regulation and Safety, Western Australian Government, 2020 Major commodities resources file.
14. Phosphate rock is reported as being economic at grades ranging from 8.7% to 30.2% P2O5.
15. Geoscience Australia estimate based on reported mining production from Christmas Island – 353,186 t in 2020, South Australia – 2,284 t in 2020 (South Australia Department for Energy and Mining, Report Book 2021/00008) and Queensland – 933,248 t in 2019–20 (Queensland Department of Natural Resources and Mines, Queensland Annual Mineral Summary 2019–20).
16. Rare earths comprise rare earth oxides (REO) and yttrium oxide (Y2O3).
17. Rare earths production is based on Western Australian production of concentrates from Mount Weld (14,564 t) and from 44,000 t of zircon - monazite concentrate produced at Eneabba. Assuming 20% of concentrate is monazite and 60% of monazite is REO (5,280 t).
18. Tantalum production data from Department of Mines, Industry Regulation and Safety, Western Australian Government, 2020 Major commodities resources file. Production represents a maximum as no correction has been made for actual tantalite concentration in reported concentrates.
19. Tungsten production from company correspondence (Tasmania Mines Pty Ltd) and company reports.
10 CRIRSCO is the Committee for Mineral Reserves International Reporting Standards.
11 Australian Institute of Geoscientists. JORC Code Update.
12 Australasian Joint Ore Reserves Committee, JORC Summary Paper of Key Issues and Work Plan.