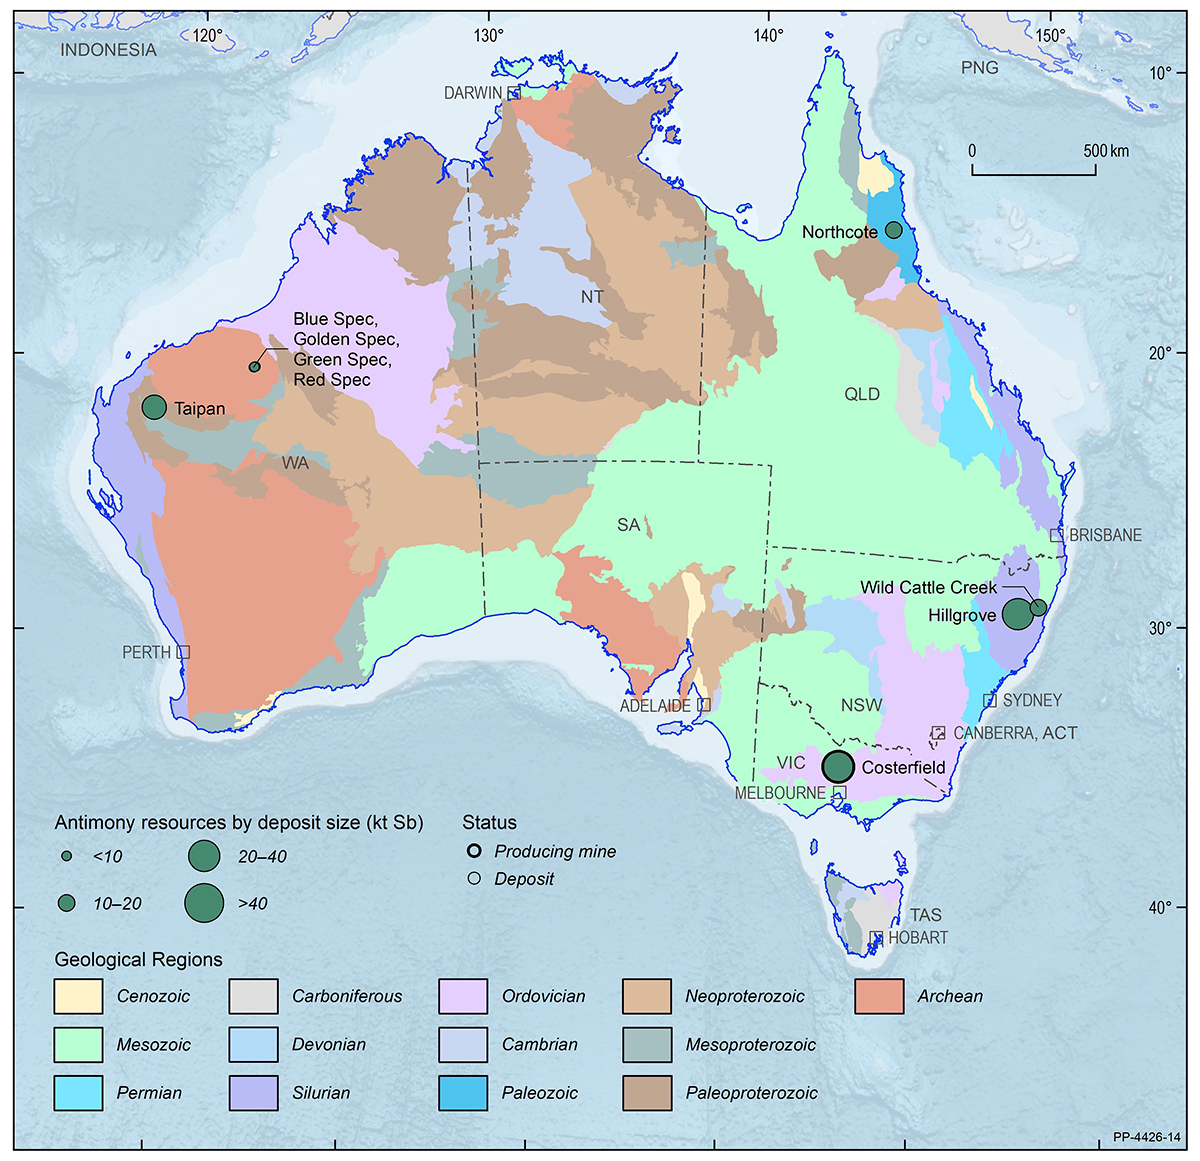
Antimony
| Critical Mineral | |
| EDR 125.2 kt Sb ( 24%) |
|
| Ore Reserves 21.8 kt Sb ( 27%) |
|
| Operating Mines 1 |
|
| Production 3.9 kt Sb ( 92%) |
|
| Export Income n.a. |
| World Ranking | |
| Resources 5 (7%) |
|
| Production 5 (1%) |
Major Uses:
Metal alloys, fire retardants, lead batteries, manufacturing solder, sheet and pipe metal, ammunition, bearings, castings and pewter.
Abbreviations
kt Sb – kilotonnes of antimony content; n.a. – not available.
Notes
Resource figures are as at 31 December 2020. Operating mines and production are for calendar year 2020. Percentage increases or decreases are in relation to 2019. World rankings are followed by percentage share in brackets.
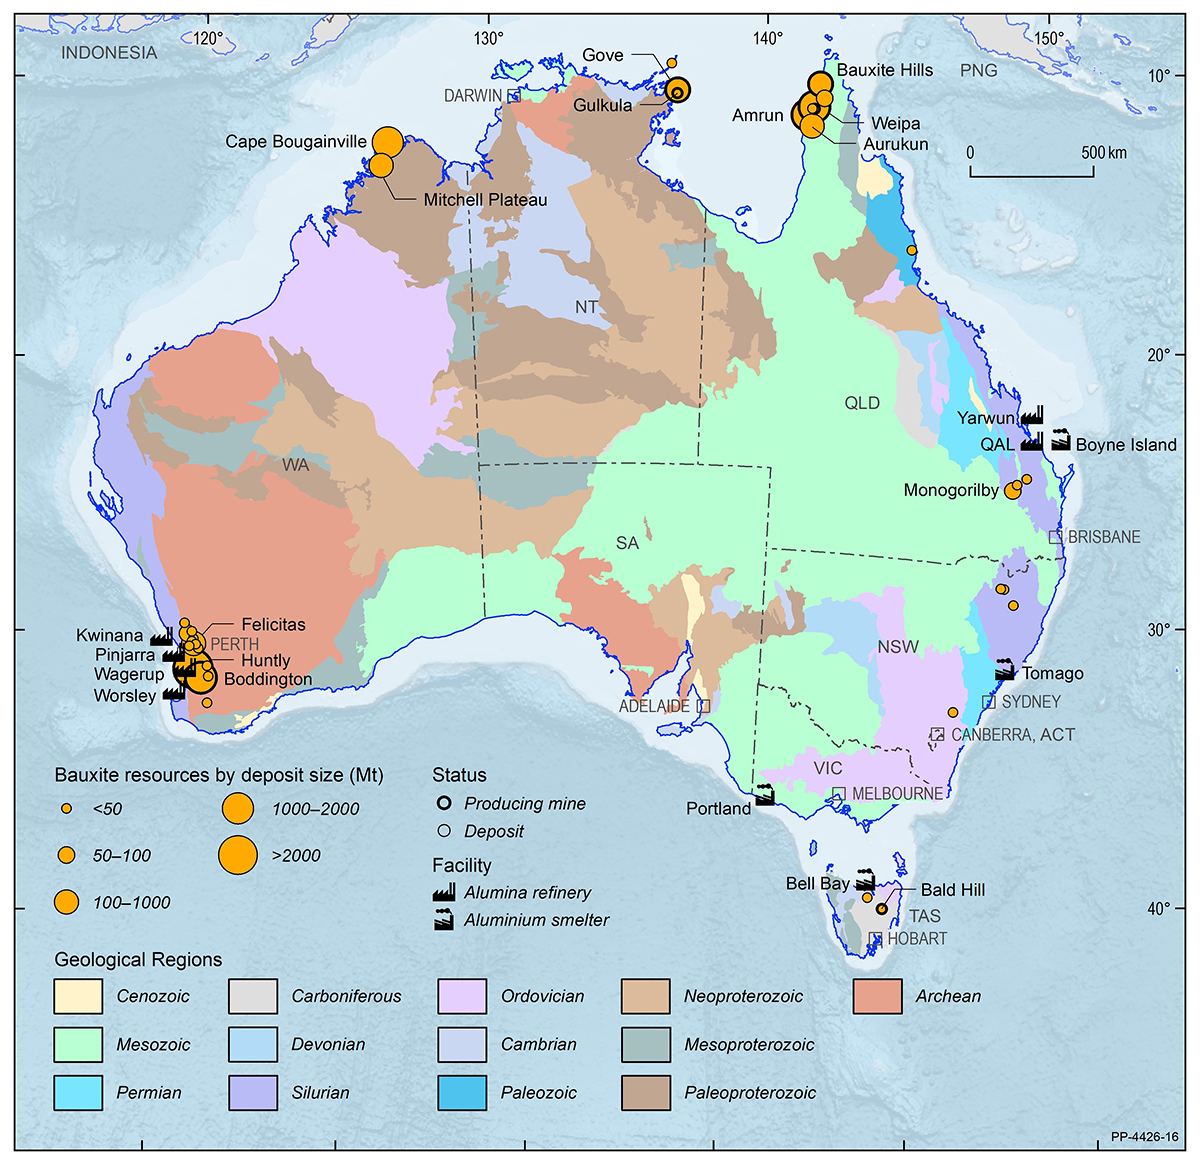
Bauxite
| EDR 5,132 Mt ( -3%) |
|
| Ore Reserves 1,739 Mt ( -15%) |
| Operating Mines 9 |
|
| Production 103.6 Mt ( -2%) |
|
| Export Income $12,046 m ( -14%) |
| World Ranking | |
| Resources 2 (17%) |
|
| Production 1 (28%) |
Major Uses:
Production of aluminium metal for use in buildings, aeronautics, electric vehicles, whitegoods, power lines, food storage and renewable energy technologies.
Abbreviations
Mt – million tonnes; $m – million dollars (Australian).
Notes
Resource figures are as at 31 December 2020. Operating mines and production are for calendar year 2020. Percentage increases or decreases are in relation to 2019. World rankings are followed by percentage share in brackets. Export income is the sum of bauxite, alumina and aluminum categories, sourced from Office of the Chief Economist, Resources and Energy Quarterly, December 2021.
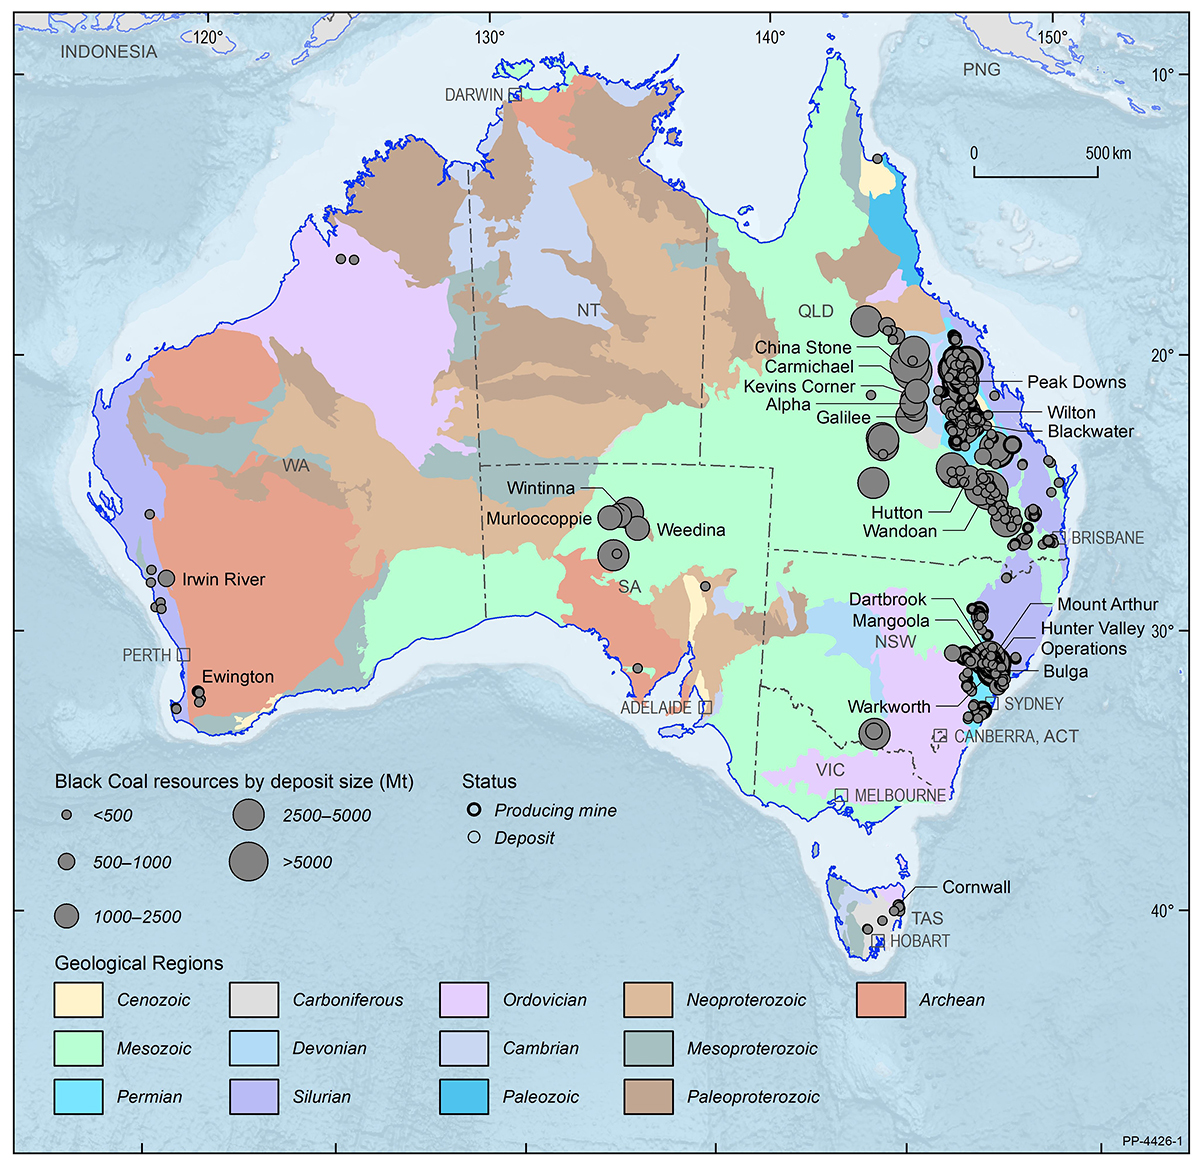
Black Coal
| EDR 87,645 Mt ( -2%) |
|
| Ore Reserves 17,557 Mt ( -10%) |
| Operating Mines 91 |
|
| Production 542 Mt ( -8%) |
|
| Export Income $43,368 m ( -32%) |
| World Ranking | |
| Resources 4 (10%) |
|
| Production 5 (7%) |
Major Uses:
Electricity generation, steel making.
Abbreviations
Mt – million tonnes; $m – million dollars (Australian).
Notes
Resource figures are as at 31 December 2020. Operating mines and production are for calendar year 2020. Percentage increases or decreases are in relation to 2019. World rankings are followed by percentage share in brackets. Export income is the sum of thermal and coking coal categories, sourced from Office of the Chief Economist, Resources and Energy Quarterly, December 2021.
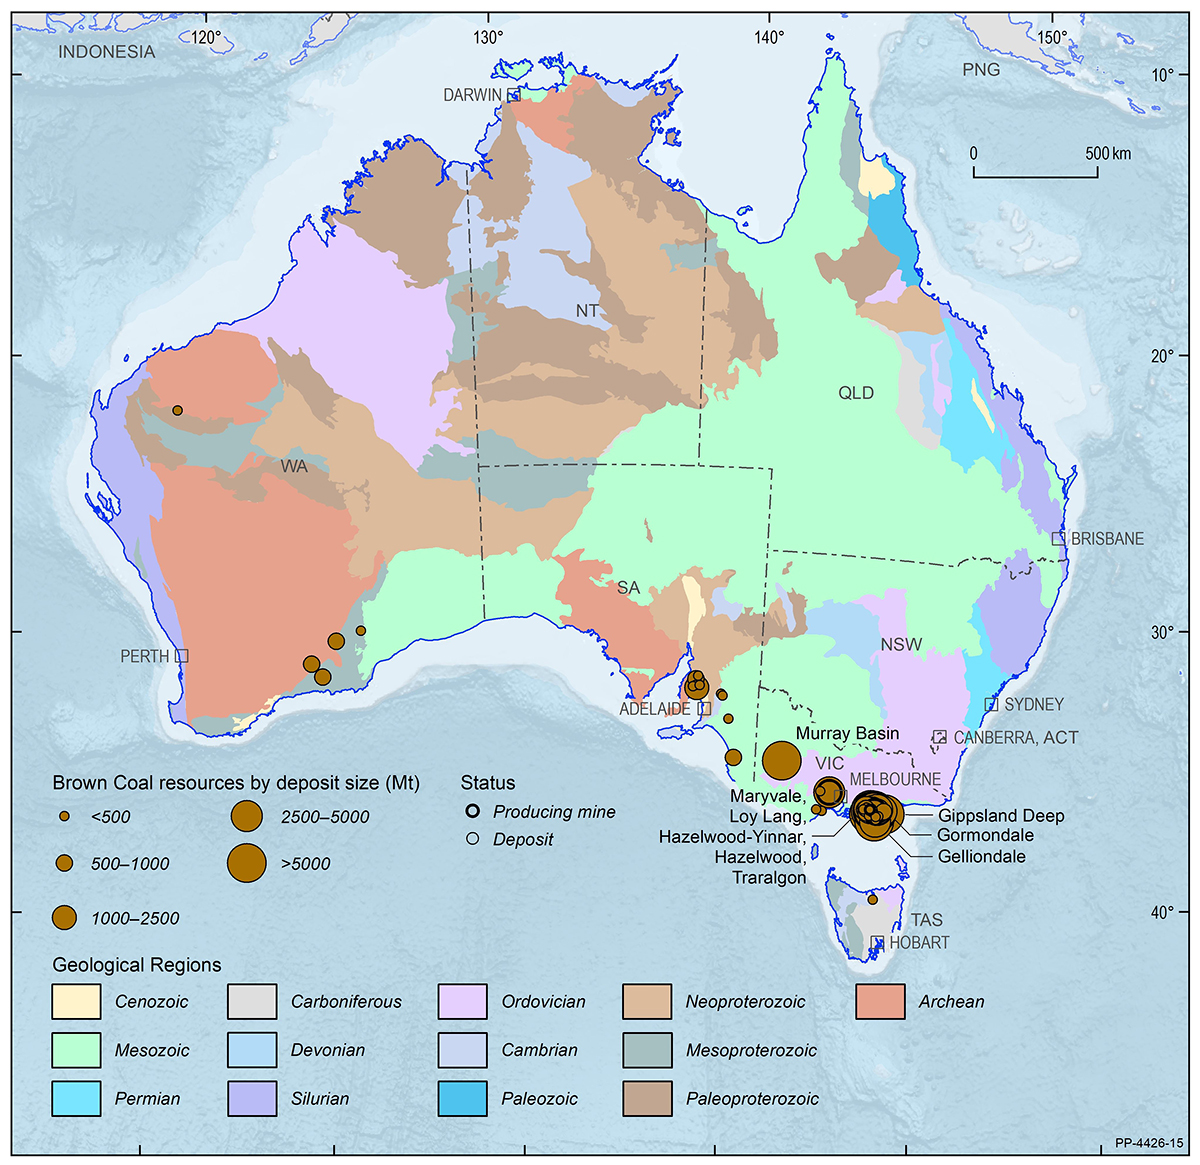
Brown Coal
| EDR 81,234 Mt ( -5%) |
|
| Ore Reserves n.a. |
| Operating Mines 3 |
|
| Production 41.5 Mt ( -3%) |
|
| Export Income $0 (0%) |
| World Ranking | |
| Resources 2 (23%) |
|
| Production 6 (7%) |
Major Uses:
Electricity generation, hydrogen generation.
Abbreviations
Mt – million tonnes; n.a. – not available
Notes
Resource figures are as at 31 December 2020. Operating mines and production are for calendar year 2020. Percentage increases or decreases are in relation to 2019. World rankings are followed by percentage share in brackets.
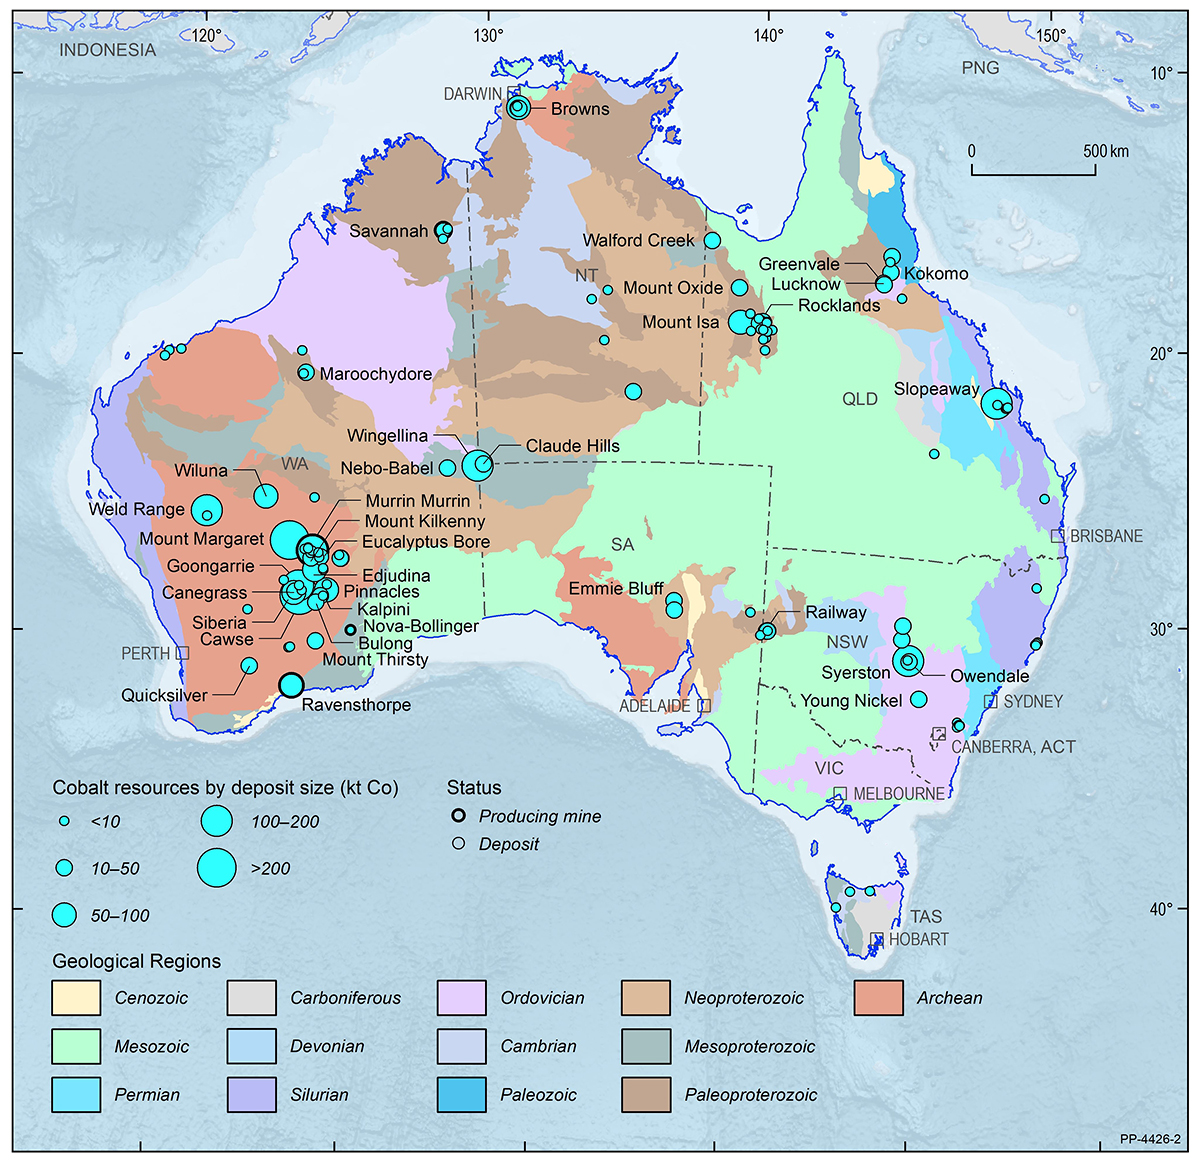
Cobalt
| Critical Mineral | |
| EDR 1,495 kt Co ( 7%) |
|
| Ore Reserves 674 kt Co ( 21%) |
|
| Operating Mines 4 |
|
| Production 5.6 kt Co ( -2%) |
|
| Export Income $269 m (3%) |
| World Ranking | |
| Resources 2 (21%) |
|
| Production 3 (4%) |
Major Uses:
Rechargeable battery electrodes in lithium-ion batteries, electric vehicles, superalloys, pigments, catalysts and magnets.
Abbreviations
kt Co – kilotonnes of cobalt content; $m – million dollars (Australian).
Notes
Resource figures are as at 31 December 2020. Operating mines and production are for calendar year 2020. Percentage increases or decreases are in relation to 2019. World rankings are followed by percentage share in brackets. Export income sourced from Department of Mines, Industry Regulation and Safety, Western Australian Government, 2020 Major commodities resources file.
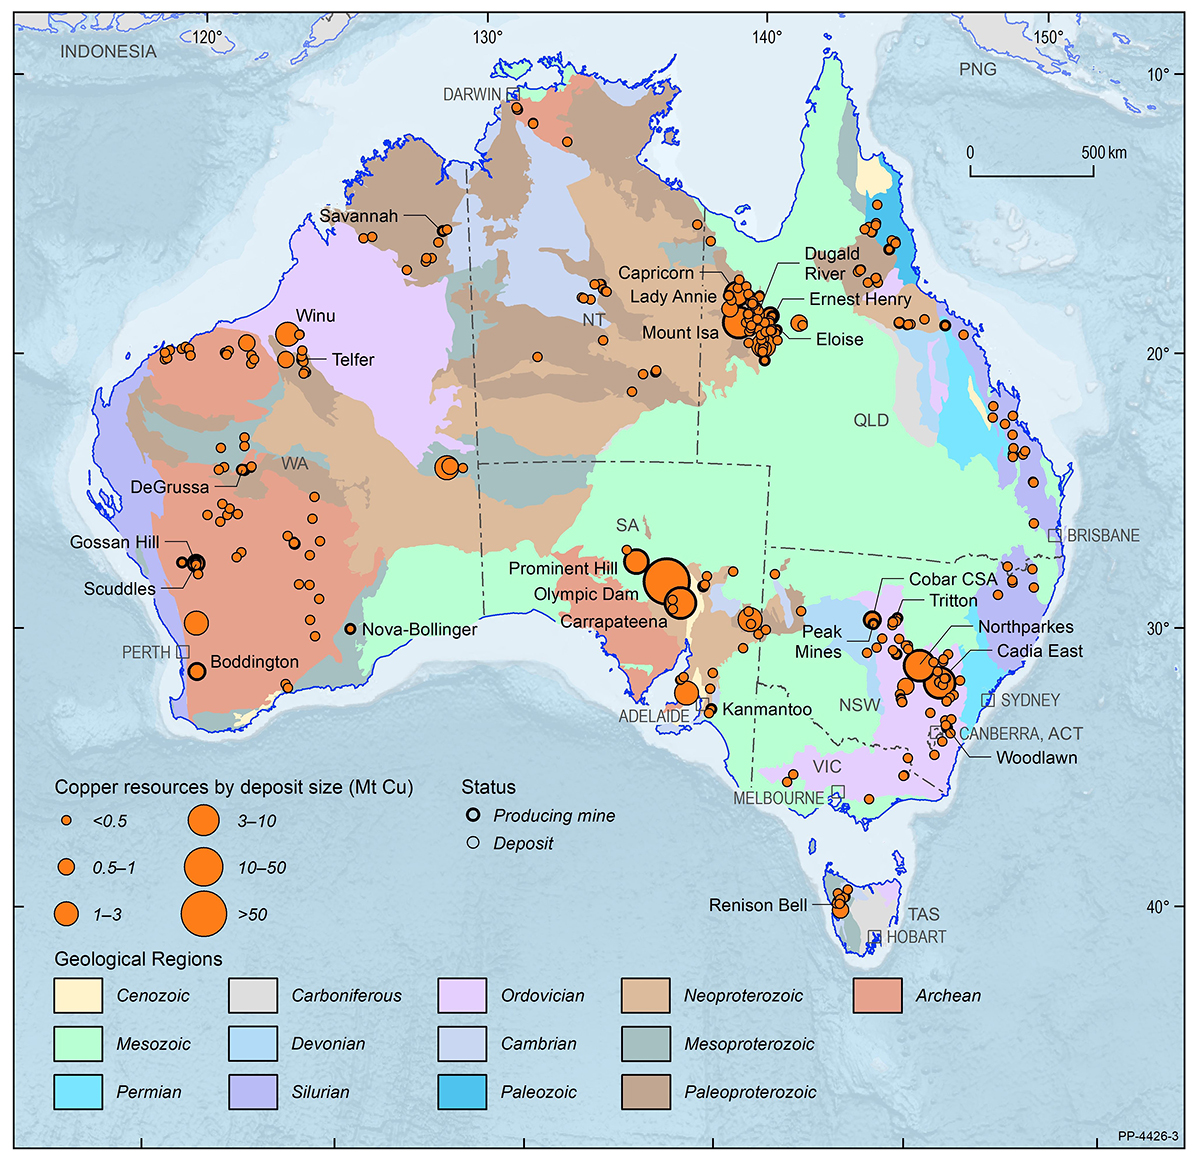
Copper
| EDR 96.65 Mt Cu ( 4%) |
|
| Ore Reserves 23.35 Mt Cu ( 2%) |
| Operating Mines 38 |
|
| Production 0.88 Mt Cu ( -5%) |
|
| Export Income $10,570 m ( 5%) |
| World Ranking | |
| Resources 2 (11%) |
|
| Production 6 (4%) |
Major Uses:
Electricity distribution, electrical equipment and devices, plumbing, industrial machinery, interior fixtures, wind turbines, solar panels, electromagnets and the transport industry including electric vehicles.
Abbreviations
Mt Cu – million tonnes of copper content; $m – million dollars (Australian).
Notes
Resource figures are as at 31 December 2020. Operating mines and production are for calendar year 2020. Percentage increases or decreases are in relation to 2019. World rankings are followed by percentage share in brackets. Export income is the sum of refined and ore/concentrate categories, sourced from Office of the Chief Economist, Resources and Energy Quarterly, December 2021.
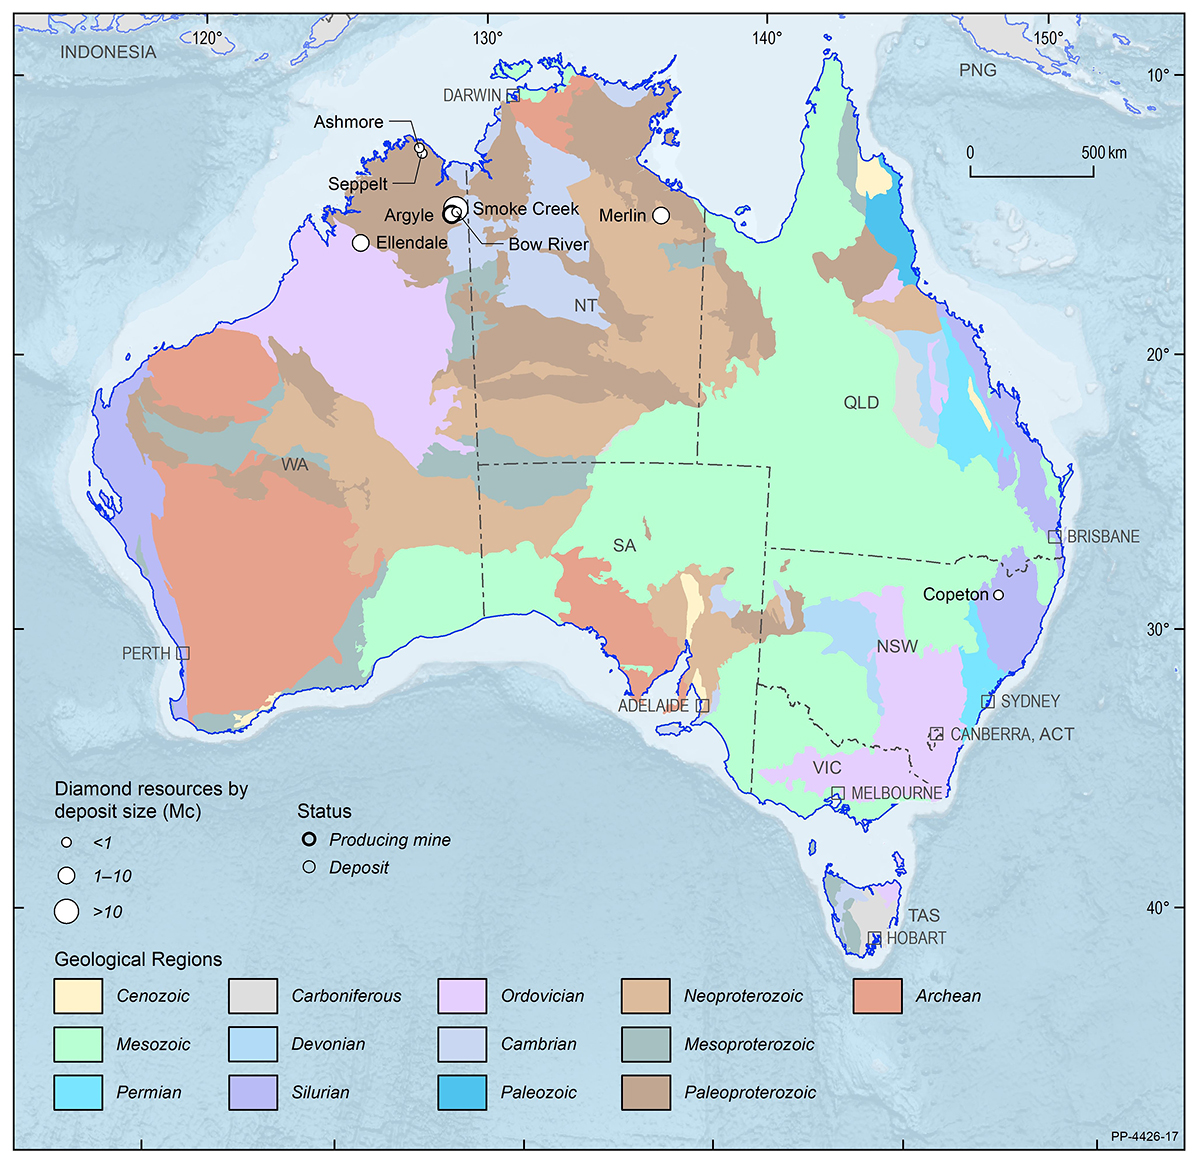
Diamond
| EDR 10.97 Mc (0%) |
|
| Ore Reserves 10.30 Mc (0%) |
| Operating Mines 1 |
|
| Production 9.98 Mc ( -23%) |
|
| Export Income $419 m ( -32%) |
| World Ranking | |
| Resources 5 (2%) |
|
| Production 3 (19%) |
Major Uses:
Jewellery, industrial cutting equipment, diamond machine tools, rock drilling bits, diamond polishing powders and compounds.
Abbreviations
Mc – million carats; $m – million dollars (Australian).
Notes
Resource figures are as at 31 December 2020. Operating mines and production are for calendar year 2020. Percentage increases or decreases are in relation to 2019. World rankings are followed by percentage share in brackets. Export income is the sum of unsorted and gem categories, sourced from Office of the Chief Economist, Resources and Energy Quarterly, December 2021.
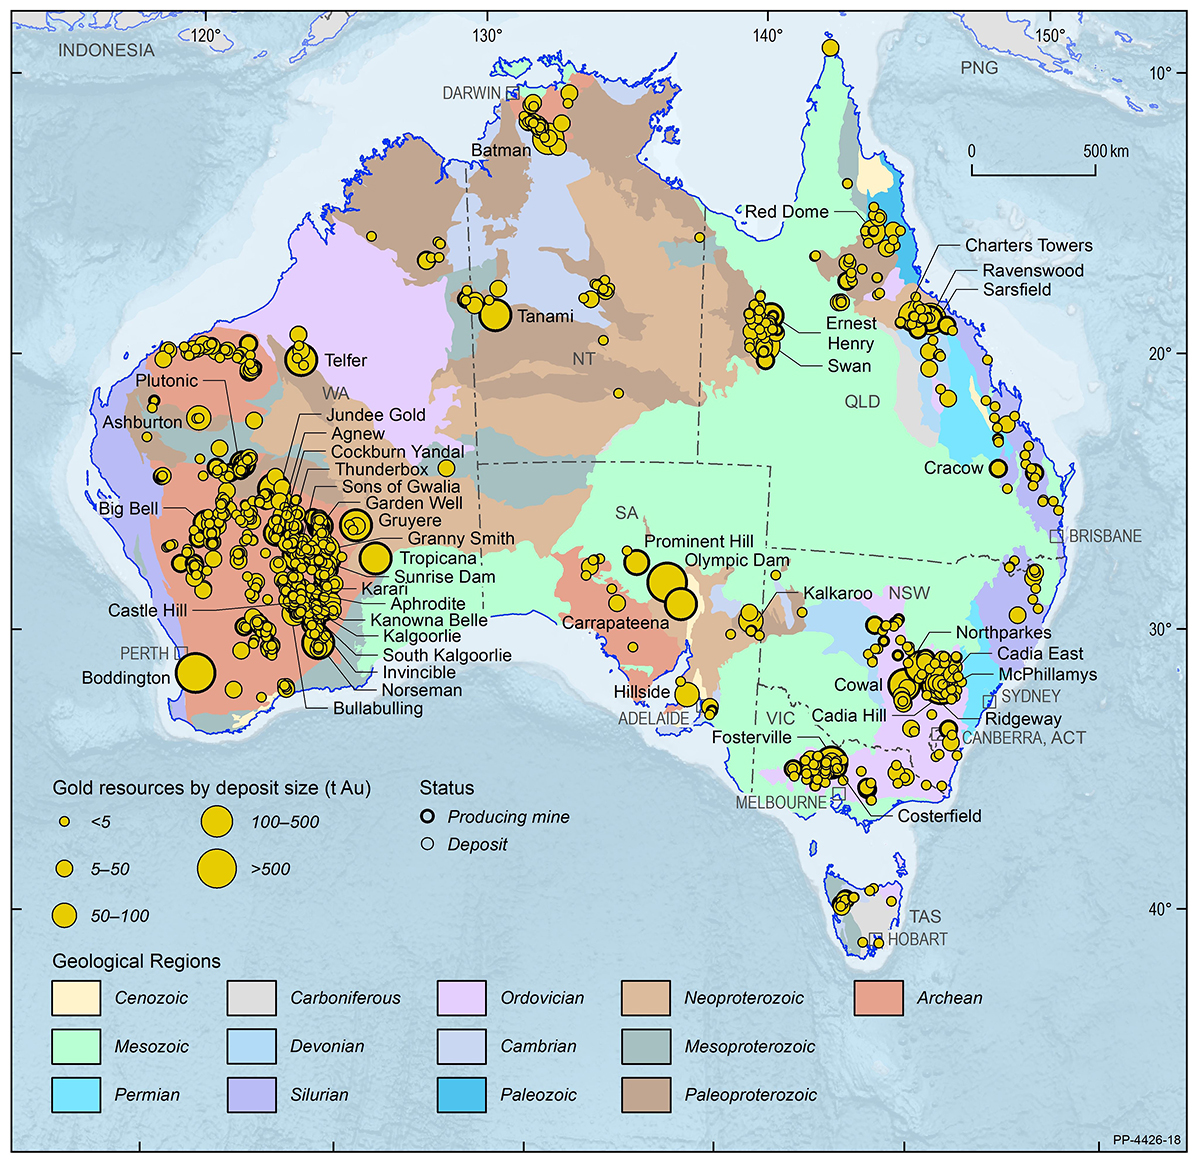
Gold
| EDR 11,101 t Au ( 3%) |
|
| Ore Reserves 4,229 t Au ( 4%) |
| Operating Mines 164 |
|
| Production 328 t Au ( 1%) |
|
| Export Income $25,492 m ( 9%) |
| World Ranking | |
| Resources 1 (20%) |
|
| Production 2 (10%) |
Major Uses:
Jewellery, storing monetary value, personal electronic devices, computers, dentistry and aerospace industries.
Abbreviations
t Au – tonnes of gold content; $m – million dollars (Australian).
Notes
Resource figures are as at 31 December 2020. Operating mines and production are for calendar year 2020. Percentage increases or decreases are in relation to 2019. World rankings are followed by percentage share in brackets. Export income sourced from Office of the Chief Economist, Resources and Energy Quarterly, December 2021.
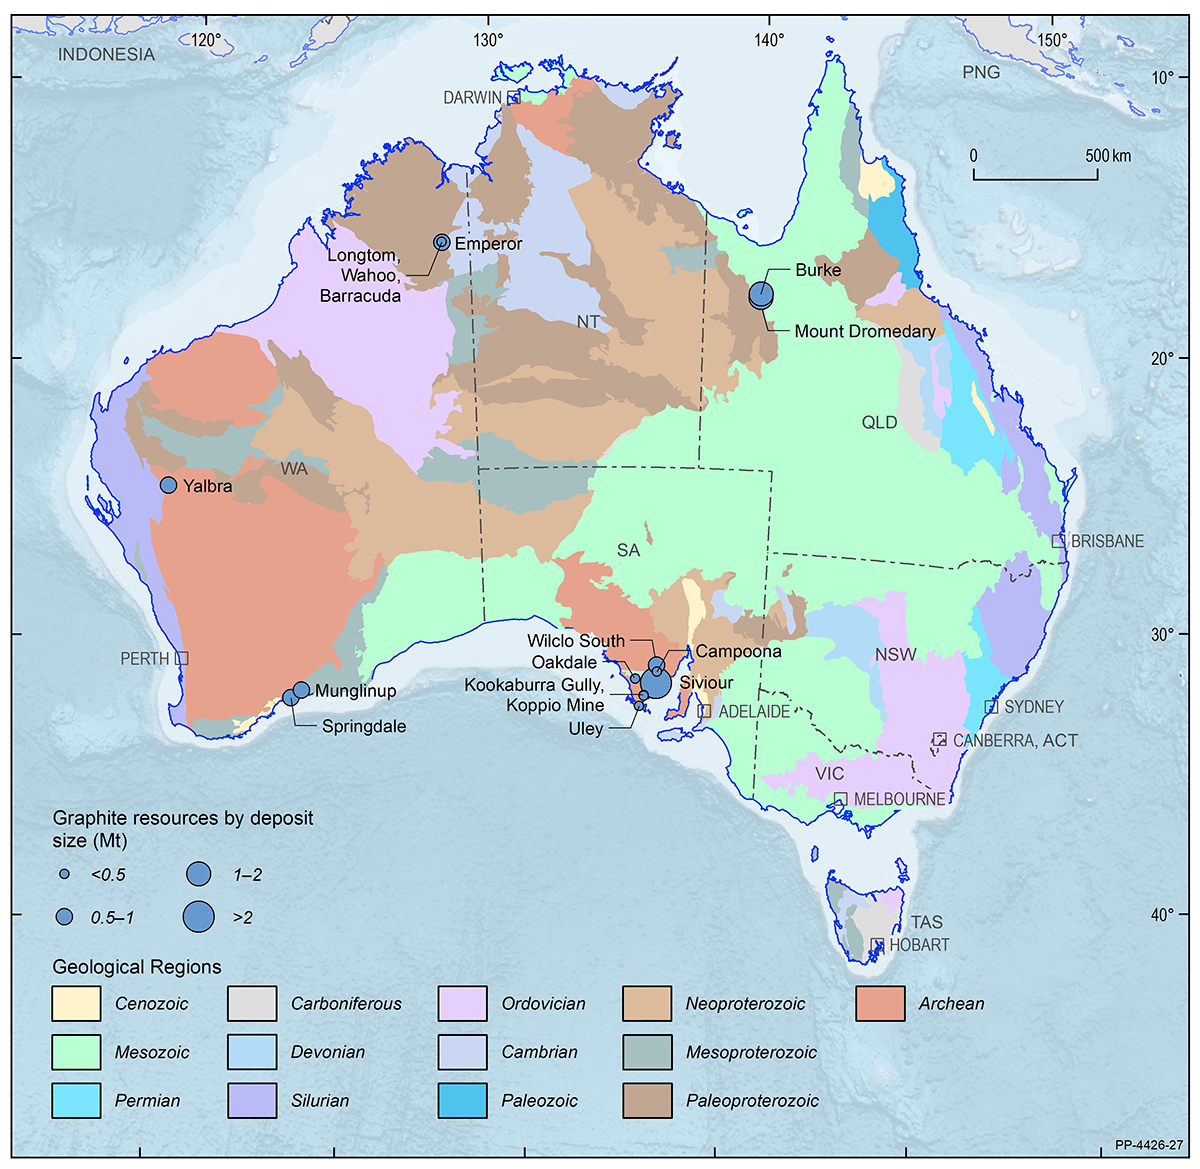
Graphite
| Critical Mineral | |
| EDR 7.97 Mt (0%) |
|
| Ore Reserves 5.00 Mt ( 4%) |
|
| Operating Mines 0 |
|
| Production 0 Mt (0%) |
|
| Export Income $0 (0%). |
| World Ranking | |
| Resources 8 (2%) |
|
| Production 0 (0%) |
Major Uses:
Anode component of lithium-ion batteries, refractory materials, lubricants and pencils.
Abbreviations
Mt – million tonnes.
Notes
Resource figures are as at 31 December 2020. Operating mines and production are for calendar year 2020. Percentage increases or decreases are in relation to 2019. World rankings are followed by percentage share in brackets.
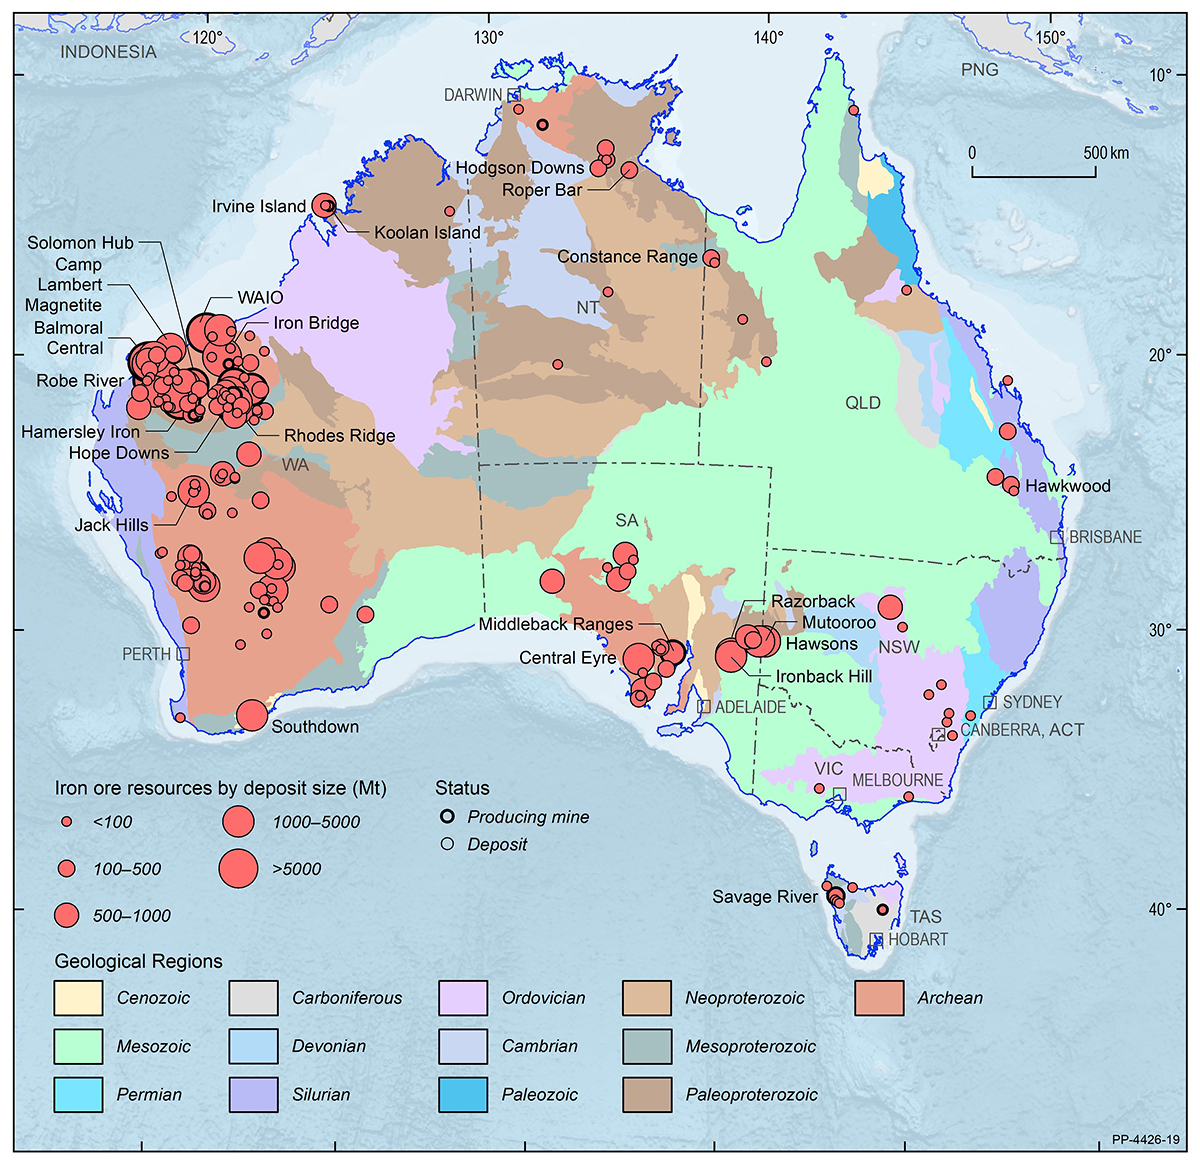
Iron Ore
| EDR 51,709 Mt ( 2%) |
|
| Ore Reserves 23,001 Mt ( -3%) |
| Operating Mines 45 |
|
| Production 922 Mt (0%) |
|
| Export Income $118,800 m ( 21%) |
| World Ranking | |
| Resources 1 (29%) |
|
| Production 1 (38%) |
Major Uses:
Steel and stainless steel manufacture, civil engineering, transport, cast iron, magnets and alloys.
Abbreviations
Mt – million tonnes; $m – million dollars (Australian).
Notes
Resource figures are as at 31 December 2020. Operating mines and production are for calendar year 2020. Percentage increases or decreases are in relation to 2019. World rankings are followed by percentage share in brackets. Export income is the sum of ore, crude steel and scrap categories, sourced from Office of the Chief Economist, Resources and Energy Quarterly, December 2021.
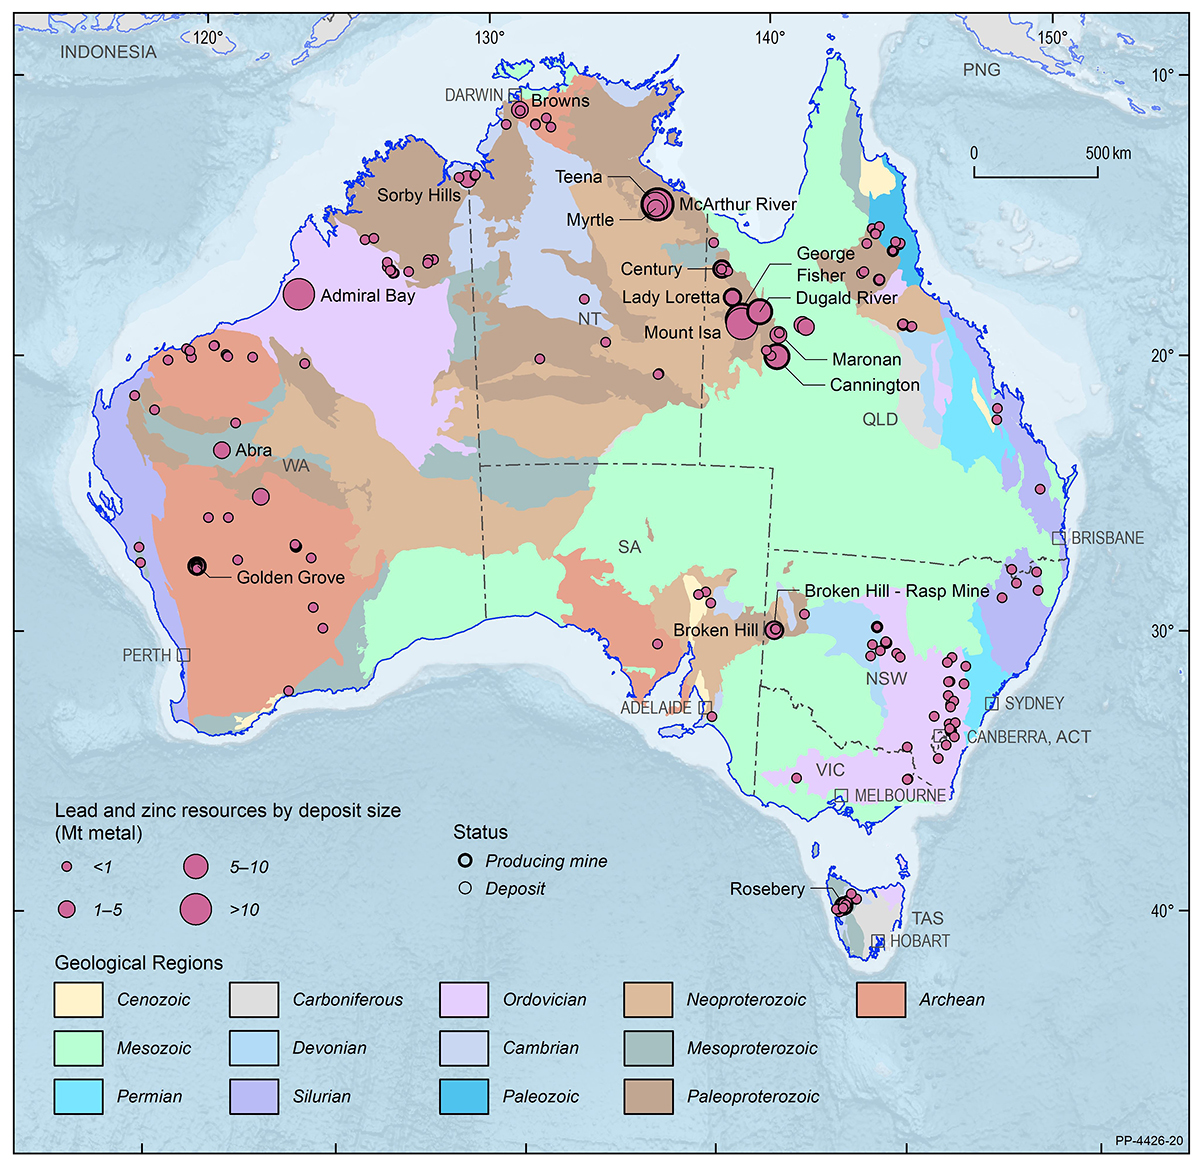
Lead and Zinc
Lead
| EDR 35.73 Mt Pb ( -4%) |
|
| Ore Reserves 11.59 Mt Pb ( 1%) |
| Operating Mines 19 |
|
| Production 0.49 Mt Pb ( -4%) |
|
| Export Income $1,704 m ( 1%) |
| World Ranking | |
| Resources 1 (41%) |
|
| Production 2 (11%) |
Major Uses:
Batteries, underwater cable sheathing, solder, casting alloys, chemical compounds, weighting and radiation protection.
Abbreviations
Mt Pb – million tonnes of lead content; $m – million dollars (Australian).
Notes
Resource figures are as at 31 December 2020. Operating mines and production are for calendar year 2020. Percentage increases or decreases are in relation to 2019. World rankings are followed by percentage share in brackets. Export income is the sum of bullion, refined and concentrate categories, sourced from Office of the Chief Economist, Resources and Energy Quarterly, December 2021.
Zinc
| EDR 66.41 Mt Zn ( -4%) |
|
| Ore Reserves 23.20 Mt Zn ( -5%) |
| Operating Mines 20 |
|
| Production 1.31 Mt Zn ( -2%) |
|
| Export Income $3,206 m ( -16%) |
| World Ranking | |
| Resources 1 (26%) |
|
| Production 2 (11%) |
Major Uses:
Galvanised steel for construction and transport industries, die-casts, brass, chemicals, cosmetics, pharmaceuticals and electrical equipment.
Abbreviations
Mt Zn – million tonnes of zinc content; $m – million dollars (Australian).
Notes
Resource figures are as at 31 December 2020. Operating mines and production are for calendar year 2020. Percentage increases or decreases are in relation to 2019. World rankings are followed by percentage share in brackets. Export income is the sum of refined and ore/concentrate categories, sourced from Office of the Chief Economist, Resources and Energy Quarterly, December 2021.
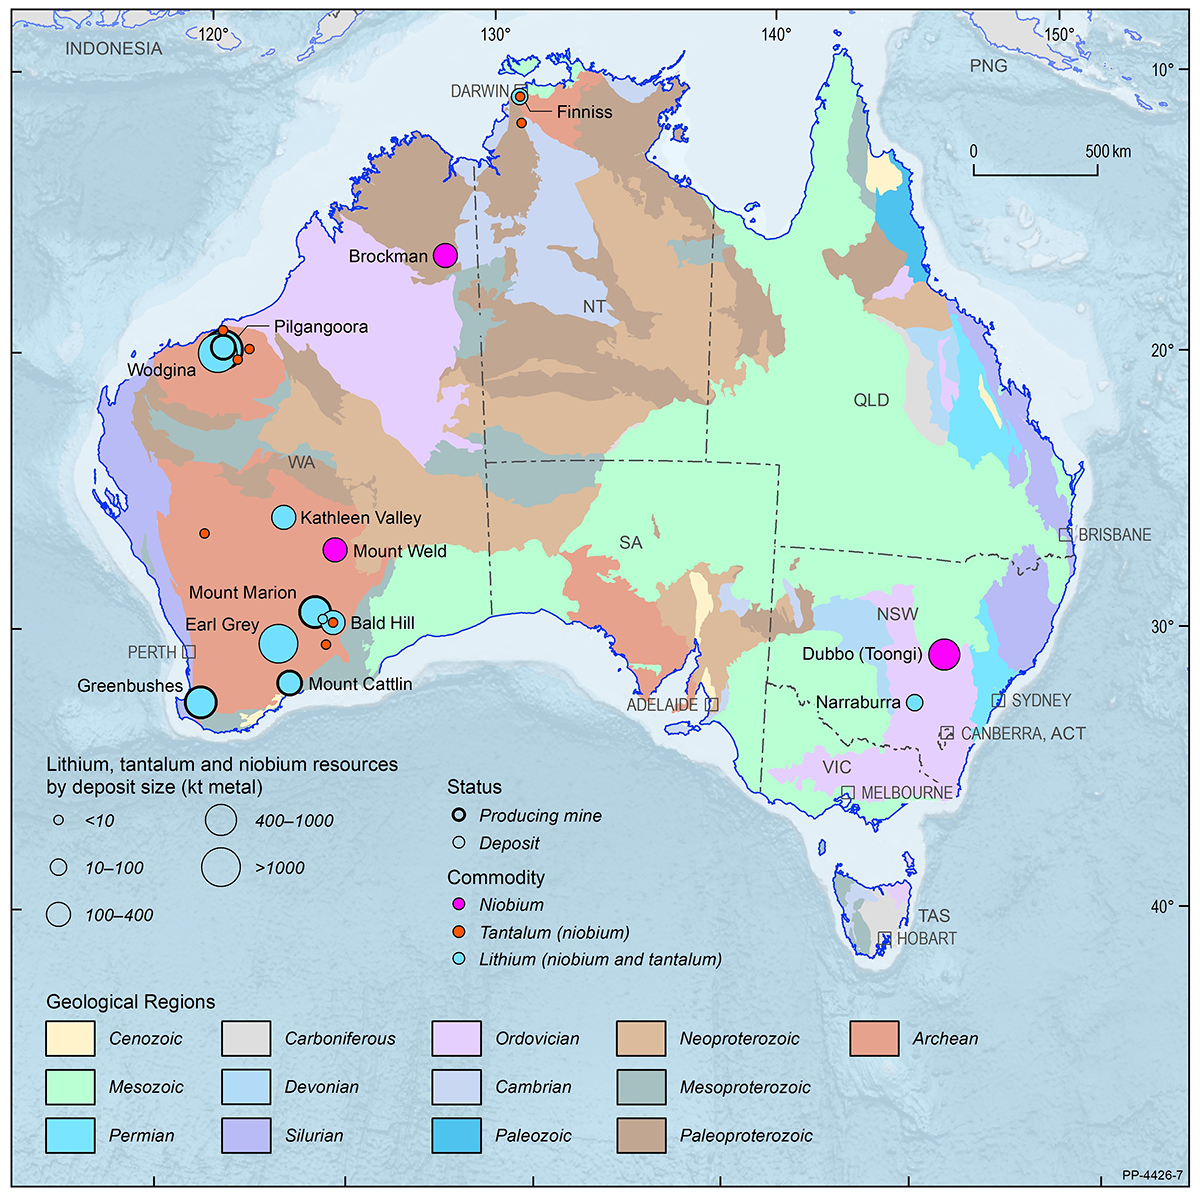
Lithium, Tantalum and Niobium
Lithium
| Critical Mineral | |
| EDR 6,174 kt Li ( 8%) |
|
| Ore Reserves 3,777 kt Li (0%) |
|
| Operating Mines 5 |
|
| Production 40 kt Li ( -11%) |
|
| Export Income $793 m ( -40%) |
| World Ranking | |
| Resources 2 (27%) |
|
| Production 1 (49%) |
Major Uses:
Lithium-ion batteries for electric vehicles and personal electronic devices, lubricant greases, pharmaceuticals, catalysts, glass, ceramics and alloys used in aerospace and motorsport industries.
Abbreviations
kt Li – kilotonnes of lithium content; $m – million dollars (Australian).
Notes
Resource figures are as at 31 December 2020. Operating mines and production are for calendar year 2020. Percentage increases or decreases are in relation to 2019. World rankings are followed by percentage share in brackets. Export income sourced from Department of Mines, Industry Regulation and Safety, Western Australian Government, 2020 Major commodities resources file.
Tantalum
| Critical Mineral | |
| EDR 99.4 kt Ta ( 6%) |
|
| Ore Reserves 39.0 kt Ta (0%) |
|
| Operating Mines 1 |
|
| Production 0.1 kt Ta ( 4%) |
|
| Export Income n.a. |
| World Ranking | |
| Resources 1 (75%)* |
|
| Production 5 (4%) |
Major Uses:
Capacitors for the electronics and telecommunications industry, resistors, semiconductors, alloys and superalloys, medical and dental applications and chemical process industries.
Abbreviations
kt Ta – kilotonnes of tantalum content; n.a. – not available.
Notes
Resource figures are as at 31 December 2020. Operating mines and production are for calendar year 2020. Percentage increases or decreases are in relation to 2019. World rankings are followed by percentage share in brackets. *World ranking for tantalum is based on documented resources only which excludes much of the large but unquantified resources in central Africa.
Niobium
| Critical Mineral | |
| EDR 216 kt Nb (0%) |
|
| Ore Reserves 58 kt Nb (0%) |
|
| Operating Mines 0 |
|
| Production n.a. |
|
| Export Income n.a. |
| World Ranking | |
| Resources 3 (2%) |
|
| Production n.a. |
Major Uses:
Micro alloy with iron for use in the construction and automotive industries, superalloys used in aeronautics and energy industries, magnetic resonance imaging (MRI) scanners, nuclear magnetic resonance (NMR) equipment, glass, jewellery, prosthetics and medical implants.
Abbreviations
kt Nb – kilotonnes of niobium content; n.a. – not available.
Notes
Resource figures are as at 31 December 2020. Operating mines and production are for calendar year 2020. Percentage increases or decreases are in relation to 2019. World rankings are followed by percentage share in brackets.
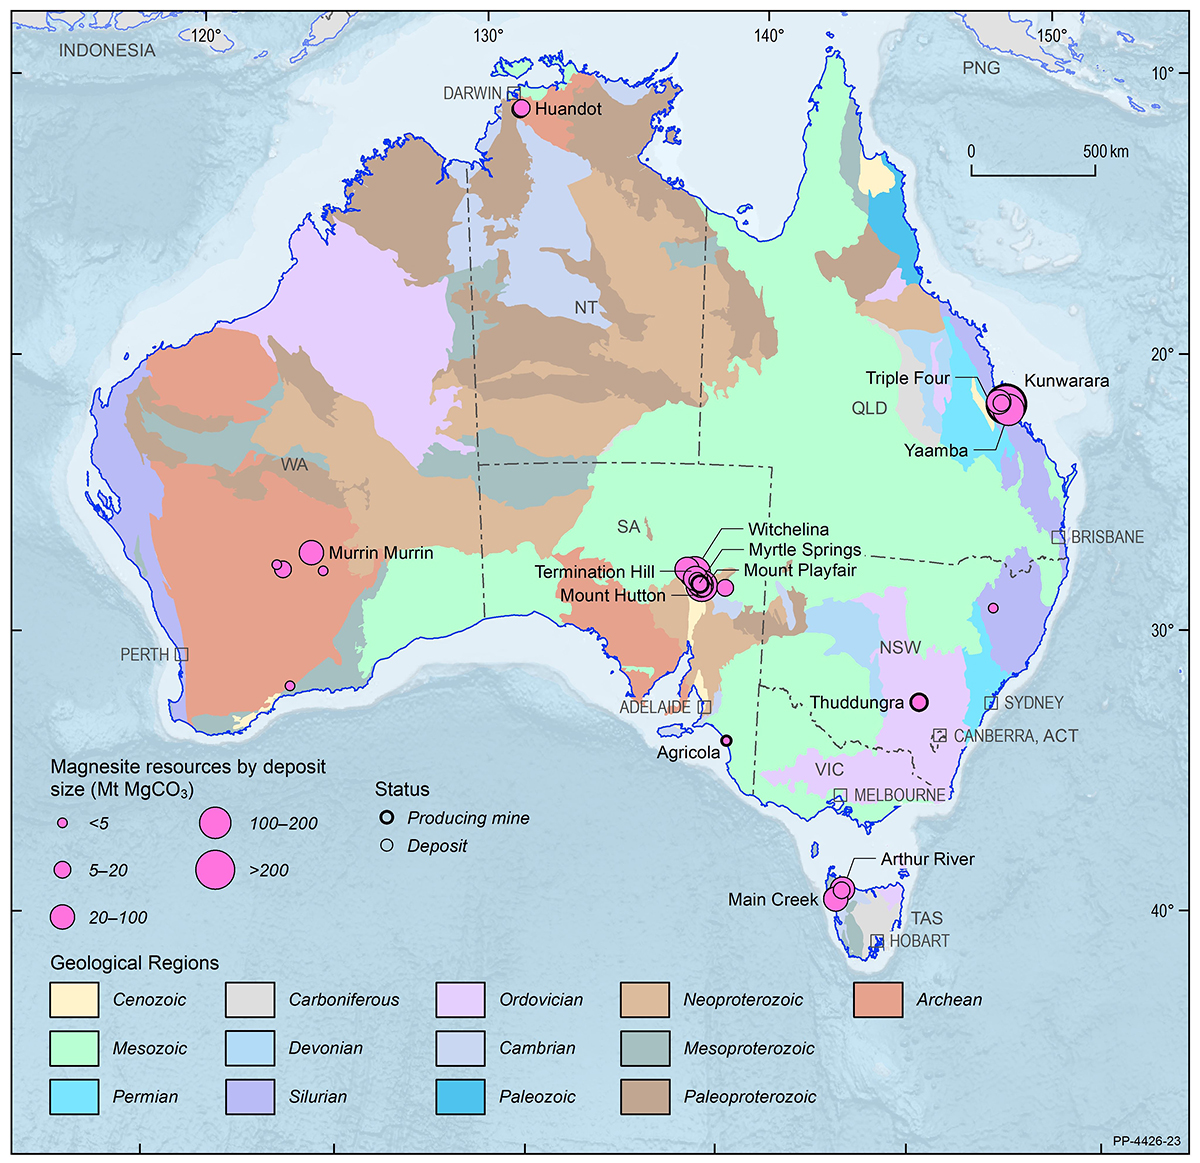
Magnesite
| Critical Mineral | |
| EDR 286 Mt MgCO3 (0%) |
|
| Ore Reserves 37 Mt MgCO3 (0%) |
|
| Operating Mines 4 |
|
| Production 0.8 Mt MgCO3 ( 50%) |
|
| Export Income $75 m (162%) |
| World Ranking | |
| Resources 4 (4%) |
|
| Production 5 (3%) |
Major Uses:
Used to produce magnesium oxide (MgO) for use as a refractory material in the steel industry, animal feeds and fertilisers, flooring compounds, flame retardants and the pharmaceutical industry.
Abbreviations
Mt MgCO3 – million tonnes of magnesite carbonate (magnesite) content; $m – million dollars (Australian).
Notes
Resource figures are as at 31 December 2020. Operating mines and production are for calendar year 2020. Percentage increases or decreases are in relation to 2019. World rankings are followed by percentage share in brackets. Export income from the Department for Energy and Mining 2020, South Australia, Report Book 2021/00008 and the Queensland Department of Natural Resources and Mines, Queensland Annual Minerals Summary 2019-20.
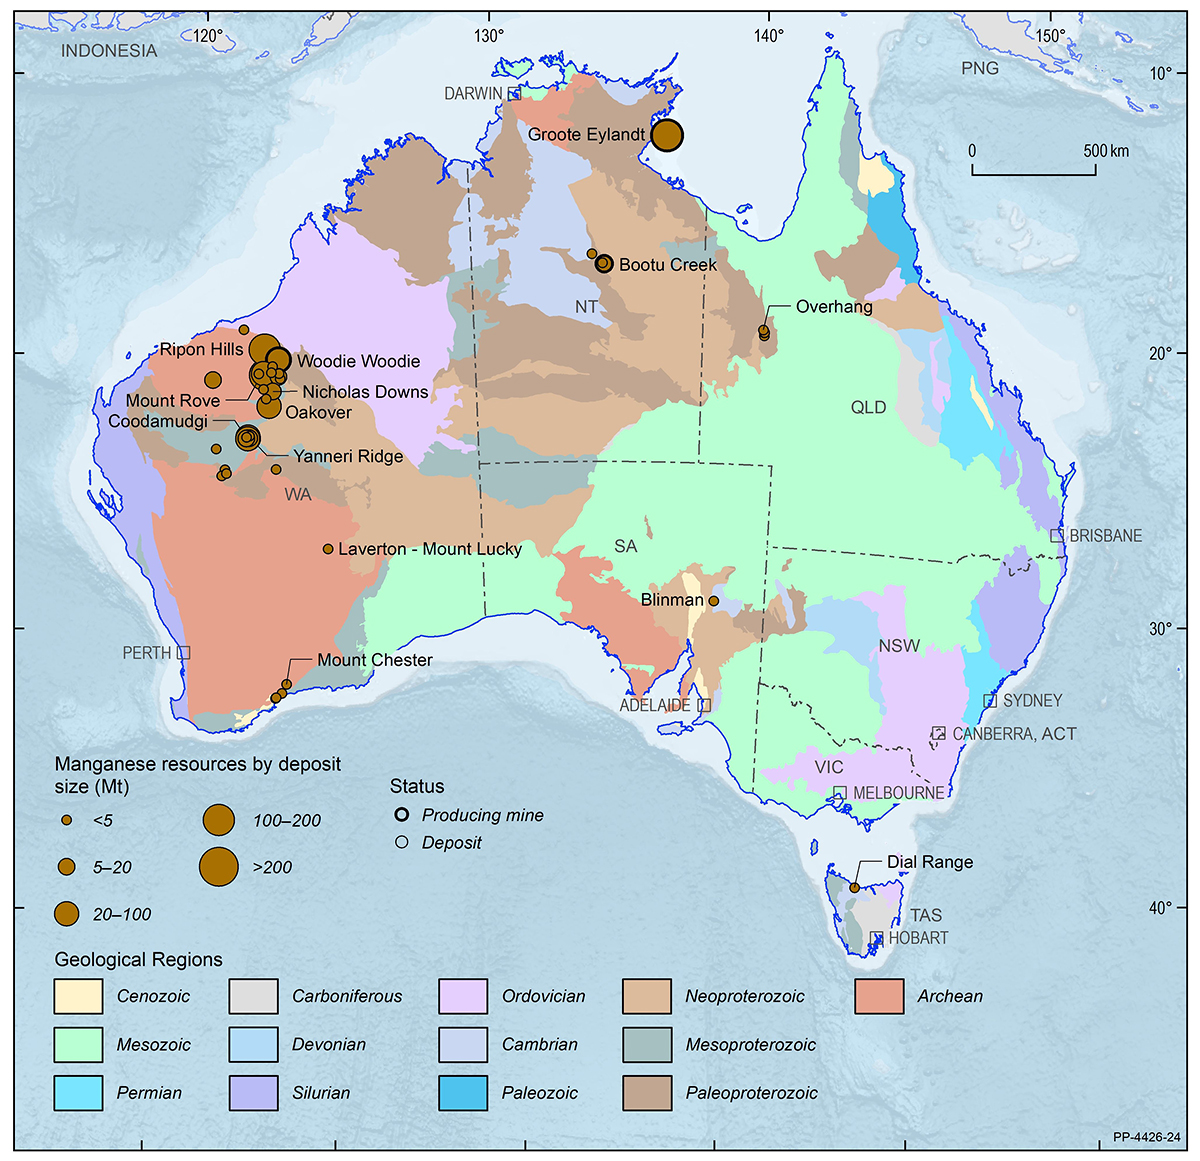
Manganese Ore
| Critical Mineral | |
| EDR 276 Mt ( 1%) |
|
| Ore Reserves 135 Mt ( 48%) |
|
| Operating Mines 3 |
|
| Production 4.8 Mt ( -36%) |
|
| Export Income >$1,610 m |
| World Ranking | |
| Resources 4 (10%) |
|
| Production 3 (12%) |
Major Uses:
Alloying agent for steel manufacture, rechargeable electric vehicle batteries, plant fertilisers, animal feeds, glass and ceramics.
Abbreviations
Mt – million tonnes; $m – million dollars (Australian).
Notes
Resource figures are as at 31 December 2020. Operating mines and production are for calendar year 2020. Percentage increases or decreases are in relation to 2019. World rankings are followed by percentage share in brackets. Export income is a minimum figure as it does not include production from Western Australia. Available export income sourced from the Northern Territory Department of Industry Tourism and Trade, 2020 Northern Territory Mining Production.
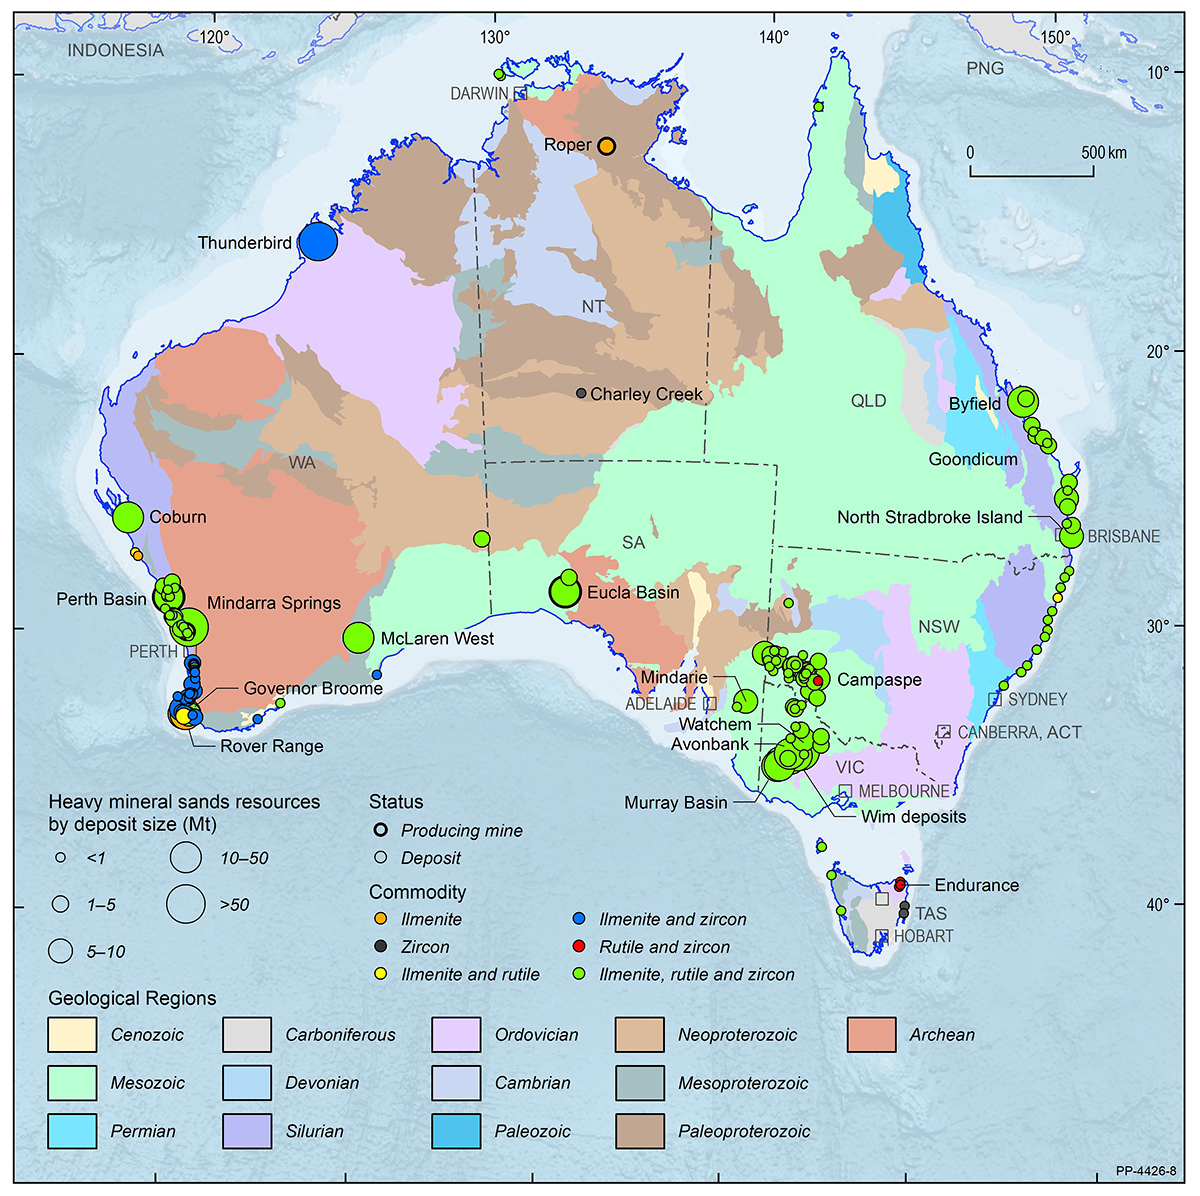
Mineral Sands
Ilmenite
| Critical Mineral | |
| EDR 274.0 Mt (0%) |
|
| Ore Reserves 61.5 Mt ( -3%) |
|
| Operating Mines 11 |
|
| Production 1.1 Mt ( 10%) |
|
| Export Income n.a. |
| World Ranking | |
| Resources 2 (22%) |
|
| Production 3 (9%) |
Major Uses:
Main source of titanium dioxide which is used in paints, plastics, fabrics, rubber, textiles, paper, sunscreen, cosmetics and as fluxing agents.
Abbreviations
Mt – million tonnes; n.a. – not available.
Notes
Resource figures are as at 31 December 2020. Operating mines and production are for calendar year 2020. Percentage increases or decreases are in relation to 2019. World rankings are followed by percentage share in brackets.
Rutile
| Critical Mineral | |
| EDR 35.3 Mt (0%) |
|
| Ore Reserves 9.7 Mt ( -2%) |
|
| Operating Mines 8 |
|
| Production 0.2 Mt (0%) |
|
| Export Income n.a. |
| World Ranking | |
| Resources 1 (63%) |
|
| Production 1 (26%) |
Major Uses:
Production of titanium metals for aircraft, spacecraft, vehicles, surgical implants, sports equipment, desalination plants, and general industrial equipment.
Abbreviations
Mt – million tonnes; n.a. – not available.
Notes
Resource figures are as at 31 December 2020. Operating mines and production are for calendar year 2020. Percentage increases or decreases are in relation to 2019. World rankings are followed by percentage share in brackets.
Zircon
| Critical Mineral | |
| EDR 79.3 Mt ( -1%) |
|
| Ore Reserves 24.3 Mt ( -2%) |
|
| Operating Mines 10 |
|
| Production 0.4 Mt ( -20%) |
|
| Export Income n.a. |
| World Ranking | |
| Resources 1 (71%) |
|
| Production 2 (21%) |
Major Uses:
Used as an opacifier for glazes on ceramic tiles, in refractories and for the foundry industry, nuclear reactors, superconducting magnets, chemical industries and cosmetics.
Abbreviations
Mt – million tonnes; n.a. – not available.
Notes
Resource figures are as at 31 December 2020. Operating mines and production are for calendar year 2020. Percentage increases or decreases are in relation to 2019. World rankings are followed by percentage share in brackets.
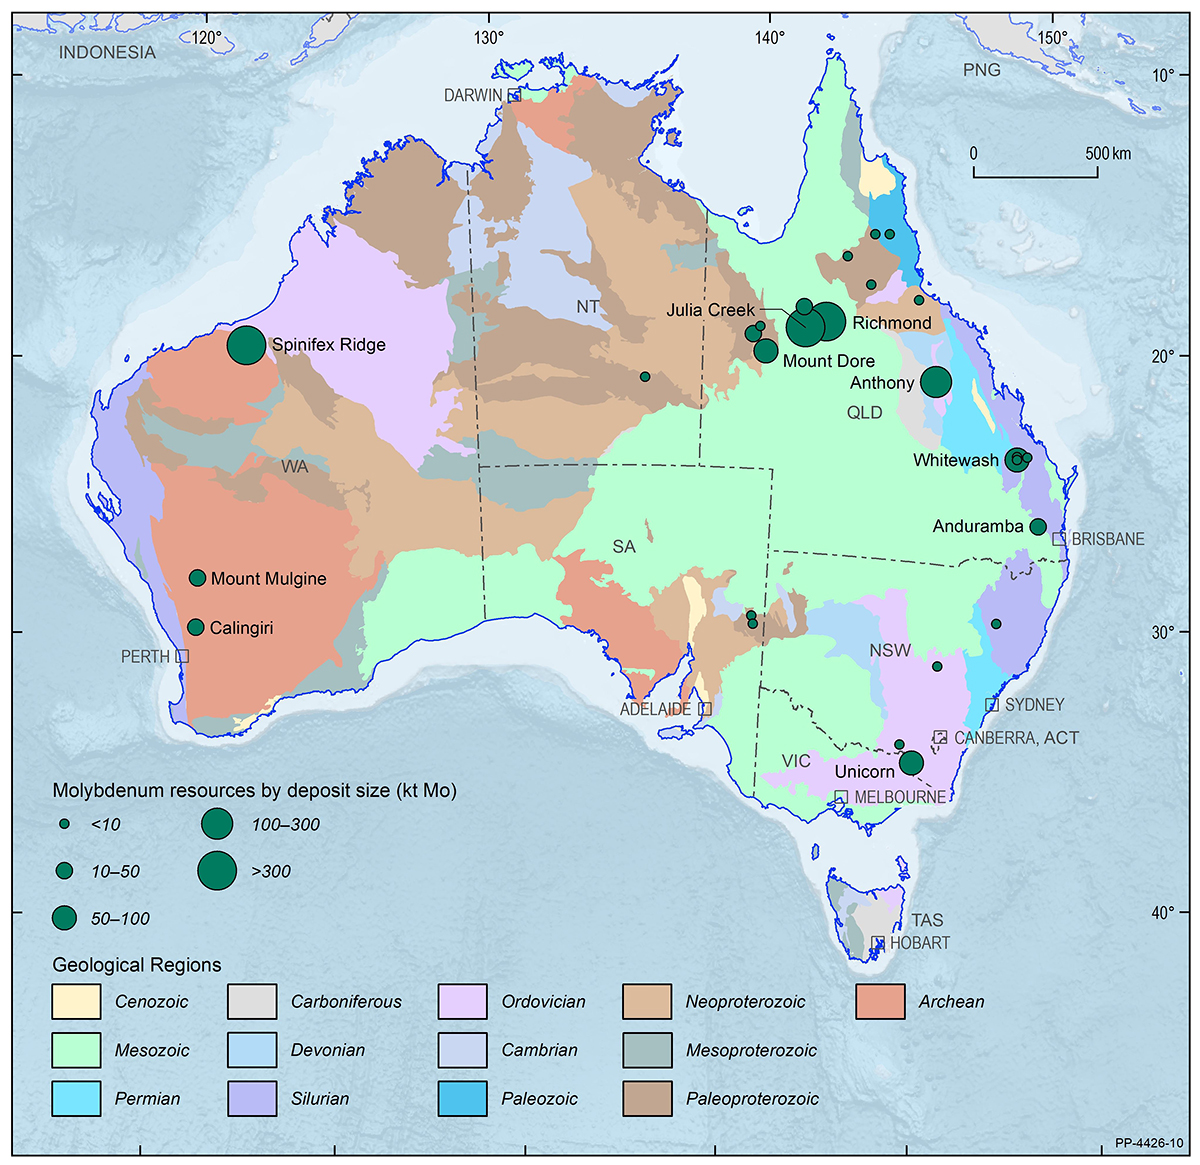
Molybdenum
| EDR 403 kt Mo ( 63%) |
|
| Ore Reserves 4 kt Mo (0%) |
| Operating Mines 0 |
|
| Production 0 kt Mo (0%) |
|
| Export Income $0 (0%) |
| World Ranking | |
| Resources 7 (2%) |
|
| Production 0 |
Major Uses:
Drills, catalysts, lubricants, fertilisers, structural steel and steel alloys used in engine parts.
Abbreviations
kt Mo – kilotonnes of molybdenum content.
Notes
Resource figures are as at 31 December 2020. Operating mines and production are for calendar year 2020. Percentage increases or decreases are in relation to 2019. World rankings are followed by percentage share in brackets.
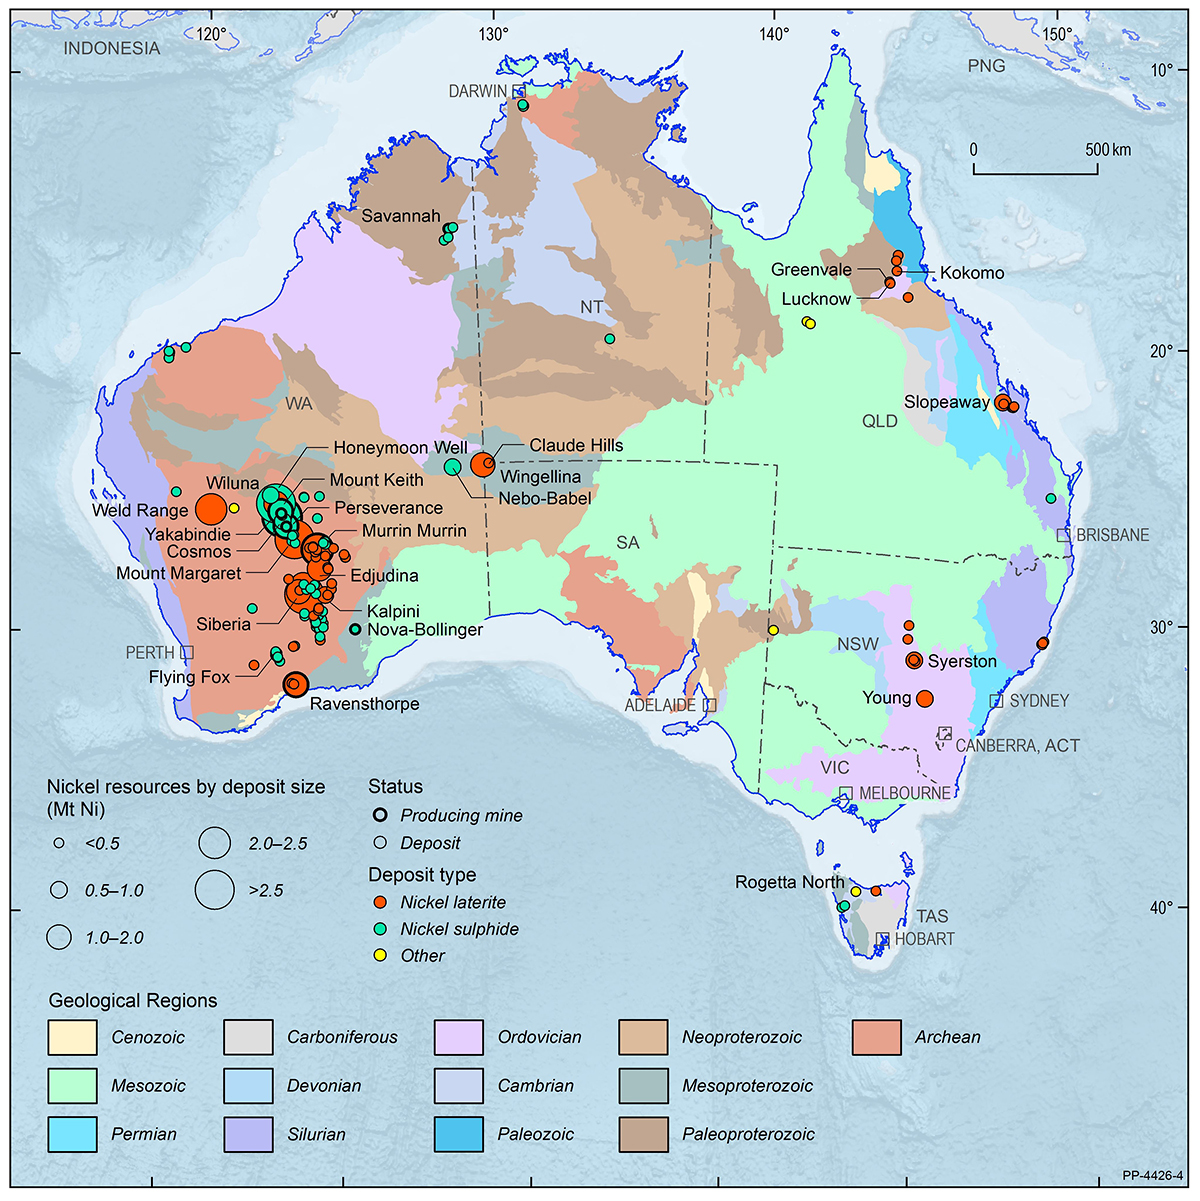
Nickel
| EDR 21.4 Mt Ni ( 1%) |
|
| Ore Reserves 9.5 Mt Ni ( 14%) |
| Operating Mines 13 |
|
| Production 0.17 Mt Ni ( 6%) |
|
| Export Income $2,720 m ( -34%) |
| World Ranking | |
| Resources 1 (22%) |
|
| Production 5 (7%) |
Major Uses:
Stainless and heat-resistant steel production used in chemical industries, motor vehicles, medical applications, electronic engineering and construction. Also non-ferrous alloys, electroplating and lithium-ion batteries.
Abbreviations
Mt Ni – million tonnes of nickel content; $m – million dollars (Australian).
Notes
Resource figures are as at 31 December 2020. Operating mines and production are for calendar year 2020. Percentage increases or decreases are in relation to 2019. World rankings are followed by percentage share in brackets. Export income is the sum of refined/intermediate and ore/concentrate categories sourced from Office of the Chief Economist, Resources and Energy Quarterly, December 2021.
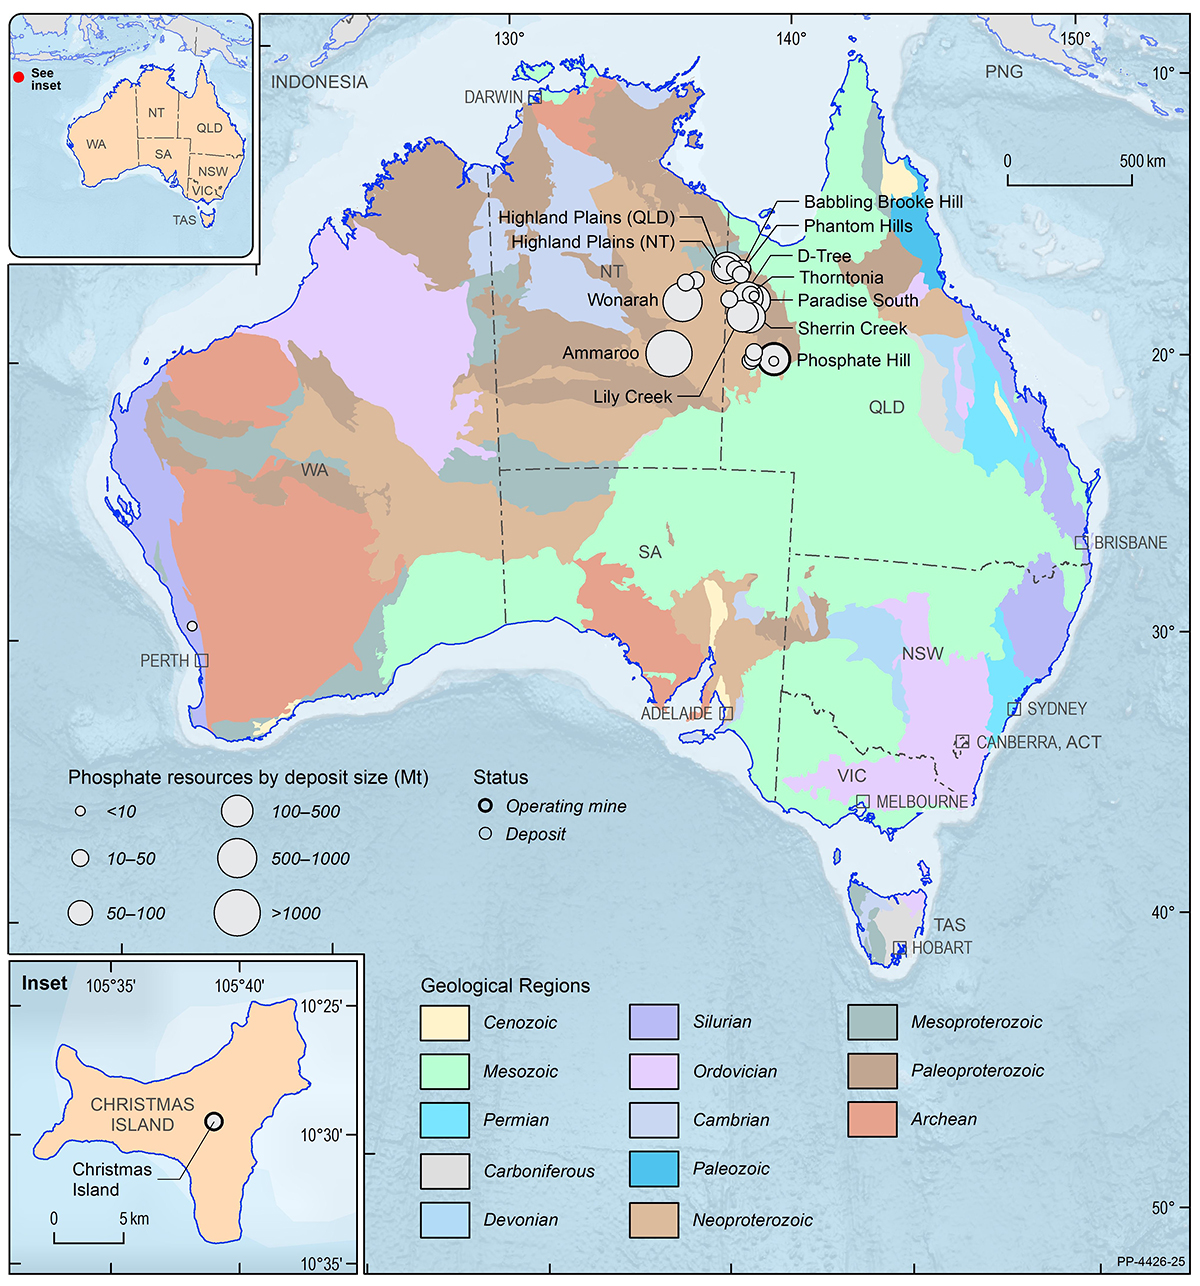
Phosphate
| EDR 1,081 Mt ( -1%) |
|
| Ore Reserves 124 Mt ( 10%) |
| Operating Mines 2 |
|
| Production 1.3 Mt ( 30%) |
|
| Export Income n.a. |
| World Ranking | |
| Resources 9 (2%) |
|
| Production 18 (1%) |
Major Uses:
Source of phosphorus for fertilisers, animal feed, food additives, detergents, herbicides, electronics, asphalt, pharmaceuticals and cosmetics. There is no substitute for phosphorus in agriculture.
Abbreviations
Mt – million tonnes of phosphate rock; n.a. – not available.
Notes
Resource figures are as at 31 December 2020. Operating mines and production are for calendar year 2020. Percentage increases or decreases are in relation to 2019. World rankings are followed by percentage share in brackets.
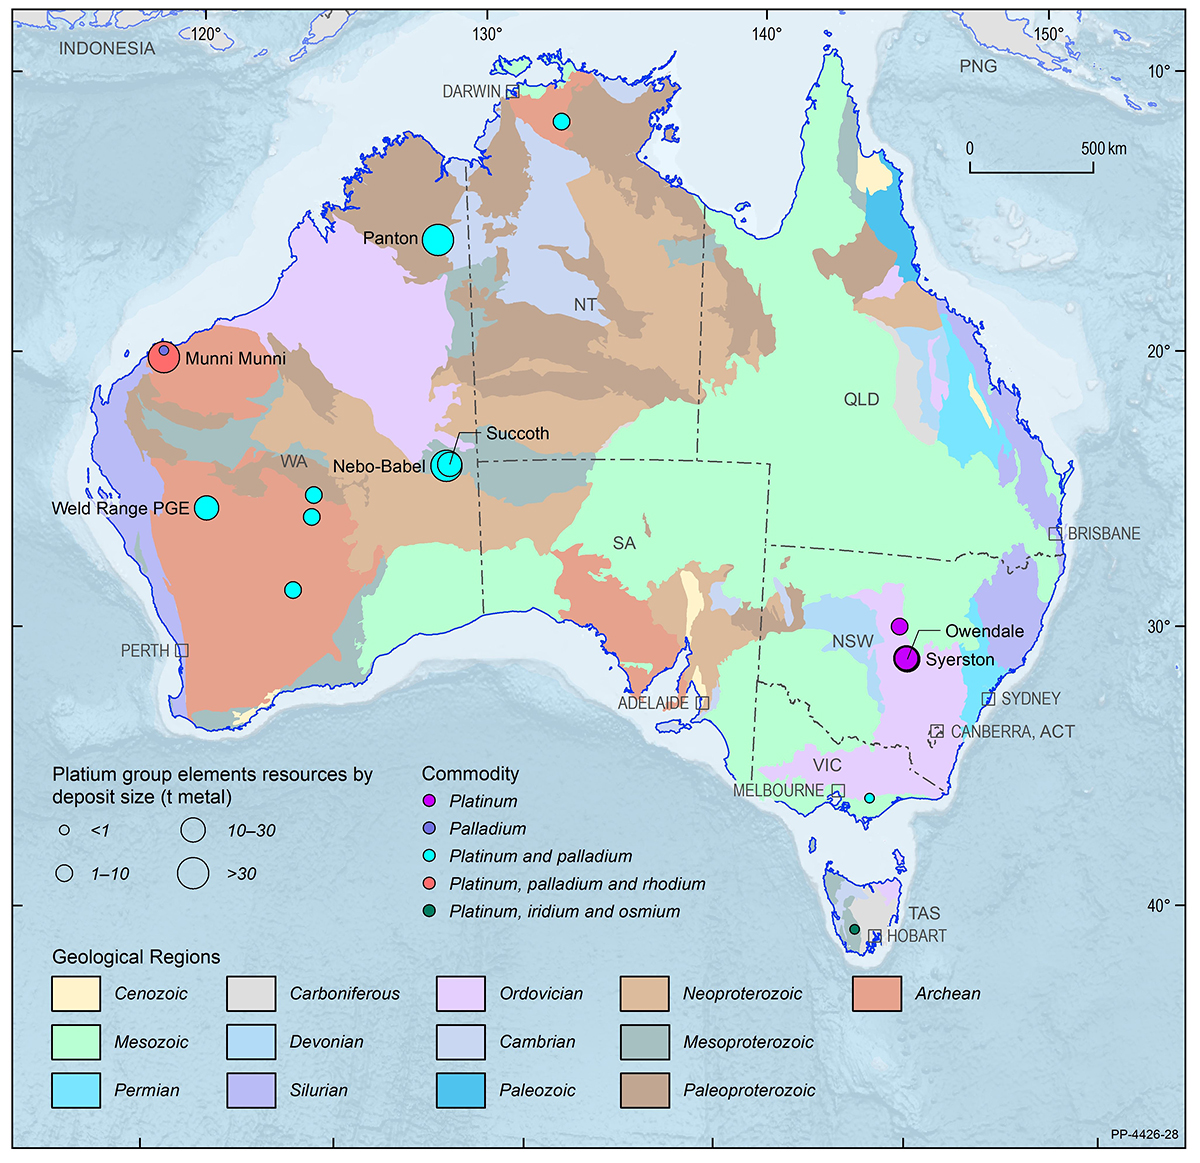
Platinum Group Elements
| Critical Mineral | |
| EDR 107.0 t metal ( 185%) |
|
| Ore Reserves 0 t metal (0%) |
|
| Operating Mines n.a. |
|
| Production 0.522 t metal ( 8%) |
|
| Export Income $45 m ( 30%) |
| World Ranking | |
| Resources minor |
|
| Production minor |
Major Uses:
Jewellery, investment instrument, chemical industries, catalysts and catalytic converters, electronic devices, glass manufacture, industrial crucibles and surgical implants.
Abbreviations
t metal –tonnes of metal content from platinum group elements (platinum, palladium, osmium, iridium, ruthenium, rhodium); n.a. – not available; $m – million dollars (Australian).
Notes
Resource figures are as at 31 December 2020. Operating mines and production are for calendar year 2020. Percentage increases or decreases are in relation to 2019. World rankings are followed by percentage share in brackets. Export income from Department of Mines, Industry Regulation and Safety, Western Australian Government, 2020 Major commodities resources file.
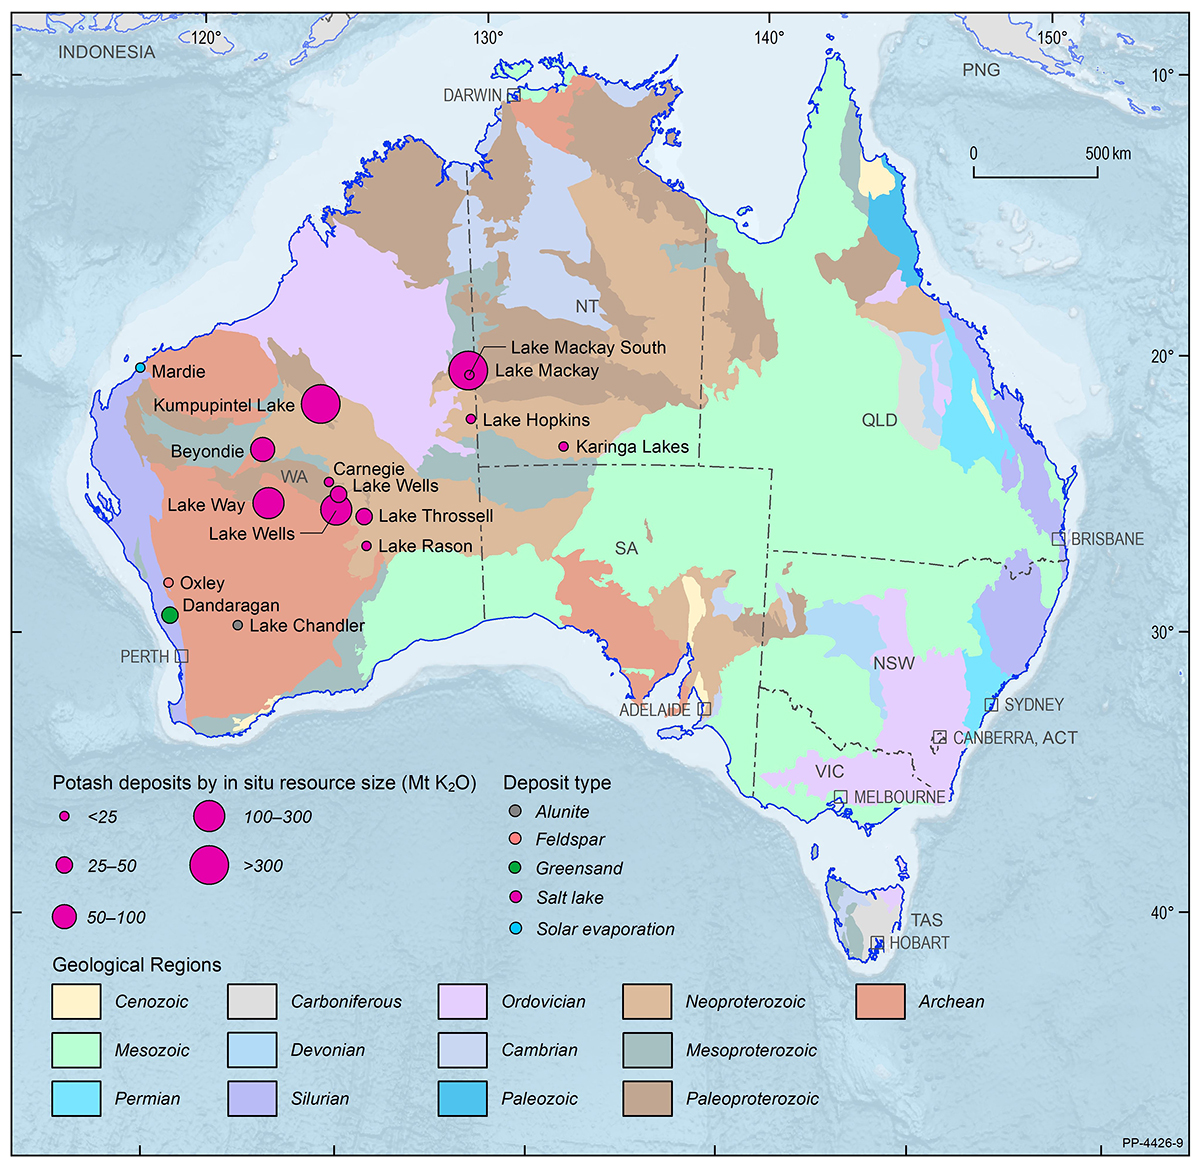
Potash
| EDR 42.5 Mt K2O ( 21%) |
|
| Ore Reserves 20.7 Mt K2O ( 314%) |
| Operating Mines 0 |
|
| Production 0 Mt K2O (0%) |
|
| Export Income $0 (0%) |
| World Ranking | |
| Resources 12 (1%) |
|
| Production 0 |
Major Uses:
Fertilisers, animals feeds, ceramics, detergents, pharmaceuticals, de-icing and glass manufacture.
Abbreviations
Mt K2O –million tonnes of potassium oxide content.
Notes
Resource figures are as at 31 December 2020. Operating mines and production are for calendar year 2020. Percentage increases or decreases are in relation to 2019. World rankings are followed by percentage share in brackets.
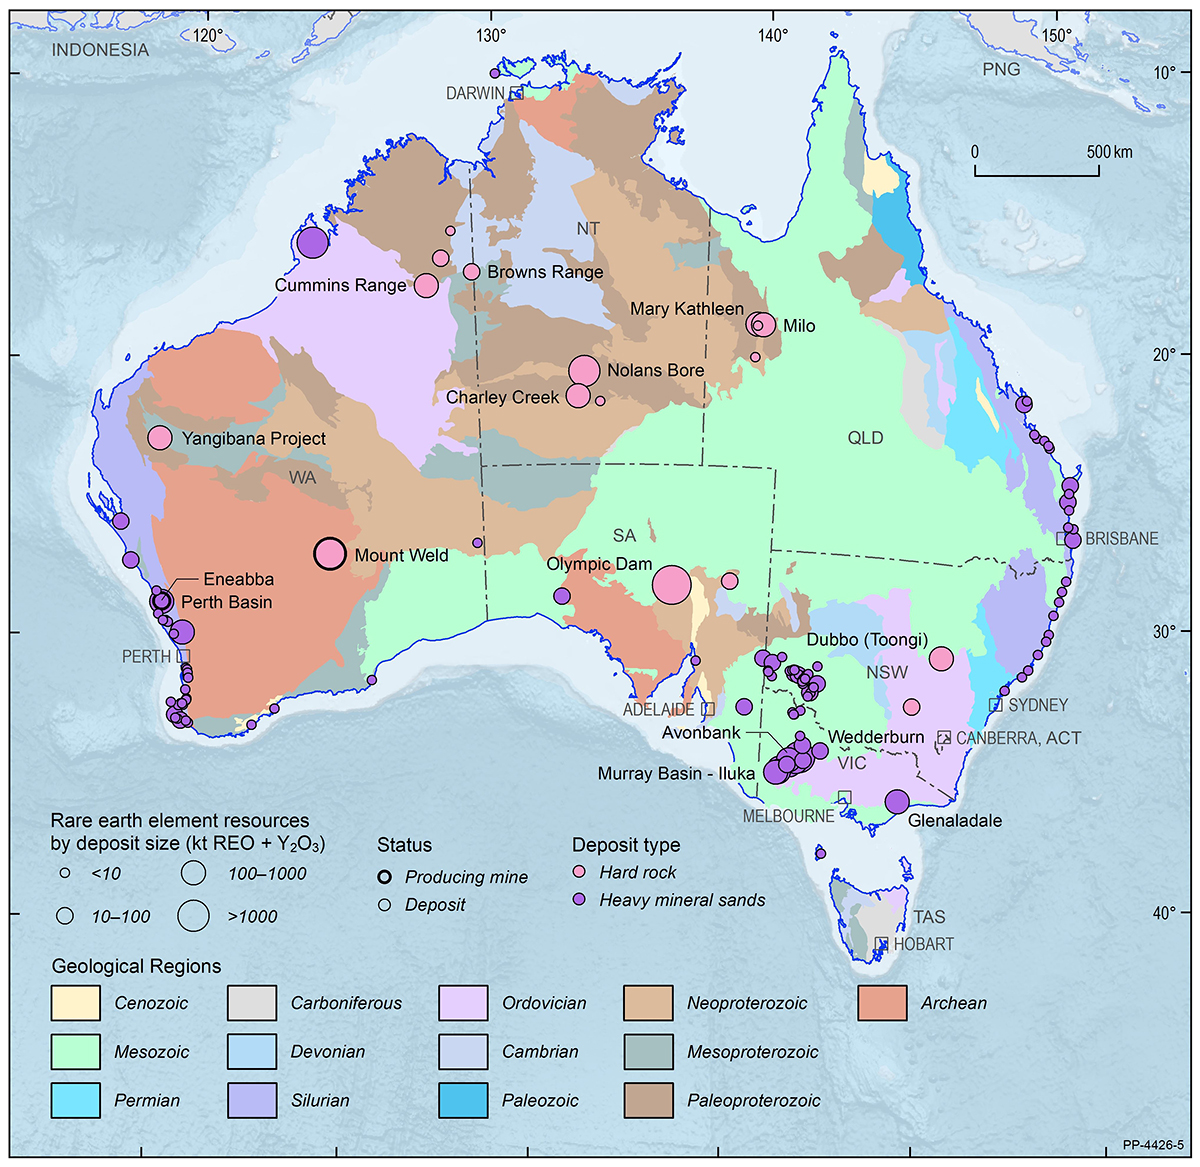
Rare Earth Elements
| Critical Mineral | |
| EDR 4.20 Mt oxide ( 4%) |
|
| Ore Reserves 2.98 Mt oxide ( -1%) |
|
| Operating Mines 2 |
|
| Production 0.02 Mt oxide ( 11%) |
|
| Export Income $270 m |
| World Ranking | |
| Resources 6 (4%) |
|
| Production 4 (8%) |
Major Uses:
Permanent magnets, motors, metal alloys, electronic and computing equipment, batteries, catalytic converters, petroleum refining, medical imaging, colouring agents in glass and ceramics, phosphors, lasers and special glass.
Abbreviations
Mt oxide – million tonnes of rare earth oxide plus yttrium oxide; $m – million dollars (Australian).
Notes
Resource figures are as at 31 December 2020. Operating mines and production are for calendar year 2020. Percentage increases or decreases are in relation to 2019. World rankings are followed by percentage share in brackets. Export income sourced from Department of Mines, Industry Regulation and Safety, Western Australian Government, 2020 Major commodities resources file.
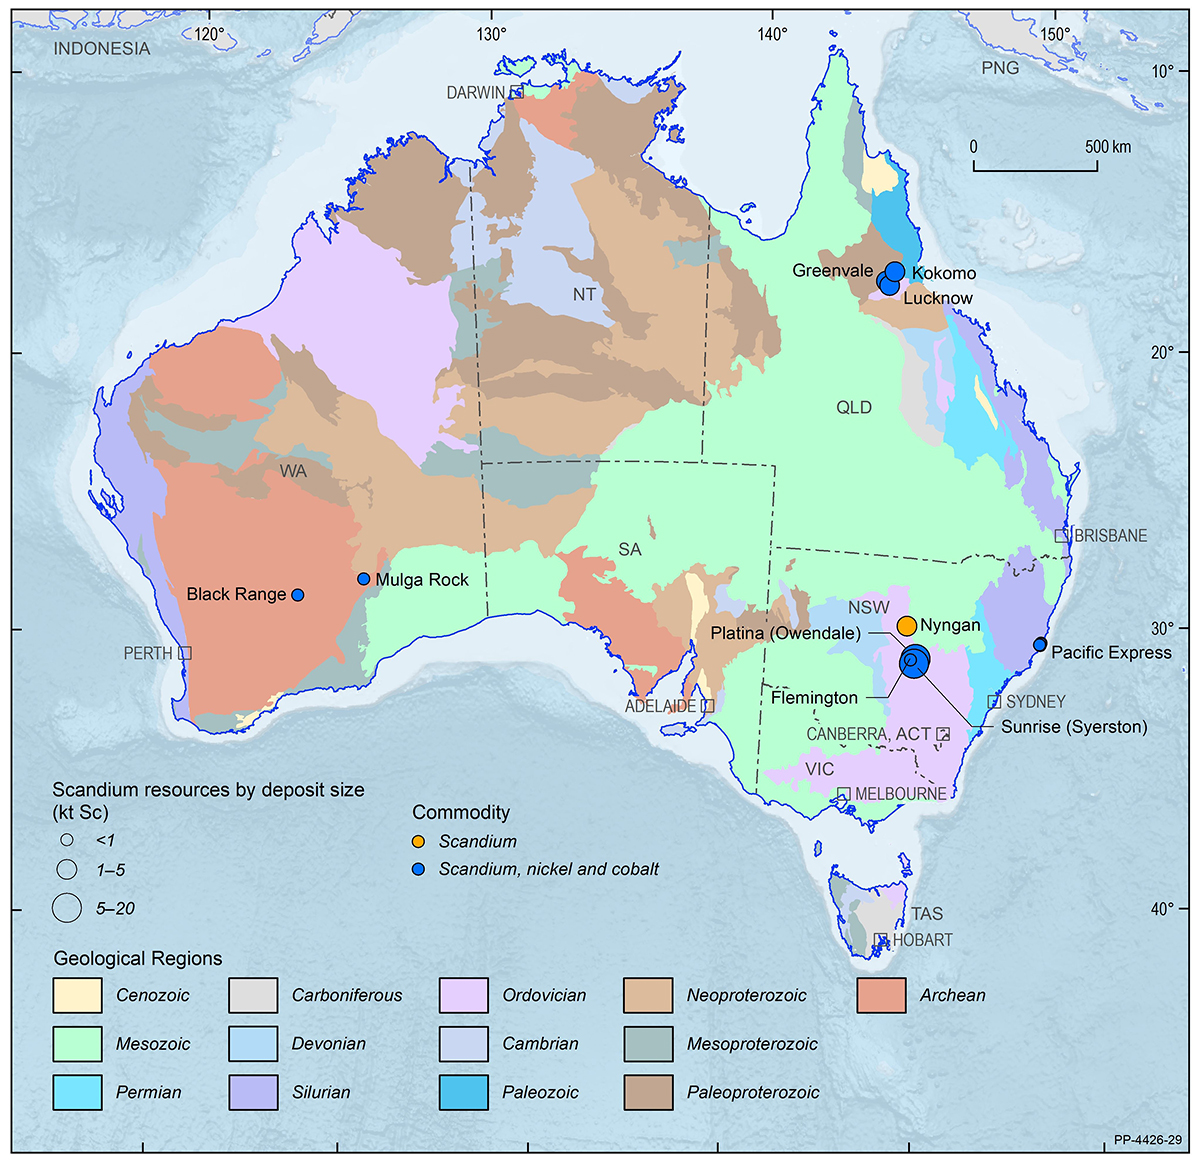
Scandium
| Critical Mineral | |
| EDR 30.34 kt Sc ( 13%) |
|
| Ore Reserves 11.65 kt Sc ( -8%) |
|
| Operating Mines 0 |
|
| Production 0 kt Sc (0%) |
|
| Export Income $0 (0%) |
| World Ranking | |
| Resources n.a. |
|
| Production 0 |
Major Uses:
Alloys for aerospace industries, solid oxide fuel cells, specialised lighting applications, ceramics, lasers, electronics and sporting goods.
Abbreviations
kt Sc – kilotonnes of scandium content; n.a. – not available.
Notes
Resource figures are as at 31 December 2020. Operating mines and production are for calendar year 2020. Percentage increases or decreases are in relation to 2019. World rankings are followed by percentage share in brackets.
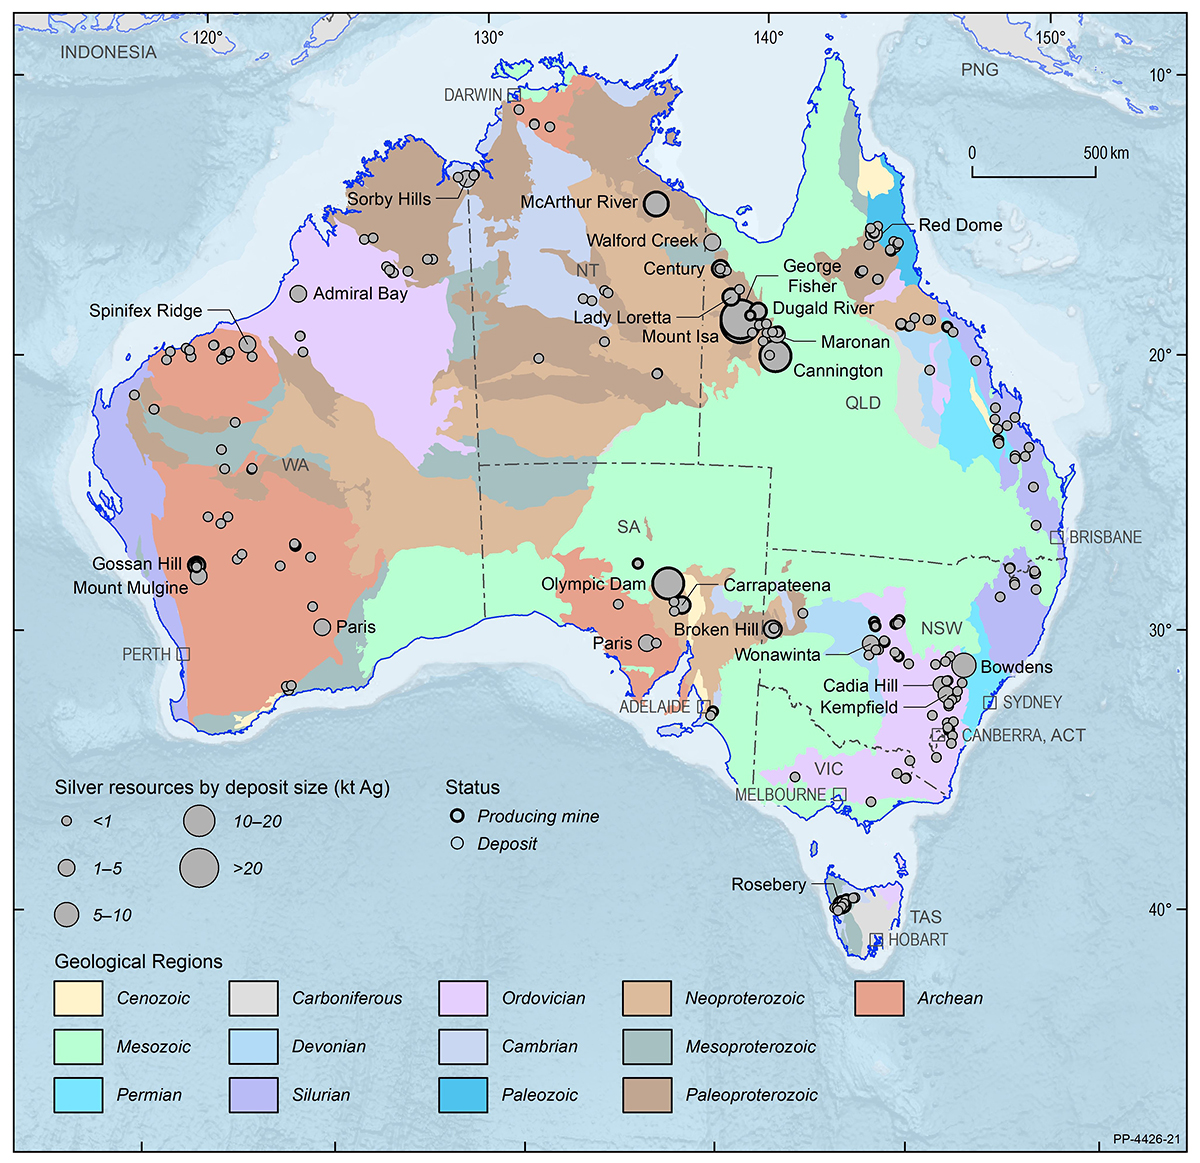
Silver
| EDR 92.50 kt Ag ( 2%) |
|
| Ore Reserves 27.23 kt Ag ( 9%) |
| Operating Mines 31 |
|
| Production 1.34 kt Ag ( 1%) |
|
| Export Income $222 m ( 78%) |
| World Ranking | |
| Resources 1 (18%) |
|
| Production 5 (5%) |
Major Uses:
Jewellery, silverware, storing monetary value, photographic paper and film, mirrors, water treatment, plastics and textiles.
Abbreviations
kt Ag – kilotonnes of silver content; $m – million dollars (Australian).
Notes
Resource figures are as at 31 December 2020. Operating mines and production are for calendar year 2020. Percentage increases or decreases are in relation to 2019. World rankings are followed by percentage share in brackets. Export income sourced from Office of the Chief Economist, Resources and Energy Quarterly, December 2021.
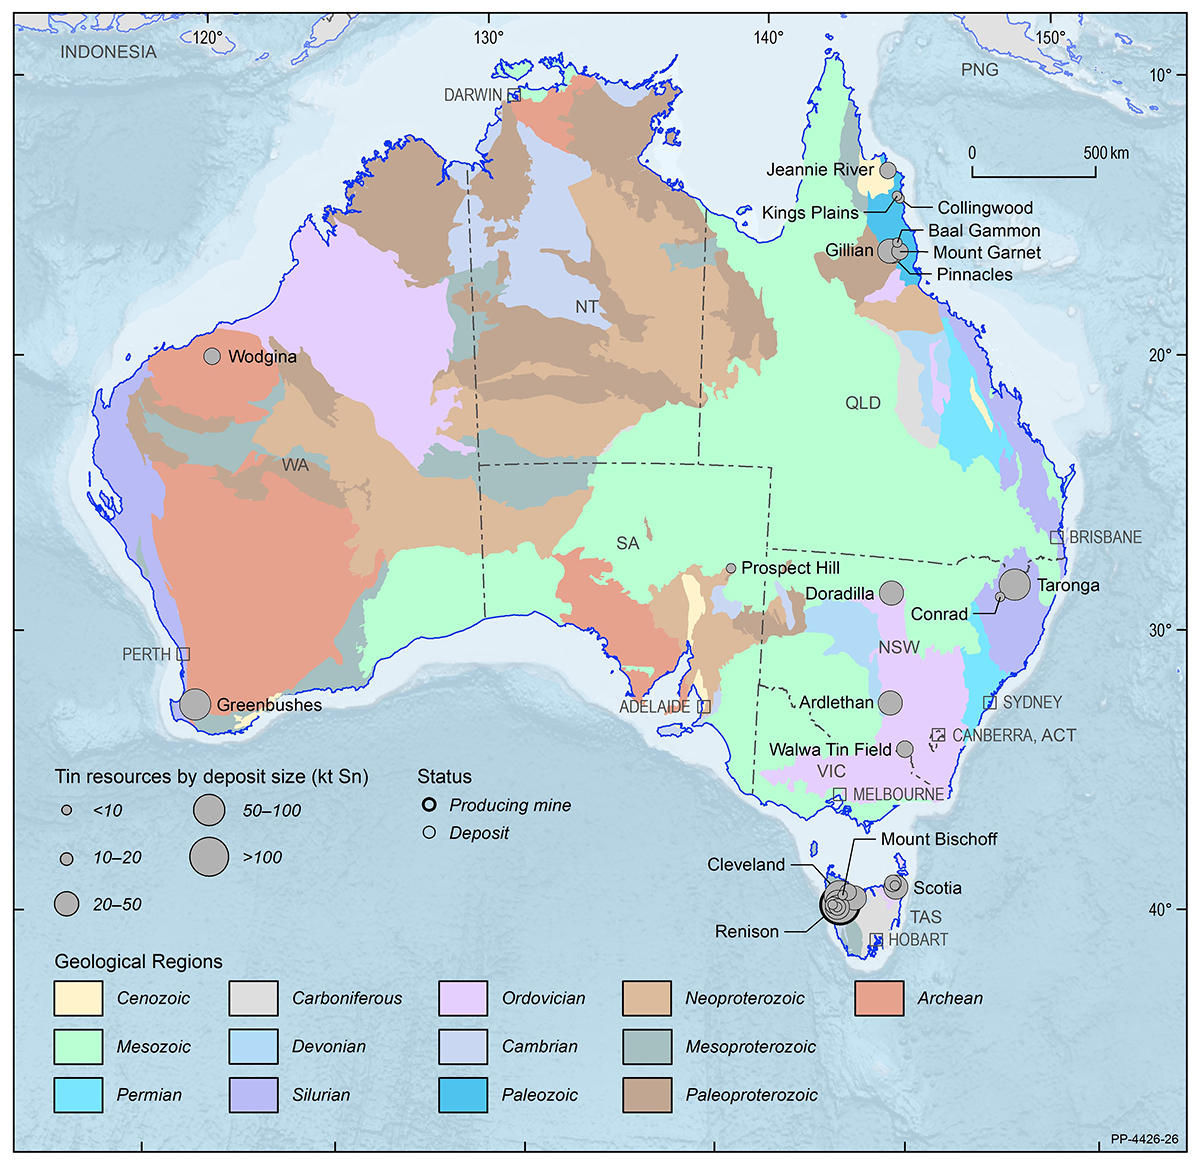
Tin
| EDR 574 kt Sn ( 2%) |
|
| Ore Reserves 301 kt Sn ( 15%) |
| Operating Mines 1 |
|
| Production 8.1 kt Sn ( 7%) |
|
| Export Income $175 m ( -7%) |
| World Ranking | |
| Resources 3 (13%) |
|
| Production 8 (3%) |
Major Uses:
Bronze for electrical products and sculpture, solders, steel coatings, metal alloys, electric vehicles, lead-acid batteries, lithium-ion batteries, superconducting magnets, dyes, disinfectants, perfumes, cast iron, fire retardants, pewter and tinsel.
Abbreviations
kt Sn – kilotonnes of tin content; $m – million dollars (Australian).
Notes
Resource figures are as at 31 December 2020. Operating mines and production are for calendar year 2020. Percentage increases or decreases are in relation to 2019. World rankings are followed by percentage share in brackets. Export income is based on tin concentrate and sourced from Office of the Chief Economist, Resources and Energy Quarterly, December 2021.
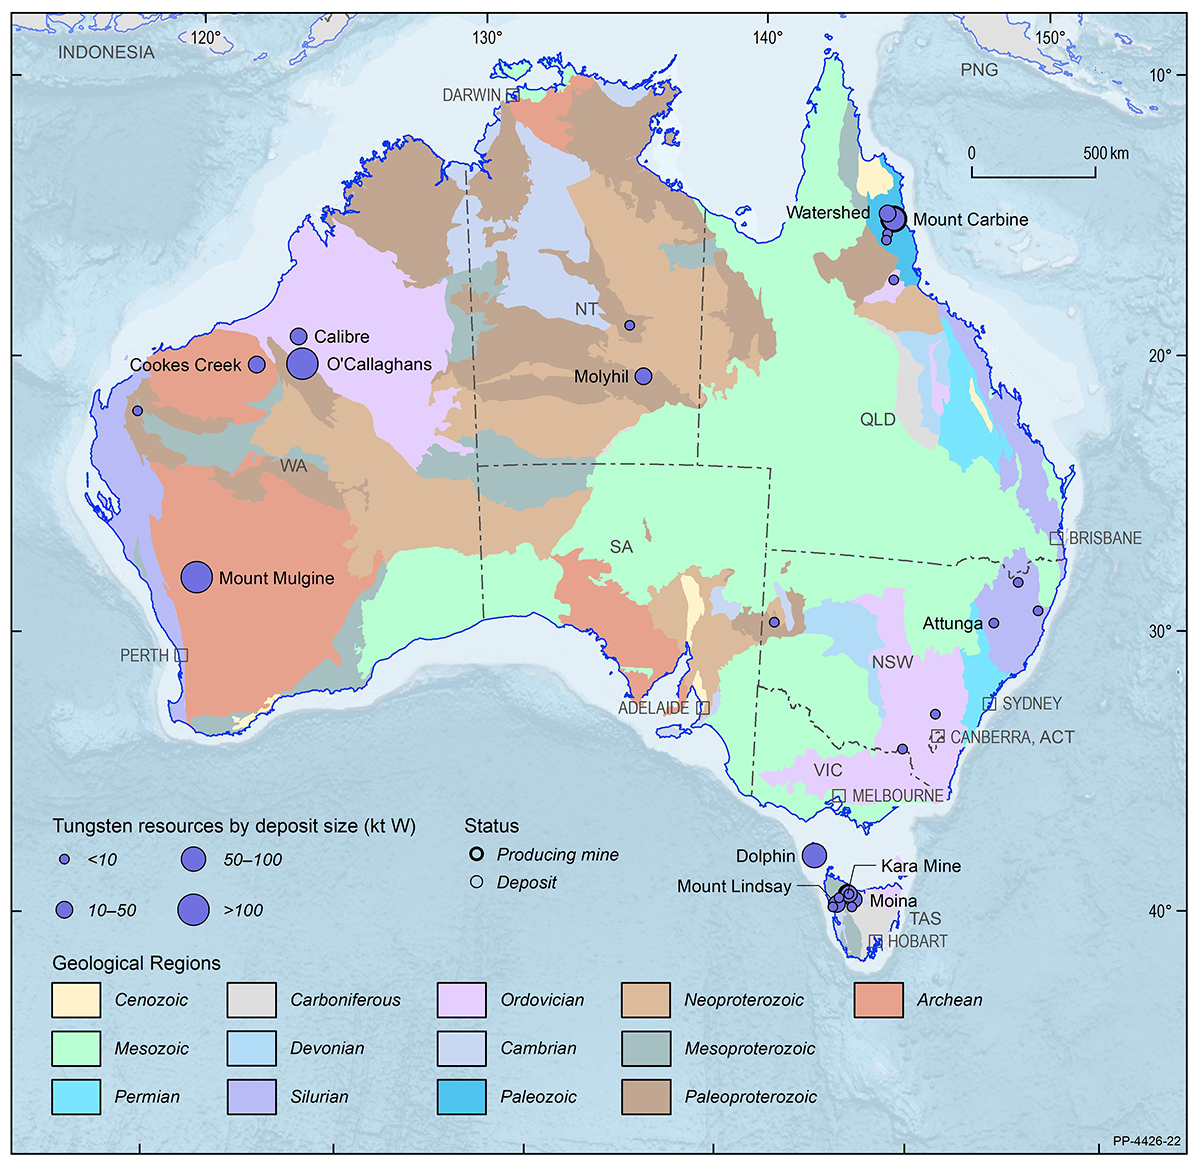
Tungsten
| Critical Mineral | |
| EDR 577 kt W ( 43%) |
|
| Ore Reserves 230 kt W ( 7%) |
|
| Operating Mines 2 |
|
| Production <1 kt W (0%) |
|
| Export Income n.a. |
| World Ranking | |
| Resources 2 (17%) |
|
| Production minor |
Major Uses:
Cemented carbides used in cutting applications and wear-resistant materials, electrodes, filaments (light bulbs), wires and components in electrical, heating, lighting and the aeronautical industry.
Abbreviations
kt W – kilotonnes of tungsten content; n.a. – not available.
Notes
Resource figures are as at 31 December 2020. Operating mines and production are for calendar year 2020. Percentage increases or decreases are in relation to 2019. World rankings are followed by percentage share in brackets.
Uranium
| EDR 1,239 kt U ( 8%) |
|
| Ore Reserves 240 kt U ( -15%) |
| Operating Mines 3 |
|
| Production 6.203 kt U ( -6%) |
|
| Export Income $762 m ( 2%) |
| World Ranking | |
| Resources 1 (31%) |
|
| Production 2 (13%) |
Major Uses:
Fuel for nuclear power reactors, medicine, food-processing, space and defence industry applications.
Abbreviations
kt U – kilotonnes of uranium content; $m – million dollars (Australian).
Notes
Resource figures are as at 31 December 2020. Operating mines and production are for calendar year 2020. Percentage increases or decreases are in relation to 2019. World rankings are followed by percentage share in brackets. Export income is based on uranium oxide (U3O8) and sourced from Office of the Chief Economist, Resources and Energy Quarterly, December 2021.

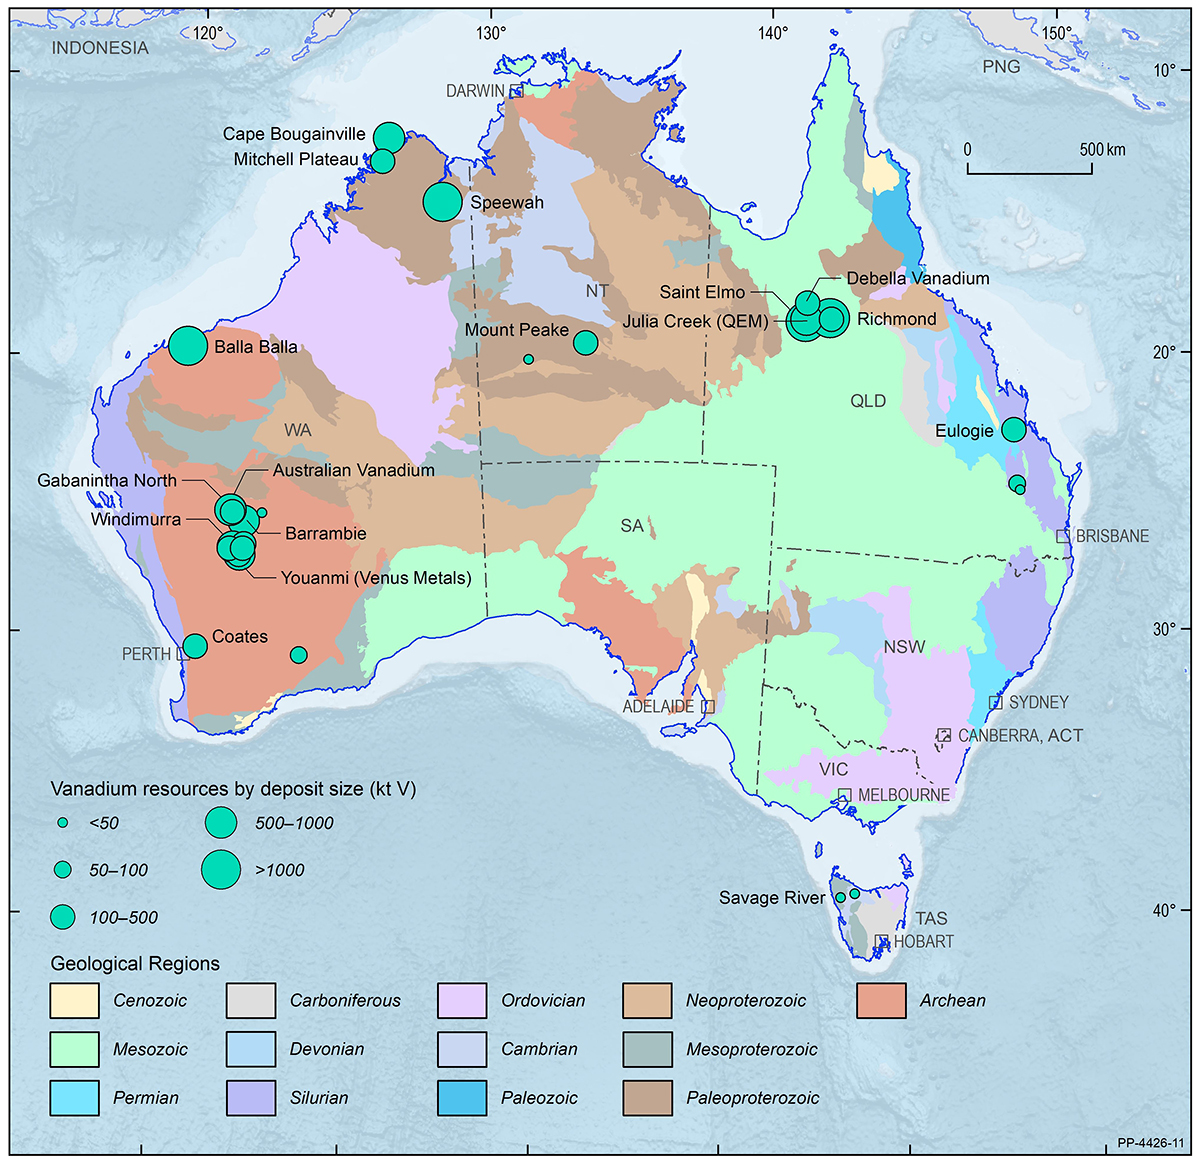
Vanadium
| Critical Mineral | |
| EDR 7408 kt V ( 23%) |
|
| Ore Reserves 1689 kt V ( 9%) |
|
| Operating Mines 0 |
|
| Production 0 kt V (0%) |
|
| Export Income $0 (0%) |
| World Ranking | |
| Resources 2 (29%) |
|
| Production 0 (0%) |
Major Uses:
Alloyed with iron for high-strength steel applications, ceramics, electronics, textiles, fertilisers, synthetic rubber, batteries and alloys used in nuclear engineering and superconductors.
Abbreviations
kt V – kilotonnes of vanadium content.
Notes
Resource figures are as at 31 December 2020. Operating mines and production are for calendar year 2020. Percentage increases or decreases are in relation to 2019. World rankings are followed by percentage share in brackets.