
Mineral Exploration
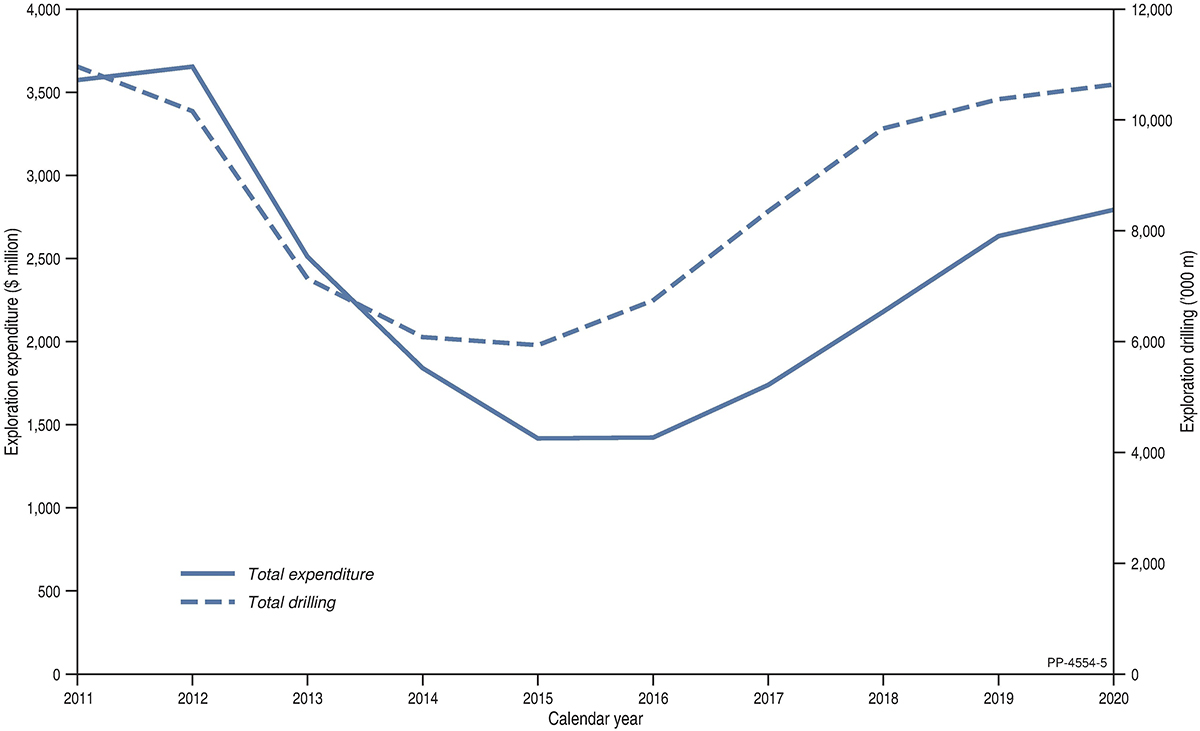
Mineral exploration expenditure in 2020 was impacted by various federal and state health and movement controls implemented to limit the COVID-19 pandemic. Despite this, overall exploration expenditure remained strong in Australia, buoyed in particular by high gold and iron ore prices. Quarterly reports on mineral exploration data published by the Australian Bureau of Statistics13 show that total mineral exploration expenditure for the 2020 calendar year was up 6% to $2,809 million compared to the 2019 calendar year ($2,648 million; Figure 3).
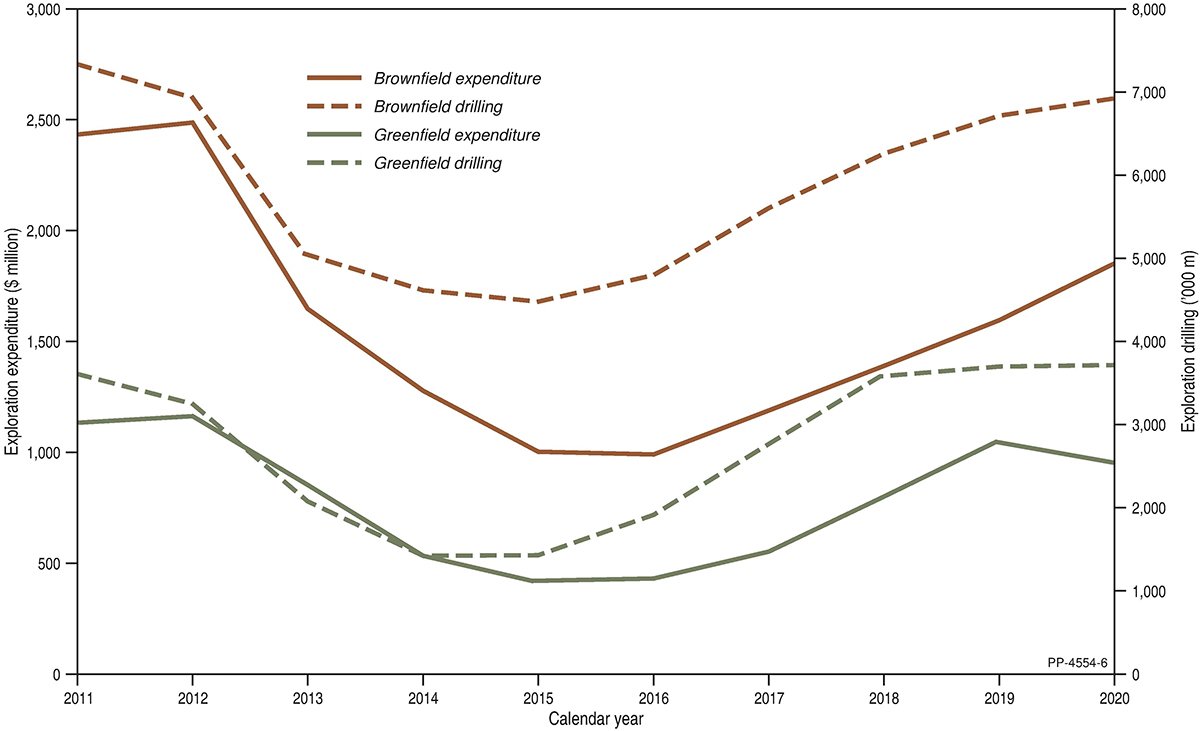
In the search for new mineral deposits, exploration expenditure and drilling in greenfield tenements was down 10% from $1,057 million in 2019 to $957 million in 2020, and metres drilled up 0.7% from 3,712,200 m in 2019 to 3,736,500 m. In contrast, exploration expenditure and drilling around existing deposits (brownfield) was up 16% to $1,851.9 million in 2020 compared to $1,591.7 million in 2019, and metres were up 5% to 6,996,500 m from 6,678,800 m in 2019 (Figure 4).
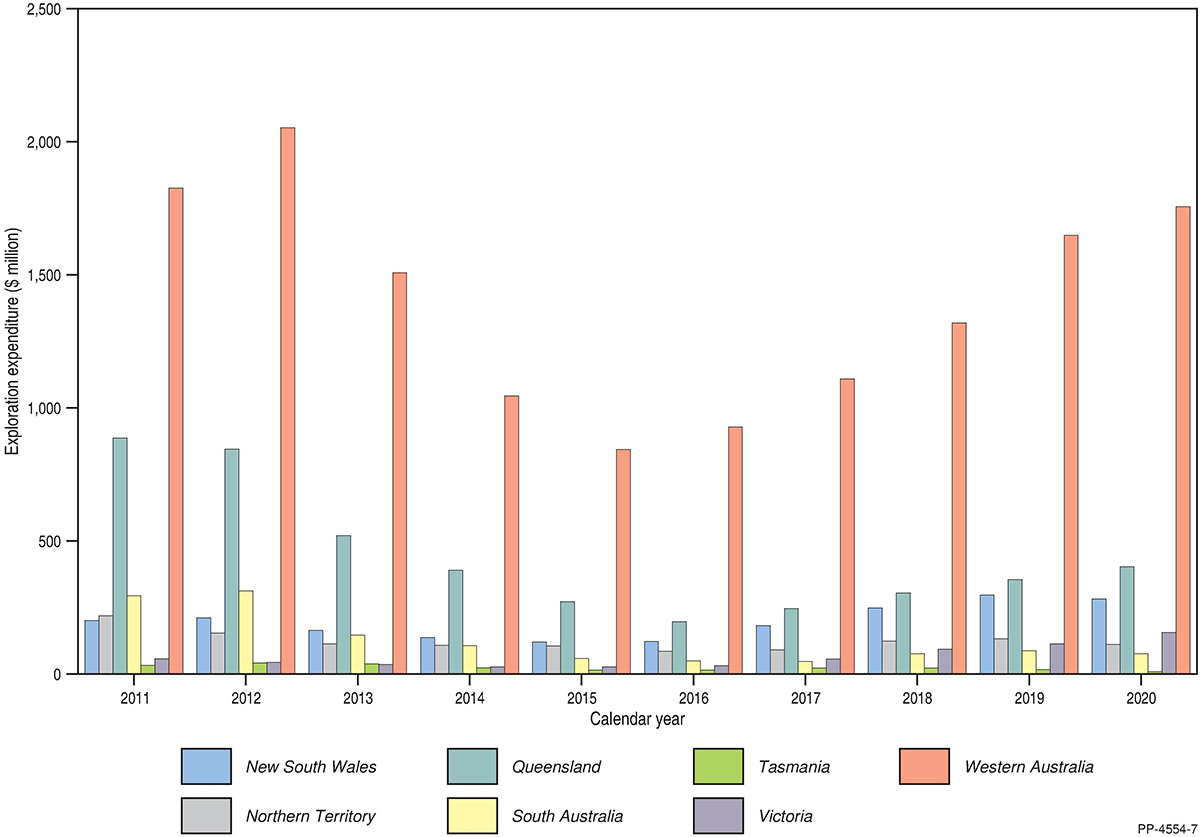
Exploration expenditure in Victoria in 2020 was at its highest level ever recorded—$153 million, up 35% from 2019 ($113 million; Figure 5). Western Australia attracted $1,758 million in exploration expenditure, accounting for 63% of the national expenditure in 2020. Queensland ranked second as an exploration destination with 15% of expenditure, recording an expenditure of $408 million.
Other Australian jurisdictions, however, saw a decrease in exploration during the COVID-19 pandemic in 2020, with Tasmania and the Northern Territory down 33% and 17%, respectively. South Australia (down 8%) and New South Wales (down 3%) were less severely impacted.
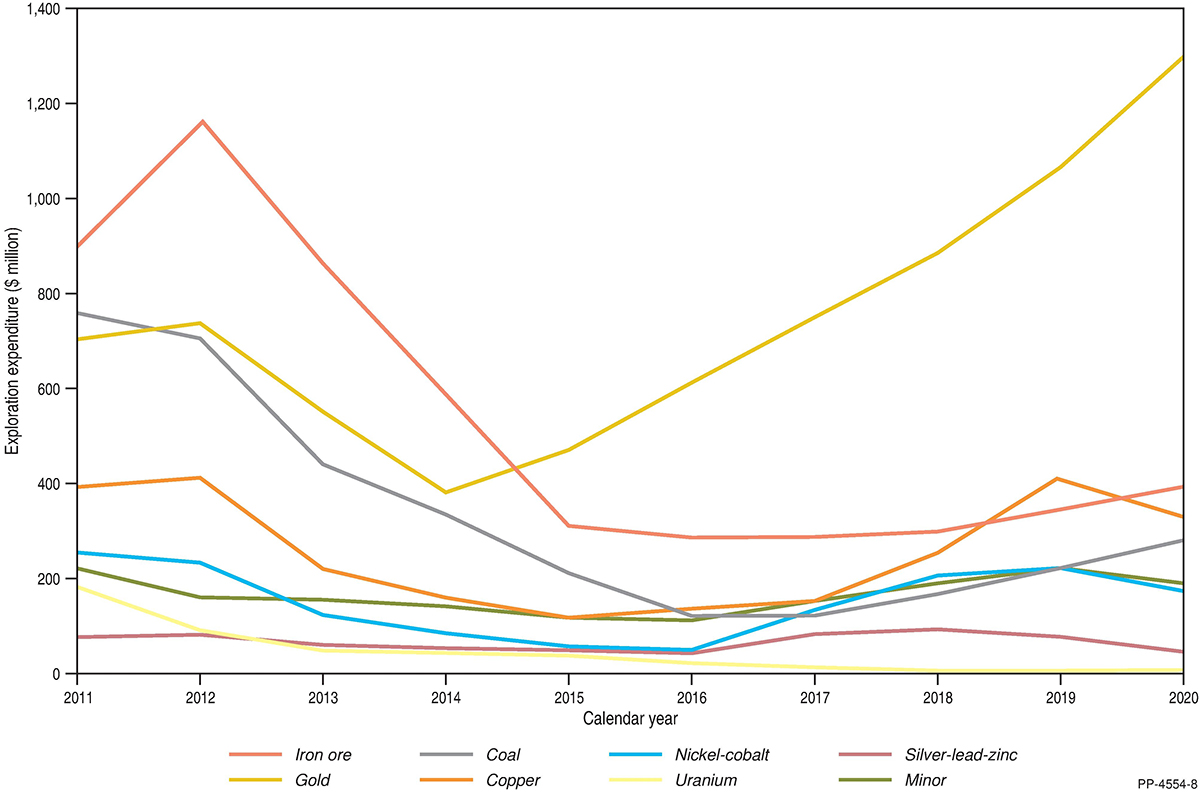
Gold was the most explored for commodity in 2020, accounting for 46% of all mineral exploration expenditure and a new record of $1,316 million (Figure 6). As well as record prices and exploration expenditure, sustained interest in gold over the past six years has led to large tonnages of resources being upgraded to economic categories and Australia’s gold inventory remaining the largest in the world over the past decade.
Iron ore attracted the next largest exploration expenditure in 2020, up 13% to $395 million from $350 million in 2019, followed by copper in third place. Copper actually fell 20% to $334 million in 2020 from $415 million in 2019, when it was the second most popular commodity (Figure 6). Exploration expenditure was also down for coal by 27% to $292 million, nickel by 21% ($181 million), silver-lead-zinc by 36% ($51 million), uranium by 34% ($7 million) and diamonds by 62% ($3 million). Apart from gold and iron ore, only exploration expenditure for mineral sands also increased, by 5.2% to $37 million.
13 ABS, Quarterly Statistics, Mineral and Petroleum Exploration Australia March 2021. (accessed 18 March 2021).