Regional Geology of the Gippsland Basin
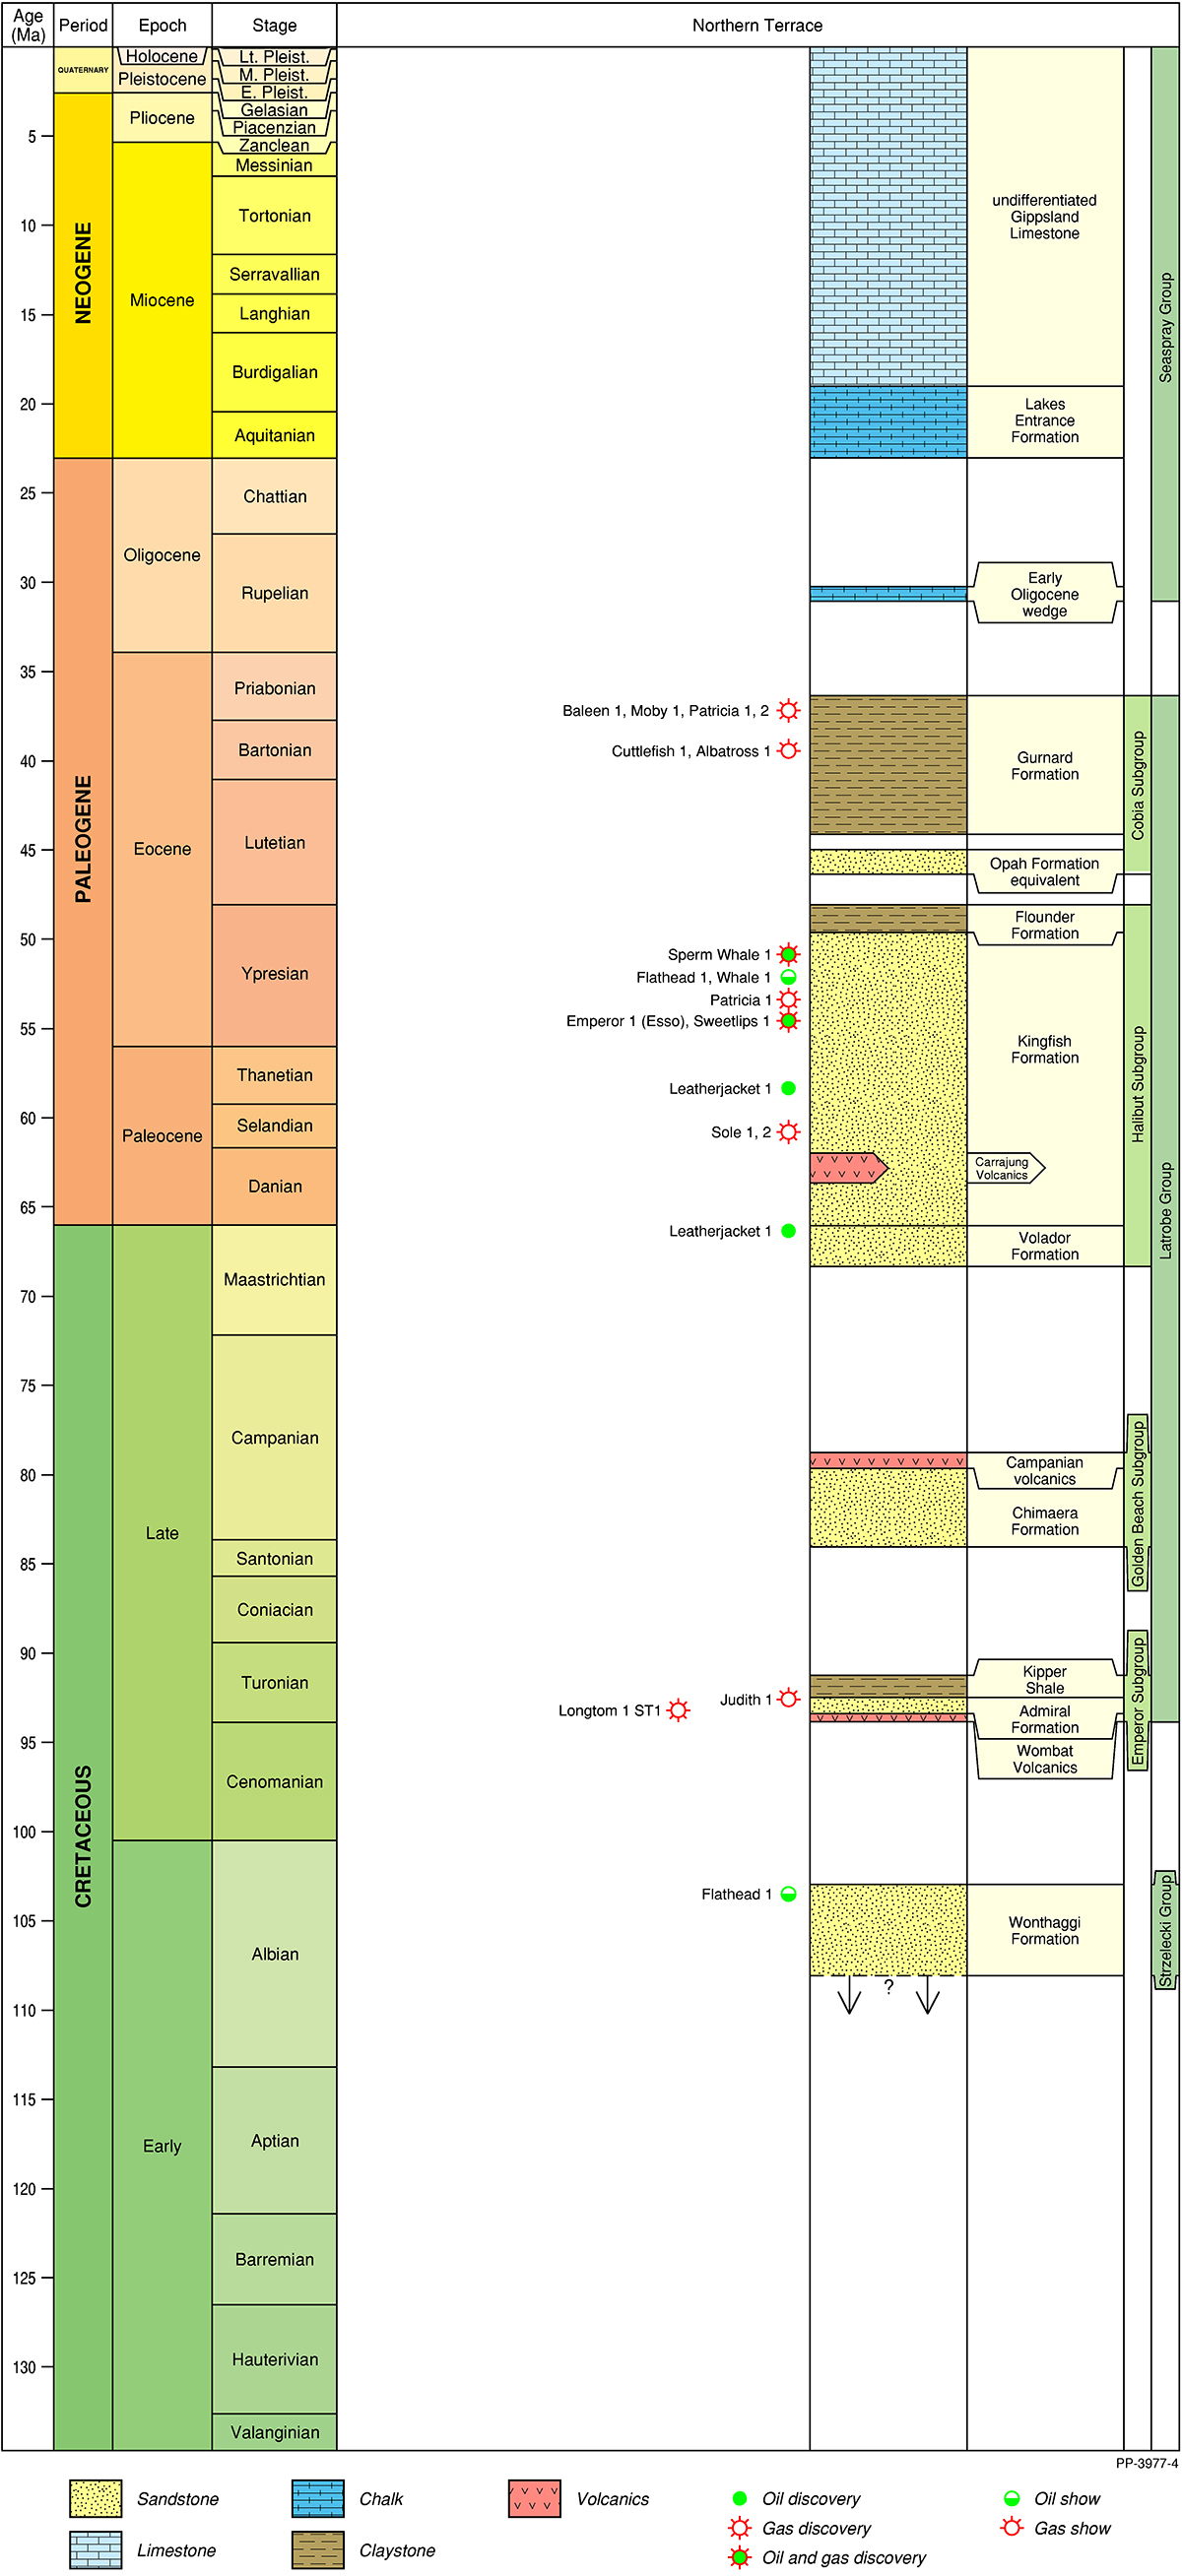
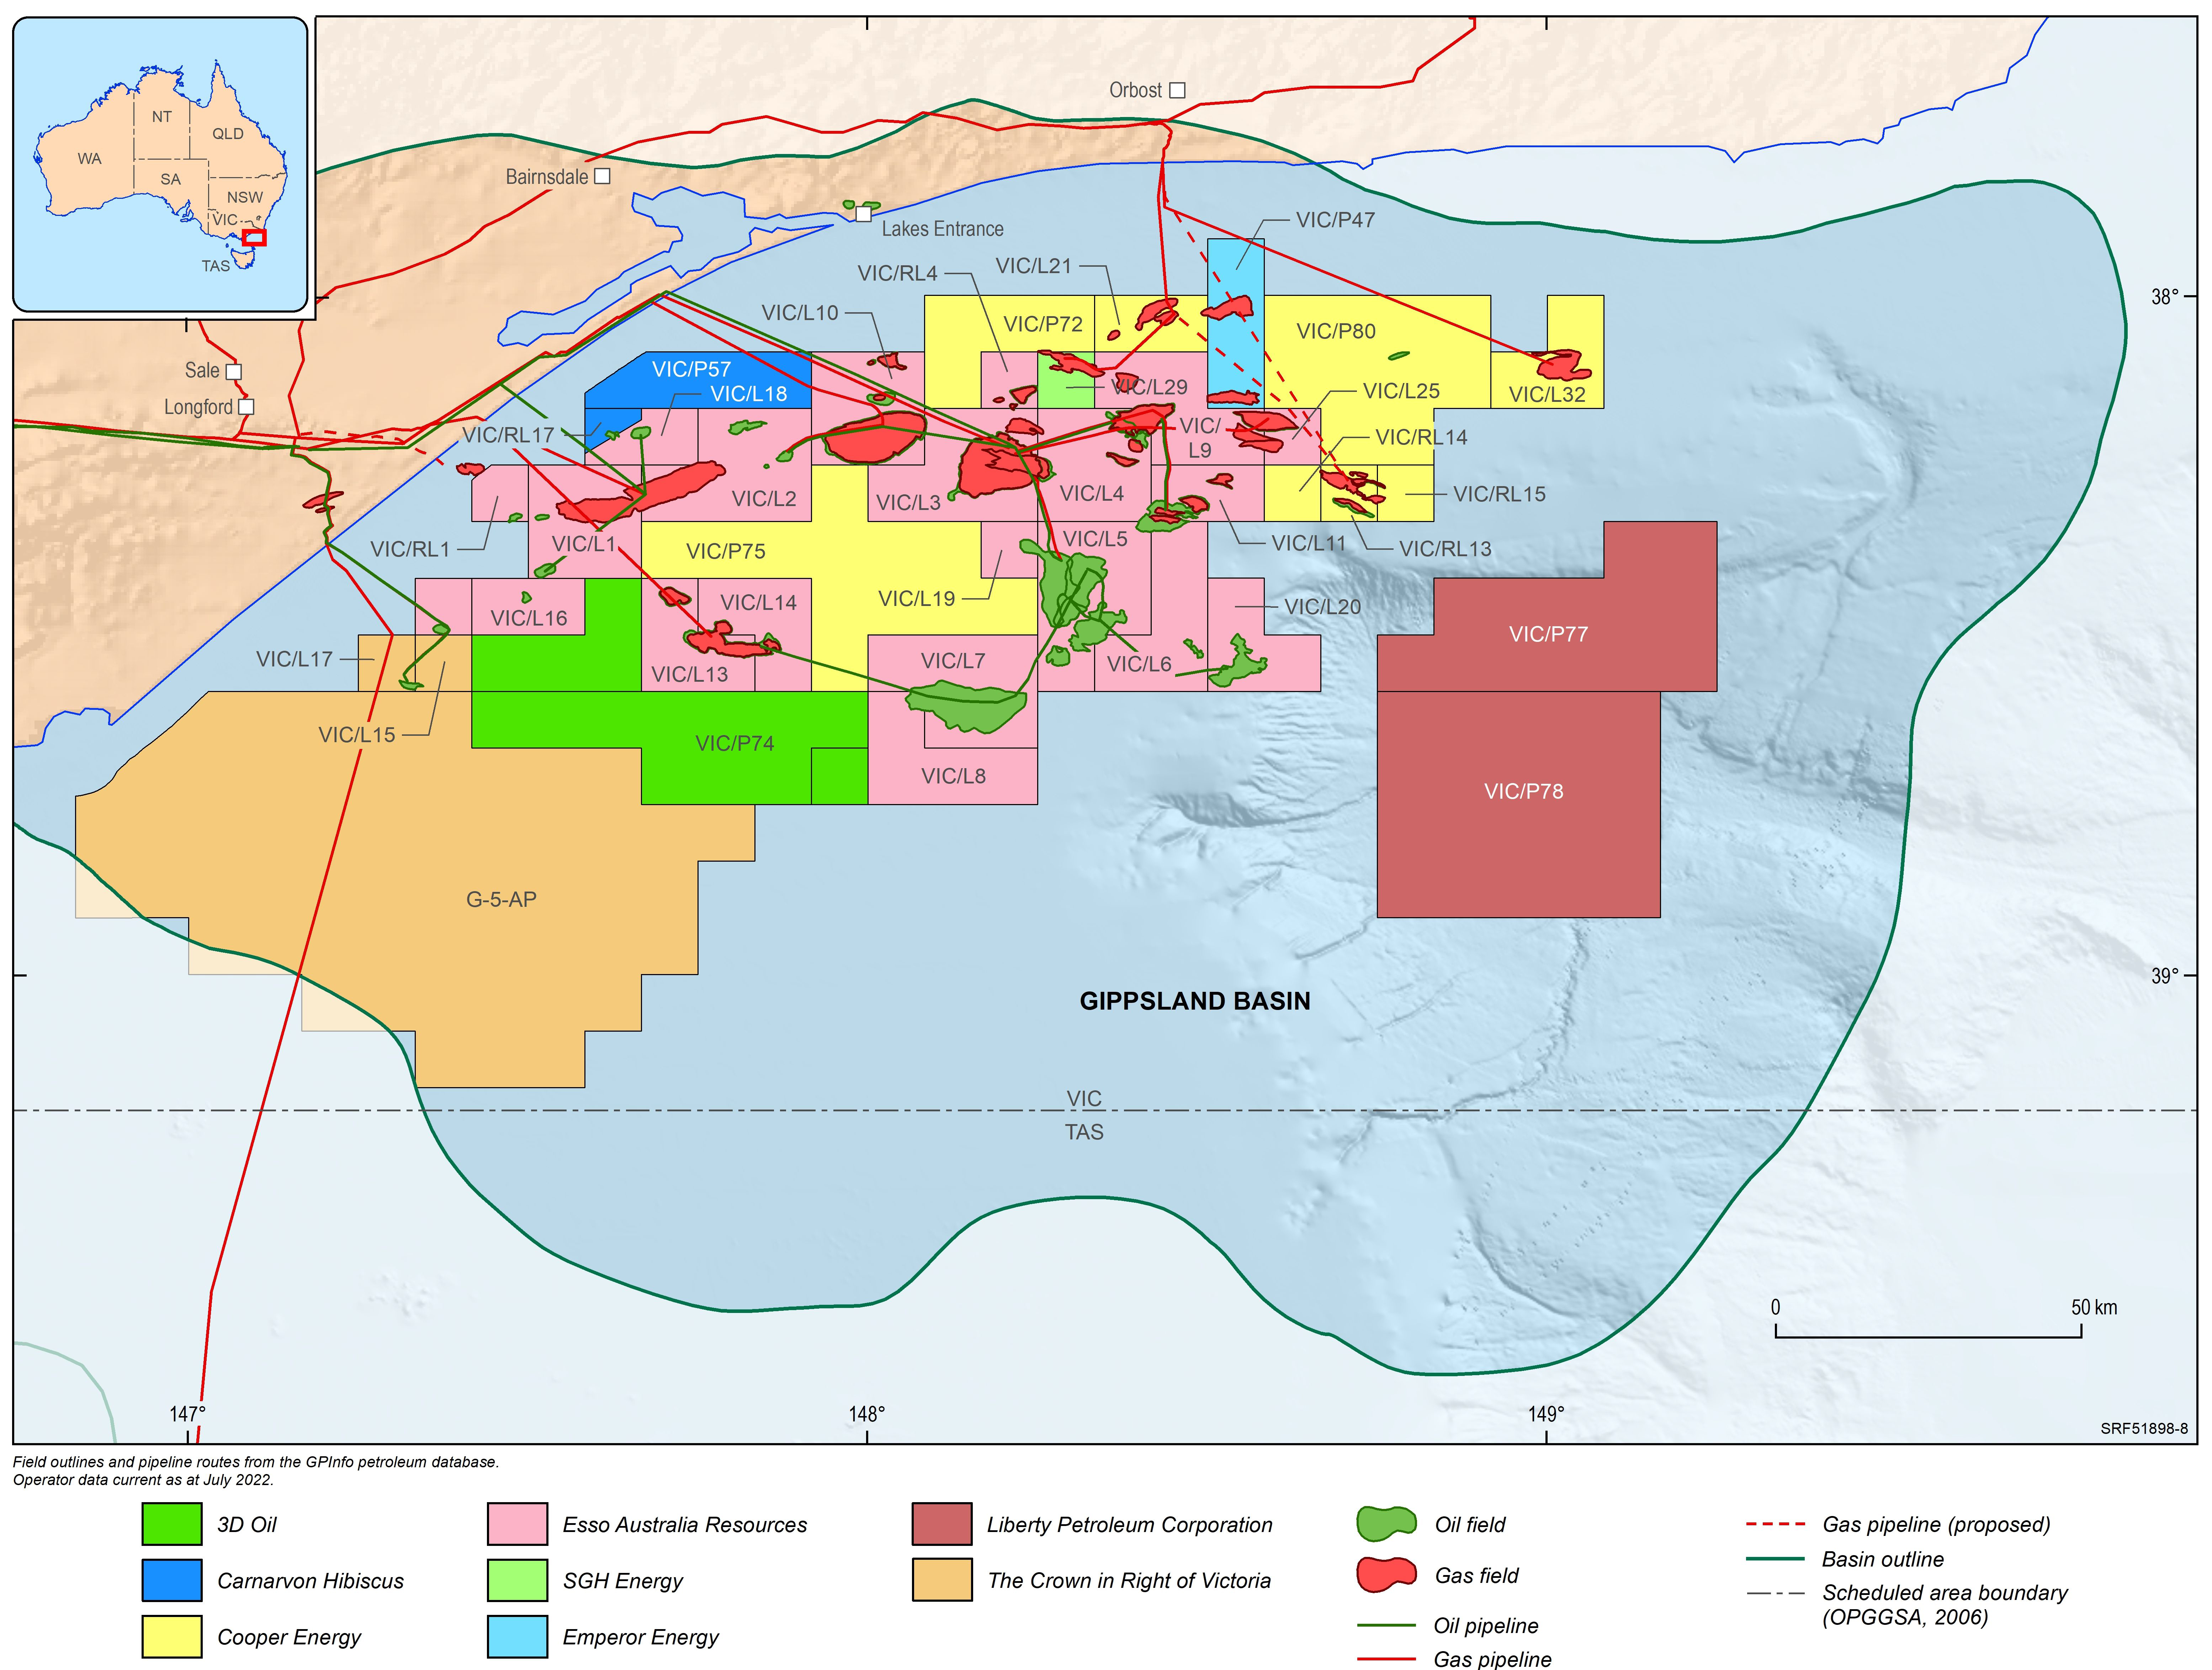
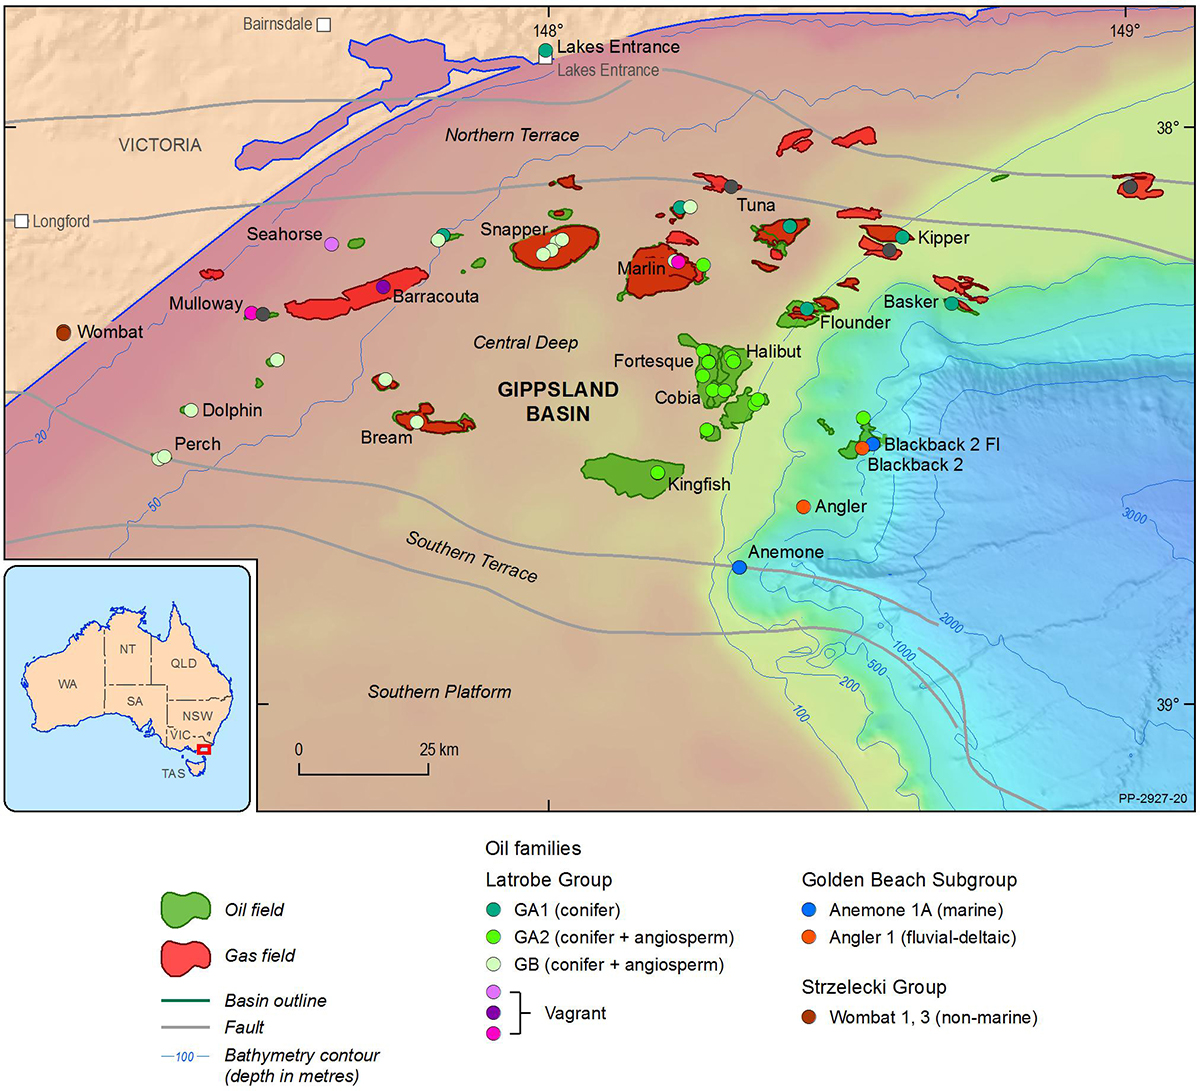
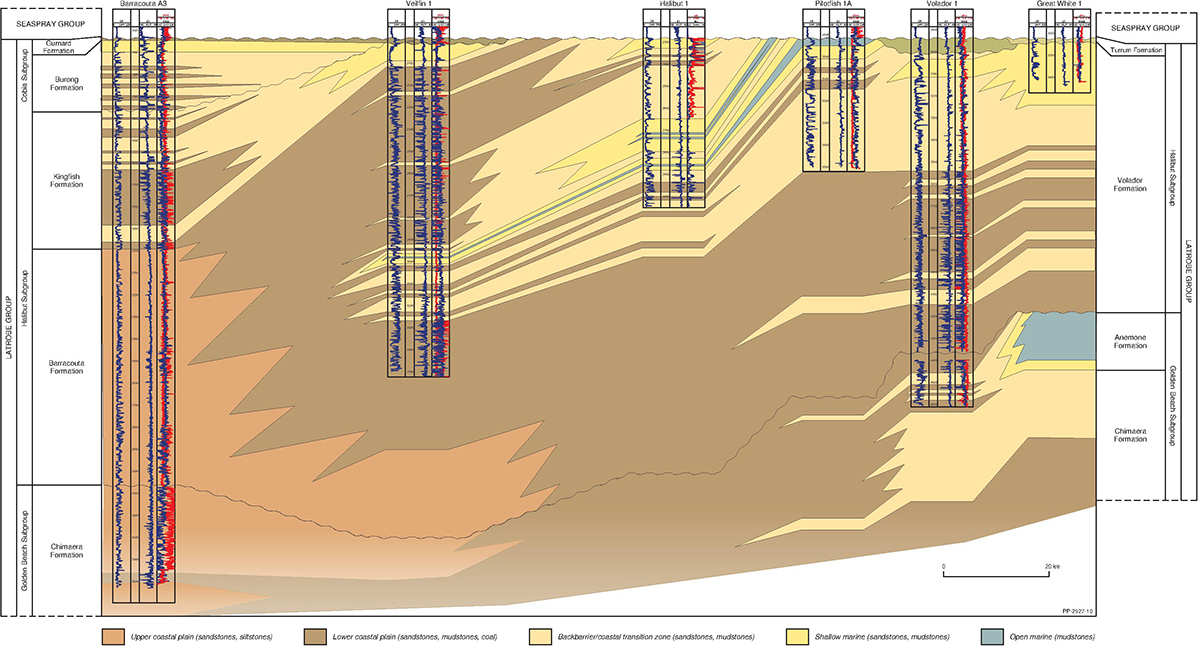
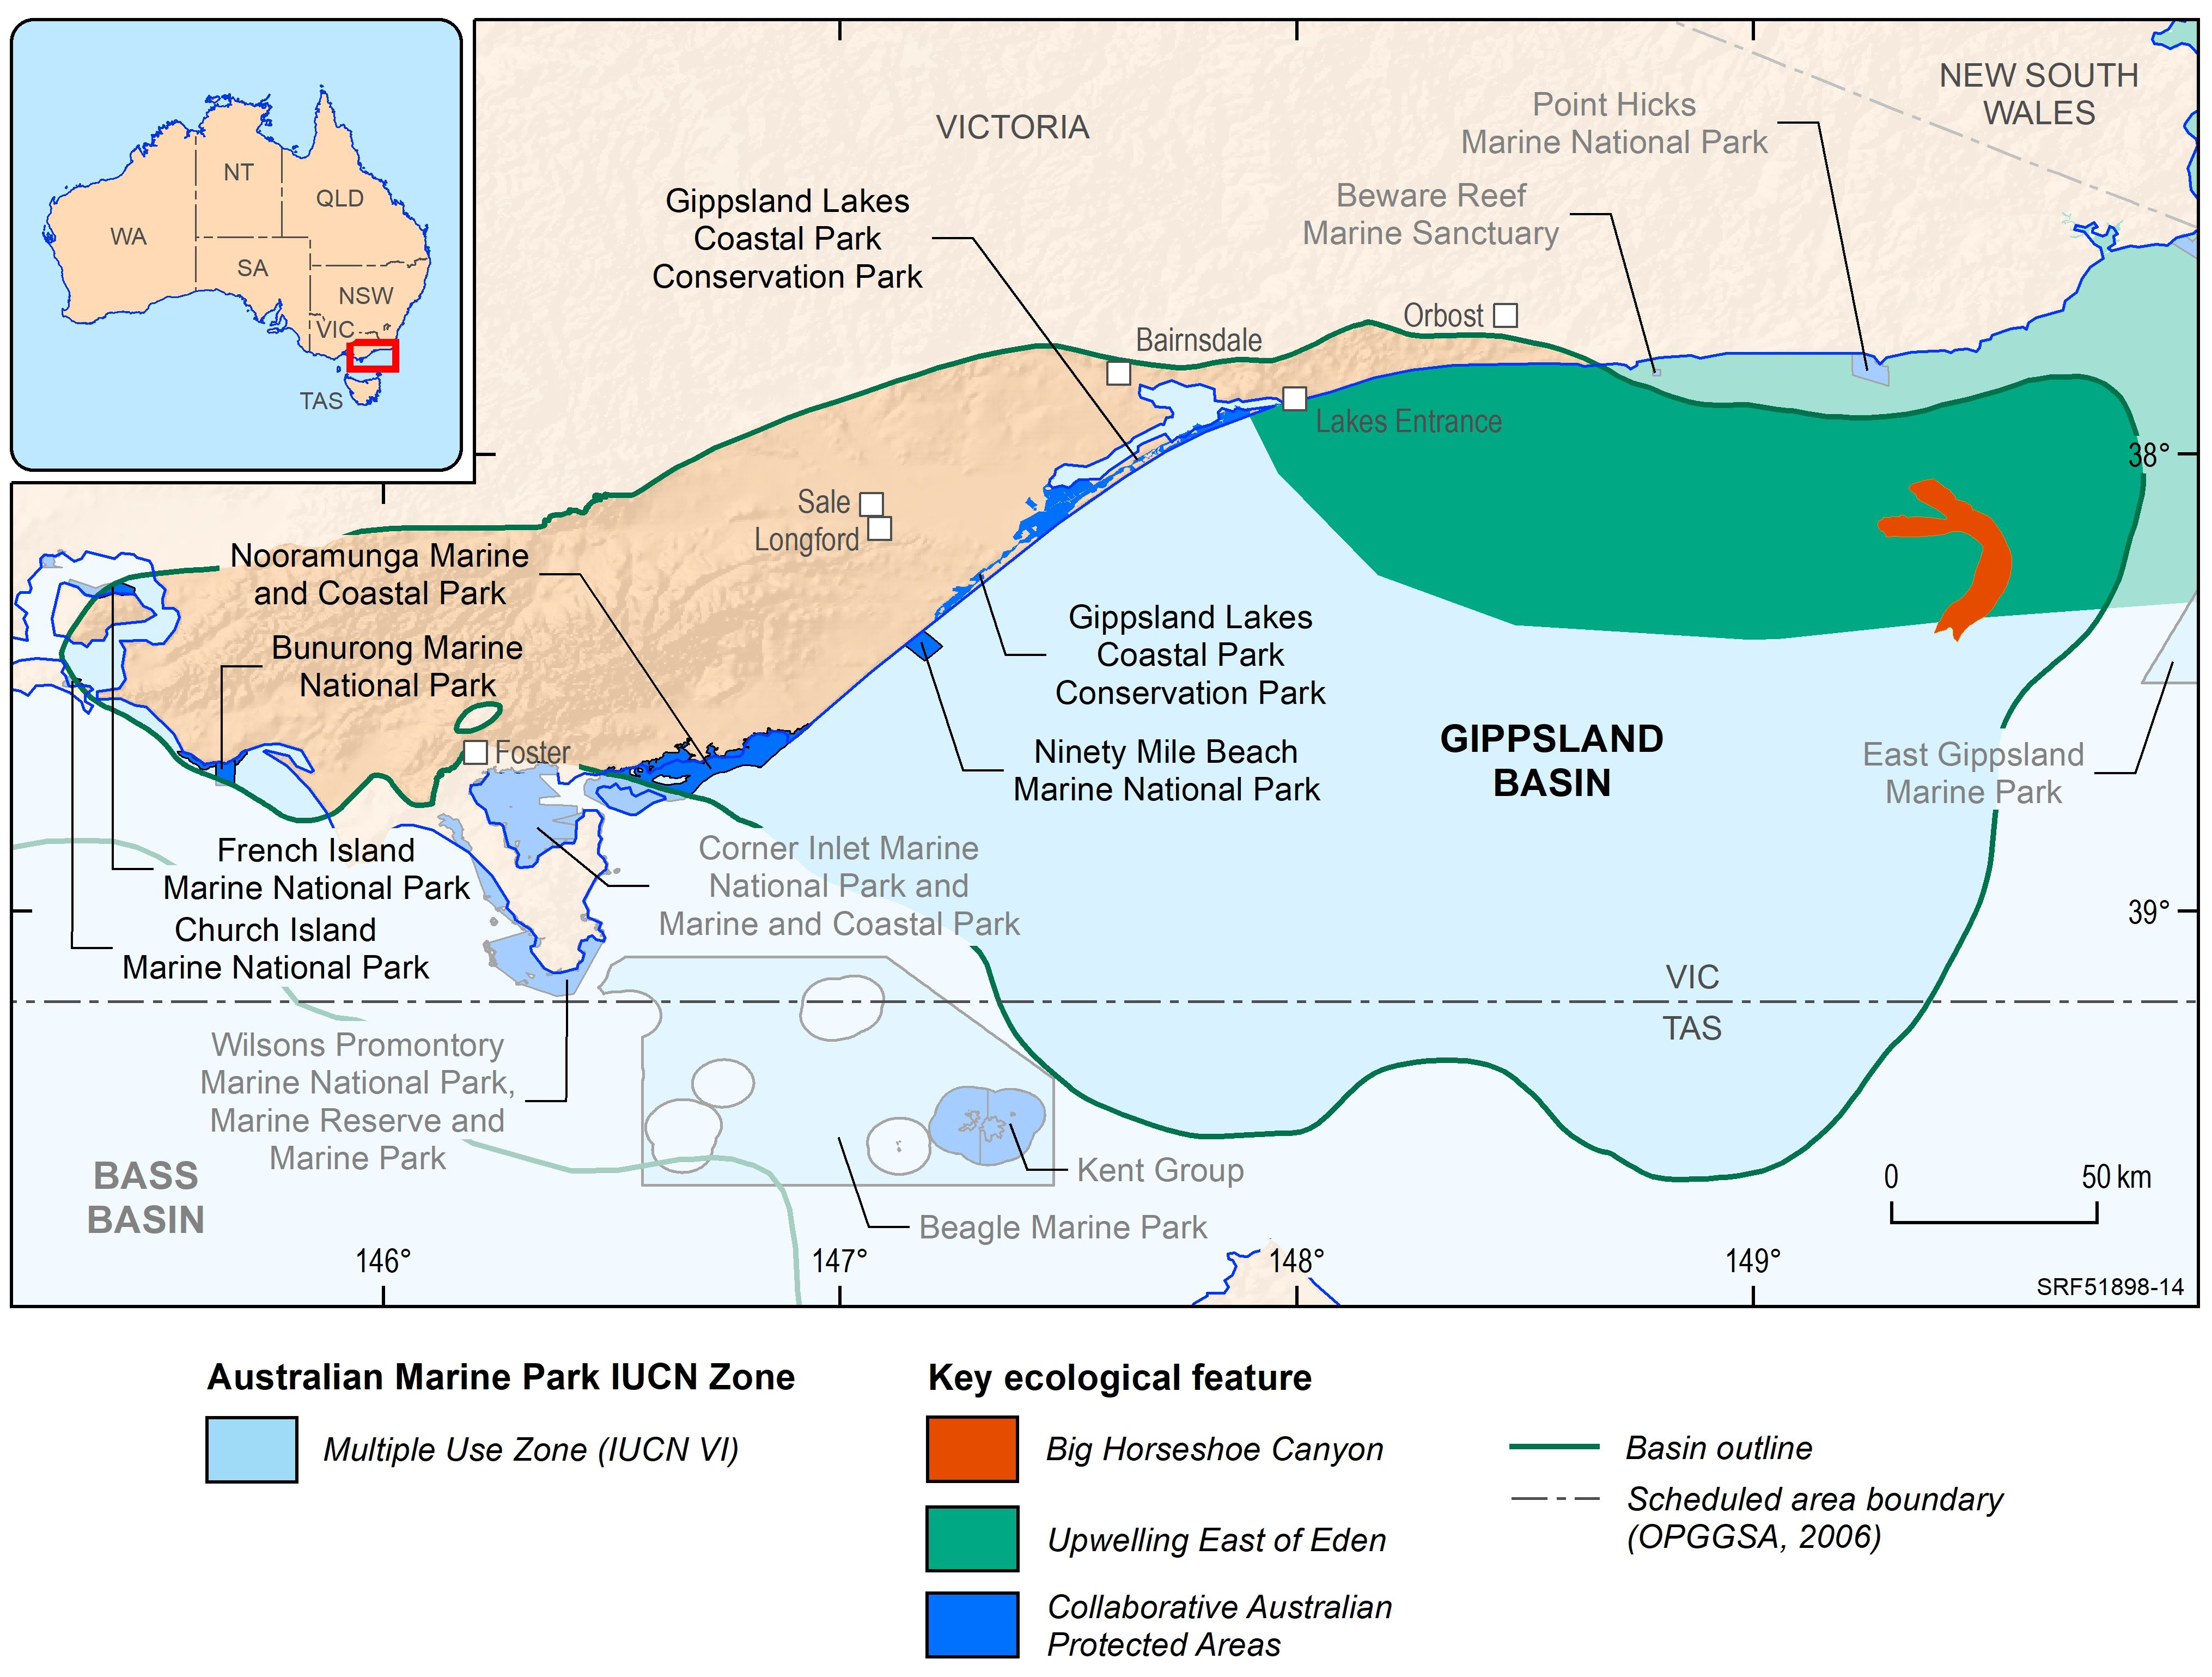
The Gippsland Basin in southeastern Australia is located about 200 km east of the city of Melbourne, covering about 46 000 km2, of which two thirds are located offshore (Figure 1). The Gippsland Basin is recognised as one of Australia’s premier hydrocarbon provinces, having continually produced oil and gas since the late 1960s. In February 2021, remaining reserves were estimated at 1.8 Tcf (51.6 Gm3) of natural gas and ethane, and 109 MMbbls (17.3 GL) of oil and natural gas liquids (EnergyQuest, 2021). Several petroleum systems operate in the basin, with the largest oil and gas fields hosted by top-Latrobe Group (Eocene) shallow marine barrier sandstones, and additional discoveries made in intra-Latrobe Group (Upper Cretaceous–Paleocene) coastal plain and deltaic channel sandstones. Despite its mature status, parts of the basin remain underexplored and offer a variety of untested plays.
-
Note: the full set of high resolution figures are available via the link at the bottom of this page.
Figure 2: Tectonic elements map of the Gippsland Basin showing bathymetry, petroleum well distribution and oil and gas fields.
Figure 3: Map showing petroleum exploration and production permits, oil and gas fields and petroleum production infrastructure in the Gippsland Basin.
Figure 4: Stratigraphic chart for the Gippsland Basin showing hydrocarbon occurrences in the Central Deep, on the Northern Terrace and on the Southern Terrace (Geologic Time Scale after Gradstein et al, 2020).
Figure 5: Stratigraphic chart for the Southern Terrace showing well intersections of hydrocarbons (Geologic Time Scale after Gradstein et al, 2020).
Figure 6: Stratigraphic chart for the western Central Deep showing well intersections of hydrocarbons (Geologic Time Scale after Gradstein et al, 2020).
Figure 7: Stratigraphic chart for the eastern Central Deep showing well intersections of hydrocarbons (Geologic Time Scale after Gradstein et al, 2020).
Figure 8: Stratigraphic chart for the Northern Terrace showing well intersections of hydrocarbons (Geologic Time Scale after Gradstein et al, 2020).
Figure 9: Map showing the current main operators, active exploration permits, retention leases and production licences
Figure 10: Map showing the distribution of oil families in the Gippsland Basin (after Edwards et al, 2016).
Figure 11: Well correlation diagram from the western Central Deep (Dolphin 1) to the northern flank of the Bass Canyon (Great White 1) showing depositional facies relationships.
Figure 12: Well correlation diagram from the western Central Deep (Barracouta A3) to the edge of the Bass Canyon (Billfish 1) showing depositional facies relationships.
Figure 13: Dendrogram showing distinct source rock groups using bulk carbon isotopes and molecular (biomarker) analyses from selected wells. Orange: Chimaera Formation source rock (CFSR) extracts that have mixed land-plant and lacustrine signatures consistent with deposition in a lower coastal plain facies. Green: Volador Formation source rocks (VFSR) with strongly terrestrially influenced oxic depositional environment. Blue (comprising two sub-groups): Anemone Formation source rocks (AFSR) were deposited in sub oxic to oxic environments containing mixed marine algal and terrestrial higher plant derived organic matter (after Edwards et al, 2016).
Figure 14: Dendrogram showing Latrobe Group oil-source correlations using bulk carbon isotopes and molecular (biomarker) analyses from selected wells. Orange: Angler 1 and Blackback 2 oils have mixed land-plant and lacustrine signatures that show similarity to lower coastal plain source rocks from the Chimaera Formation (CFSR) in the deepest sections (T. lilliei biozone) at Volador-1 and Hermes-1. These samples plot separately from the Central Deep oils that have a terrestrial fingerprint. Blue: Anemone 1A oil and Blackback 2 fluid inclusion oil show most similarity to Anemone Formation source rocks (AFSR) with mixed marine/terrestrial signatures. Green: the geochemical signature of the Volador Formation source rocks (VFSR) deposited in strongly oxic environments and containing terrestrial higher plant remains does not correlate with any oil (after Edwards et al, 2016).
Figure 15: Oil-source correlations for selected wells. The δ13C isotope values of the Anemone 1 oil (blue) fall within the range of values exhibited by the marine Anemone Formation source rock extracts (after Edwards et al, 2016).
Figure 16: Oil-source correlations for selected wells. The δ13C isotope values of the Angler 1 oil (orange) is most similar to the source rock extract of the Chimaera Formation at 3369m in Omeo 1 ST1, but is somewhat different to other extracts of this formation in other wells (after Edwards et al, 2016).
Figure 17: Oil-source correlations for selected wells. The δ13C isotope values of the Volador Formation source rock extracts (green) show a wide range in values and envelop those of the Chimaera and Anemone formations. The isotopic values of the oils from the Bream and Halibut fields fall in between the range displayed by the Anemone 1 and Anger 1 oils (after Edwards et al, 2016).
Figure 18: Map showing marine reserves, marine parks, multiple use zones and ecological features in the Gippsland Basin.
Download Report [DOCX 135.0 KB] Download Figures [ZIP 21.6 MB]
For information on the 2021 acreage release areas in the Gippsland Basin visit the Department of Industry, Science, Energy and Resources website.