Explainer What is elevation data?
Page last updated:4 November 2026
Elevation data describes the height and shape of the Earth's surface. It helps us understand the landscape, from mountains and valleys to waterways, vegetation and built environments.
This page explains the technologies and datasets behind elevation data, including LiDAR, point clouds, digital elevation models (DEMs) and Shuttle Radar Topography Mission (SRTM) data.
The availability, resolution, extent and currency of elevation data vary across Australia, depending on the dataset, location and source.

What does elevation data reveal?
Analysis of elevation data can reveal patterns in the landscape that may not be immediately apparent from maps or imagery alone. It can help determine:
- the height, shape and slope of terrain
- where ridges, valleys and depressions occur
- how water is likely to move across the landscape
- vegetation structure and density
- the location and composition of the built environment.
Elevation data is a foundation geospatial dataset for understanding and modelling the landscape. This information supports applications that include flood and bushfire modelling, catchment management, environmental planning, infrastructure design, water management and scientific research.
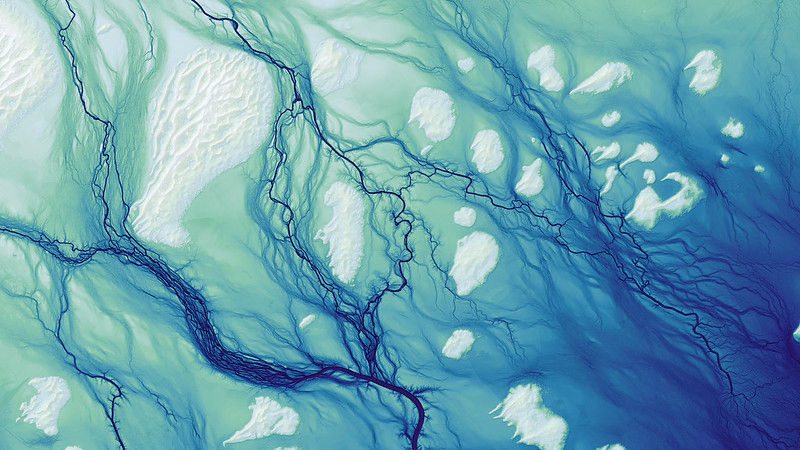
LiDAR-derived image Cooper Creek northeast of Lake Yamma Yamma, Queensland. Photograph by Daniel Coe, using elevation data from Geoscience Australia’s ELVIS Elevation Information System.
What is LiDAR?
LiDAR (Light Detection and Ranging) is a remote sensing technology commonly used to measure the height and shape of the Earth's surface. It is an important source of high-resolution elevation data.
An aircraft carrying a LiDAR sensor sends millions of laser pulses towards the ground. The sensor measures the time it takes for each pulse to return after reflecting from the ground, vegetation, buildings or other features.
These measurements are combined to create a three-dimensional point cloud containing millions of individual points that describe the landscape. The points can then be processed to create detailed elevation models of the terrain.
Two common types of LiDAR are:
Topographic LiDAR — uses near-infrared laser light to measure land elevations and surface features. Geoscience Australia works with data custodians across the country to bring together high-quality topographic LiDAR data and make it available through the ELVIS Elevation Information System.
Bathymetric LiDAR — uses green laser light that can penetrate water to measure shallow seabeds, riverbeds and coastal environments. Geoscience Australia collaborates with government agencies, researchers and industry across Australia to make a wealth of bathymetry data, including bathymetric LiDAR, openly available via the AusSeabed Marine Data Portal.
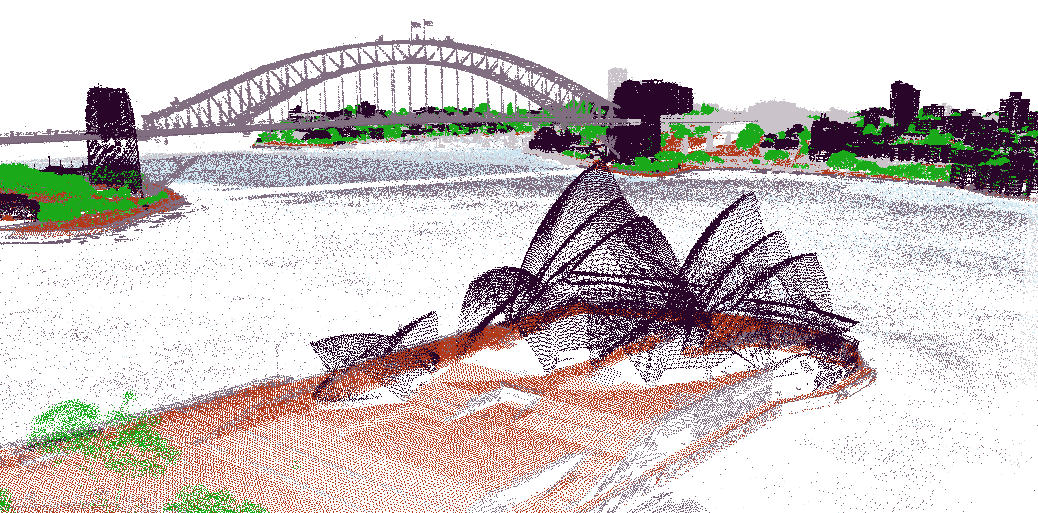
LiDAR point cloud of the Sydney Opera House and surrounding Sydney Harbour, showing individual measurements of the landscape, vegetation and built environment. This data was captured in a Sydney 2020 survey by NSW Government Spatial Services and is available through ELVIS.
What are digital elevation models (DEMs)?
LiDAR point clouds consist of data returned from many different features, including the ground, trees, buildings and other surface features. These points can be classified and processed to create different types of elevation models.
Common types of elevation model include:
Digital Elevation Model (DEM) — representing the bare-earth surface, with features such as buildings and vegetation removed. Bare-earth elevation models are widely used to model how water moves across the landscape, revealing flow paths, drainage networks, catchments and areas where water may collect.
Digital Surface Model (DSM) — representing not just the bare ground, but also trees, buildings, bridges, power lines and other structures. This type of model provides a snapshot of the visible landscape at a certain moment in time.
Building Height Model (BHM) — representing the height and extent of buildings and other built structures above the ground.
Canopy Height Model (CHM) — representing the height of vegetation above the ground surface. CHMs are used for forestry inventory, biomass estimation, and urban tree management.
What is SRTM data?
SRTM (Shuttle Radar Topography Mission) data is derived from radar measurements collected by the Space Shuttle Endeavour in 2000. It provides a consistent digital model of the Earth's surface across much of the world and is also used as a source of elevation information.
SRTM data is available at a relatively coarse resolution compared with high-resolution LiDAR-derived datasets. This means it is useful for understanding broad patterns of terrain but may not capture smaller features of the landscape in the same detail as higher-resolution elevation data.
Combining datasets with different resolutions can require specialised processing to create a seamless elevation model, particularly where water-flow modelling depends on the surface joining correctly across dataset boundaries.
Learn more
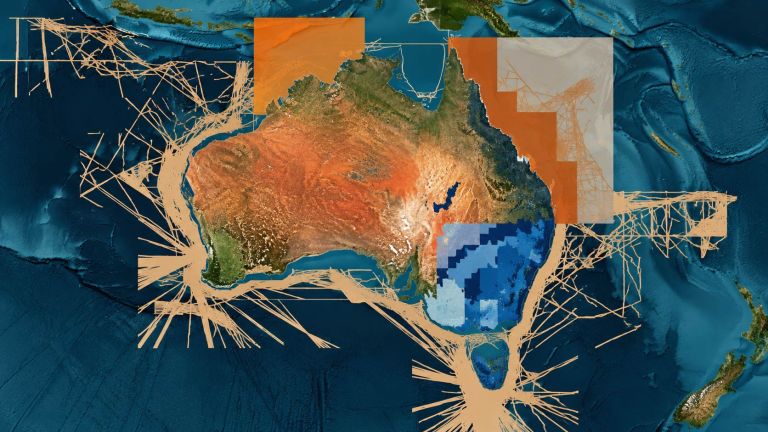
Discover and access trusted elevation data from across Australia for planning, research, modelling, environmental management and decision-making.
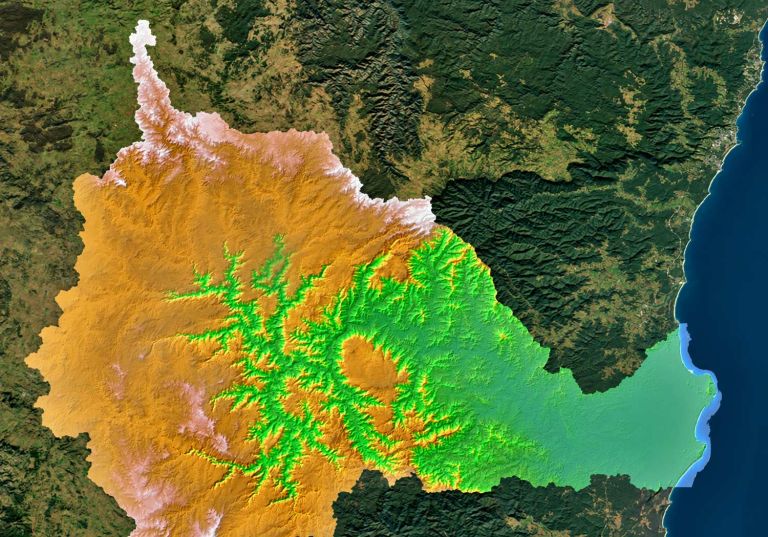
Explore high-resolution catchment elevation datasets to understand how water moves across the landscape and support planning and environmental management.
Scientists use sonar, LiDAR, satellite imagery and autonomous systems to collect bathymetry data and map the depth and shape of the seabed.