Knowledge article How topographic maps are made
Page last updated:4 November 2026
Topographic maps combine geographic data about Australia’s landscape, including elevation, waterways, roads, buildings and vegetation. Geoscience Australia brings this information together to create accurate, nationally consistent maps.
A topographic map is a detailed representation of an area of land. Unlike a basic street map, it shows both features on the ground and the shape of the terrain.
Creating one involves bringing together geographic information from many sources, applying common standards and using cartographic expertise to make complex data clear and useful.
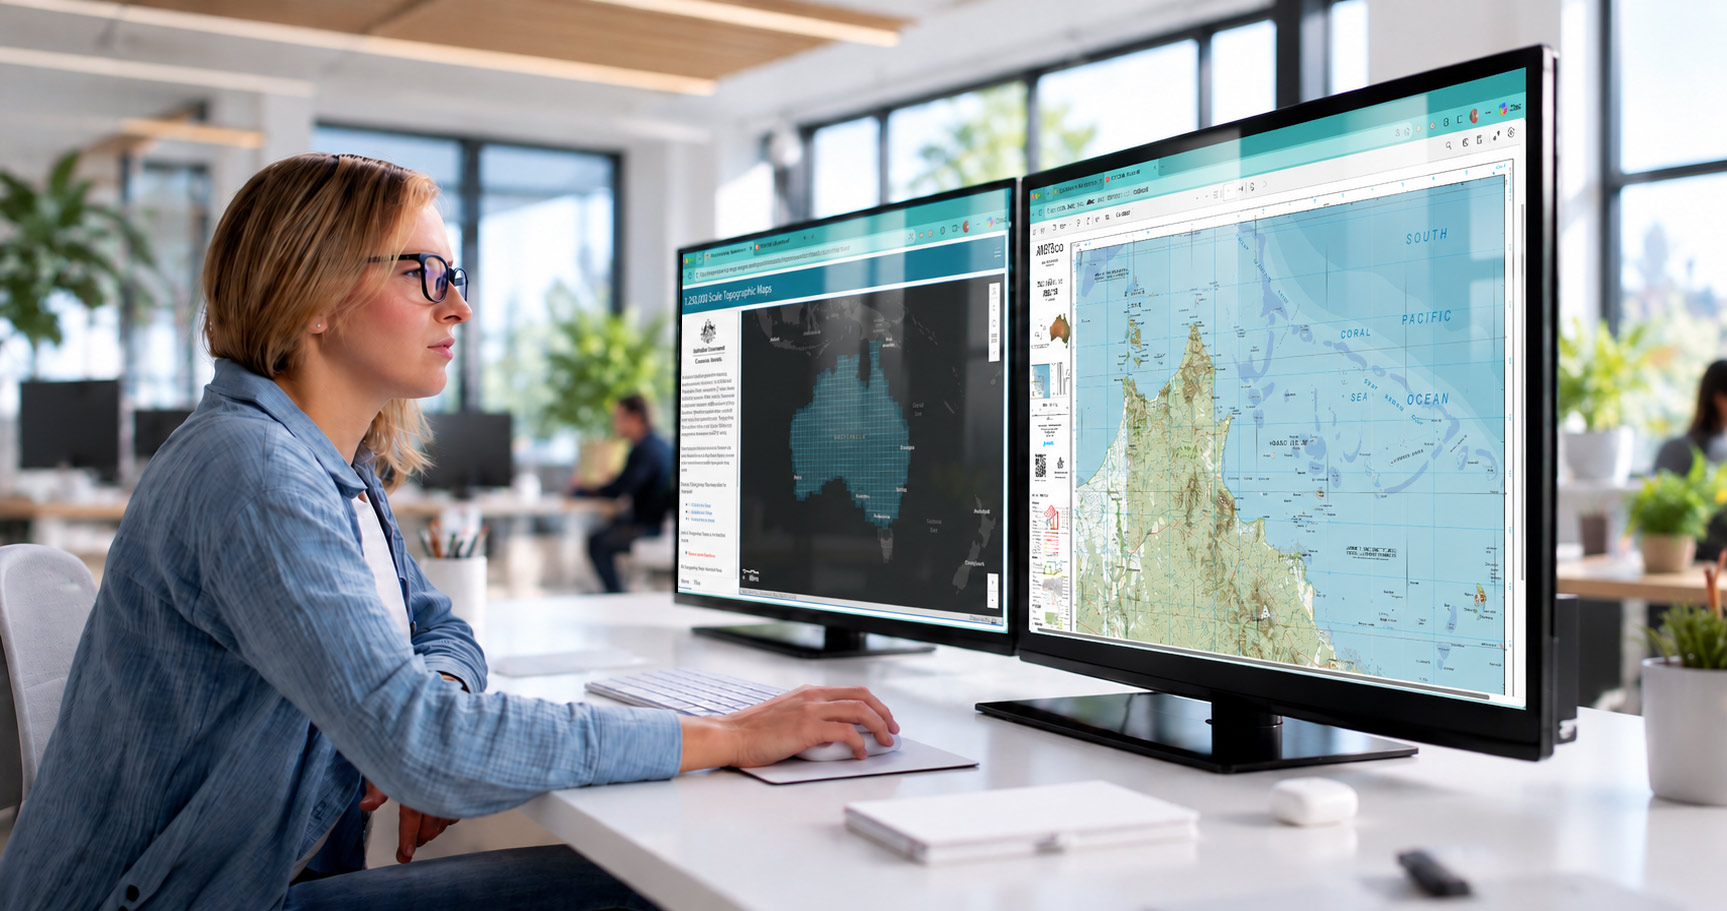
Step 1: Collect geographic data
Every map starts with bringing trusted data together to create a consistent national picture.
Information is gathered from sources that include:
- Government datasets
- Aerial photography and satellite imagery
- Surveys
- Digital elevation models
- Information about roads, watercourses, buildings, vegetation, landforms, boundaries and place names.
Much of this information is maintained by different organisations. Because landscapes and infrastructure change over time, data is regularly updated to keep maps accurate and useful.
Learn more about national foundation geospatial data.
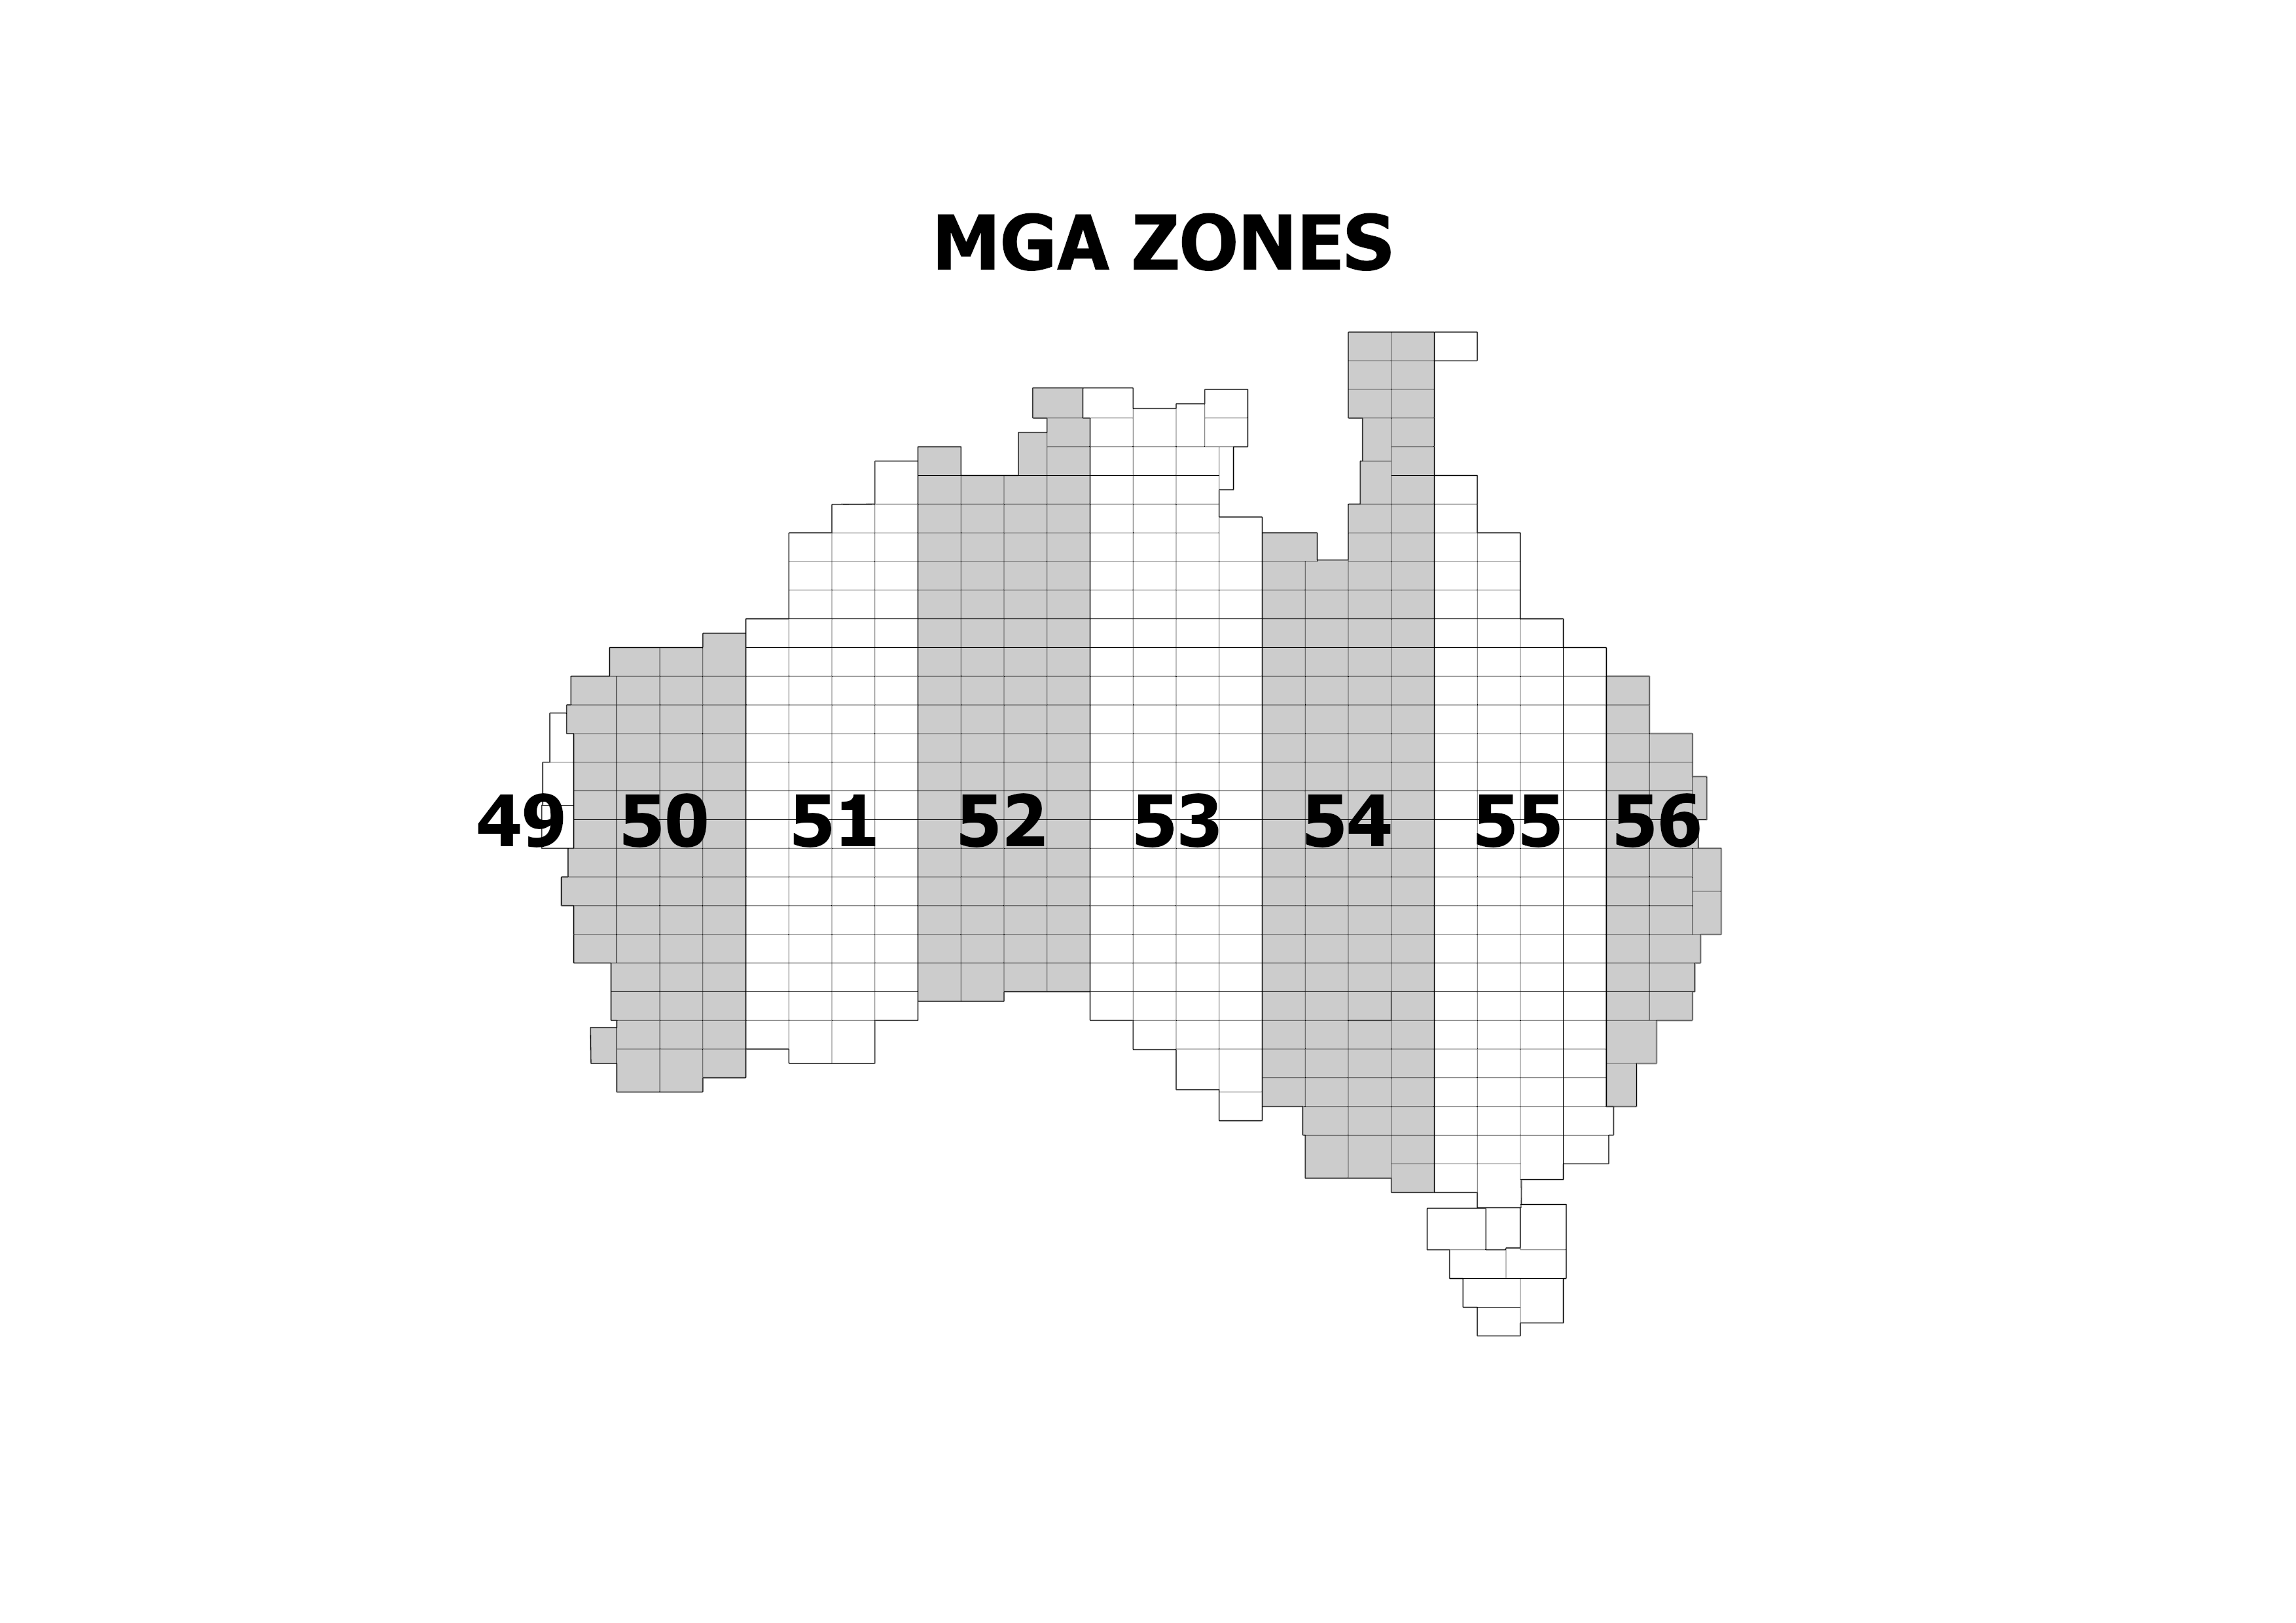
Step 2: Create the map framework
Australia is divided into zones, with each containing a grid of map sheets. Each sheet covers a specific geographic area. The map scale determines how much area each sheet covers. Larger-scale maps show more detail but cover a smaller area, so more sheets are needed to cover the same area.
Cartographers establish the map's coordinate system, so locations can be accurately identified and referenced.
Our AUSTopo 1:250 000 scale map series, for example, uses the Map Grid of Australia (GDA2020), with grid lines shown at 10-kilometre intervals.
Fun fact: Some maps don’t fit the standard map shape and need a ‘special’ layout. This usually occurs along the coastline. Our AUSTopo 1:250 000 Mornington Island Special, for example, is 870 mm long and uses 10 folds.
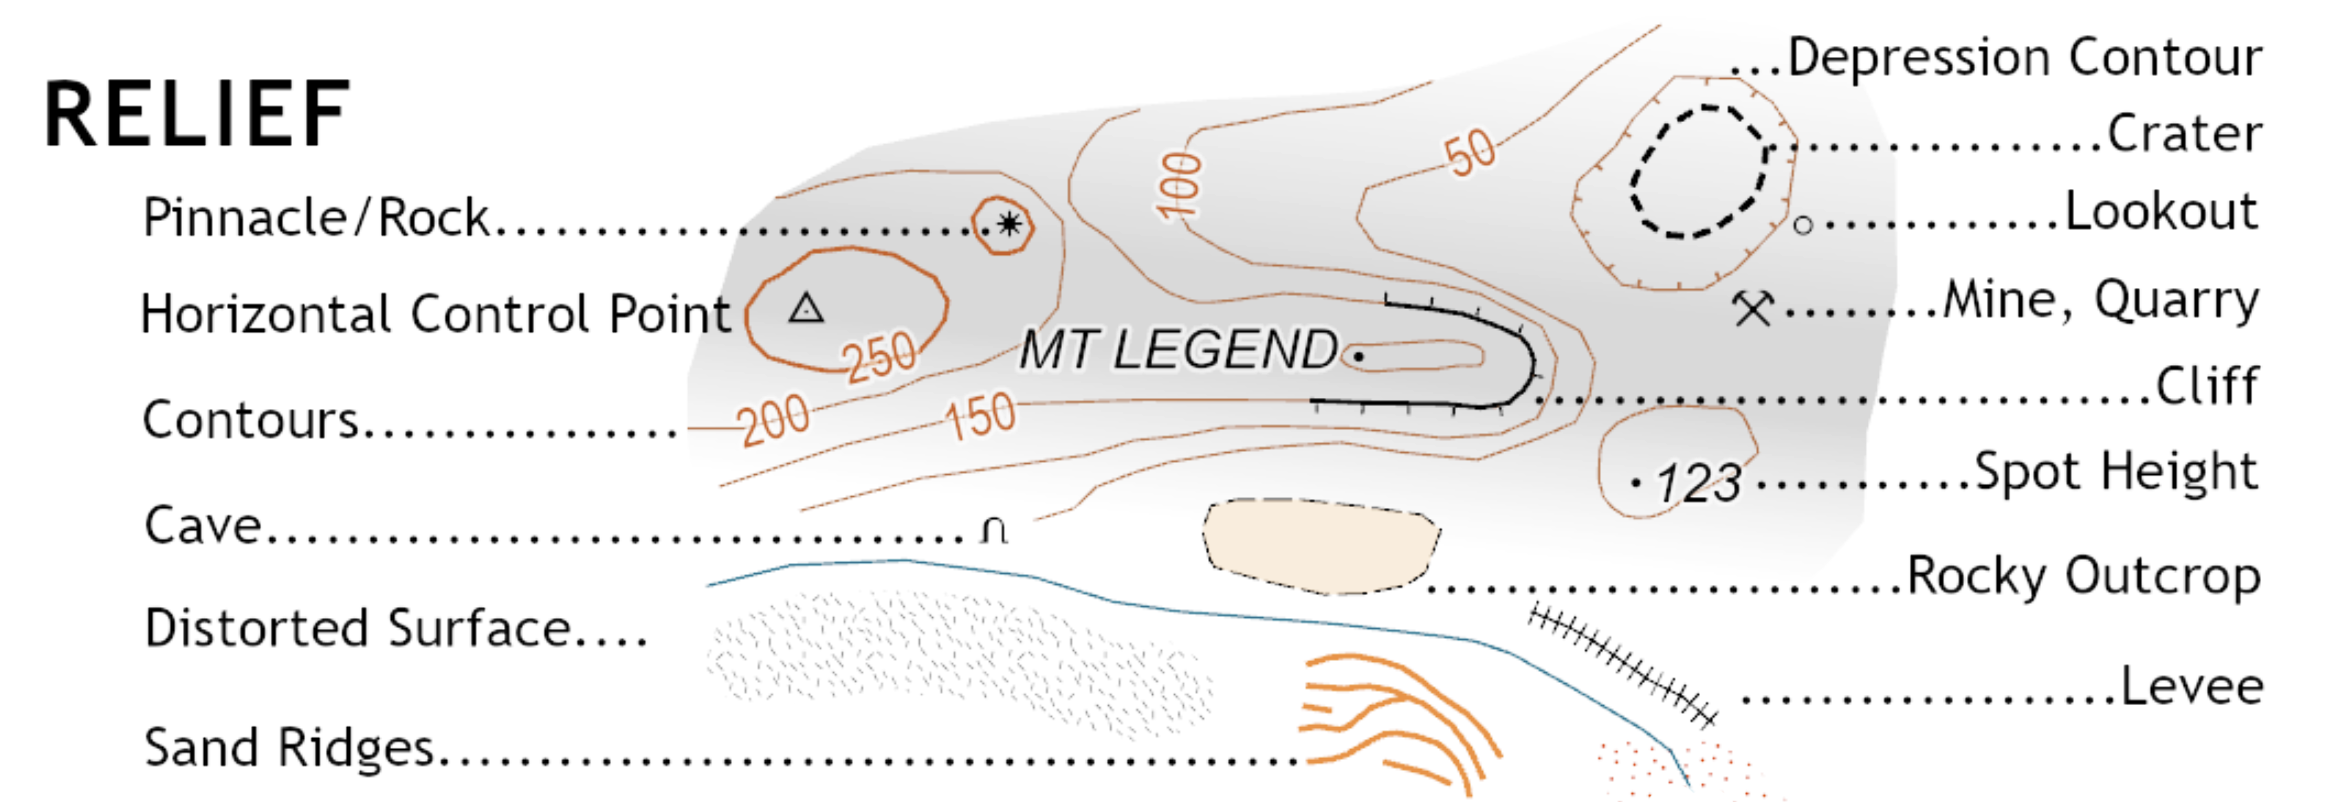
Step 3: Add geographic features and elevation
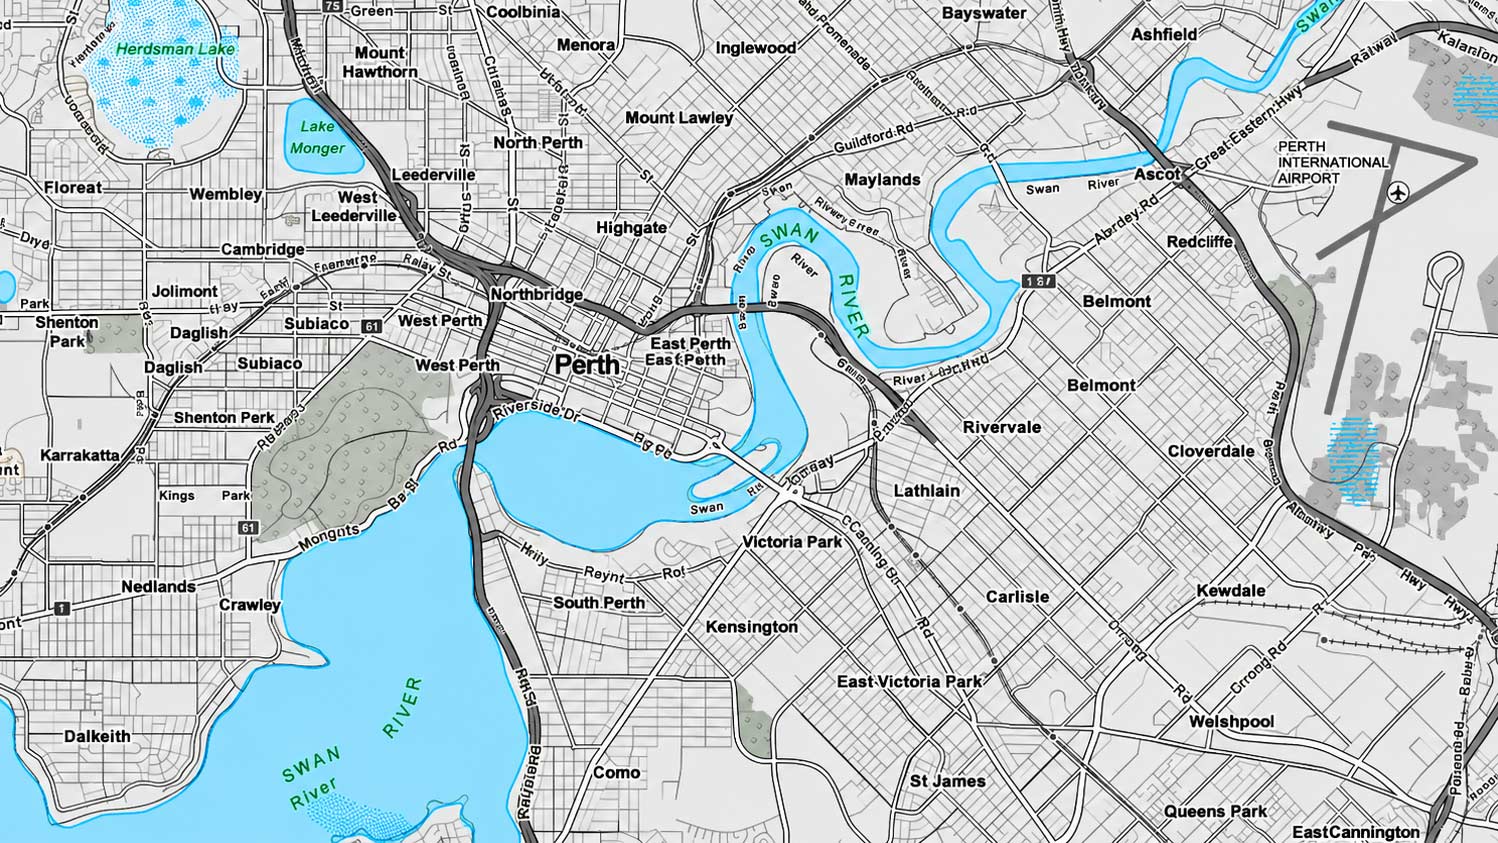
Cartographers build the map by bringing together layers of geographic data for rivers, lakes, roads, railways, buildings, vegetation, protected areas and many other features.
Digital elevation data is used to show the shape of the land. Contour lines connect points of equal height, helping users understand where the land rises, falls and becomes steeper. Hillshade can also be used to give mountains, ridges and valleys a more realistic appearance.
Organising geographic information into separate layers makes it easier to manage, update and combine data from different sources.
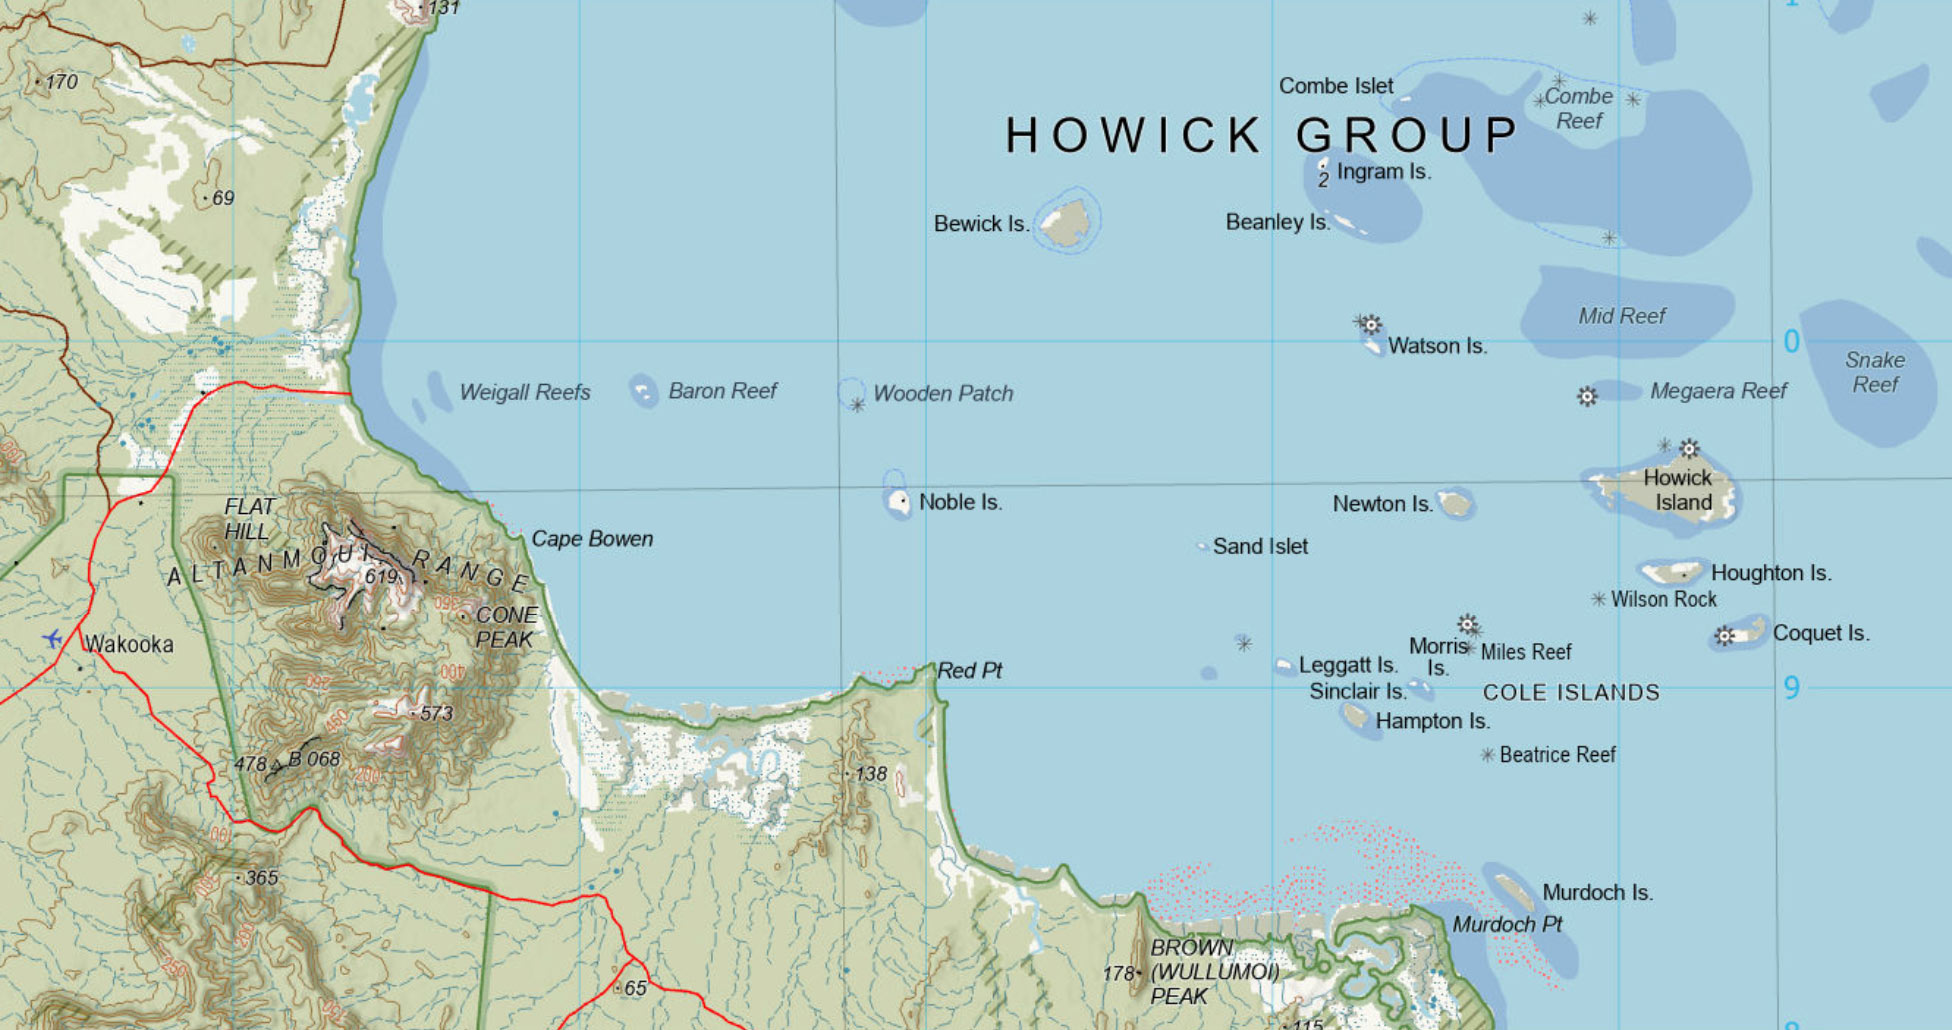
Step 4: Apply colours, symbols and labels
A map containing only raw geographic data would be difficult to read. Cartographers apply consistent colours and symbols so users can quickly recognise different types of information.
Water features, vegetation, terrain, roads and built infrastructure each have their own established styles. Special symbols can identify features such as airports, lighthouses, mines and power infrastructure.
Places, rivers, mountains, roads and other important features are then labelled.
Placing names on a busy map is a surprisingly complex job. The Geoscience Australia cartography team applies a defined set of rules to decide which labels take priority, where they can fit and how they should move or be abbreviated when space is limited.
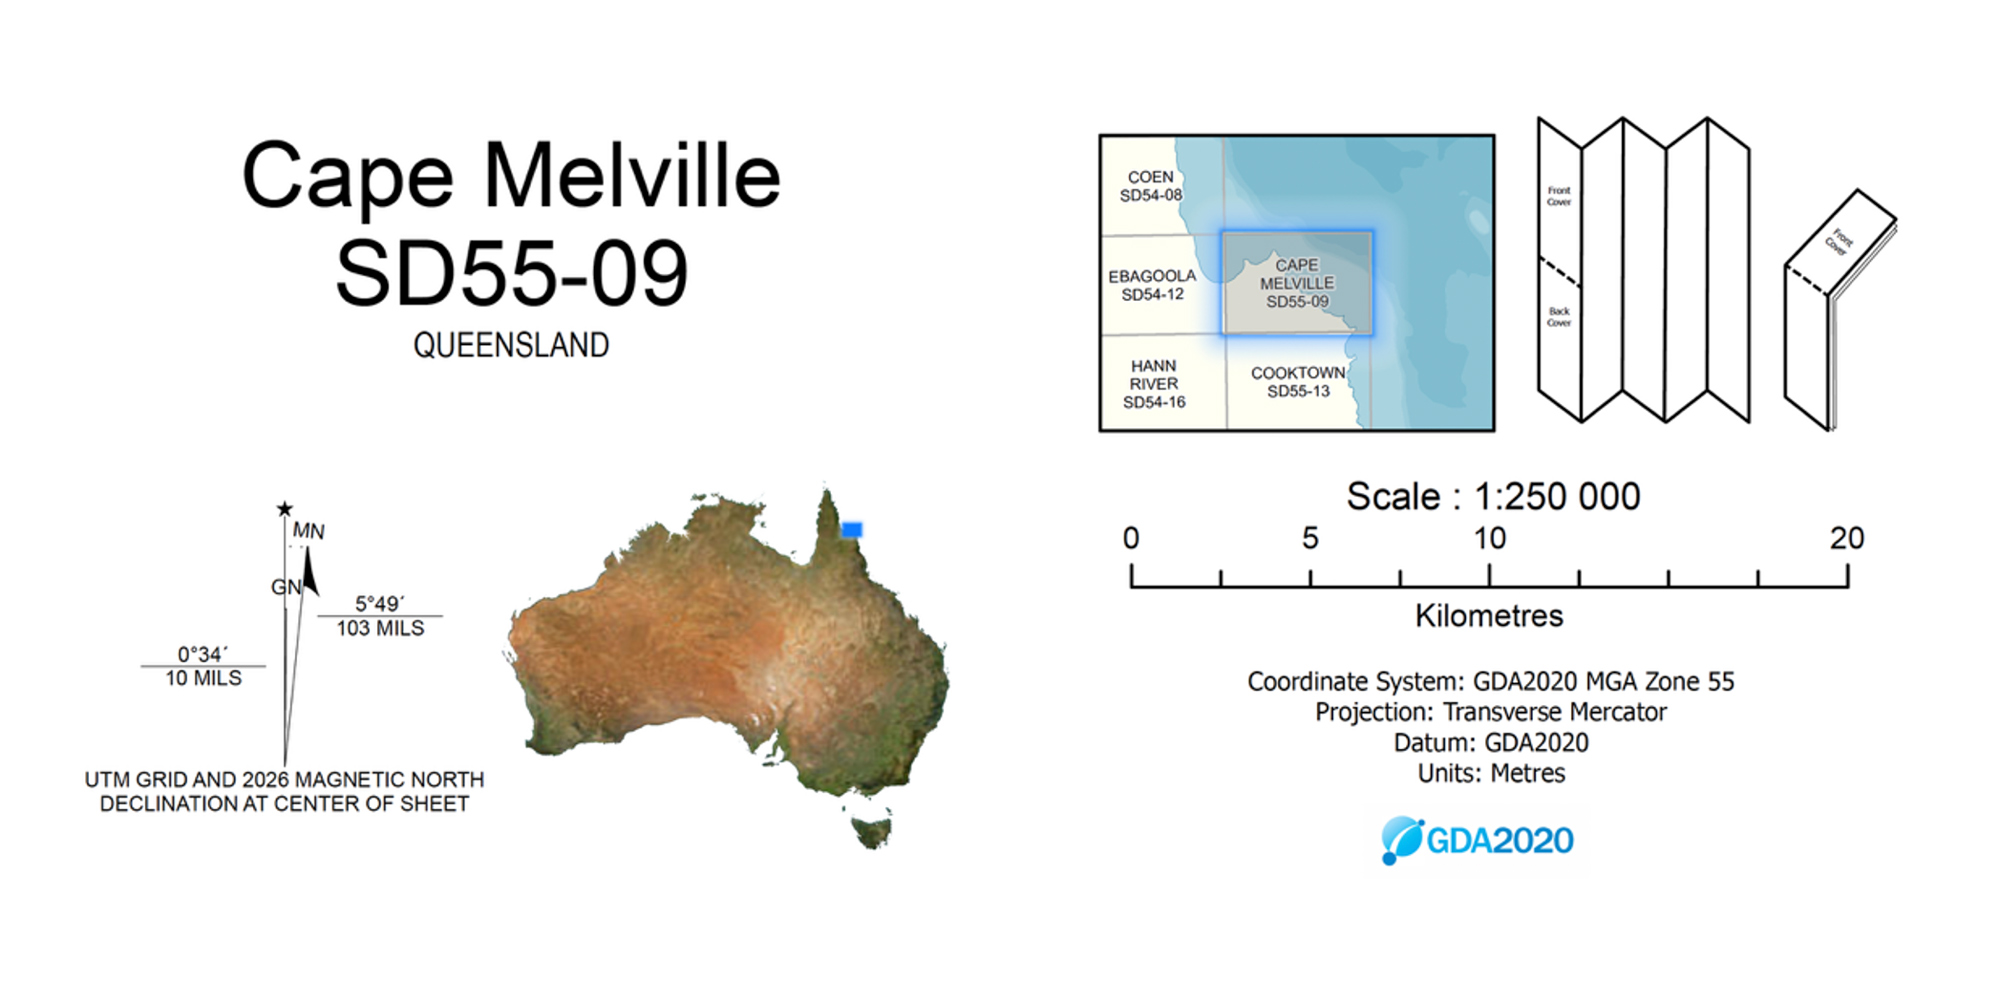
Step 5: Add coordinates and map information
Information on the margins of a map is also carefully designed. A topographic map includes supporting information that helps users locate and interpret features, including:
- Graticule coordinates (latitude and longitude)
- Map Grid of Australia coordinates (eastings and northings)
- Legend and scale
- North arrow and magnetic declination
- Locality diagrams and map references
- QR codes, linking users to map metadata and online resources, including the digital representation of the map on an online dashboard.
Together, these elements turn geographic data into a practical spatial reference tool.
Step 6: Check, publish and update
Before publication, the map undergoes quality checks to ensure the data, symbols, labels and layout meet required standards. Any issues identified during review are corrected before the map is released.
Maps can then be printed, downloaded as digital products or viewed online.
As new and updated geographic information becomes available, topographic maps are updated. This helps maintain the accuracy and relevance that users expect from trusted national mapping. Geoscience Australia's transition from paper to digital mapping has preserved the core value of its topographic maps while making them easier to access and update.
From many datasets to a national map
Creating a topographic map brings together geographic data, technology and cartographic expertise. Data from many sources is organised within a common framework, symbolised, labelled and checked to create a trusted, nationally consistent representation of Australia’s landscape.
This is the value of national foundation geospatial data: information about different places and features can be connected and combined to create a shared picture of Australia that people can understand and use.
About Geoscience Australia
For nearly a century, Geoscience Australia and its predecessors have provided topographic maps to governments, industry and communities. Today, that mapping continues in digital form, making national geographic information easier to access, use and update.
Return to our Topographic Maps Knowledge Hub.
Discover more
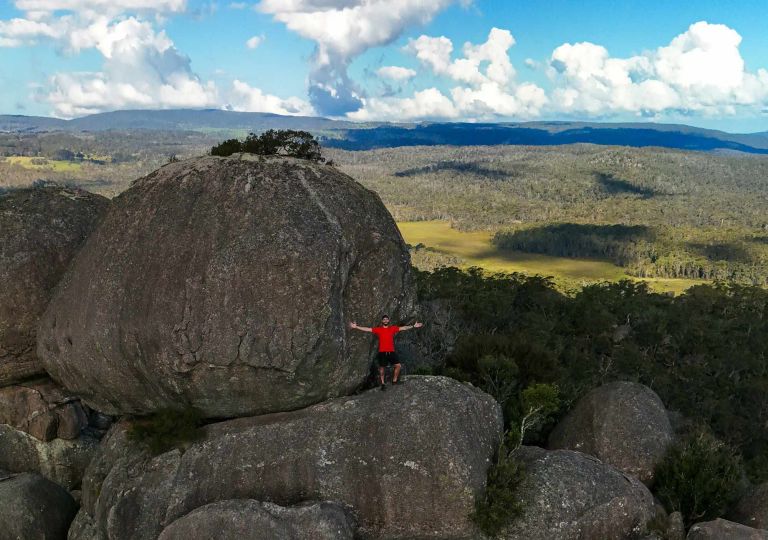
Understand map scale, how it affects detail and area covered, and how to choose the right scale for different uses.
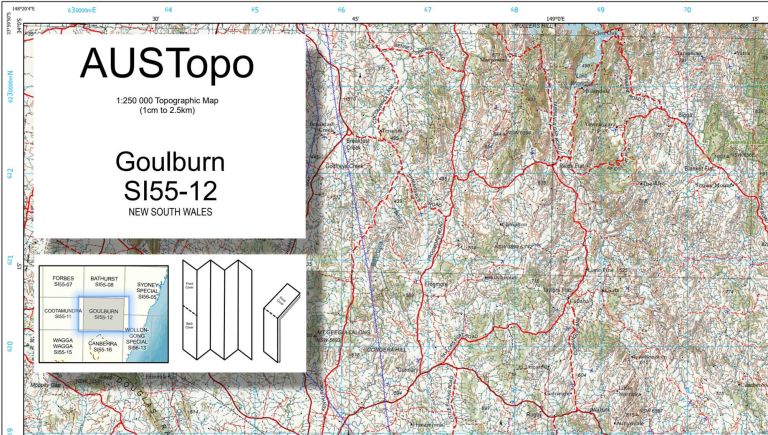
See how Australian topographic maps are numbered and how map sheets fit together across different scales.
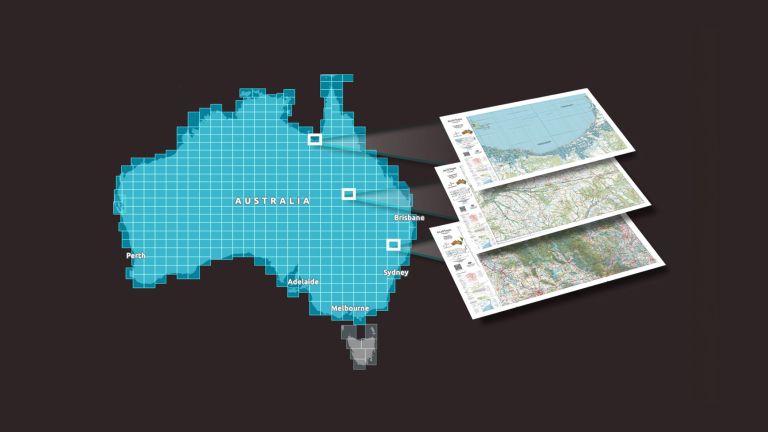
Explore trusted, nationally consistent topographic maps of Australia, including current AUSTopo coverage, historical map series and topographic data.