Seabed maps and insights How much of Australia's seabed has been mapped?
Page last updated:27 August 2026
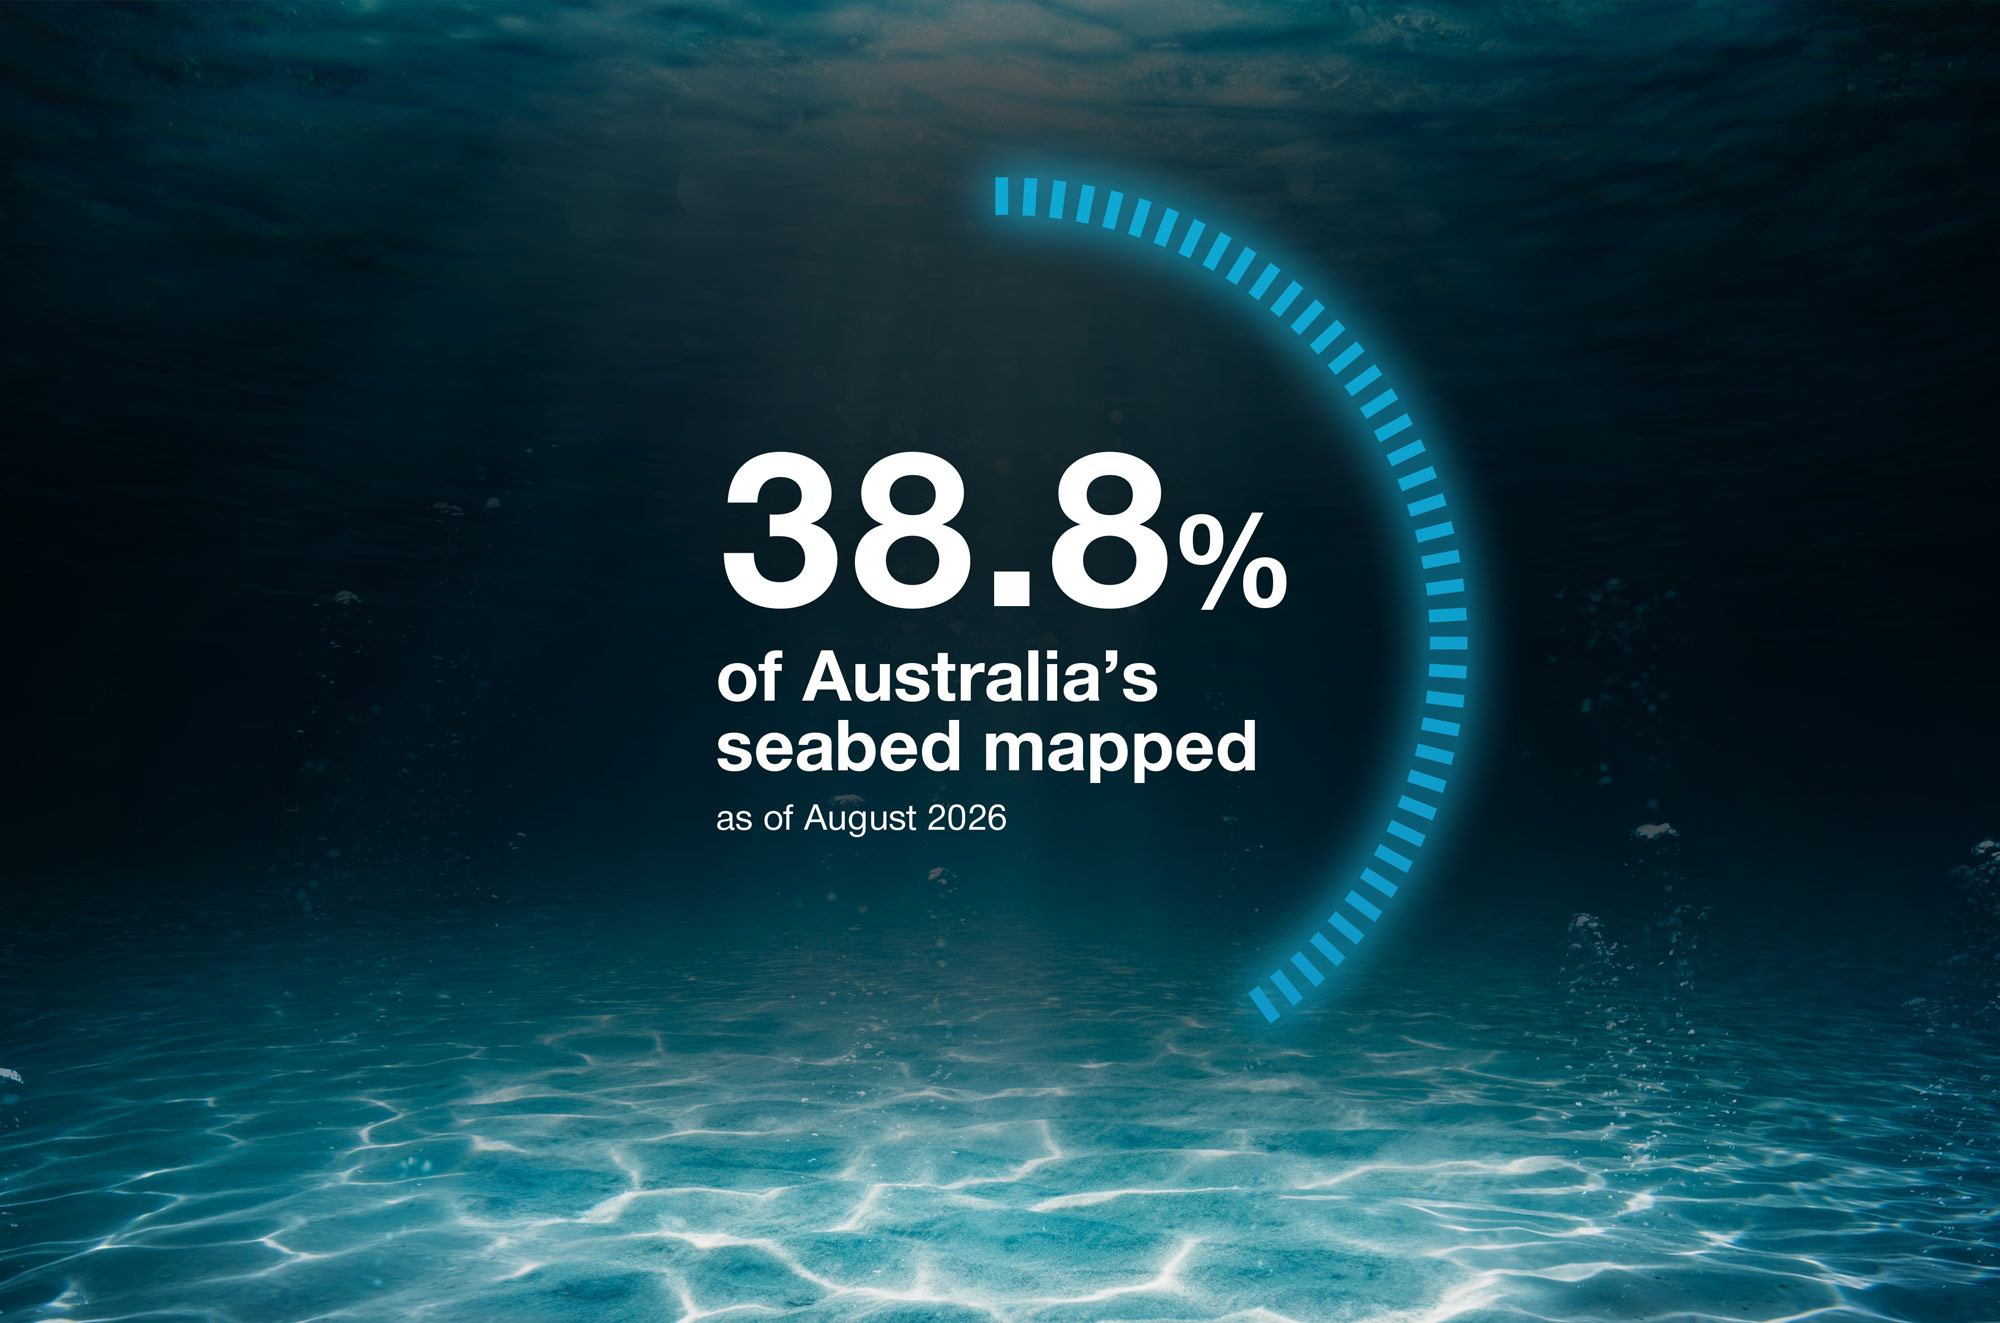
As of August 2026, 38.8% of Australia's maritime jurisdiction has been mapped in sufficient detail to support the sustainable management and use of marine resources.
This progress builds on the last reported figure of 38.5% in June 2025.
Australia manages one of the world’s largest maritime jurisdictions, covering more than 13.86 million square kilometres, including the waters surrounding Australia's external territories and the Australian Antarctic Territory.
Mapping an area this large is a long-term national effort involving governments, research organisations, industry and the broader seabed mapping community.
Every year, new surveys, improved technologies and the digital recovery of historical data help reveal a more complete picture of Australia's seabed.
Why does seabed mapping matter?
The shape of the seabed influences ocean circulation, marine ecosystems and coastal processes. By improving our understanding of these natural systems, seabed mapping supports better decisions about environmental stewardship, coastal resilience, offshore renewable energy and Australia's ocean economy.
Despite more than a century of effort, large areas of Australia's maritime jurisdiction remain mapped at low resolutions — or not at all.
As demands on Australia's marine environment continue to grow, access to reliable seabed information is becoming increasingly important.

What does “mapped” mean?
The percentage reported on this page does not represent all seabed information collected around Australia.Instead, it reflects the proportion of Australia's maritime jurisdiction that has been sufficiently mapped according to defined criteria that acknowledge the need for more detailed seabed data in shallower water — where most of Australia's ocean activities happen.
This method enables mapping progress to be measured consistently over time and ensures the reported percentage reflects how the community uses the information. This approach was developed in consultation with the AusSeabed community.
In shallow waters:
Shallow water areas are considered mapped when sufficient bathymetry data of appropriate quality exists to produce maps at 30 metre resolution. This means the seabed can be represented in 30 × 30 metre squares — providing enough detail to identify many seabed features.
In deeper waters:
Deeper water areas are considered mapped when sufficient bathymetry data of appropriate quality exists to produce maps at approximately 100 metre resolution. At this scale, the seabed is represented in 100 × 100 metre squares, reflecting the challenges of mapping the seabed kilometres below the water’s surface, while still capturing meaningful seabed features.
For these calculations, deep waters are defined as water beyond the continental shelf break — an average of 200 m around mainland Australia and its external territories, and 500 m around Antarctica where the edge of the continental shelf is deeper.
Australia’s seabed interests extend far beyond its maritime boundaries. Outside of its maritime jurisdiction, Australia holds bathymetry data that covers 11.1 million km2 — equivalent to almost 1.5 x the area of Australia's mainland.
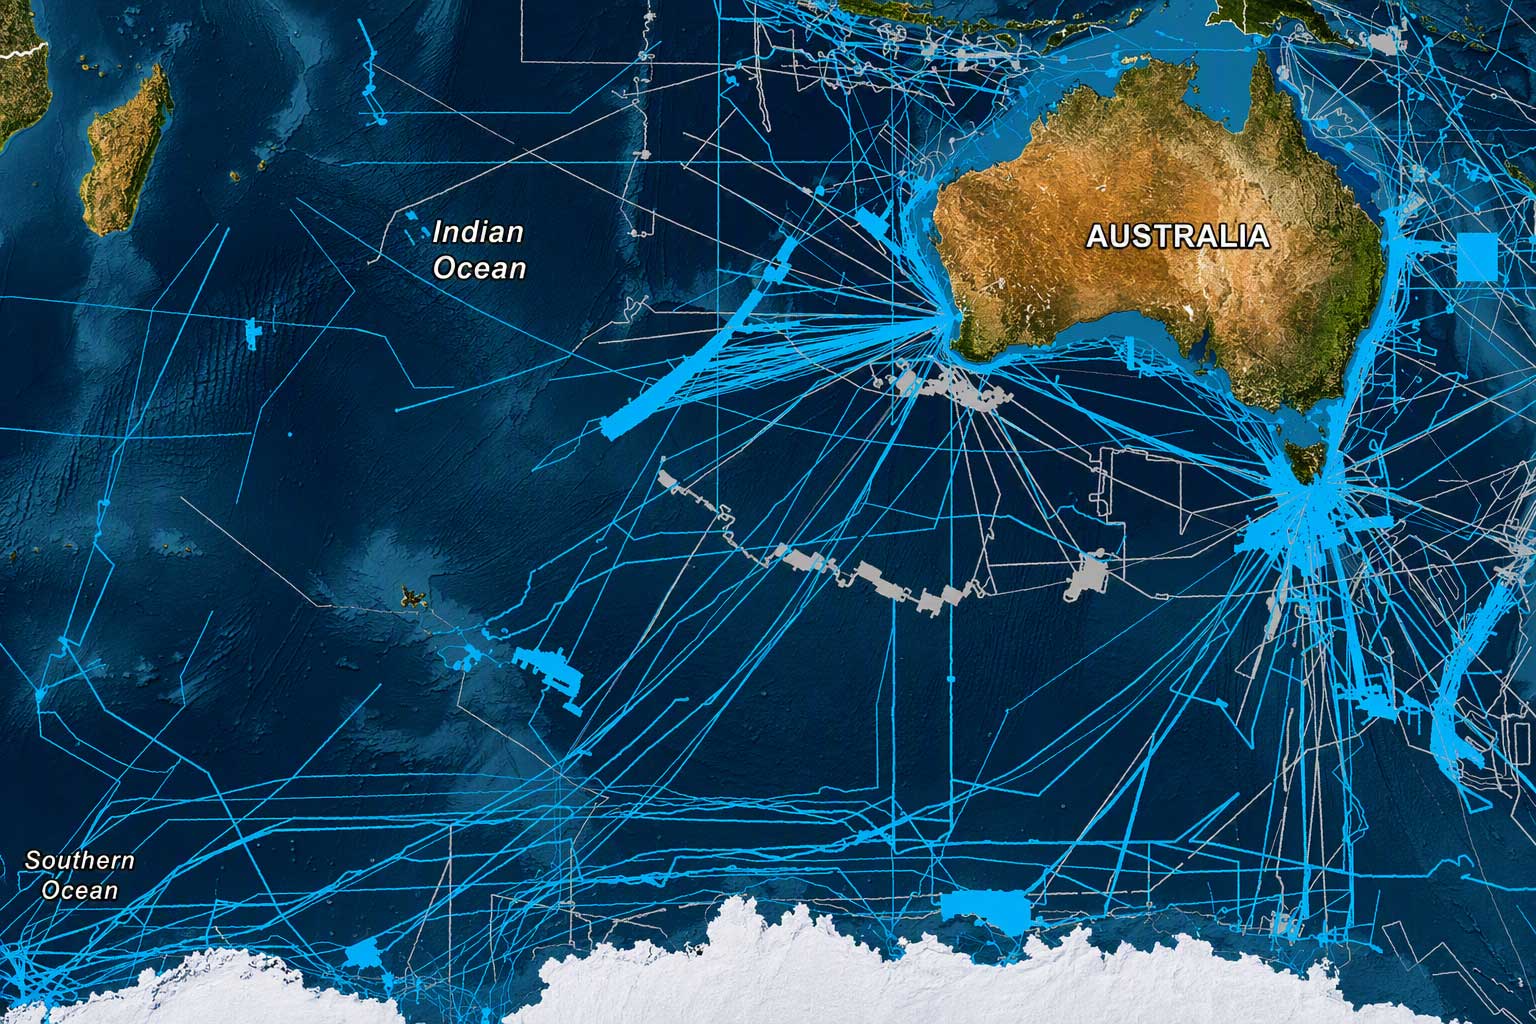
The path to knowledge is paved by many vessels. As research and other vessels travel Australia's waters, the swaths of seabed mapped beneath them combine to reveal an increasingly detailed picture of our underwater landscapes.
Good to know: Mapped is not the same as surveyed
Seabed surveys are conducted for many different purposes, including for research, engineering and navigation. Because different technologies and standards are used according to purpose, not every survey is suitable for creating consistent national seabed maps, or for specialist purposes such as maritime safety.
For most purposes, “sufficiently mapped”, as described on this page, is the appropriate measure.
For maritime safety applications, however, the Australian Hydrographic Office uses the measure of “adequately surveyed”, as defined by the International Hydrographic Organization’s C-55 criteria. 18.2% of Australia’s exclusive economic zone (EEZ), excluding Australia’s internal waters and the Australian Antarctic Territory, meets this definition.
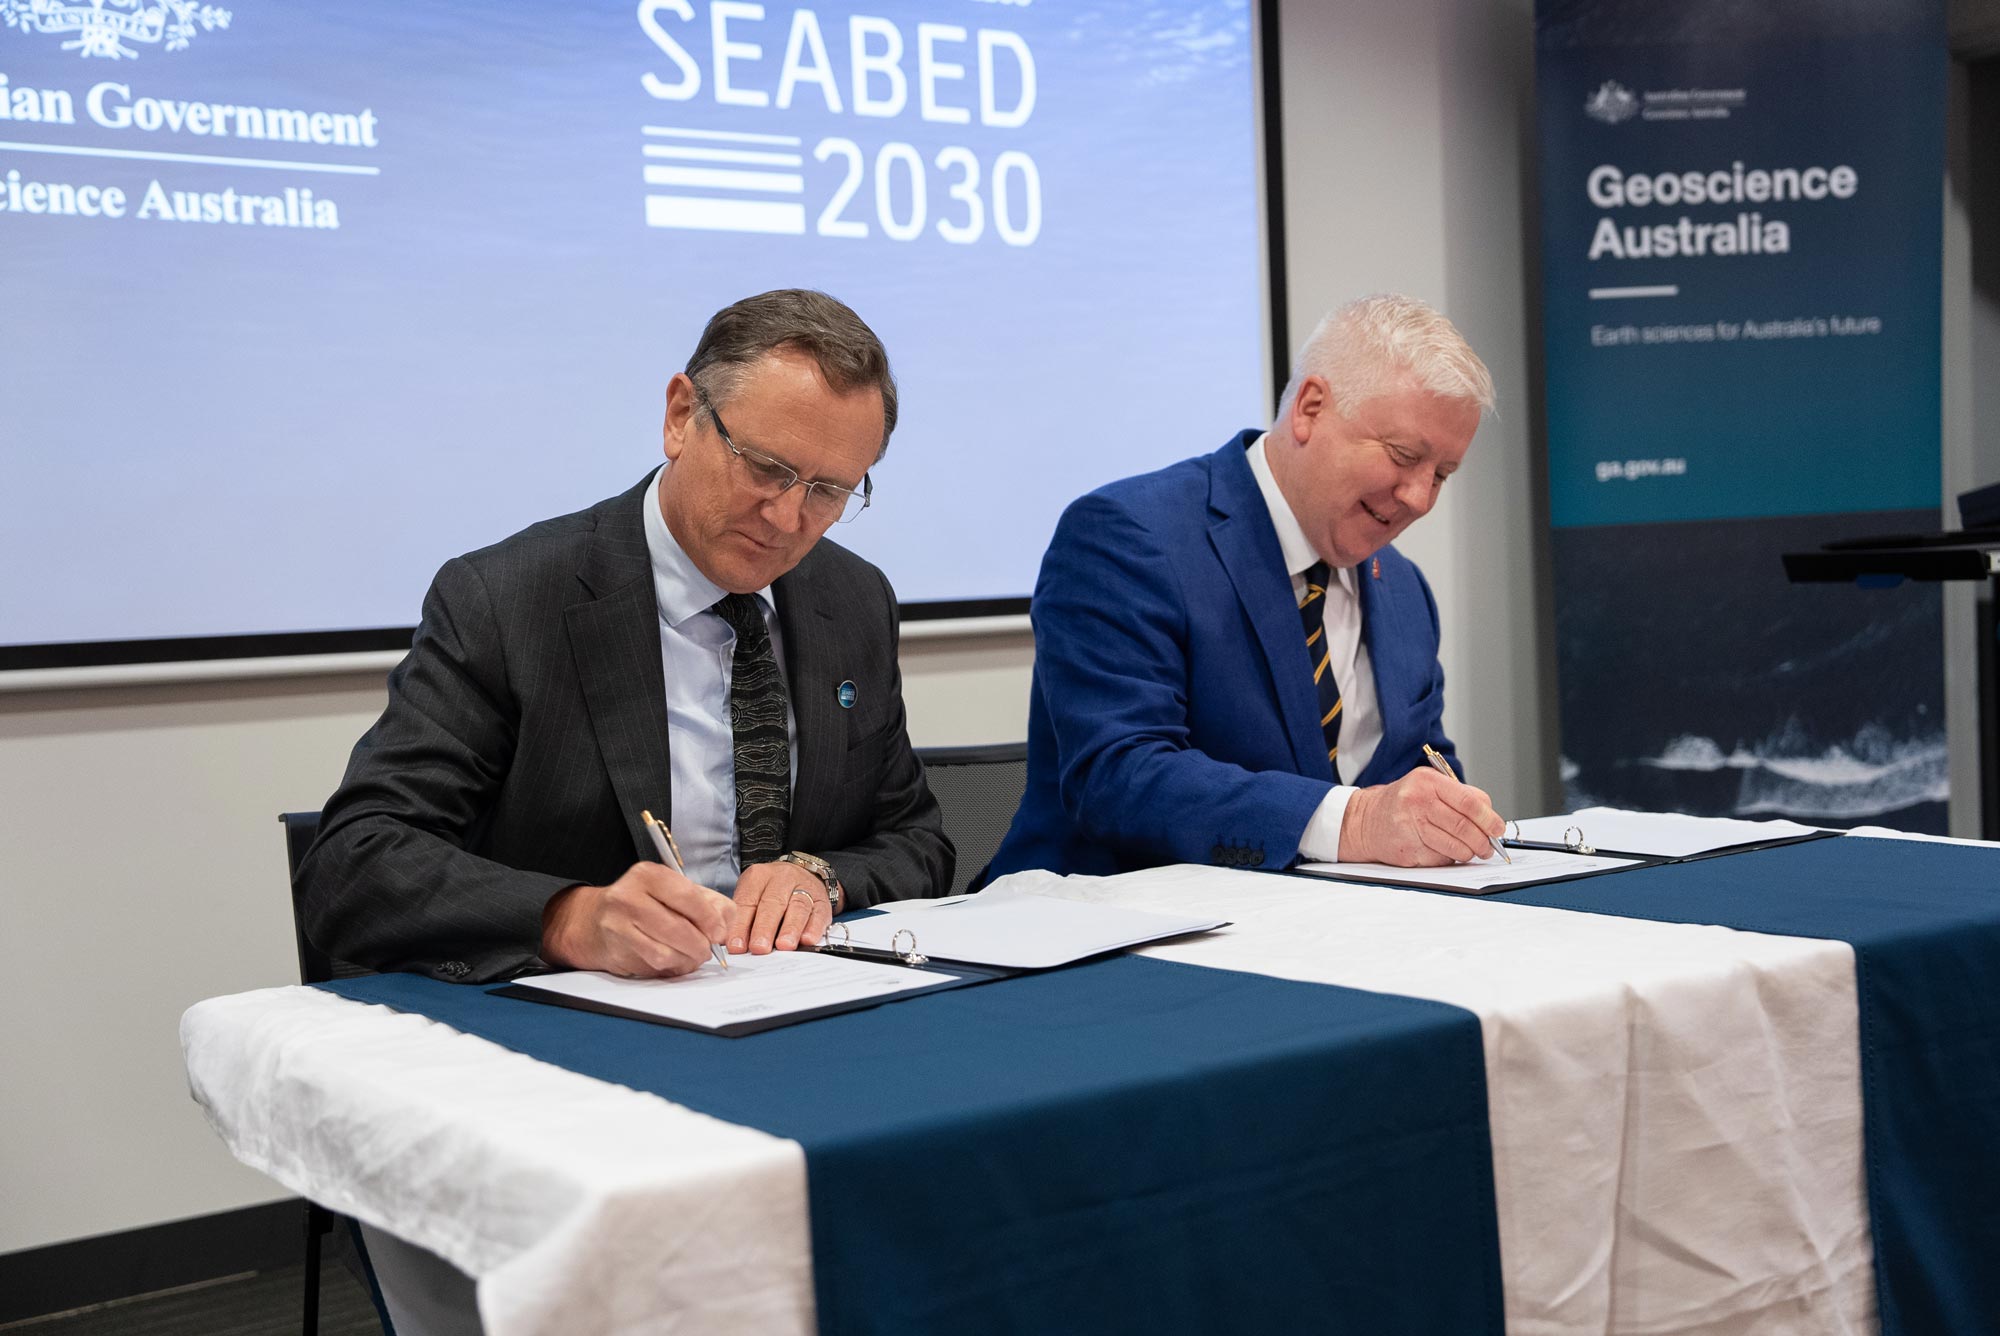
CEO of Geoscience Australia, Dr James Johnson, and Director of Seabed 2030, Jamie McMichael-Phillips, sign the Memorandum of Understanding.
Australia's contribution to global seabed mapping
In addition to providing national value, Australia's collaborative seabed mapping efforts contribute to a global picture of the world's oceans.
On behalf of the AusSeabed initiative, Geoscience Australia supports the Nippon Foundation-GEBCO Seabed 2030 Project and contributes the AusBathyTopo grids to the General Bathymetric Chart of the Oceans (GEBCO), supporting its mission to produce free, open and complete seabed data and information for the world’s oceans.
Get the extra detail
Seabed mapping progress by region and resolution
Australia's seabed has been mapped to varying resolutions across our maritime jurisdiction, reflecting the different purposes for which data has been collected over time.
The AusSeabed community has developed an approach to tracking these variables in seabed mapping progress — by region and resolution:
| Region | Sufficiently Mapped | Mapped (all depths) | ||
|---|---|---|---|---|
| 10 m | 30 m | 100 m* | ||
| All Australian waters | 38.8% | 4.28% | 9.77% | 40.59% |
| Coastal waters | 47.8% | 46.63% | 47.66% | 60.36% |
| Mainland waters | 46.8% | 5.10% | 11.89% | 49.39% |
| External territories (excl AAT) | 29.9% | 0.52% | 5.32% | 29.87% |
| Australian Antarctic Territory (AAT) | 25.0% | 0.02% | 3.11% | 25.01% |
*NB – this column may have higher values than the Sufficiently Mapped measure, as it includes low resolution data in shallow waters.
Related resources
What is Australia's maritime jurisdiction?
Australia's maritime jurisdiction defines where the nation may exercise specific rights, responsibilities and obligations at sea under international and Australian law.
What is bathymetry?
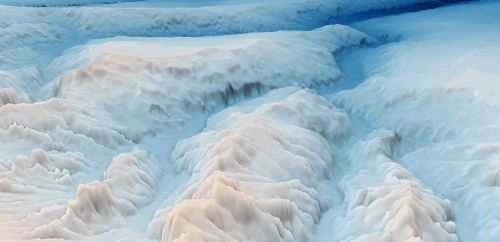
Discover how bathymetry data is collected and why it provides the foundation for navigation, marine planning, hazard assessment and ocean science.
Seabed maps and insights
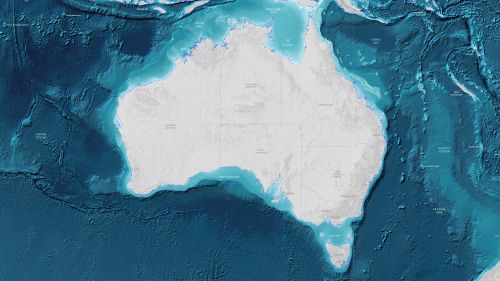
Understanding Australia's seabed is critical for managing our environment, economy and national security. Explore maps, data and scientific insights about Australia's marine environment.